Cities with the Most Immigrants from Brazil in South Carolina
RELATED REPORTS & OPTIONS
Brazil
South Carolina
Compare Cities
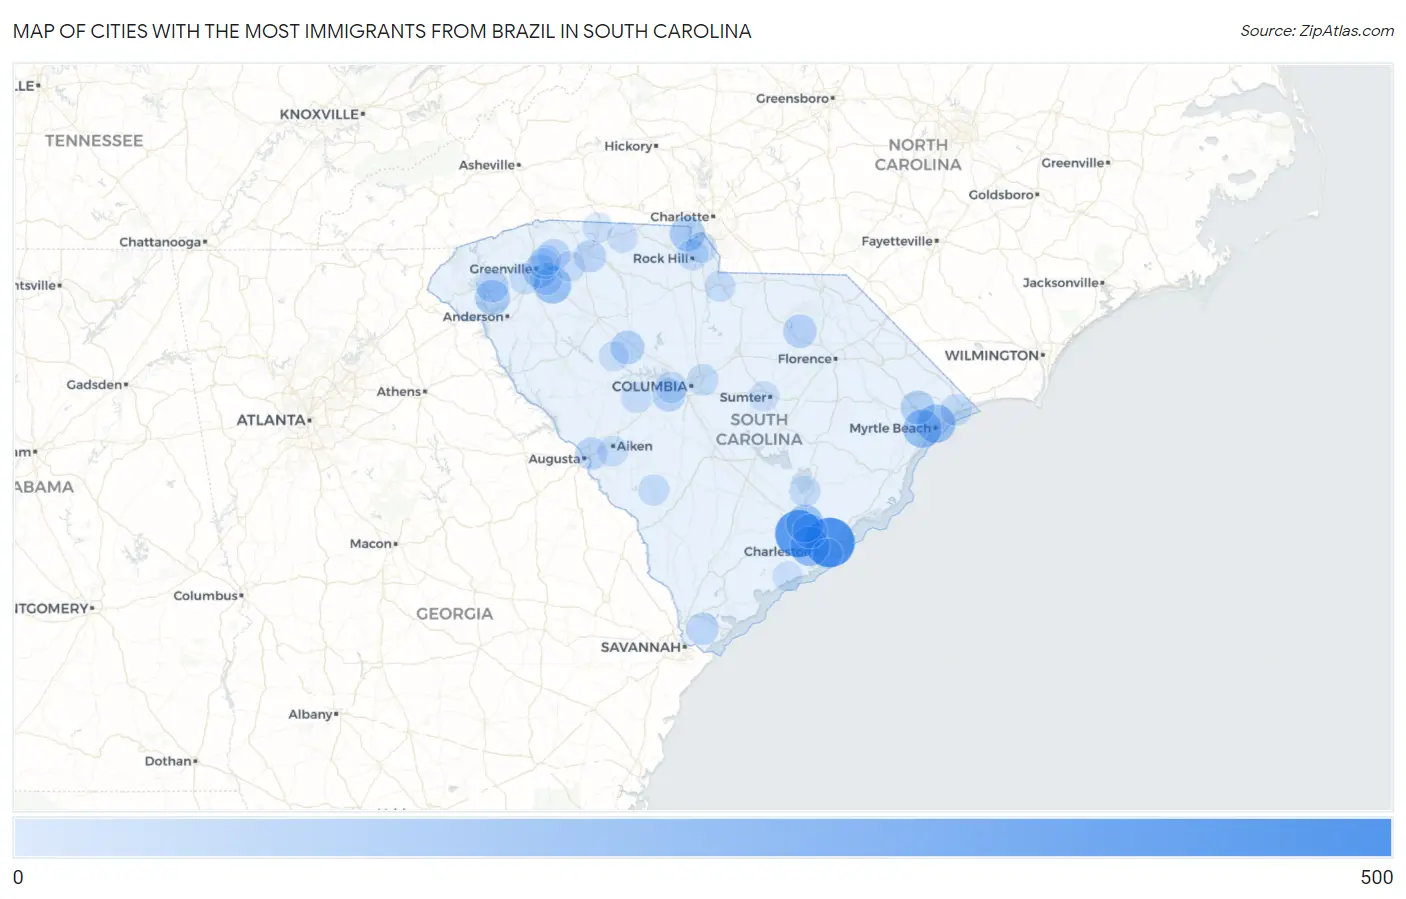
Map of Cities with the Most Immigrants from Brazil in South Carolina
0
500
Cities with the Most Immigrants from Brazil in South Carolina
| City | Brazil | vs State | vs National | |
| 1. | Mount Pleasant | 423 | 5,344(7.92%)#1 | 552,373(0.08%)#189 |
| 2. | North Charleston | 372 | 5,344(6.96%)#2 | 552,373(0.07%)#216 |
| 3. | Charleston | 199 | 5,344(3.72%)#3 | 552,373(0.04%)#396 |
| 4. | Myrtle Beach | 172 | 5,344(3.22%)#4 | 552,373(0.03%)#442 |
| 5. | Socastee | 171 | 5,344(3.20%)#5 | 552,373(0.03%)#444 |
| 6. | Goose Creek | 158 | 5,344(2.96%)#6 | 552,373(0.03%)#471 |
| 7. | Simpsonville | 153 | 5,344(2.86%)#7 | 552,373(0.03%)#484 |
| 8. | Lake Wylie | 107 | 5,344(2.00%)#8 | 552,373(0.02%)#674 |
| 9. | Pendleton | 101 | 5,344(1.89%)#9 | 552,373(0.02%)#700 |
| 10. | Carolina Forest | 93 | 5,344(1.74%)#10 | 552,373(0.02%)#749 |
| 11. | Hanahan | 91 | 5,344(1.70%)#11 | 552,373(0.02%)#762 |
| 12. | Conway | 78 | 5,344(1.46%)#12 | 552,373(0.01%)#844 |
| 13. | Newberry | 77 | 5,344(1.44%)#13 | 552,373(0.01%)#860 |
| 14. | North Hartsville | 71 | 5,344(1.33%)#14 | 552,373(0.01%)#918 |
| 15. | Greenville | 70 | 5,344(1.31%)#15 | 552,373(0.01%)#921 |
| 16. | Red Bank | 62 | 5,344(1.16%)#16 | 552,373(0.01%)#1,010 |
| 17. | Central | 53 | 5,344(0.99%)#17 | 552,373(0.01%)#1,137 |
| 18. | Clearwater | 49 | 5,344(0.92%)#18 | 552,373(0.01%)#1,193 |
| 19. | Spartanburg | 47 | 5,344(0.88%)#19 | 552,373(0.01%)#1,212 |
| 20. | Bluffton | 46 | 5,344(0.86%)#20 | 552,373(0.01%)#1,232 |
| 21. | Mauldin | 46 | 5,344(0.86%)#21 | 552,373(0.01%)#1,233 |
| 22. | Greer | 42 | 5,344(0.79%)#22 | 552,373(0.01%)#1,301 |
| 23. | North Myrtle Beach | 30 | 5,344(0.56%)#23 | 552,373(0.01%)#1,616 |
| 24. | Columbia | 29 | 5,344(0.54%)#24 | 552,373(0.01%)#1,630 |
| 25. | Lexington | 29 | 5,344(0.54%)#25 | 552,373(0.01%)#1,638 |
| 26. | Conestee | 27 | 5,344(0.51%)#26 | 552,373(0.00%)#1,733 |
| 27. | Rock Hill | 23 | 5,344(0.43%)#27 | 552,373(0.00%)#1,853 |
| 28. | Powdersville | 22 | 5,344(0.41%)#28 | 552,373(0.00%)#1,927 |
| 29. | Pinopolis | 22 | 5,344(0.41%)#29 | 552,373(0.00%)#1,948 |
| 30. | Fort Mill | 20 | 5,344(0.37%)#30 | 552,373(0.00%)#2,012 |
| 31. | Lancaster | 20 | 5,344(0.37%)#31 | 552,373(0.00%)#2,029 |
| 32. | Barnwell | 20 | 5,344(0.37%)#32 | 552,373(0.00%)#2,041 |
| 33. | Wade Hampton | 19 | 5,344(0.36%)#33 | 552,373(0.00%)#2,066 |
| 34. | Batesburg Leesville | 16 | 5,344(0.30%)#34 | 552,373(0.00%)#2,251 |
| 35. | Aiken | 14 | 5,344(0.26%)#35 | 552,373(0.00%)#2,361 |
| 36. | Taylors | 13 | 5,344(0.24%)#36 | 552,373(0.00%)#2,439 |
| 37. | Gaffney | 10 | 5,344(0.19%)#37 | 552,373(0.00%)#2,693 |
| 38. | Clemson University | 10 | 5,344(0.19%)#38 | 552,373(0.00%)#2,715 |
| 39. | Reidville | 9 | 5,344(0.17%)#39 | 552,373(0.00%)#2,836 |
| 40. | Sumter | 6 | 5,344(0.11%)#40 | 552,373(0.00%)#3,030 |
| 41. | Sullivan S Island | 5 | 5,344(0.09%)#41 | 552,373(0.00%)#3,153 |
| 42. | Silverstreet | 4 | 5,344(0.07%)#42 | 552,373(0.00%)#3,276 |
| 43. | Chesnee | 2 | 5,344(0.04%)#43 | 552,373(0.00%)#3,417 |
| 44. | Rockville | 2 | 5,344(0.04%)#44 | 552,373(0.00%)#3,442 |
Common Questions
What are the Top 10 Cities with the Most Immigrants from Brazil in South Carolina?
Top 10 Cities with the Most Immigrants from Brazil in South Carolina are:
#1
423
#2
372
#3
199
#4
172
#5
171
#6
158
#7
153
#8
107
#9
101
#10
91
What city has the Most Immigrants from Brazil in South Carolina?
Mount Pleasant has the Most Immigrants from Brazil in South Carolina with 423.
What is the Total Immigrants from Brazil in the State of South Carolina?
Total Immigrants from Brazil in South Carolina is 5,344.
What is the Total Immigrants from Brazil in the United States?
Total Immigrants from Brazil in the United States is 552,373.