Johnston, SC Map & Demographics
Johnston Map
Johnston Overview
$21,618
PER CAPITA INCOME
$50,972
AVG FAMILY INCOME
$31,910
AVG HOUSEHOLD INCOME
45.6%
WAGE / INCOME GAP [ % ]
54.4¢/ $1
WAGE / INCOME GAP [ $ ]
$9,325
FAMILY INCOME DEFICIT
0.45
INEQUALITY / GINI INDEX
2,375
TOTAL POPULATION
1,060
MALE POPULATION
1,315
FEMALE POPULATION
80.61
MALES / 100 FEMALES
124.06
FEMALES / 100 MALES
48.3
MEDIAN AGE
3.0
AVG FAMILY SIZE
2.2
AVG HOUSEHOLD SIZE
1,021
LABOR FORCE [ PEOPLE ]
50.8%
PERCENT IN LABOR FORCE
6.6%
UNEMPLOYMENT RATE
Johnston Zip Codes
Johnston Area Codes
Income in Johnston
Income Overview in Johnston
Per Capita Income in Johnston is $21,618, while median incomes of families and households are $50,972 and $31,910 respectively.
| Characteristic | Number | Measure |
| Per Capita Income | 2,375 | $21,618 |
| Median Family Income | 607 | $50,972 |
| Mean Family Income | 607 | $55,864 |
| Median Household Income | 1,095 | $31,910 |
| Mean Household Income | 1,095 | $43,031 |
| Income Deficit | 607 | $9,325 |
| Wage / Income Gap (%) | 2,375 | 45.64% |
| Wage / Income Gap ($) | 2,375 | 54.36¢ per $1 |
| Gini / Inequality Index | 2,375 | 0.45 |
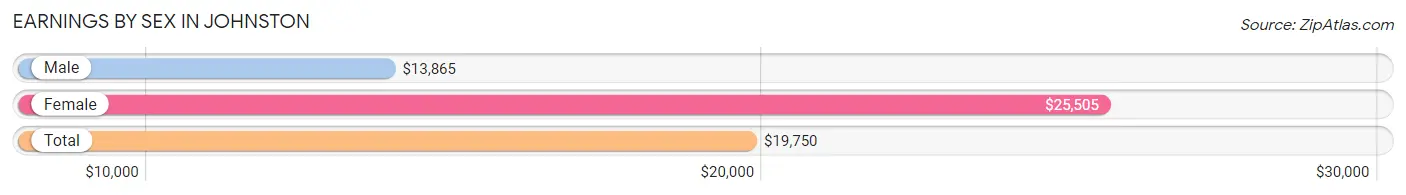
Earnings by Sex in Johnston
Average Earnings in Johnston are $19,750, $13,865 for men and $25,505 for women, a difference of 45.6%.
| Sex | Number | Average Earnings |
| Male | 457 (43.0%) | $13,865 |
| Female | 605 (57.0%) | $25,505 |
| Total | 1,062 (100.0%) | $19,750 |
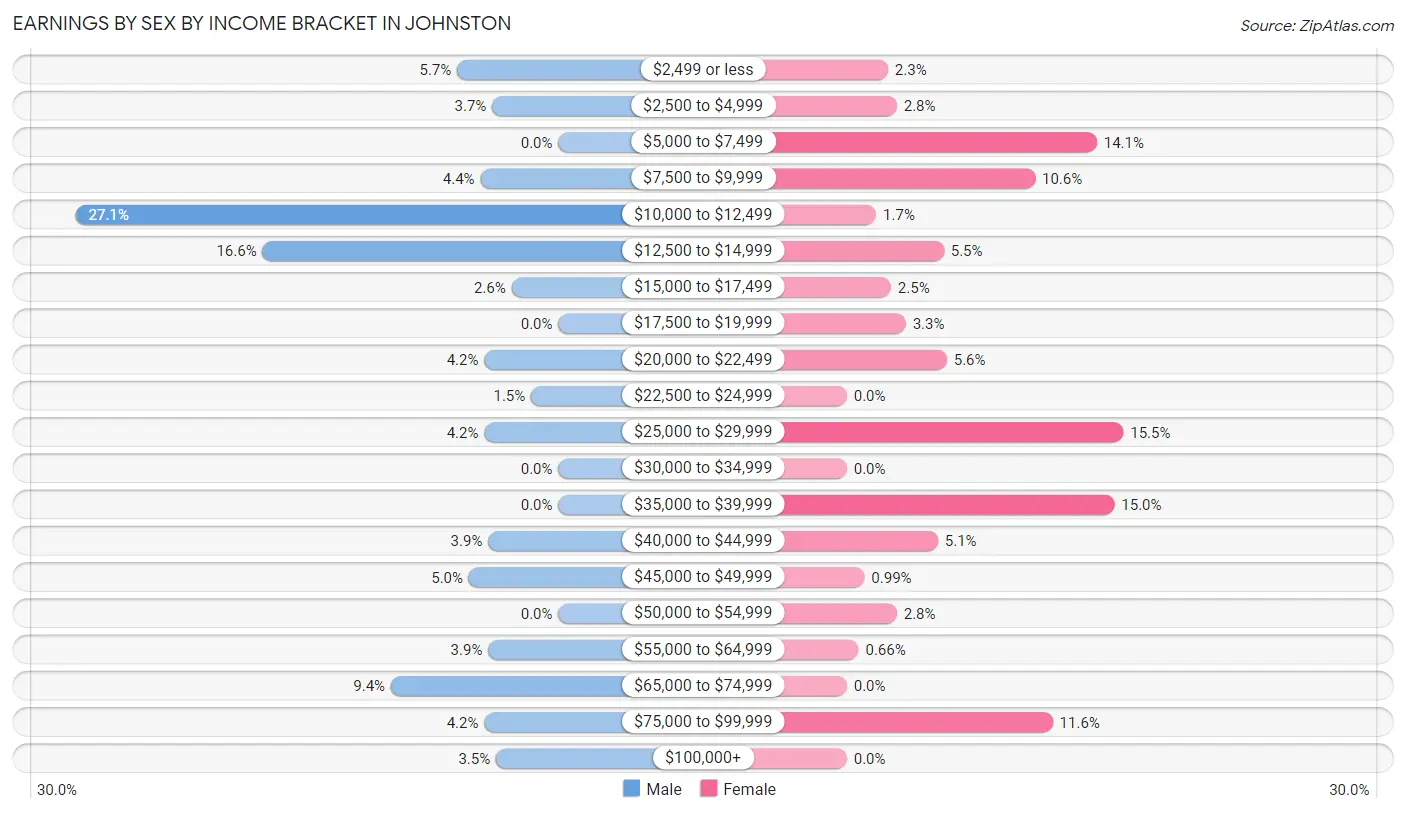
Earnings by Sex by Income Bracket in Johnston
The most common earnings brackets in Johnston are $10,000 to $12,499 for men (124 | 27.1%) and $25,000 to $29,999 for women (94 | 15.5%).
| Income | Male | Female |
| $2,499 or less | 26 (5.7%) | 14 (2.3%) |
| $2,500 to $4,999 | 17 (3.7%) | 17 (2.8%) |
| $5,000 to $7,499 | 0 (0.0%) | 85 (14.1%) |
| $7,500 to $9,999 | 20 (4.4%) | 64 (10.6%) |
| $10,000 to $12,499 | 124 (27.1%) | 10 (1.7%) |
| $12,500 to $14,999 | 76 (16.6%) | 33 (5.4%) |
| $15,000 to $17,499 | 12 (2.6%) | 15 (2.5%) |
| $17,500 to $19,999 | 0 (0.0%) | 20 (3.3%) |
| $20,000 to $22,499 | 19 (4.2%) | 34 (5.6%) |
| $22,500 to $24,999 | 7 (1.5%) | 0 (0.0%) |
| $25,000 to $29,999 | 19 (4.2%) | 94 (15.5%) |
| $30,000 to $34,999 | 0 (0.0%) | 0 (0.0%) |
| $35,000 to $39,999 | 0 (0.0%) | 91 (15.0%) |
| $40,000 to $44,999 | 18 (3.9%) | 31 (5.1%) |
| $45,000 to $49,999 | 23 (5.0%) | 6 (1.0%) |
| $50,000 to $54,999 | 0 (0.0%) | 17 (2.8%) |
| $55,000 to $64,999 | 18 (3.9%) | 4 (0.7%) |
| $65,000 to $74,999 | 43 (9.4%) | 0 (0.0%) |
| $75,000 to $99,999 | 19 (4.2%) | 70 (11.6%) |
| $100,000+ | 16 (3.5%) | 0 (0.0%) |
| Total | 457 (100.0%) | 605 (100.0%) |
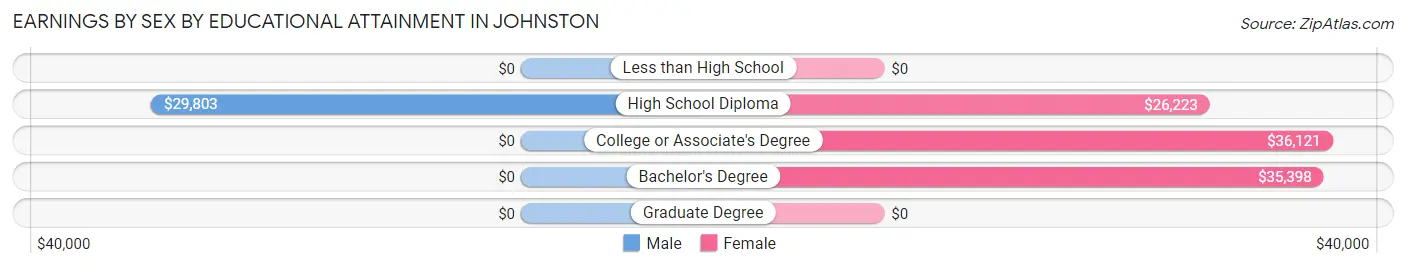
Earnings by Sex by Educational Attainment in Johnston
| Educational Attainment | Male Income | Female Income |
| Less than High School | - | - |
| High School Diploma | $29,803 | $26,223 |
| College or Associate's Degree | - | - |
| Bachelor's Degree | - | - |
| Graduate Degree | - | - |
| Total | - | - |
Family Income in Johnston
Family Income Brackets in Johnston
According to the Johnston family income data, there are 133 families falling into the $75,000 to $99,999 income range, which is the most common income bracket and makes up 21.9% of all families. Conversely, the $200,000+ income bracket is the least frequent group with only 4 families (0.7%) belonging to this category.
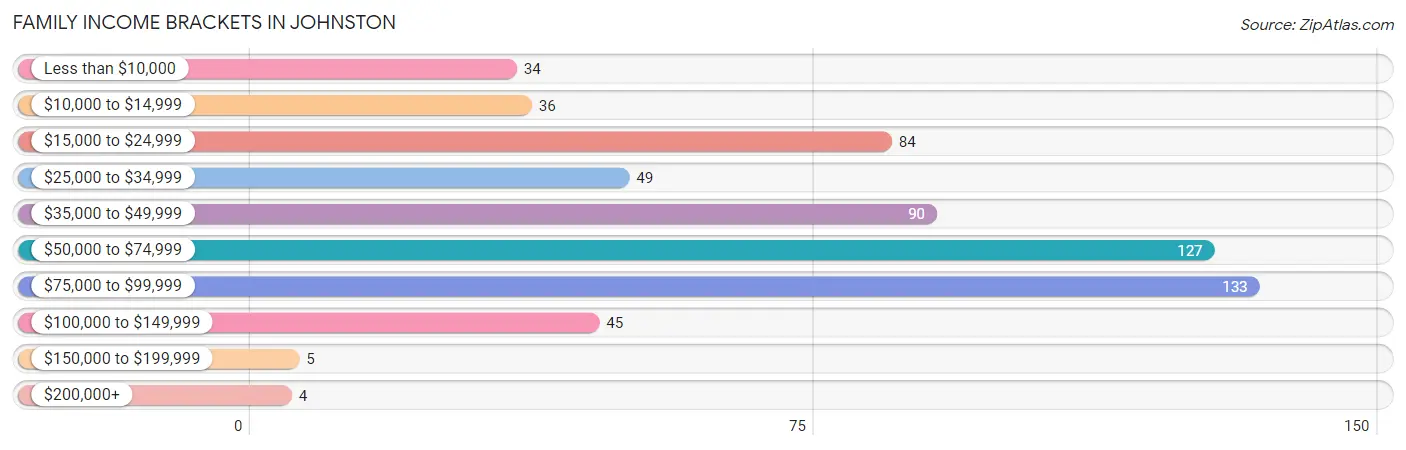
| Income Bracket | # Families | % Families |
| Less than $10,000 | 34 | 5.6% |
| $10,000 to $14,999 | 36 | 5.9% |
| $15,000 to $24,999 | 84 | 13.8% |
| $25,000 to $34,999 | 49 | 8.1% |
| $35,000 to $49,999 | 90 | 14.8% |
| $50,000 to $74,999 | 127 | 20.9% |
| $75,000 to $99,999 | 133 | 21.9% |
| $100,000 to $149,999 | 45 | 7.4% |
| $150,000 to $199,999 | 5 | 0.8% |
| $200,000+ | 4 | 0.7% |
Family Income by Famaliy Size in Johnston
4-person families (85 | 14.0%) account for the highest median family income in Johnston with $95,575 per family, while 4-person families (85 | 14.0%) have the highest median income of $23,894 per family member.
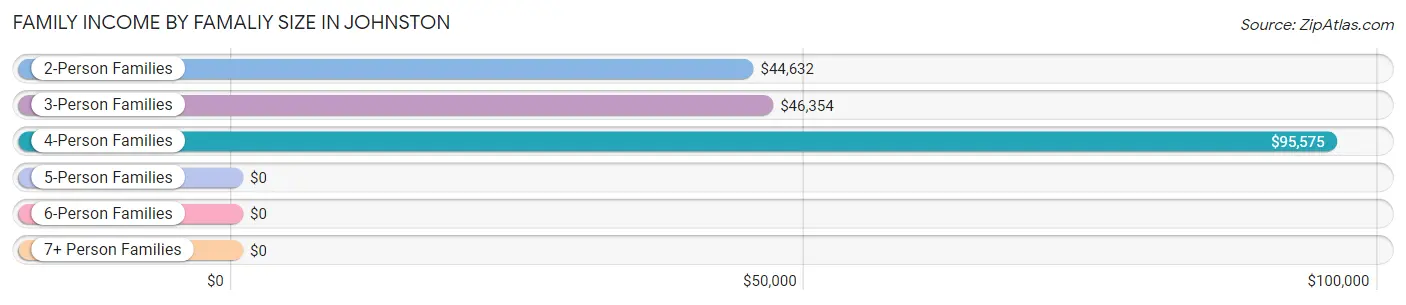
| Income Bracket | # Families | Median Income |
| 2-Person Families | 307 (50.6%) | $44,632 |
| 3-Person Families | 159 (26.2%) | $46,354 |
| 4-Person Families | 85 (14.0%) | $95,575 |
| 5-Person Families | 23 (3.8%) | $0 |
| 6-Person Families | 16 (2.6%) | $0 |
| 7+ Person Families | 17 (2.8%) | $0 |
| Total | 607 (100.0%) | $50,972 |
Family Income by Number of Earners in Johnston
The median family income in Johnston is $50,972, with families comprising 3+ earners (40) having the highest median family income of $78,182, while families with no earners (96) have the lowest median family income of $16,563, accounting for 6.6% and 15.8% of families, respectively.
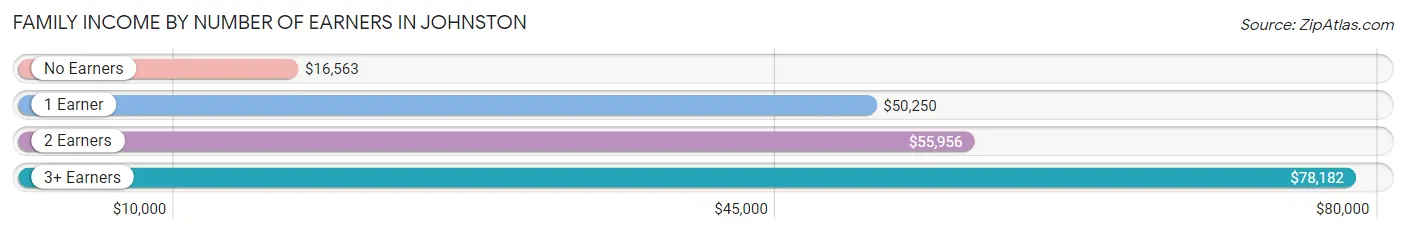
| Number of Earners | # Families | Median Income |
| No Earners | 96 (15.8%) | $16,563 |
| 1 Earner | 362 (59.6%) | $50,250 |
| 2 Earners | 109 (18.0%) | $55,956 |
| 3+ Earners | 40 (6.6%) | $78,182 |
| Total | 607 (100.0%) | $50,972 |
Household Income in Johnston
Household Income Brackets in Johnston
With 205 households falling in the category, the $10,000 to $14,999 income range is the most frequent in Johnston, accounting for 18.7% of all households. In contrast, only 4 households (0.4%) fall into the $200,000+ income bracket, making it the least populous group.
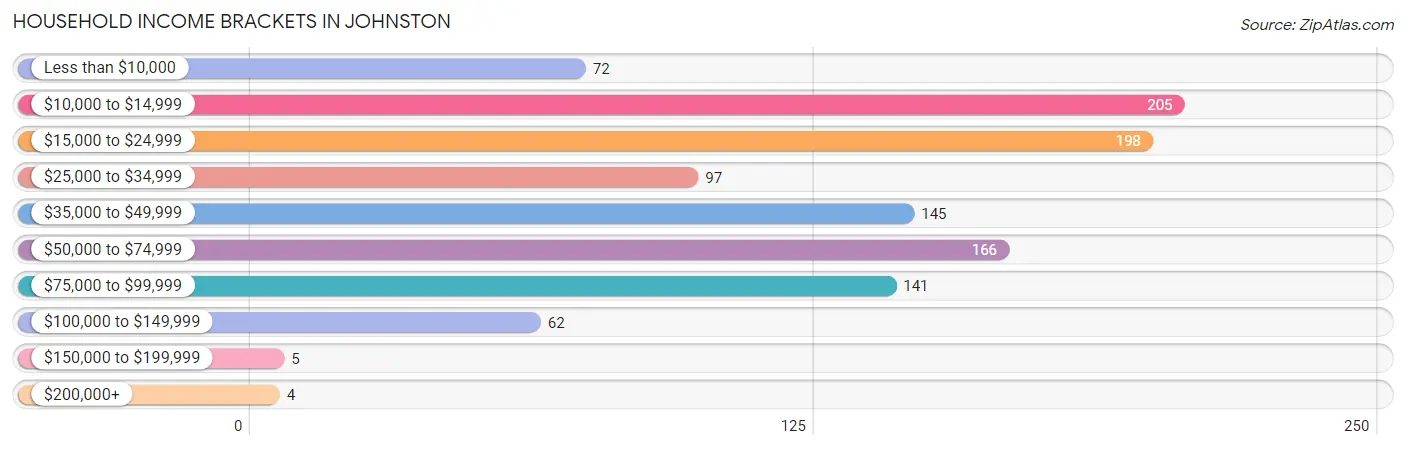
| Income Bracket | # Households | % Households |
| Less than $10,000 | 72 | 6.6% |
| $10,000 to $14,999 | 205 | 18.7% |
| $15,000 to $24,999 | 198 | 18.1% |
| $25,000 to $34,999 | 97 | 8.9% |
| $35,000 to $49,999 | 145 | 13.2% |
| $50,000 to $74,999 | 166 | 15.2% |
| $75,000 to $99,999 | 141 | 12.9% |
| $100,000 to $149,999 | 62 | 5.7% |
| $150,000 to $199,999 | 5 | 0.5% |
| $200,000+ | 4 | 0.4% |
Household Income by Householder Age in Johnston
The median household income in Johnston is $31,910, with the highest median household income of $41,196 found in the 45 to 64 years age bracket for the primary householder. A total of 422 households (38.5%) fall into this category. Meanwhile, the 15 to 24 years age bracket for the primary householder has the lowest median household income of $0, with 11 households (1.0%) in this group.
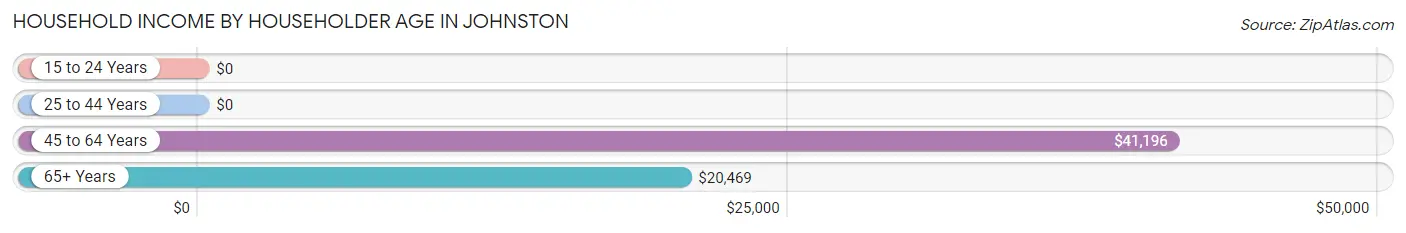
| Income Bracket | # Households | Median Income |
| 15 to 24 Years | 11 (1.0%) | $0 |
| 25 to 44 Years | 219 (20.0%) | $0 |
| 45 to 64 Years | 422 (38.5%) | $41,196 |
| 65+ Years | 443 (40.5%) | $20,469 |
| Total | 1,095 (100.0%) | $31,910 |
Poverty in Johnston
Income Below Poverty by Sex and Age in Johnston
With 36.1% poverty level for males and 29.3% for females among the residents of Johnston, 35 to 44 year old males and under 5 year old females are the most vulnerable to poverty, with 49 males (60.5%) and 38 females (44.2%) in their respective age groups living below the poverty level.
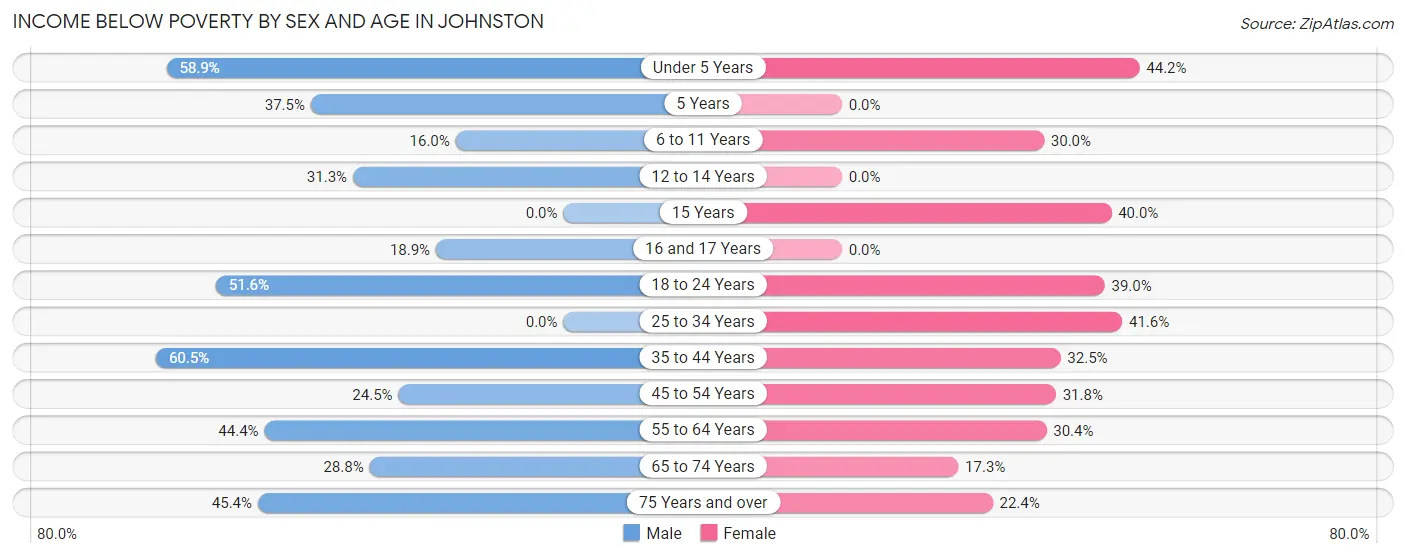
| Age Bracket | Male | Female |
| Under 5 Years | 33 (58.9%) | 38 (44.2%) |
| 5 Years | 9 (37.5%) | 0 (0.0%) |
| 6 to 11 Years | 4 (16.0%) | 12 (30.0%) |
| 12 to 14 Years | 20 (31.2%) | 0 (0.0%) |
| 15 Years | 0 (0.0%) | 8 (40.0%) |
| 16 and 17 Years | 14 (18.9%) | 0 (0.0%) |
| 18 to 24 Years | 65 (51.6%) | 16 (39.0%) |
| 25 to 34 Years | 0 (0.0%) | 72 (41.6%) |
| 35 to 44 Years | 49 (60.5%) | 37 (32.5%) |
| 45 to 54 Years | 24 (24.5%) | 88 (31.8%) |
| 55 to 64 Years | 83 (44.4%) | 41 (30.4%) |
| 65 to 74 Years | 38 (28.8%) | 42 (17.3%) |
| 75 Years and over | 44 (45.4%) | 32 (22.4%) |
| Total | 383 (36.1%) | 386 (29.3%) |
Income Above Poverty by Sex and Age in Johnston
According to the poverty statistics in Johnston, males aged 15 years and females aged 5 years are the age groups that are most secure financially, with 100.0% of males and 100.0% of females in these age groups living above the poverty line.
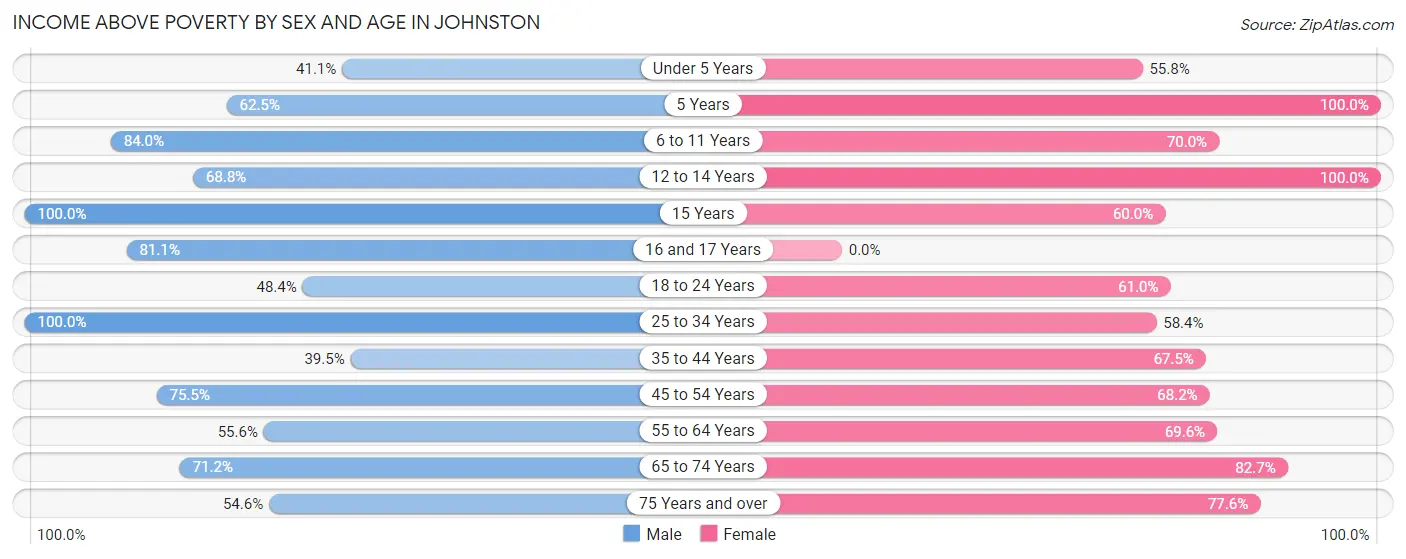
| Age Bracket | Male | Female |
| Under 5 Years | 23 (41.1%) | 48 (55.8%) |
| 5 Years | 15 (62.5%) | 11 (100.0%) |
| 6 to 11 Years | 21 (84.0%) | 28 (70.0%) |
| 12 to 14 Years | 44 (68.8%) | 32 (100.0%) |
| 15 Years | 8 (100.0%) | 12 (60.0%) |
| 16 and 17 Years | 60 (81.1%) | 0 (0.0%) |
| 18 to 24 Years | 61 (48.4%) | 25 (61.0%) |
| 25 to 34 Years | 88 (100.0%) | 101 (58.4%) |
| 35 to 44 Years | 32 (39.5%) | 77 (67.5%) |
| 45 to 54 Years | 74 (75.5%) | 189 (68.2%) |
| 55 to 64 Years | 104 (55.6%) | 94 (69.6%) |
| 65 to 74 Years | 94 (71.2%) | 201 (82.7%) |
| 75 Years and over | 53 (54.6%) | 111 (77.6%) |
| Total | 677 (63.9%) | 929 (70.7%) |
Income Below Poverty Among Married-Couple Families in Johnston
The poverty statistics for married-couple families in Johnston show that 25.4% or 64 of the total 252 families live below the poverty line. Families with no children have the highest poverty rate of 28.6%, comprising of 61 families. On the other hand, families with 3 or 4 children have the lowest poverty rate of 0.0%, which includes 0 families.
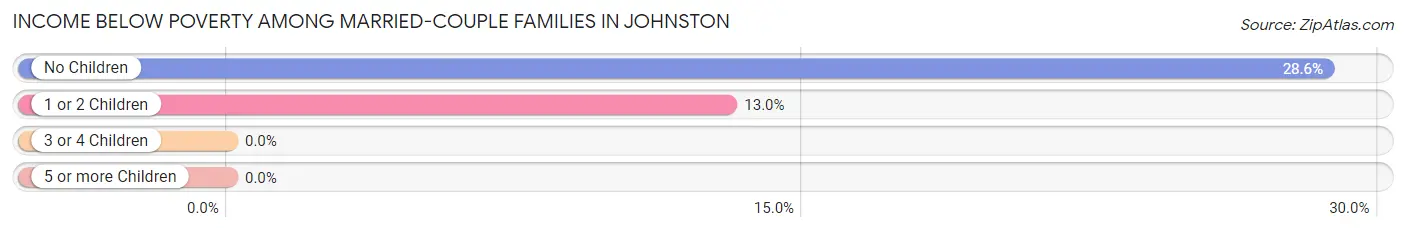
| Children | Above Poverty | Below Poverty |
| No Children | 152 (71.4%) | 61 (28.6%) |
| 1 or 2 Children | 20 (87.0%) | 3 (13.0%) |
| 3 or 4 Children | 16 (100.0%) | 0 (0.0%) |
| 5 or more Children | 0 (0.0%) | 0 (0.0%) |
| Total | 188 (74.6%) | 64 (25.4%) |
Income Below Poverty Among Single-Parent Households in Johnston
According to the poverty data in Johnston, 71.7% or 38 single-father households and 18.2% or 55 single-mother households are living below the poverty line. Among single-father households, those with 1 or 2 children have the highest poverty rate, with 38 households (100.0%) experiencing poverty. Likewise, among single-mother households, those with 3 or 4 children have the highest poverty rate, with 28 households (26.2%) falling below the poverty line.
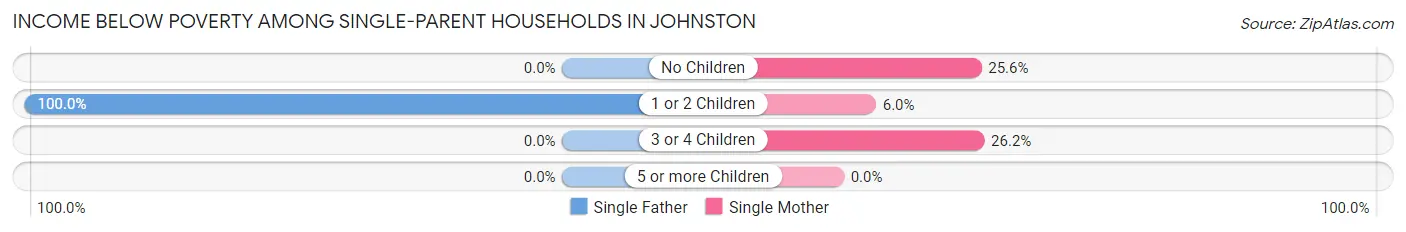
| Children | Single Father | Single Mother |
| No Children | 0 (0.0%) | 20 (25.6%) |
| 1 or 2 Children | 38 (100.0%) | 7 (6.0%) |
| 3 or 4 Children | 0 (0.0%) | 28 (26.2%) |
| 5 or more Children | 0 (0.0%) | 0 (0.0%) |
| Total | 38 (71.7%) | 55 (18.2%) |
Income Below Poverty Among Married-Couple vs Single-Parent Households in Johnston
The poverty data for Johnston shows that 64 of the married-couple family households (25.4%) and 93 of the single-parent households (26.2%) are living below the poverty level. Within the married-couple family households, those with no children have the highest poverty rate, with 61 households (28.6%) falling below the poverty line. Among the single-parent households, those with 1 or 2 children have the highest poverty rate, with 45 household (29.0%) living below poverty.
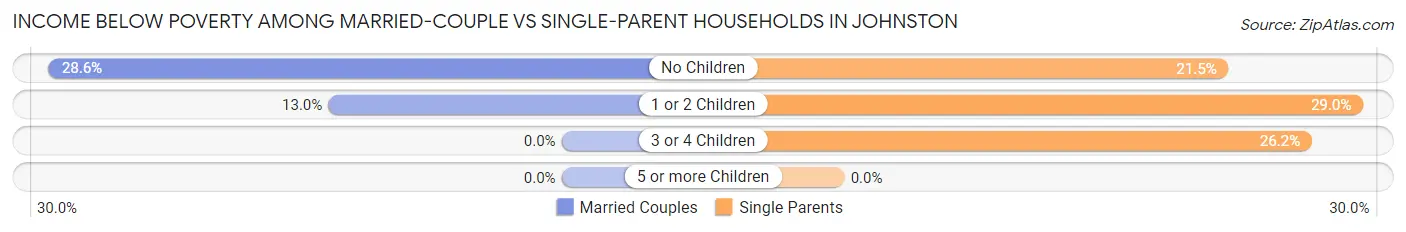
| Children | Married-Couple Families | Single-Parent Households |
| No Children | 61 (28.6%) | 20 (21.5%) |
| 1 or 2 Children | 3 (13.0%) | 45 (29.0%) |
| 3 or 4 Children | 0 (0.0%) | 28 (26.2%) |
| 5 or more Children | 0 (0.0%) | 0 (0.0%) |
| Total | 64 (25.4%) | 93 (26.2%) |
Race in Johnston
The most populous races in Johnston are Black / African American (1,497 | 63.0%), White / Caucasian (749 | 31.5%), and Hispanic or Latino (116 | 4.9%).
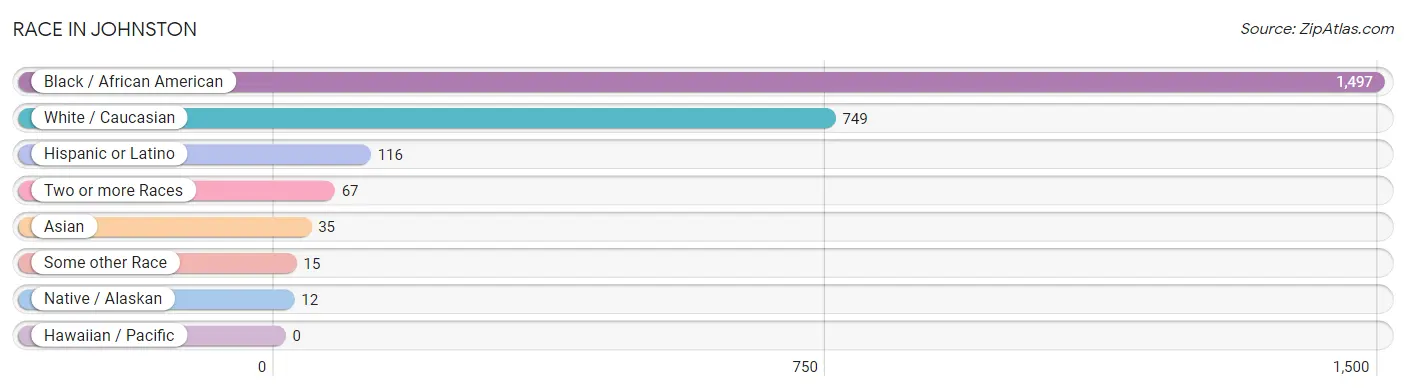
| Race | # Population | % Population |
| Asian | 35 | 1.5% |
| Black / African American | 1,497 | 63.0% |
| Hawaiian / Pacific | 0 | 0.0% |
| Hispanic or Latino | 116 | 4.9% |
| Native / Alaskan | 12 | 0.5% |
| White / Caucasian | 749 | 31.5% |
| Two or more Races | 67 | 2.8% |
| Some other Race | 15 | 0.6% |
| Total | 2,375 | 100.0% |
Ancestry in Johnston
The most populous ancestries reported in Johnston are American (227 | 9.6%), African (134 | 5.6%), Subsaharan African (134 | 5.6%), English (122 | 5.1%), and Irish (115 | 4.8%), together accounting for 30.8% of all Johnston residents.
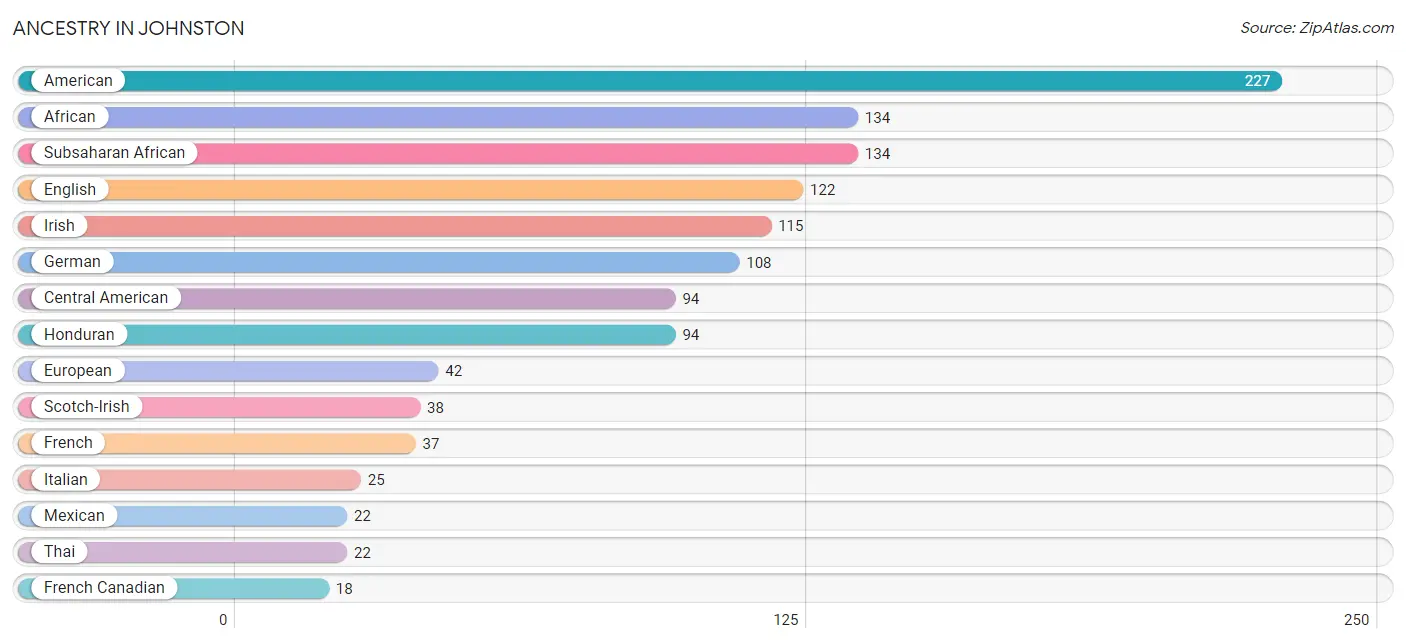
| Ancestry | # Population | % Population |
| African | 134 | 5.6% |
| American | 227 | 9.6% |
| British | 5 | 0.2% |
| Central American | 94 | 4.0% |
| Dutch | 6 | 0.3% |
| English | 122 | 5.1% |
| European | 42 | 1.8% |
| French | 37 | 1.6% |
| French Canadian | 18 | 0.8% |
| German | 108 | 4.5% |
| Honduran | 94 | 4.0% |
| Irish | 115 | 4.8% |
| Italian | 25 | 1.1% |
| Korean | 6 | 0.3% |
| Mexican | 22 | 0.9% |
| Scotch-Irish | 38 | 1.6% |
| Sioux | 2 | 0.1% |
| Subsaharan African | 134 | 5.6% |
| Thai | 22 | 0.9% |
| Welsh | 5 | 0.2% | View All 20 Rows |
Immigrants in Johnston
The most numerous immigrant groups reported in Johnston came from Latin America (116 | 4.9%), Central America (94 | 4.0%), Honduras (94 | 4.0%), Caribbean (22 | 0.9%), and Dominican Republic (22 | 0.9%), together accounting for 14.7% of all Johnston residents.
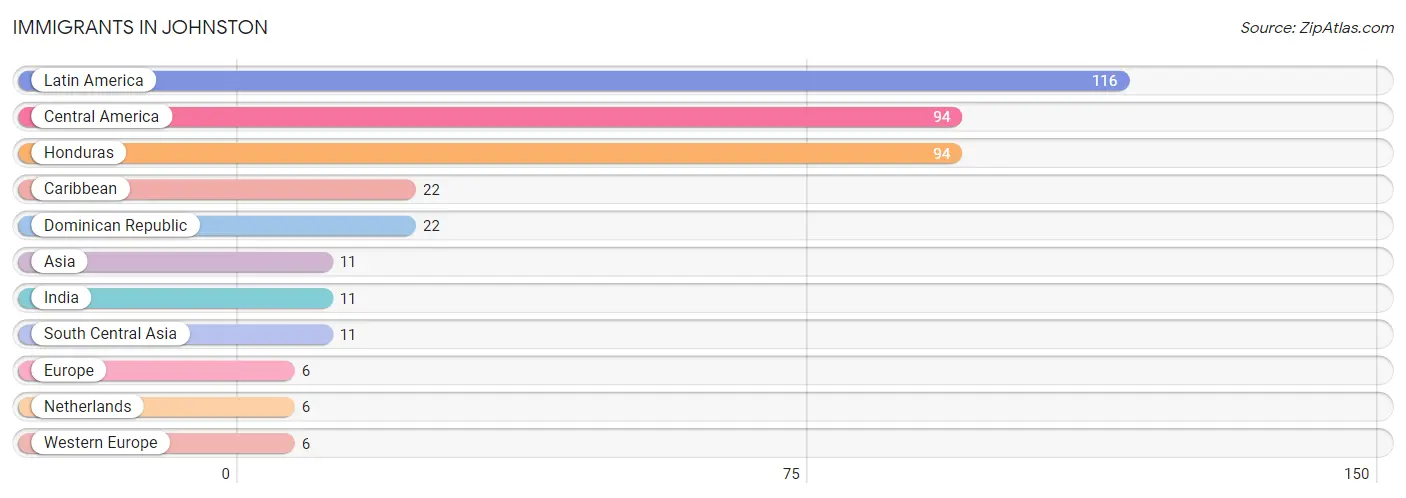
| Immigration Origin | # Population | % Population |
| Asia | 11 | 0.5% |
| Caribbean | 22 | 0.9% |
| Central America | 94 | 4.0% |
| Dominican Republic | 22 | 0.9% |
| Europe | 6 | 0.3% |
| Honduras | 94 | 4.0% |
| India | 11 | 0.5% |
| Latin America | 116 | 4.9% |
| Netherlands | 6 | 0.3% |
| South Central Asia | 11 | 0.5% |
| Western Europe | 6 | 0.3% | View All 11 Rows |
Sex and Age in Johnston
Sex and Age in Johnston
The most populous age groups in Johnston are 20 to 24 Years (126 | 11.9%) for men and 45 to 49 Years (196 | 14.9%) for women.
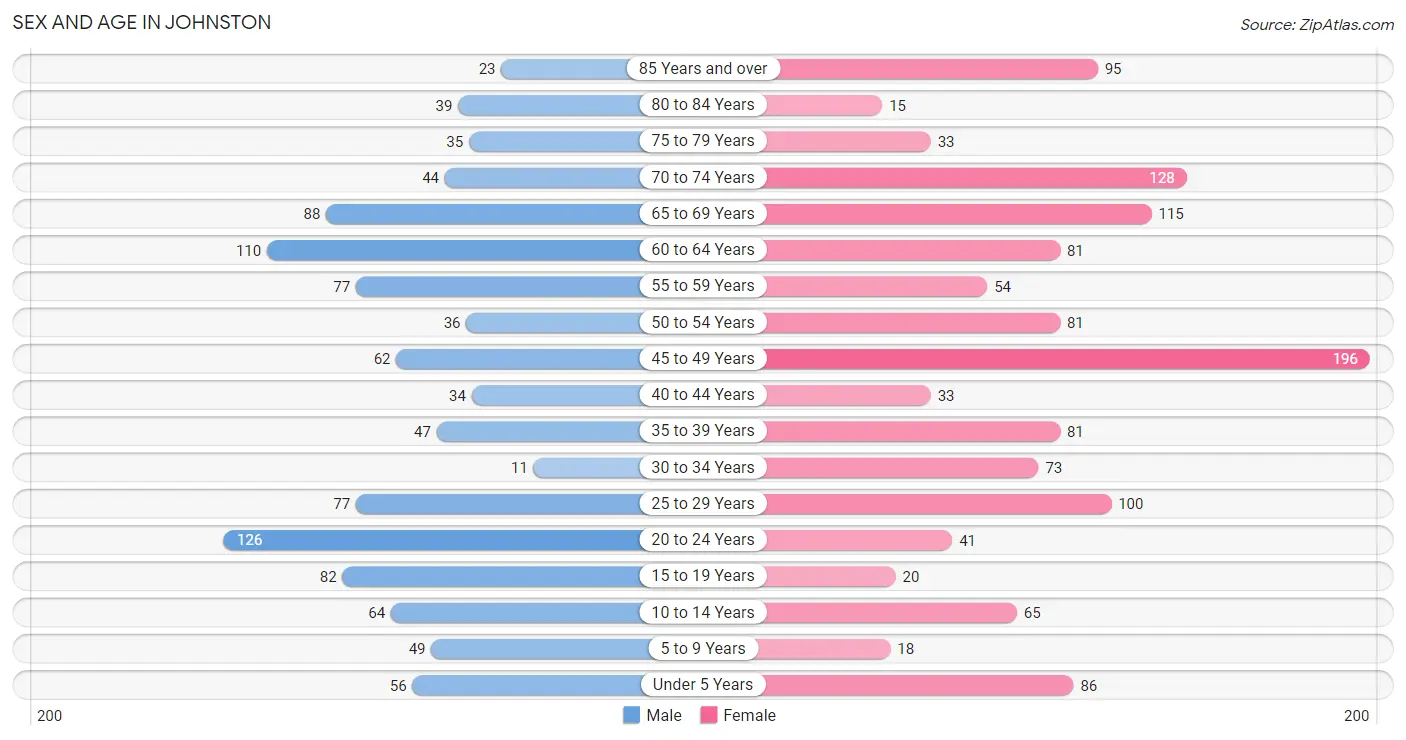
| Age Bracket | Male | Female |
| Under 5 Years | 56 (5.3%) | 86 (6.5%) |
| 5 to 9 Years | 49 (4.6%) | 18 (1.4%) |
| 10 to 14 Years | 64 (6.0%) | 65 (4.9%) |
| 15 to 19 Years | 82 (7.7%) | 20 (1.5%) |
| 20 to 24 Years | 126 (11.9%) | 41 (3.1%) |
| 25 to 29 Years | 77 (7.3%) | 100 (7.6%) |
| 30 to 34 Years | 11 (1.0%) | 73 (5.6%) |
| 35 to 39 Years | 47 (4.4%) | 81 (6.2%) |
| 40 to 44 Years | 34 (3.2%) | 33 (2.5%) |
| 45 to 49 Years | 62 (5.9%) | 196 (14.9%) |
| 50 to 54 Years | 36 (3.4%) | 81 (6.2%) |
| 55 to 59 Years | 77 (7.3%) | 54 (4.1%) |
| 60 to 64 Years | 110 (10.4%) | 81 (6.2%) |
| 65 to 69 Years | 88 (8.3%) | 115 (8.7%) |
| 70 to 74 Years | 44 (4.2%) | 128 (9.7%) |
| 75 to 79 Years | 35 (3.3%) | 33 (2.5%) |
| 80 to 84 Years | 39 (3.7%) | 15 (1.1%) |
| 85 Years and over | 23 (2.2%) | 95 (7.2%) |
| Total | 1,060 (100.0%) | 1,315 (100.0%) |
Families and Households in Johnston
Median Family Size in Johnston
The median family size in Johnston is 2.99 persons per family, with single female/mother families (302 | 49.7%) accounting for the largest median family size of 3.23 persons per family. On the other hand, married-couple families (252 | 41.5%) represent the smallest median family size with 2.73 persons per family.
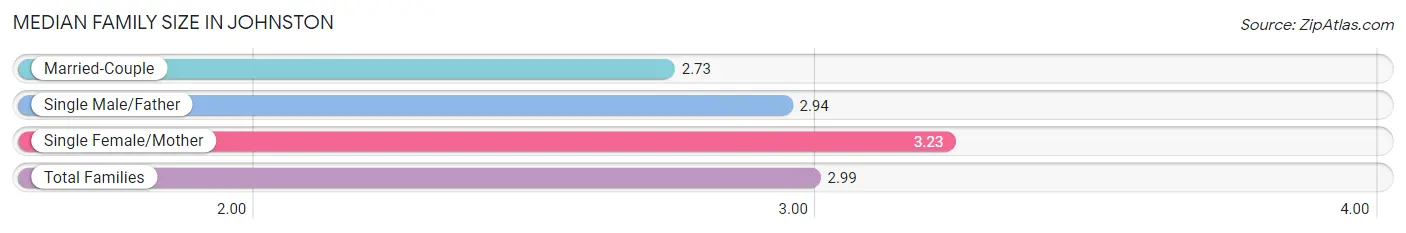
| Family Type | # Families | Family Size |
| Married-Couple | 252 (41.5%) | 2.73 |
| Single Male/Father | 53 (8.7%) | 2.94 |
| Single Female/Mother | 302 (49.7%) | 3.23 |
| Total Families | 607 (100.0%) | 2.99 |
Median Household Size in Johnston
The median household size in Johnston is 2.17 persons per household, with single male/father households (53 | 4.8%) accounting for the largest median household size of 3.23 persons per household. non-family households (488 | 44.6%) represent the smallest median household size with 1.11 persons per household.
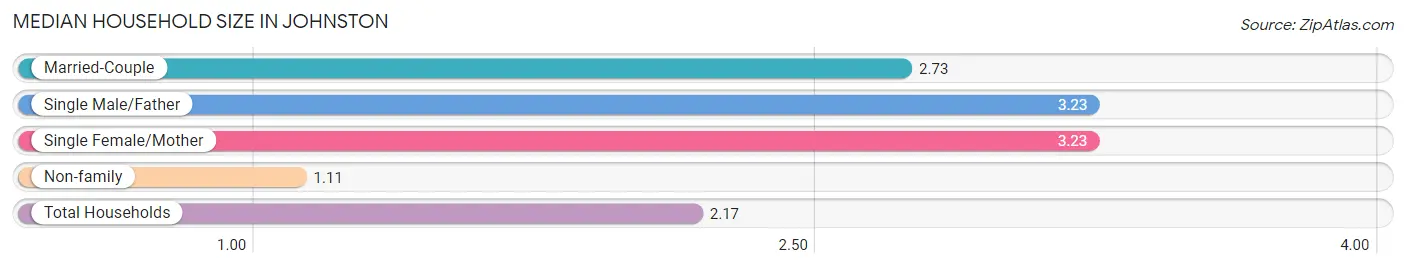
| Household Type | # Households | Household Size |
| Married-Couple | 252 (23.0%) | 2.73 |
| Single Male/Father | 53 (4.8%) | 3.23 |
| Single Female/Mother | 302 (27.6%) | 3.23 |
| Non-family | 488 (44.6%) | 1.11 |
| Total Households | 1,095 (100.0%) | 2.17 |
Household Size by Marriage Status in Johnston
Out of a total of 1,095 households in Johnston, 607 (55.4%) are family households, while 488 (44.6%) are nonfamily households. The most numerous type of family households are 2-person households, comprising 307, and the most common type of nonfamily households are 1-person households, comprising 445.
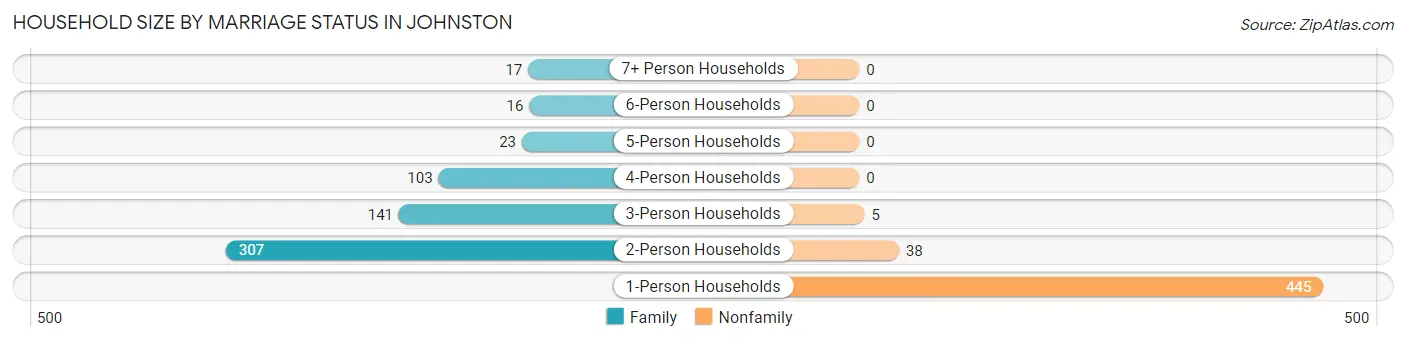
| Household Size | Family Households | Nonfamily Households |
| 1-Person Households | - | 445 (40.6%) |
| 2-Person Households | 307 (28.0%) | 38 (3.5%) |
| 3-Person Households | 141 (12.9%) | 5 (0.5%) |
| 4-Person Households | 103 (9.4%) | 0 (0.0%) |
| 5-Person Households | 23 (2.1%) | 0 (0.0%) |
| 6-Person Households | 16 (1.5%) | 0 (0.0%) |
| 7+ Person Households | 17 (1.5%) | 0 (0.0%) |
| Total | 607 (55.4%) | 488 (44.6%) |
Female Fertility in Johnston
Fertility by Age in Johnston
Average fertility rate in Johnston is 57.0 births per 1,000 women. Women in the age bracket of 20 to 34 years have the highest fertility rate with 154.0 births per 1,000 women. Women in the age bracket of 20 to 34 years acount for 100.0% of all women with births.
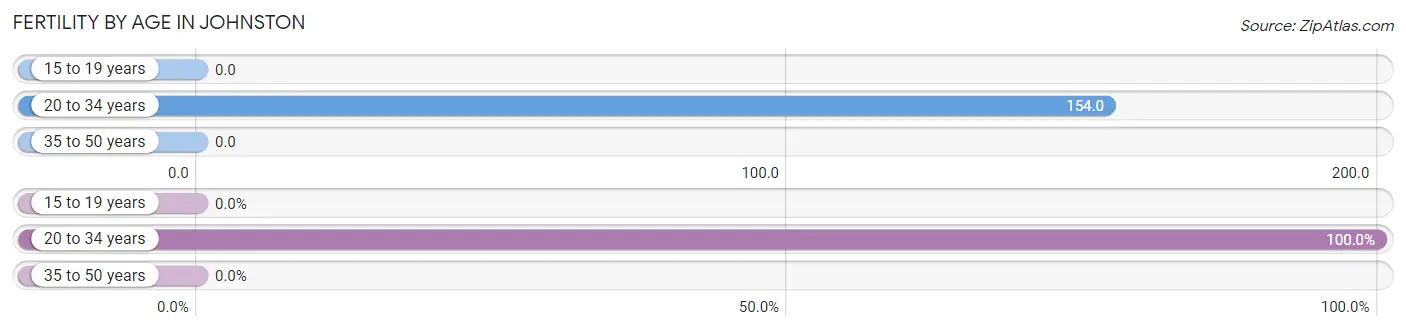
| Age Bracket | Women with Births | Births / 1,000 Women |
| 15 to 19 years | 0 (0.0%) | 0.0 |
| 20 to 34 years | 33 (100.0%) | 154.0 |
| 35 to 50 years | 0 (0.0%) | 0.0 |
| Total | 33 (100.0%) | 57.0 |
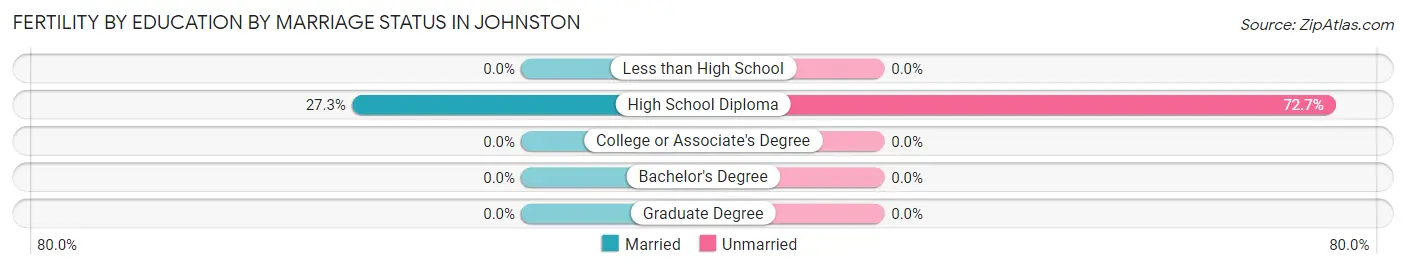
Fertility by Age by Marriage Status in Johnston
27.3% of women with births (33) in Johnston are married. The highest percentage of unmarried women with births falls into 20 to 34 years age bracket with 72.7% of them unmarried at the time of birth, while the lowest percentage of unmarried women with births belong to 20 to 34 years age bracket with 72.7% of them unmarried.
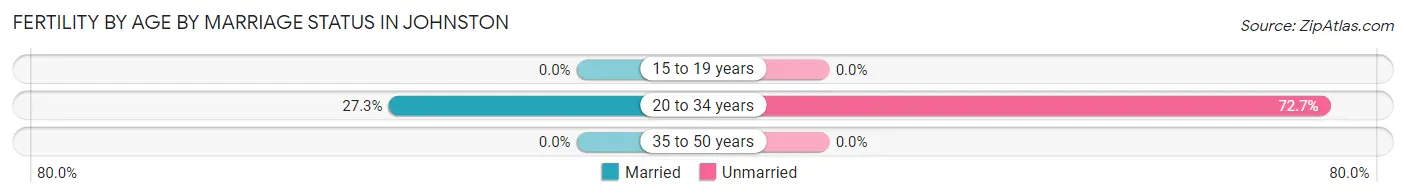
| Age Bracket | Married | Unmarried |
| 15 to 19 years | 0 (0.0%) | 0 (0.0%) |
| 20 to 34 years | 9 (27.3%) | 24 (72.7%) |
| 35 to 50 years | 0 (0.0%) | 0 (0.0%) |
| Total | 9 (27.3%) | 24 (72.7%) |
Fertility by Education in Johnston
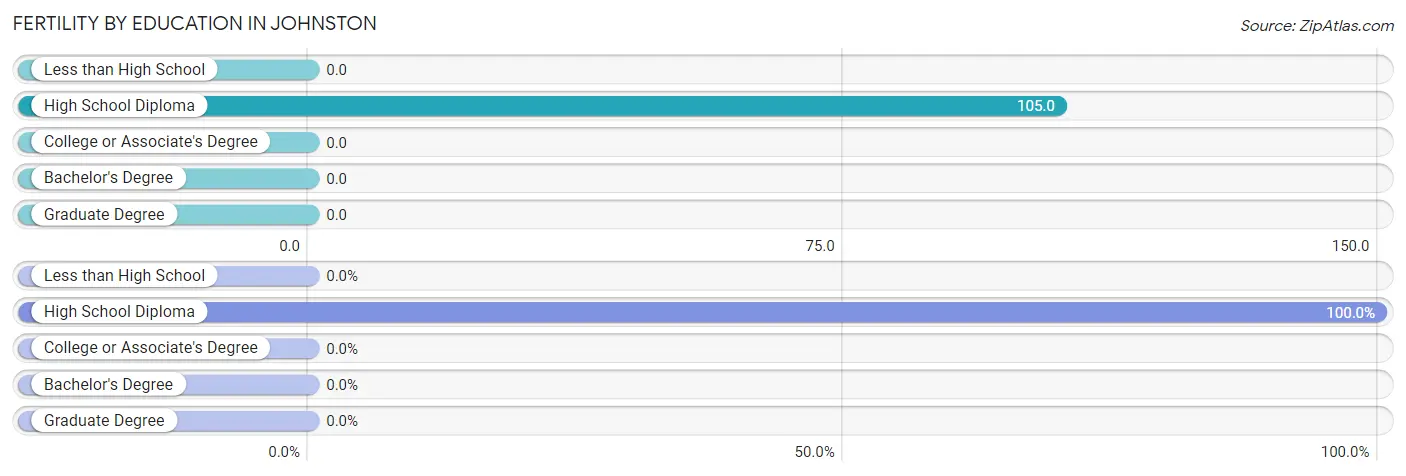
| Educational Attainment | Women with Births | Births / 1,000 Women |
| Less than High School | 0 (0.0%) | 0.0 |
| High School Diploma | 33 (100.0%) | 105.0 |
| College or Associate's Degree | 0 (0.0%) | 0.0 |
| Bachelor's Degree | 0 (0.0%) | 0.0 |
| Graduate Degree | 0 (0.0%) | 0.0 |
| Total | 33 (100.0%) | 57.0 |
Fertility by Education by Marriage Status in Johnston
72.7% of women with births in Johnston are unmarried. Women with the educational attainment of high school diploma are most likely to be married with 27.3% of them married at childbirth, while women with the educational attainment of high school diploma are least likely to be married with 72.7% of them unmarried at childbirth.
| Educational Attainment | Married | Unmarried |
| Less than High School | 0 (0.0%) | 0 (0.0%) |
| High School Diploma | 9 (27.3%) | 24 (72.7%) |
| College or Associate's Degree | 0 (0.0%) | 0 (0.0%) |
| Bachelor's Degree | 0 (0.0%) | 0 (0.0%) |
| Graduate Degree | 0 (0.0%) | 0 (0.0%) |
| Total | 9 (27.3%) | 24 (72.7%) |
Employment Characteristics in Johnston
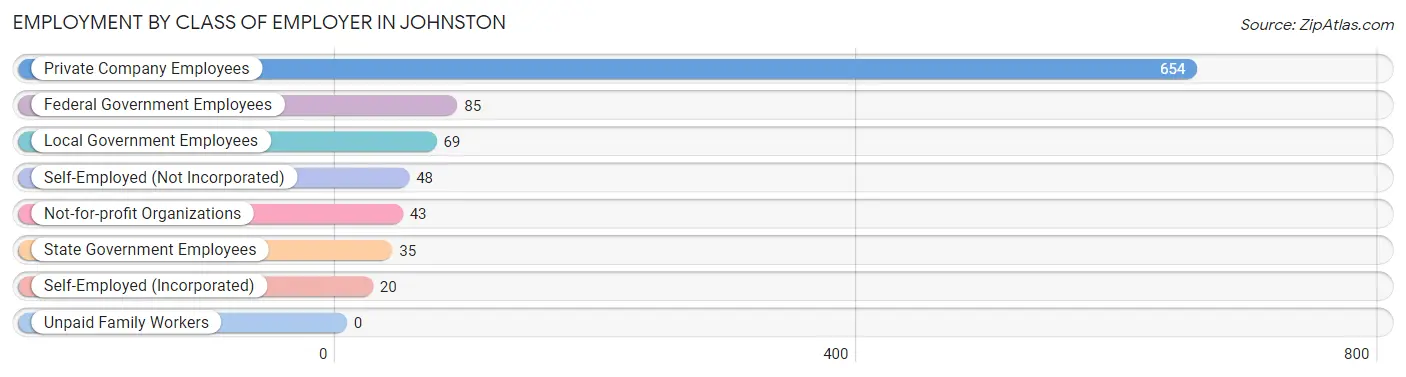
Employment by Class of Employer in Johnston
Among the 954 employed individuals in Johnston, private company employees (654 | 68.5%), federal government employees (85 | 8.9%), and local government employees (69 | 7.2%) make up the most common classes of employment.
| Employer Class | # Employees | % Employees |
| Private Company Employees | 654 | 68.5% |
| Self-Employed (Incorporated) | 20 | 2.1% |
| Self-Employed (Not Incorporated) | 48 | 5.0% |
| Not-for-profit Organizations | 43 | 4.5% |
| Local Government Employees | 69 | 7.2% |
| State Government Employees | 35 | 3.7% |
| Federal Government Employees | 85 | 8.9% |
| Unpaid Family Workers | 0 | 0.0% |
| Total | 954 | 100.0% |
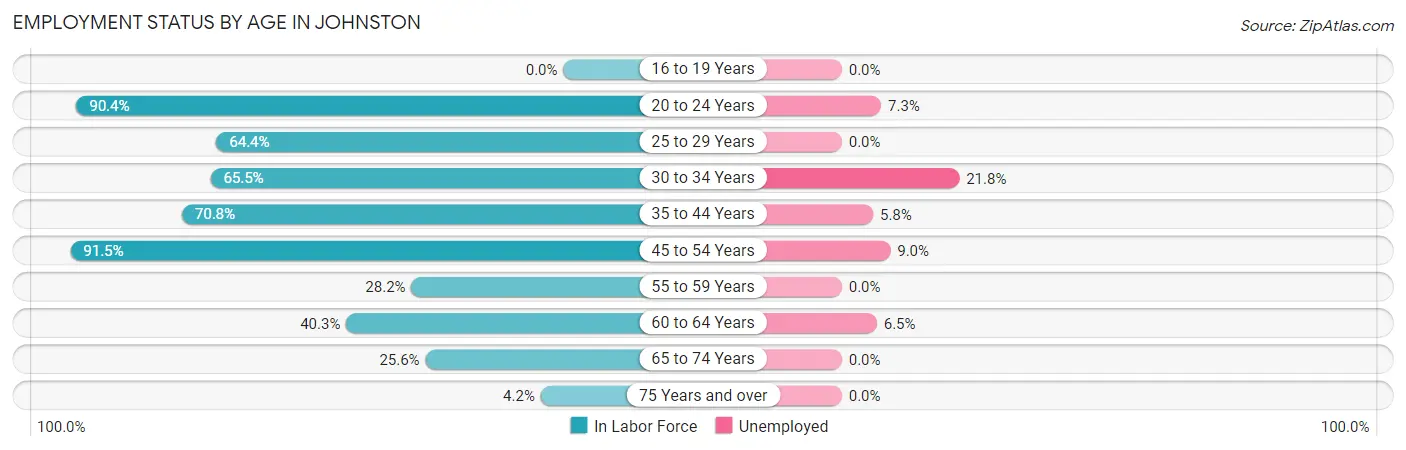
Employment Status by Age in Johnston
According to the labor force statistics for Johnston, out of the total population over 16 years of age (2,009), 50.8% or 1,021 individuals are in the labor force, with 6.6% or 67 of them unemployed. The age group with the highest labor force participation rate is 45 to 54 years, with 91.5% or 343 individuals in the labor force. Within the labor force, the 30 to 34 years age range has the highest percentage of unemployed individuals, with 21.8% or 12 of them being unemployed.
| Age Bracket | In Labor Force | Unemployed |
| 16 to 19 Years | 0 (0.0%) | 0 (0.0%) |
| 20 to 24 Years | 151 (90.4%) | 11 (7.3%) |
| 25 to 29 Years | 114 (64.4%) | 0 (0.0%) |
| 30 to 34 Years | 55 (65.5%) | 12 (21.8%) |
| 35 to 44 Years | 138 (70.8%) | 8 (5.8%) |
| 45 to 54 Years | 343 (91.5%) | 31 (9.0%) |
| 55 to 59 Years | 37 (28.2%) | 0 (0.0%) |
| 60 to 64 Years | 77 (40.3%) | 5 (6.5%) |
| 65 to 74 Years | 96 (25.6%) | 0 (0.0%) |
| 75 Years and over | 10 (4.2%) | 0 (0.0%) |
| Total | 1,021 (50.8%) | 67 (6.6%) |
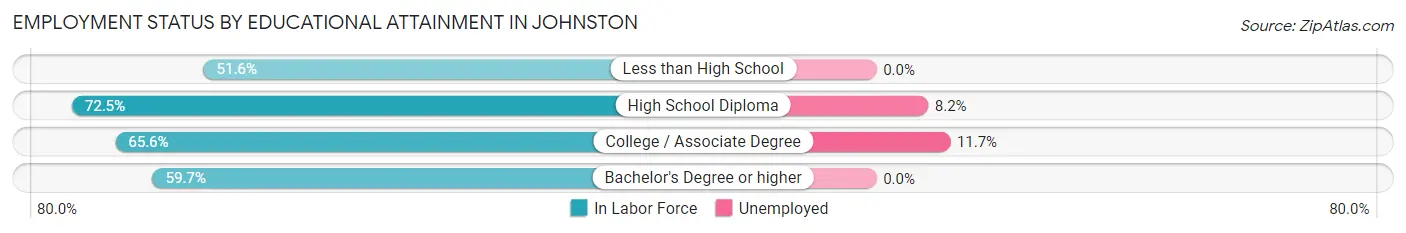
Employment Status by Educational Attainment in Johnston
According to labor force statistics for Johnston, 66.3% of individuals (764) out of the total population between 25 and 64 years of age (1,153) are in the labor force, with 7.3% or 56 of them being unemployed. The group with the highest labor force participation rate are those with the educational attainment of high school diploma, with 72.5% or 403 individuals in the labor force. Within the labor force, individuals with college / associate degree education have the highest percentage of unemployment, with 11.7% or 23 of them being unemployed.
| Educational Attainment | In Labor Force | Unemployed |
| Less than High School | 82 (51.6%) | 0 (0.0%) |
| High School Diploma | 403 (72.5%) | 46 (8.2%) |
| College / Associate Degree | 196 (65.6%) | 35 (11.7%) |
| Bachelor's Degree or higher | 83 (59.7%) | 0 (0.0%) |
| Total | 764 (66.3%) | 84 (7.3%) |
Employment Occupations by Sex in Johnston
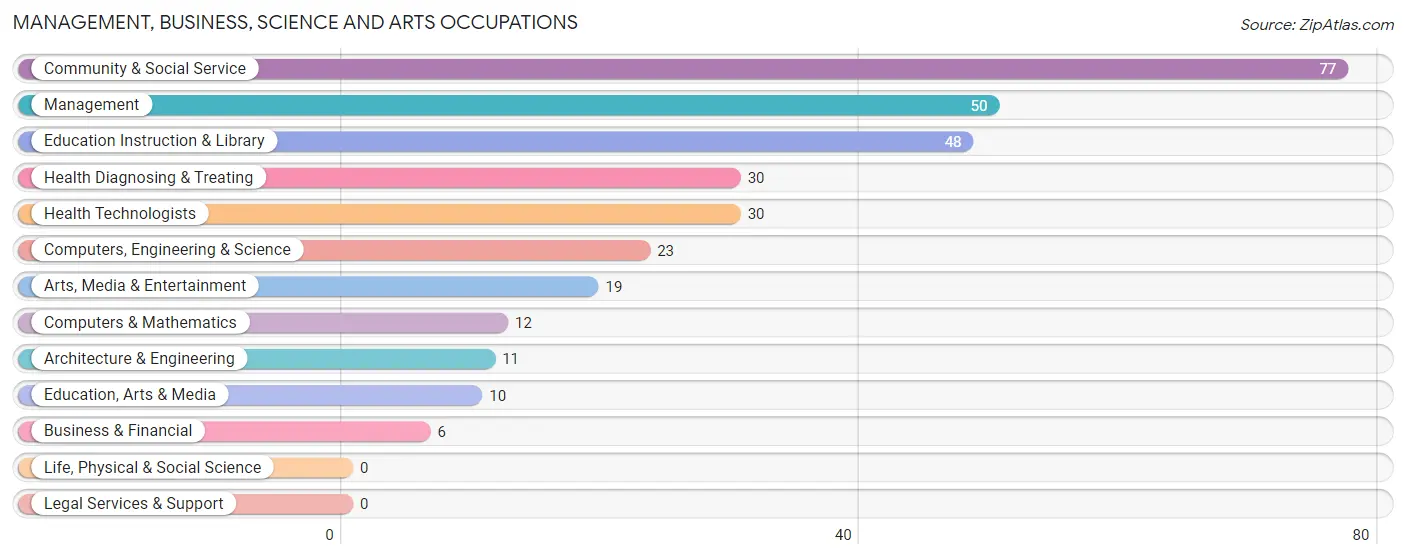
Management, Business, Science and Arts Occupations
The most common Management, Business, Science and Arts occupations in Johnston are Community & Social Service (77 | 8.1%), Management (50 | 5.2%), Education Instruction & Library (48 | 5.0%), Health Diagnosing & Treating (30 | 3.1%), and Health Technologists (30 | 3.1%).
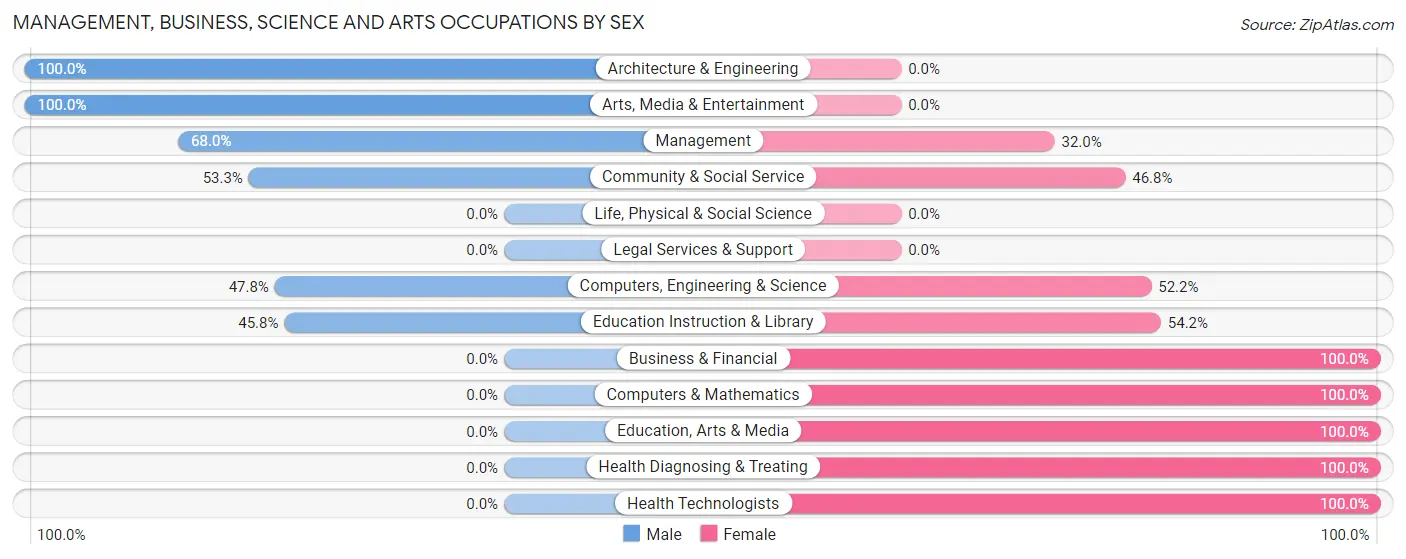
Management, Business, Science and Arts Occupations by Sex
Within the Management, Business, Science and Arts occupations in Johnston, the most male-oriented occupations are Architecture & Engineering (100.0%), Arts, Media & Entertainment (100.0%), and Management (68.0%), while the most female-oriented occupations are Business & Financial (100.0%), Computers & Mathematics (100.0%), and Education, Arts & Media (100.0%).
| Occupation | Male | Female |
| Management | 34 (68.0%) | 16 (32.0%) |
| Business & Financial | 0 (0.0%) | 6 (100.0%) |
| Computers, Engineering & Science | 11 (47.8%) | 12 (52.2%) |
| Computers & Mathematics | 0 (0.0%) | 12 (100.0%) |
| Architecture & Engineering | 11 (100.0%) | 0 (0.0%) |
| Life, Physical & Social Science | 0 (0.0%) | 0 (0.0%) |
| Community & Social Service | 41 (53.2%) | 36 (46.8%) |
| Education, Arts & Media | 0 (0.0%) | 10 (100.0%) |
| Legal Services & Support | 0 (0.0%) | 0 (0.0%) |
| Education Instruction & Library | 22 (45.8%) | 26 (54.2%) |
| Arts, Media & Entertainment | 19 (100.0%) | 0 (0.0%) |
| Health Diagnosing & Treating | 0 (0.0%) | 30 (100.0%) |
| Health Technologists | 0 (0.0%) | 30 (100.0%) |
| Total (Category) | 86 (46.2%) | 100 (53.8%) |
| Total (Overall) | 402 (42.1%) | 552 (57.9%) |
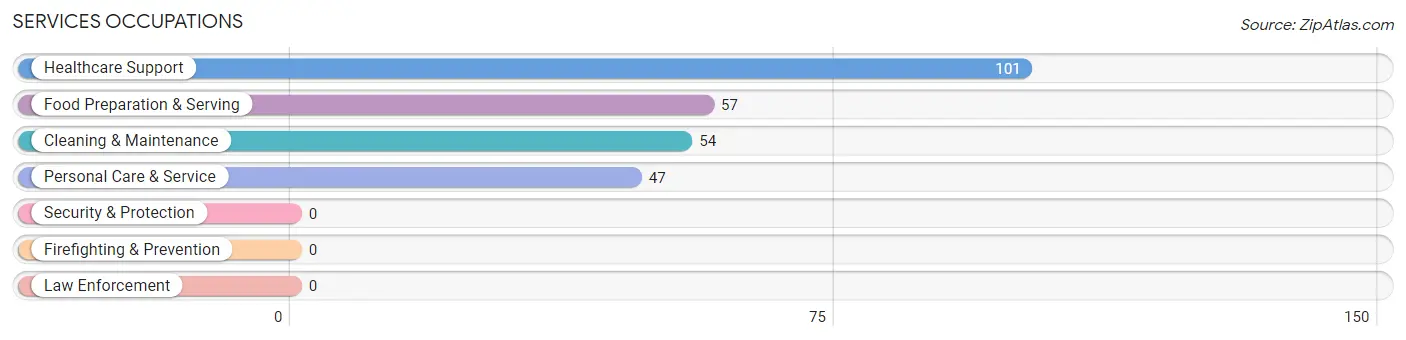
Services Occupations
The most common Services occupations in Johnston are Healthcare Support (101 | 10.6%), Food Preparation & Serving (57 | 6.0%), Cleaning & Maintenance (54 | 5.7%), and Personal Care & Service (47 | 4.9%).
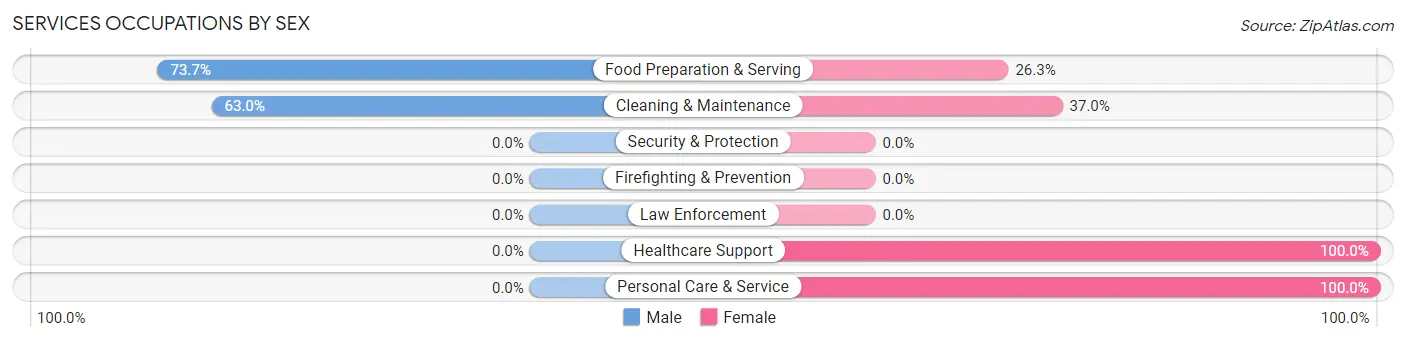
Services Occupations by Sex
Within the Services occupations in Johnston, the most male-oriented occupations are Food Preparation & Serving (73.7%), and Cleaning & Maintenance (63.0%), while the most female-oriented occupations are Healthcare Support (100.0%), Personal Care & Service (100.0%), and Cleaning & Maintenance (37.0%).
| Occupation | Male | Female |
| Healthcare Support | 0 (0.0%) | 101 (100.0%) |
| Security & Protection | 0 (0.0%) | 0 (0.0%) |
| Firefighting & Prevention | 0 (0.0%) | 0 (0.0%) |
| Law Enforcement | 0 (0.0%) | 0 (0.0%) |
| Food Preparation & Serving | 42 (73.7%) | 15 (26.3%) |
| Cleaning & Maintenance | 34 (63.0%) | 20 (37.0%) |
| Personal Care & Service | 0 (0.0%) | 47 (100.0%) |
| Total (Category) | 76 (29.3%) | 183 (70.7%) |
| Total (Overall) | 402 (42.1%) | 552 (57.9%) |
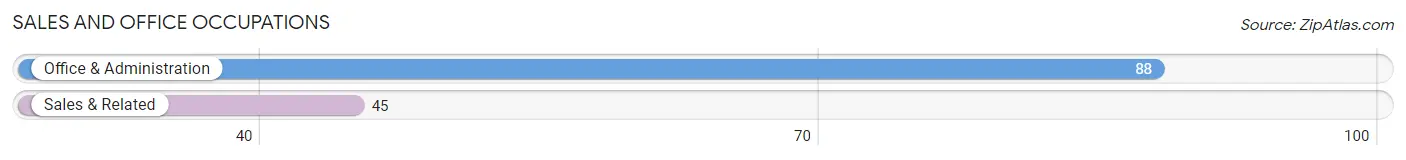
Sales and Office Occupations
The most common Sales and Office occupations in Johnston are Office & Administration (88 | 9.2%), and Sales & Related (45 | 4.7%).
Sales and Office Occupations by Sex
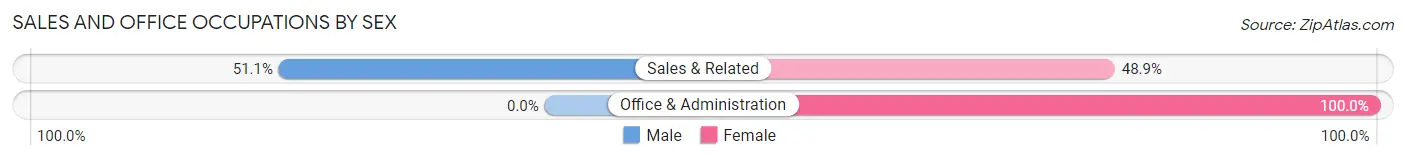
| Occupation | Male | Female |
| Sales & Related | 23 (51.1%) | 22 (48.9%) |
| Office & Administration | 0 (0.0%) | 88 (100.0%) |
| Total (Category) | 23 (17.3%) | 110 (82.7%) |
| Total (Overall) | 402 (42.1%) | 552 (57.9%) |
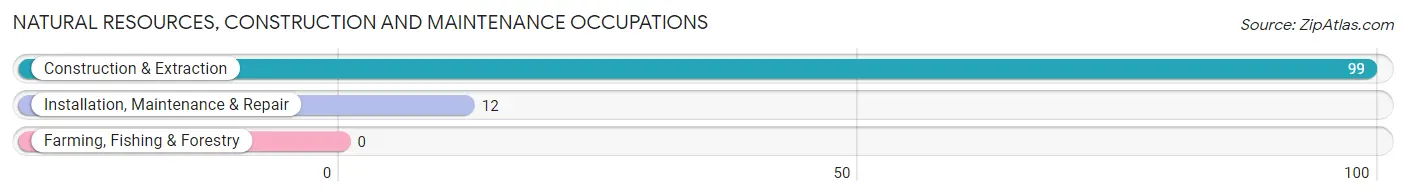
Natural Resources, Construction and Maintenance Occupations
The most common Natural Resources, Construction and Maintenance occupations in Johnston are Construction & Extraction (99 | 10.4%), and Installation, Maintenance & Repair (12 | 1.3%).
Natural Resources, Construction and Maintenance Occupations by Sex
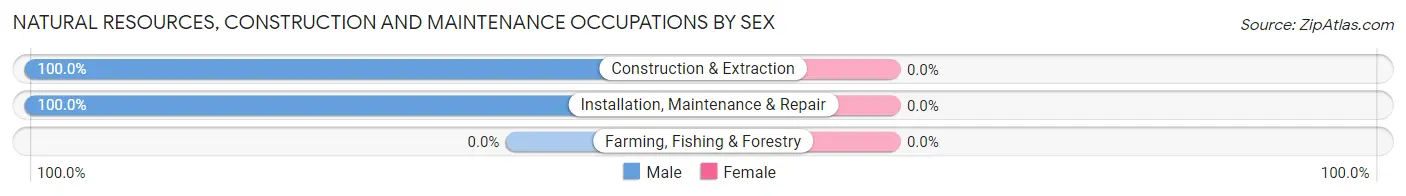
| Occupation | Male | Female |
| Farming, Fishing & Forestry | 0 (0.0%) | 0 (0.0%) |
| Construction & Extraction | 99 (100.0%) | 0 (0.0%) |
| Installation, Maintenance & Repair | 12 (100.0%) | 0 (0.0%) |
| Total (Category) | 111 (100.0%) | 0 (0.0%) |
| Total (Overall) | 402 (42.1%) | 552 (57.9%) |
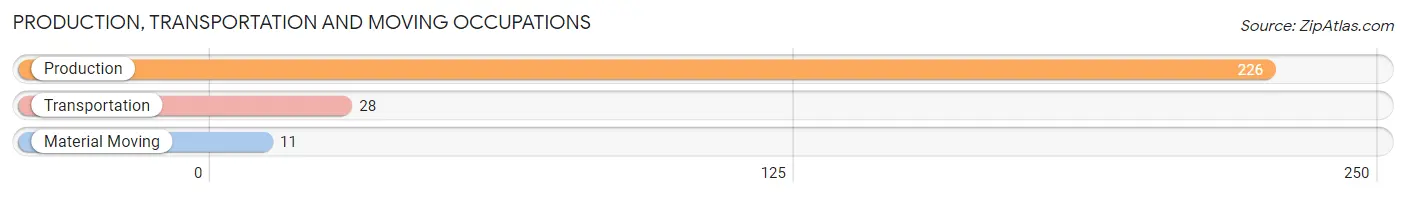
Production, Transportation and Moving Occupations
The most common Production, Transportation and Moving occupations in Johnston are Production (226 | 23.7%), Transportation (28 | 2.9%), and Material Moving (11 | 1.1%).
Production, Transportation and Moving Occupations by Sex
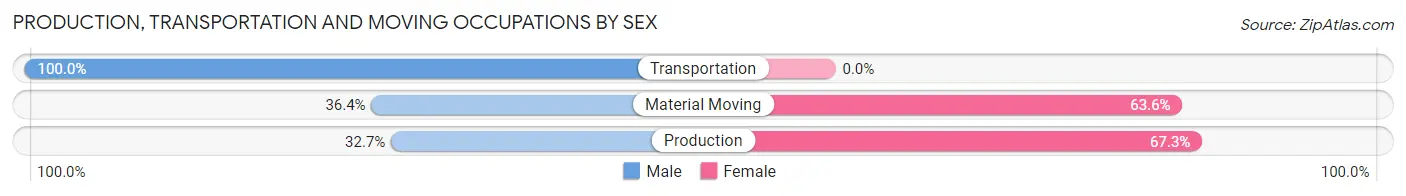
| Occupation | Male | Female |
| Production | 74 (32.7%) | 152 (67.3%) |
| Transportation | 28 (100.0%) | 0 (0.0%) |
| Material Moving | 4 (36.4%) | 7 (63.6%) |
| Total (Category) | 106 (40.0%) | 159 (60.0%) |
| Total (Overall) | 402 (42.1%) | 552 (57.9%) |
Employment Industries by Sex in Johnston
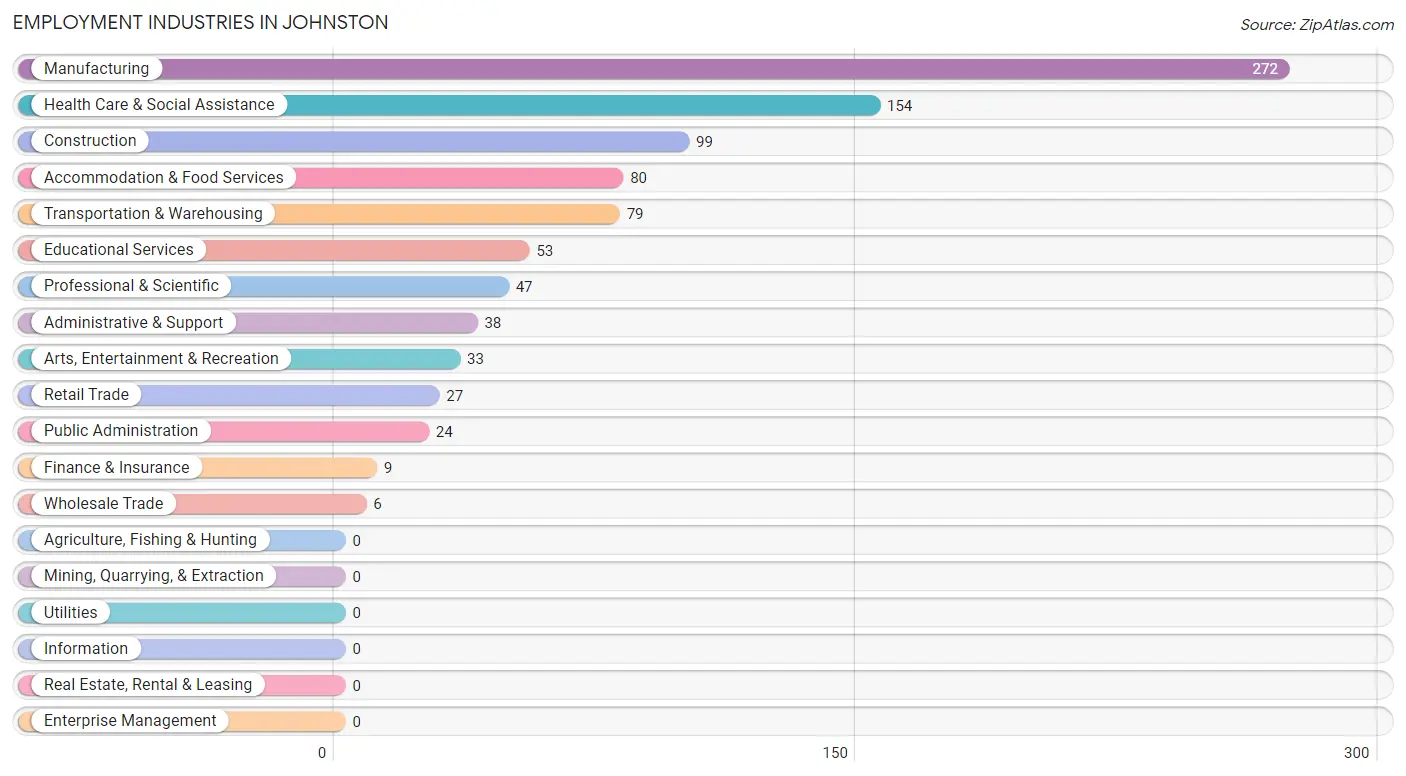
Employment Industries in Johnston
The major employment industries in Johnston include Manufacturing (272 | 28.5%), Health Care & Social Assistance (154 | 16.1%), Construction (99 | 10.4%), Accommodation & Food Services (80 | 8.4%), and Transportation & Warehousing (79 | 8.3%).
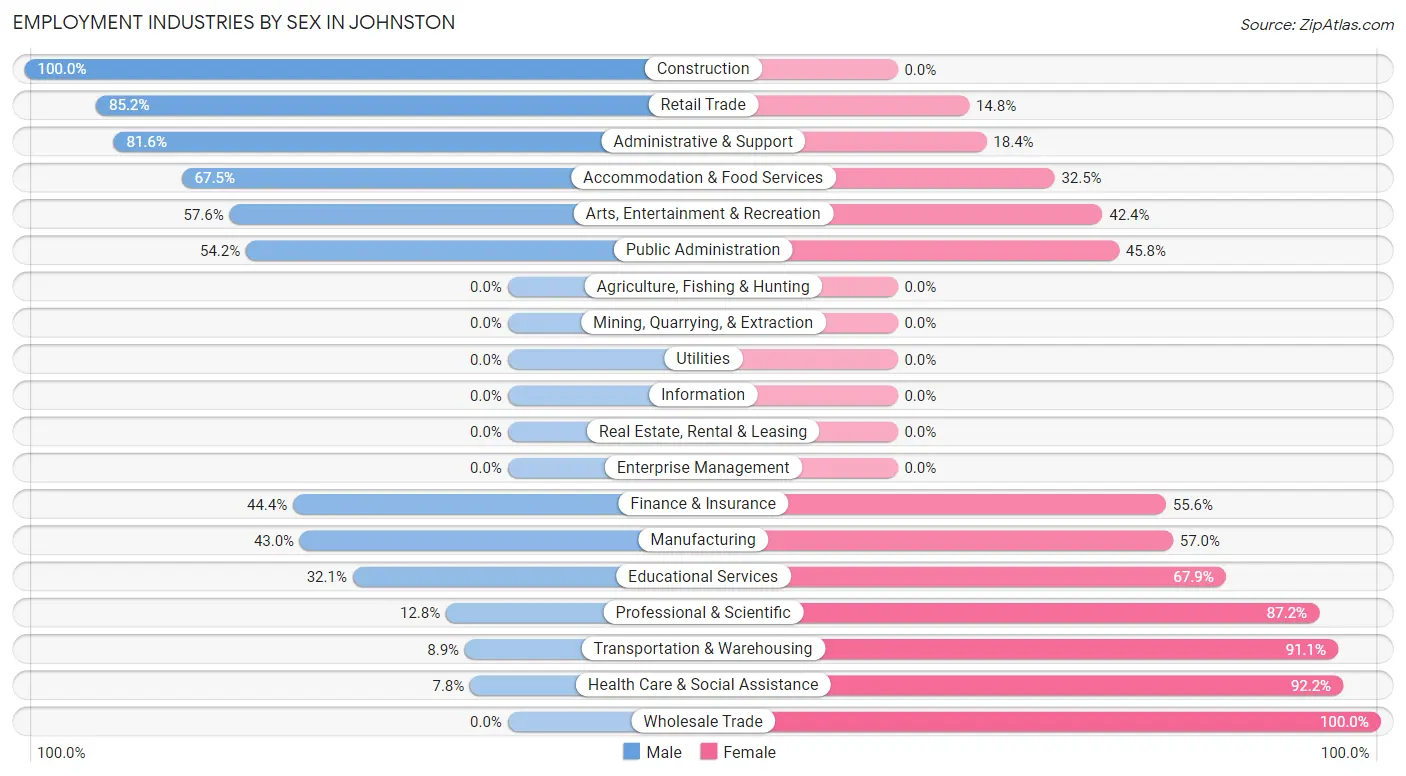
Employment Industries by Sex in Johnston
The Johnston industries that see more men than women are Construction (100.0%), Retail Trade (85.2%), and Administrative & Support (81.6%), whereas the industries that tend to have a higher number of women are Wholesale Trade (100.0%), Health Care & Social Assistance (92.2%), and Transportation & Warehousing (91.1%).
| Industry | Male | Female |
| Agriculture, Fishing & Hunting | 0 (0.0%) | 0 (0.0%) |
| Mining, Quarrying, & Extraction | 0 (0.0%) | 0 (0.0%) |
| Construction | 99 (100.0%) | 0 (0.0%) |
| Manufacturing | 117 (43.0%) | 155 (57.0%) |
| Wholesale Trade | 0 (0.0%) | 6 (100.0%) |
| Retail Trade | 23 (85.2%) | 4 (14.8%) |
| Transportation & Warehousing | 7 (8.9%) | 72 (91.1%) |
| Utilities | 0 (0.0%) | 0 (0.0%) |
| Information | 0 (0.0%) | 0 (0.0%) |
| Finance & Insurance | 4 (44.4%) | 5 (55.6%) |
| Real Estate, Rental & Leasing | 0 (0.0%) | 0 (0.0%) |
| Professional & Scientific | 6 (12.8%) | 41 (87.2%) |
| Enterprise Management | 0 (0.0%) | 0 (0.0%) |
| Administrative & Support | 31 (81.6%) | 7 (18.4%) |
| Educational Services | 17 (32.1%) | 36 (67.9%) |
| Health Care & Social Assistance | 12 (7.8%) | 142 (92.2%) |
| Arts, Entertainment & Recreation | 19 (57.6%) | 14 (42.4%) |
| Accommodation & Food Services | 54 (67.5%) | 26 (32.5%) |
| Public Administration | 13 (54.2%) | 11 (45.8%) |
| Total | 402 (42.1%) | 552 (57.9%) |
Education in Johnston
School Enrollment in Johnston
The most common levels of schooling among the 397 students in Johnston are high school (133 | 33.5%), college / undergraduate (83 | 20.9%), and middle school (72 | 18.1%).
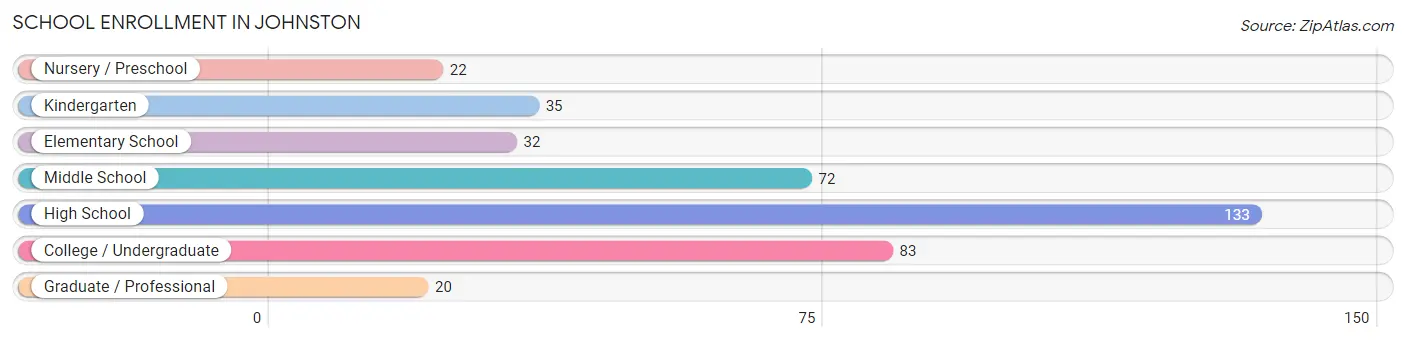
| School Level | # Students | % Students |
| Nursery / Preschool | 22 | 5.5% |
| Kindergarten | 35 | 8.8% |
| Elementary School | 32 | 8.1% |
| Middle School | 72 | 18.1% |
| High School | 133 | 33.5% |
| College / Undergraduate | 83 | 20.9% |
| Graduate / Professional | 20 | 5.0% |
| Total | 397 | 100.0% |
School Enrollment by Age by Funding Source in Johnston
Out of a total of 397 students who are enrolled in schools in Johnston, 57 (14.4%) attend a private institution, while the remaining 340 (85.6%) are enrolled in public schools. The age group of 35 years and over has the highest likelihood of being enrolled in private schools, with 18 (78.3% in the age bracket) enrolled. Conversely, the age group of 5 to 9 year old has the lowest likelihood of being enrolled in a private school, with 67 (100.0% in the age bracket) attending a public institution.
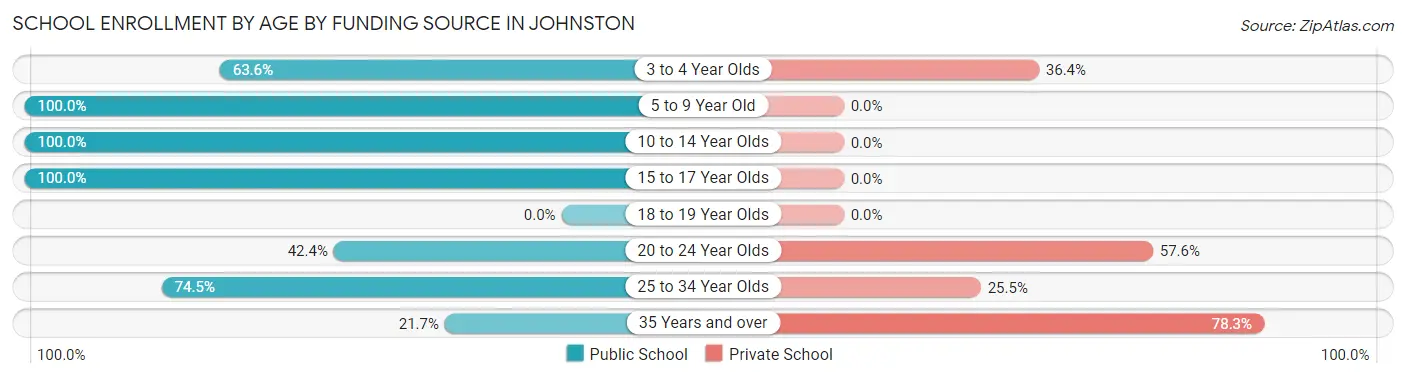
| Age Bracket | Public School | Private School |
| 3 to 4 Year Olds | 14 (63.6%) | 8 (36.4%) |
| 5 to 9 Year Old | 67 (100.0%) | 0 (0.0%) |
| 10 to 14 Year Olds | 116 (100.0%) | 0 (0.0%) |
| 15 to 17 Year Olds | 89 (100.0%) | 0 (0.0%) |
| 18 to 19 Year Olds | 0 (0.0%) | 0 (0.0%) |
| 20 to 24 Year Olds | 14 (42.4%) | 19 (57.6%) |
| 25 to 34 Year Olds | 35 (74.5%) | 12 (25.5%) |
| 35 Years and over | 5 (21.7%) | 18 (78.3%) |
| Total | 340 (85.6%) | 57 (14.4%) |
Educational Attainment by Field of Study in Johnston
Literature & languages (83 | 28.8%), business (44 | 15.3%), education (28 | 9.7%), science & technology (20 | 6.9%), and computers & mathematics (19 | 6.6%) are the most common fields of study among 288 individuals in Johnston who have obtained a bachelor's degree or higher.
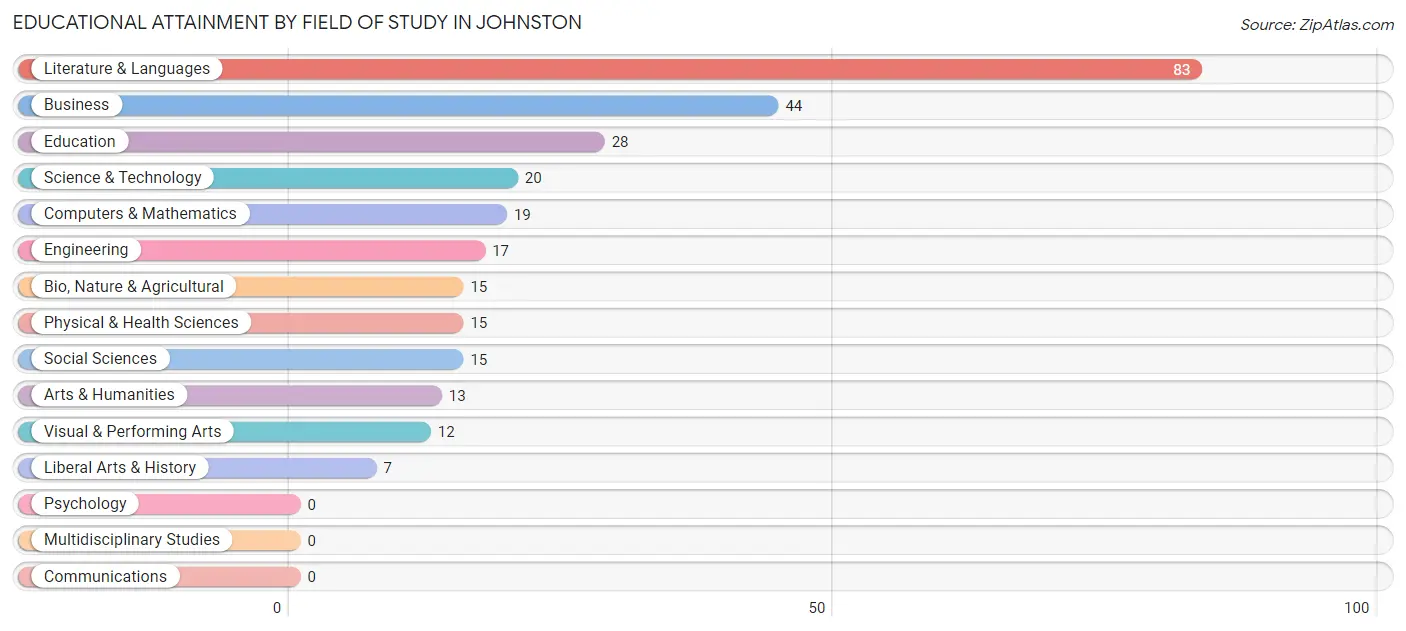
| Field of Study | # Graduates | % Graduates |
| Computers & Mathematics | 19 | 6.6% |
| Bio, Nature & Agricultural | 15 | 5.2% |
| Physical & Health Sciences | 15 | 5.2% |
| Psychology | 0 | 0.0% |
| Social Sciences | 15 | 5.2% |
| Engineering | 17 | 5.9% |
| Multidisciplinary Studies | 0 | 0.0% |
| Science & Technology | 20 | 6.9% |
| Business | 44 | 15.3% |
| Education | 28 | 9.7% |
| Literature & Languages | 83 | 28.8% |
| Liberal Arts & History | 7 | 2.4% |
| Visual & Performing Arts | 12 | 4.2% |
| Communications | 0 | 0.0% |
| Arts & Humanities | 13 | 4.5% |
| Total | 288 | 100.0% |
Transportation & Commute in Johnston
Vehicle Availability by Sex in Johnston
The most prevalent vehicle ownership categories in Johnston are males with 2 vehicles (173, accounting for 43.0%) and females with 2 vehicles (287, making up 31.3%).
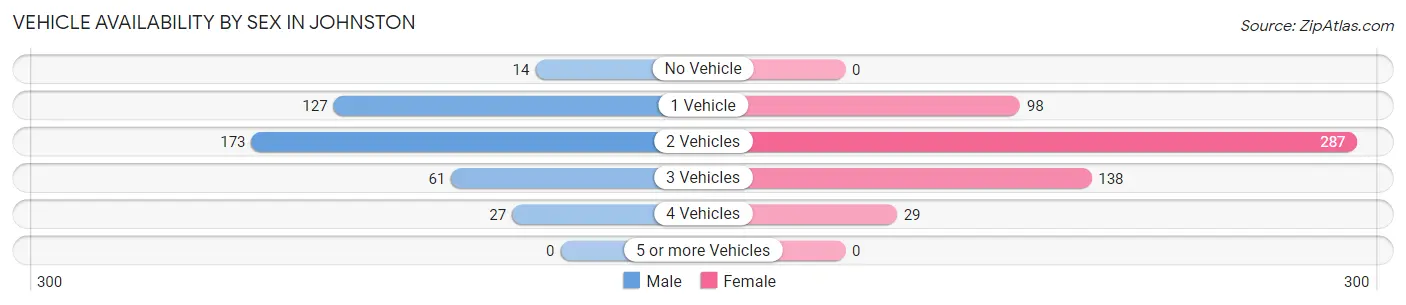
| Vehicles Available | Male | Female |
| No Vehicle | 14 (3.5%) | 0 (0.0%) |
| 1 Vehicle | 127 (31.6%) | 98 (17.7%) |
| 2 Vehicles | 173 (43.0%) | 287 (52.0%) |
| 3 Vehicles | 61 (15.2%) | 138 (25.0%) |
| 4 Vehicles | 27 (6.7%) | 29 (5.2%) |
| 5 or more Vehicles | 0 (0.0%) | 0 (0.0%) |
| Total | 402 (100.0%) | 552 (100.0%) |
Commute Time in Johnston
The most frequently occuring commute durations in Johnston are 15 to 19 minutes (186 commuters, 20.2%), 45 to 59 minutes (135 commuters, 14.6%), and 10 to 14 minutes (125 commuters, 13.5%).
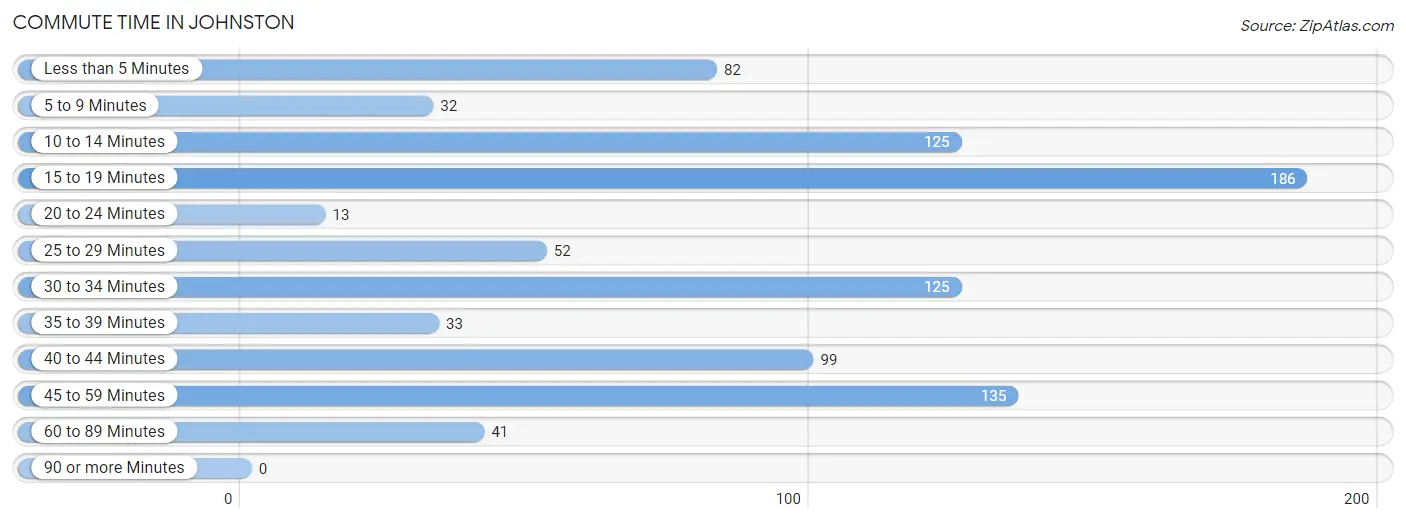
| Commute Time | # Commuters | % Commuters |
| Less than 5 Minutes | 82 | 8.9% |
| 5 to 9 Minutes | 32 | 3.5% |
| 10 to 14 Minutes | 125 | 13.5% |
| 15 to 19 Minutes | 186 | 20.2% |
| 20 to 24 Minutes | 13 | 1.4% |
| 25 to 29 Minutes | 52 | 5.6% |
| 30 to 34 Minutes | 125 | 13.5% |
| 35 to 39 Minutes | 33 | 3.6% |
| 40 to 44 Minutes | 99 | 10.7% |
| 45 to 59 Minutes | 135 | 14.6% |
| 60 to 89 Minutes | 41 | 4.4% |
| 90 or more Minutes | 0 | 0.0% |
Commute Time by Sex in Johnston
The most common commute times in Johnston are 45 to 59 minutes (90 commuters, 22.6%) for males and 15 to 19 minutes (138 commuters, 26.3%) for females.
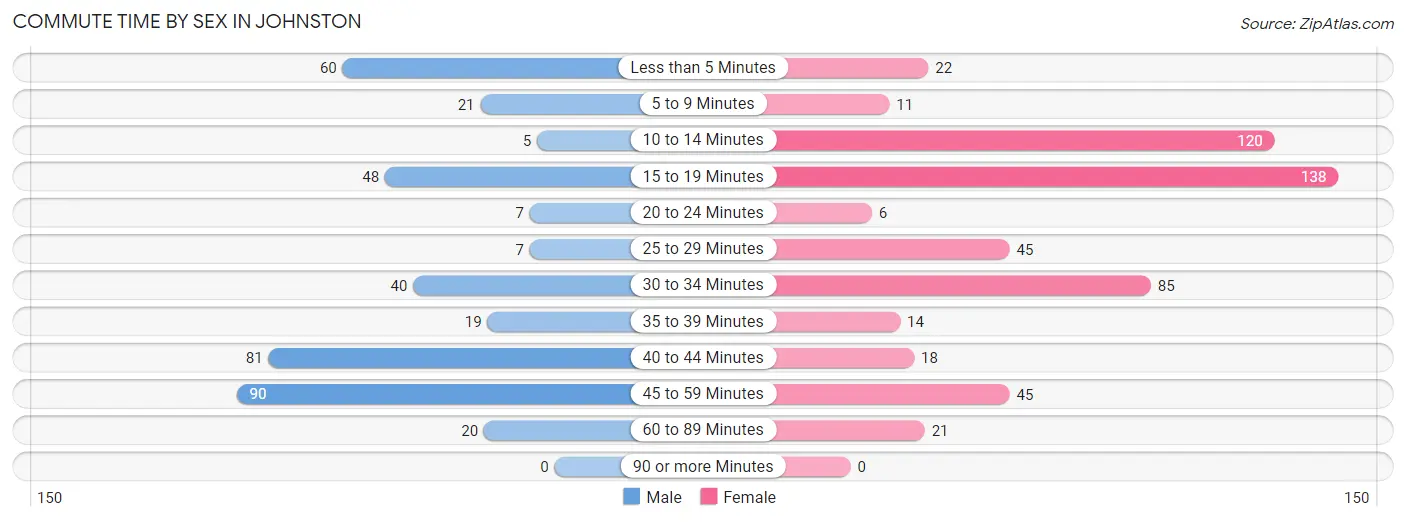
| Commute Time | Male | Female |
| Less than 5 Minutes | 60 (15.1%) | 22 (4.2%) |
| 5 to 9 Minutes | 21 (5.3%) | 11 (2.1%) |
| 10 to 14 Minutes | 5 (1.3%) | 120 (22.9%) |
| 15 to 19 Minutes | 48 (12.1%) | 138 (26.3%) |
| 20 to 24 Minutes | 7 (1.8%) | 6 (1.1%) |
| 25 to 29 Minutes | 7 (1.8%) | 45 (8.6%) |
| 30 to 34 Minutes | 40 (10.1%) | 85 (16.2%) |
| 35 to 39 Minutes | 19 (4.8%) | 14 (2.7%) |
| 40 to 44 Minutes | 81 (20.3%) | 18 (3.4%) |
| 45 to 59 Minutes | 90 (22.6%) | 45 (8.6%) |
| 60 to 89 Minutes | 20 (5.0%) | 21 (4.0%) |
| 90 or more Minutes | 0 (0.0%) | 0 (0.0%) |
Time of Departure to Work by Sex in Johnston
The most frequent times of departure to work in Johnston are 8:00 AM to 8:29 AM (81, 20.3%) for males and 7:30 AM to 7:59 AM (122, 23.2%) for females.
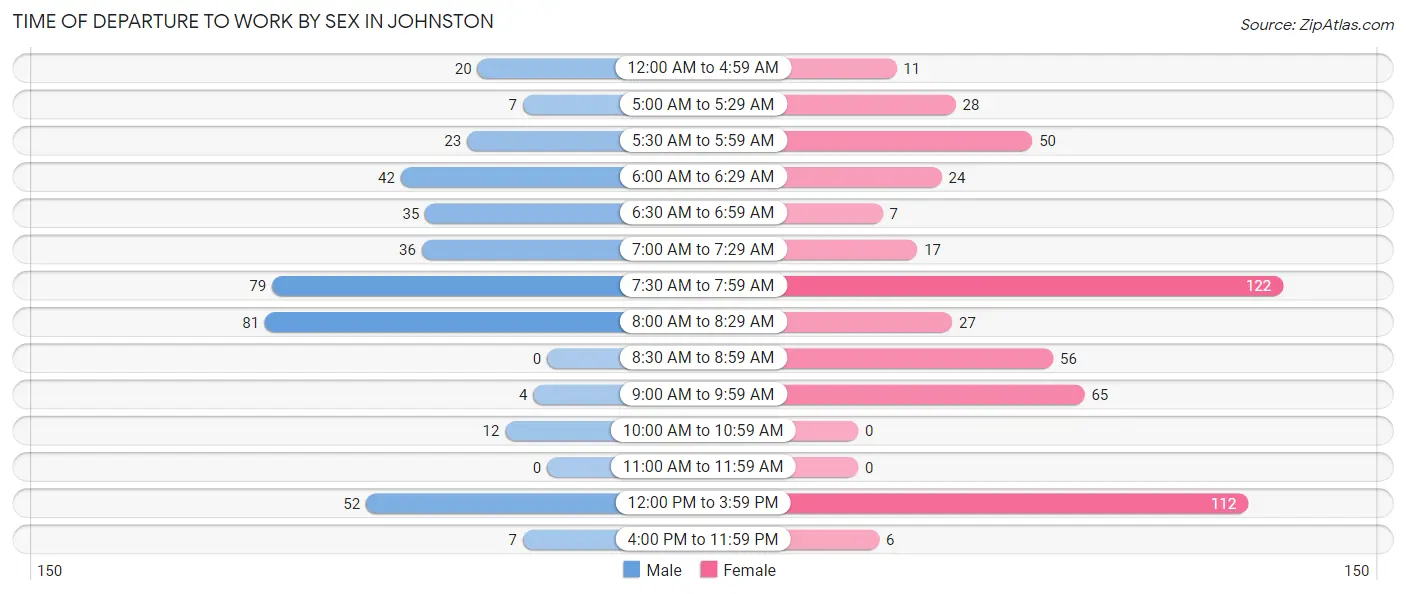
| Time of Departure | Male | Female |
| 12:00 AM to 4:59 AM | 20 (5.0%) | 11 (2.1%) |
| 5:00 AM to 5:29 AM | 7 (1.8%) | 28 (5.3%) |
| 5:30 AM to 5:59 AM | 23 (5.8%) | 50 (9.5%) |
| 6:00 AM to 6:29 AM | 42 (10.5%) | 24 (4.6%) |
| 6:30 AM to 6:59 AM | 35 (8.8%) | 7 (1.3%) |
| 7:00 AM to 7:29 AM | 36 (9.0%) | 17 (3.2%) |
| 7:30 AM to 7:59 AM | 79 (19.9%) | 122 (23.2%) |
| 8:00 AM to 8:29 AM | 81 (20.3%) | 27 (5.1%) |
| 8:30 AM to 8:59 AM | 0 (0.0%) | 56 (10.7%) |
| 9:00 AM to 9:59 AM | 4 (1.0%) | 65 (12.4%) |
| 10:00 AM to 10:59 AM | 12 (3.0%) | 0 (0.0%) |
| 11:00 AM to 11:59 AM | 0 (0.0%) | 0 (0.0%) |
| 12:00 PM to 3:59 PM | 52 (13.1%) | 112 (21.3%) |
| 4:00 PM to 11:59 PM | 7 (1.8%) | 6 (1.1%) |
| Total | 398 (100.0%) | 525 (100.0%) |
Housing Occupancy in Johnston
Occupancy by Ownership in Johnston
Of the total 1,095 dwellings in Johnston, owner-occupied units account for 590 (53.9%), while renter-occupied units make up 505 (46.1%).
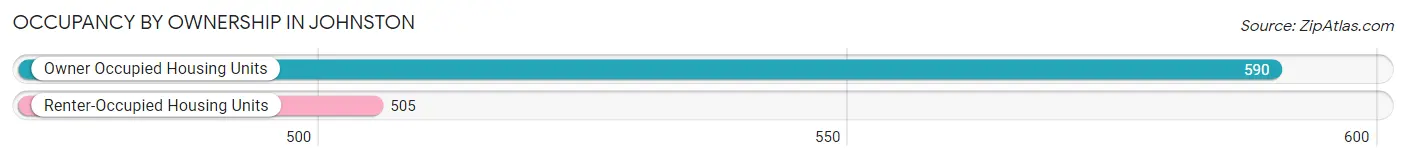
| Occupancy | # Housing Units | % Housing Units |
| Owner Occupied Housing Units | 590 | 53.9% |
| Renter-Occupied Housing Units | 505 | 46.1% |
| Total Occupied Housing Units | 1,095 | 100.0% |
Occupancy by Household Size in Johnston
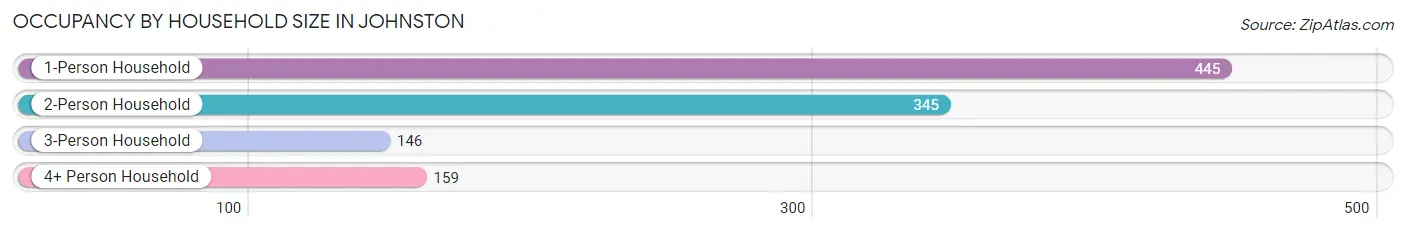
| Household Size | # Housing Units | % Housing Units |
| 1-Person Household | 445 | 40.6% |
| 2-Person Household | 345 | 31.5% |
| 3-Person Household | 146 | 13.3% |
| 4+ Person Household | 159 | 14.5% |
| Total Housing Units | 1,095 | 100.0% |
Occupancy by Ownership by Household Size in Johnston
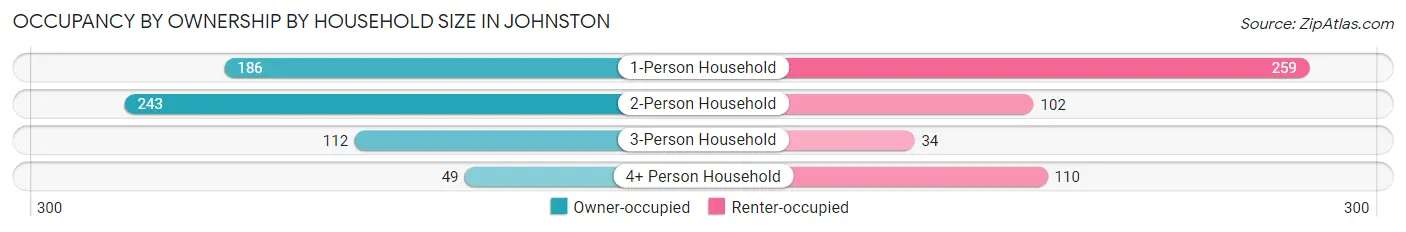
| Household Size | Owner-occupied | Renter-occupied |
| 1-Person Household | 186 (41.8%) | 259 (58.2%) |
| 2-Person Household | 243 (70.4%) | 102 (29.6%) |
| 3-Person Household | 112 (76.7%) | 34 (23.3%) |
| 4+ Person Household | 49 (30.8%) | 110 (69.2%) |
| Total Housing Units | 590 (53.9%) | 505 (46.1%) |
Occupancy by Educational Attainment in Johnston
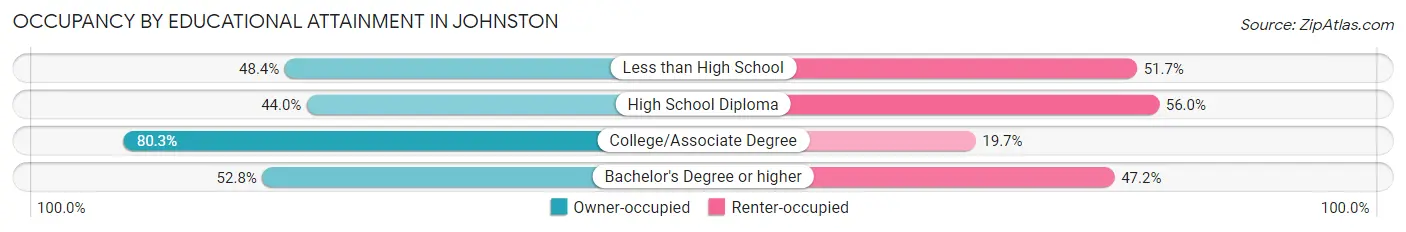
| Household Size | Owner-occupied | Renter-occupied |
| Less than High School | 117 (48.3%) | 125 (51.6%) |
| High School Diploma | 215 (44.0%) | 274 (56.0%) |
| College/Associate Degree | 192 (80.3%) | 47 (19.7%) |
| Bachelor's Degree or higher | 66 (52.8%) | 59 (47.2%) |
Occupancy by Age of Householder in Johnston
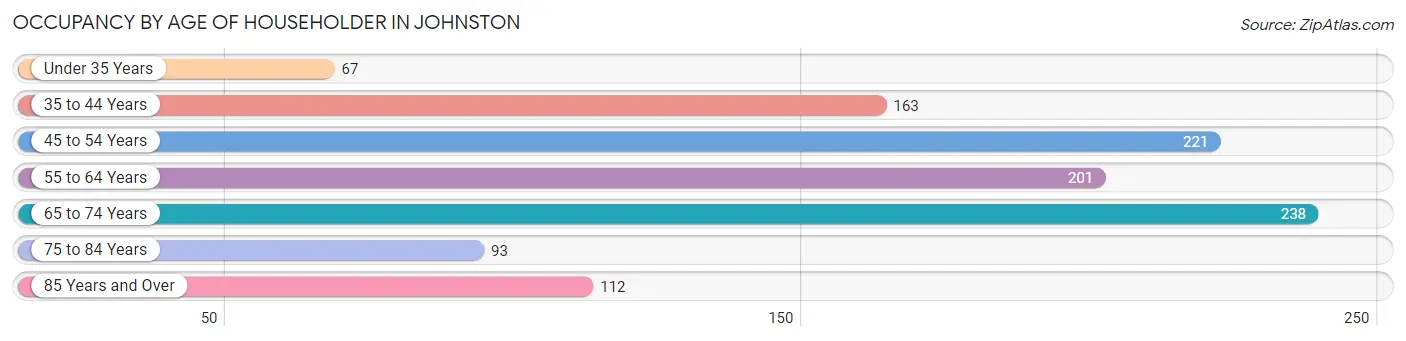
| Age Bracket | # Households | % Households |
| Under 35 Years | 67 | 6.1% |
| 35 to 44 Years | 163 | 14.9% |
| 45 to 54 Years | 221 | 20.2% |
| 55 to 64 Years | 201 | 18.4% |
| 65 to 74 Years | 238 | 21.7% |
| 75 to 84 Years | 93 | 8.5% |
| 85 Years and Over | 112 | 10.2% |
| Total | 1,095 | 100.0% |
Housing Finances in Johnston
Median Income by Occupancy in Johnston
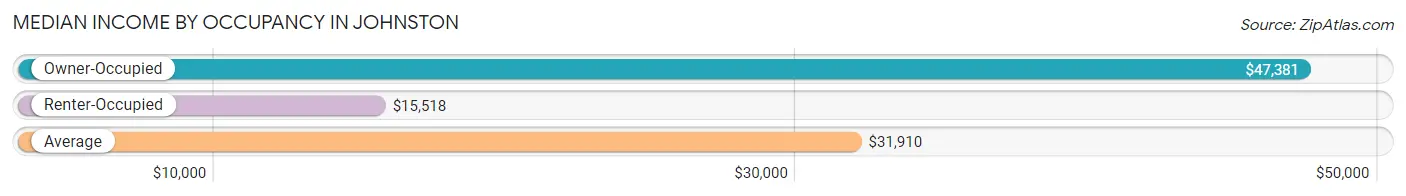
| Occupancy Type | # Households | Median Income |
| Owner-Occupied | 590 (53.9%) | $47,381 |
| Renter-Occupied | 505 (46.1%) | $15,518 |
| Average | 1,095 (100.0%) | $31,910 |
Occupancy by Householder Income Bracket in Johnston
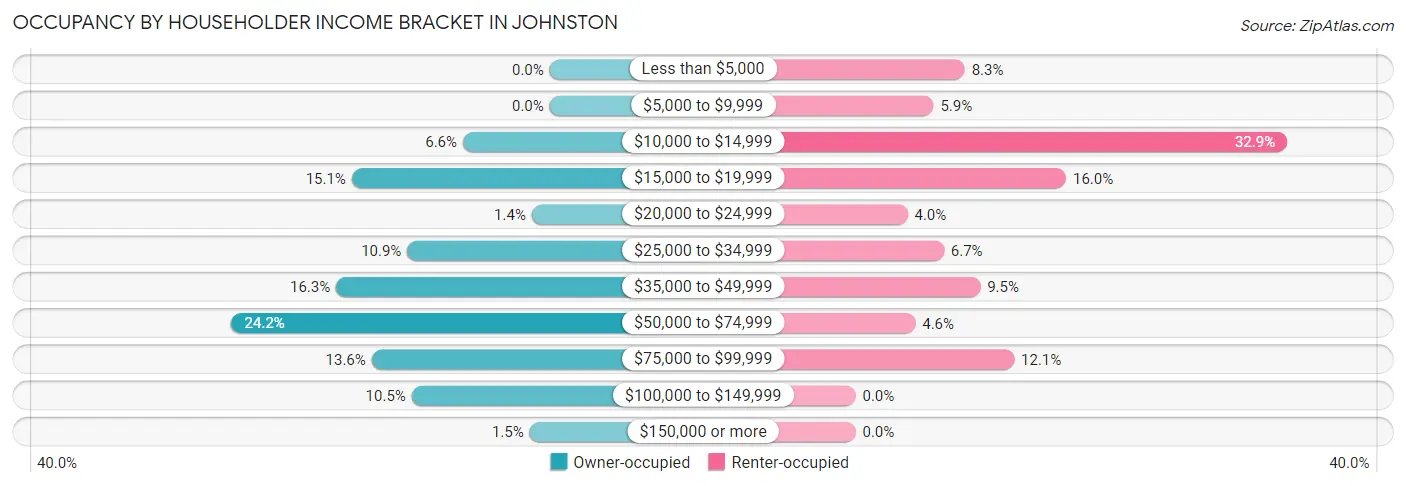
| Income Bracket | Owner-occupied | Renter-occupied |
| Less than $5,000 | 0 (0.0%) | 42 (8.3%) |
| $5,000 to $9,999 | 0 (0.0%) | 30 (5.9%) |
| $10,000 to $14,999 | 39 (6.6%) | 166 (32.9%) |
| $15,000 to $19,999 | 89 (15.1%) | 81 (16.0%) |
| $20,000 to $24,999 | 8 (1.4%) | 20 (4.0%) |
| $25,000 to $34,999 | 64 (10.8%) | 34 (6.7%) |
| $35,000 to $49,999 | 96 (16.3%) | 48 (9.5%) |
| $50,000 to $74,999 | 143 (24.2%) | 23 (4.5%) |
| $75,000 to $99,999 | 80 (13.6%) | 61 (12.1%) |
| $100,000 to $149,999 | 62 (10.5%) | 0 (0.0%) |
| $150,000 or more | 9 (1.5%) | 0 (0.0%) |
| Total | 590 (100.0%) | 505 (100.0%) |
Monthly Housing Cost Tiers in Johnston
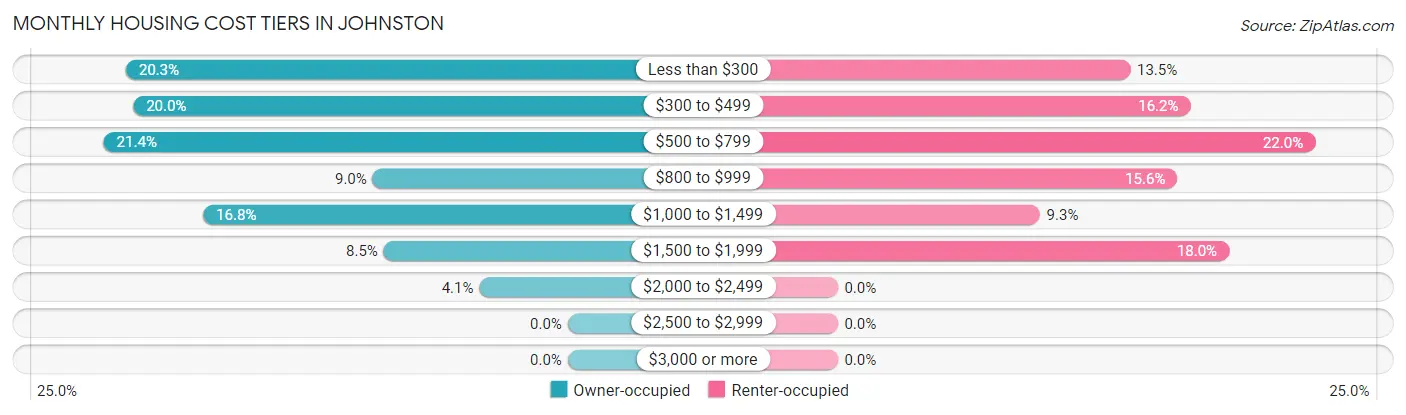
| Monthly Cost | Owner-occupied | Renter-occupied |
| Less than $300 | 120 (20.3%) | 68 (13.5%) |
| $300 to $499 | 118 (20.0%) | 82 (16.2%) |
| $500 to $799 | 126 (21.4%) | 111 (22.0%) |
| $800 to $999 | 53 (9.0%) | 79 (15.6%) |
| $1,000 to $1,499 | 99 (16.8%) | 47 (9.3%) |
| $1,500 to $1,999 | 50 (8.5%) | 91 (18.0%) |
| $2,000 to $2,499 | 24 (4.1%) | 0 (0.0%) |
| $2,500 to $2,999 | 0 (0.0%) | 0 (0.0%) |
| $3,000 or more | 0 (0.0%) | 0 (0.0%) |
| Total | 590 (100.0%) | 505 (100.0%) |
Physical Housing Characteristics in Johnston
Housing Structures in Johnston
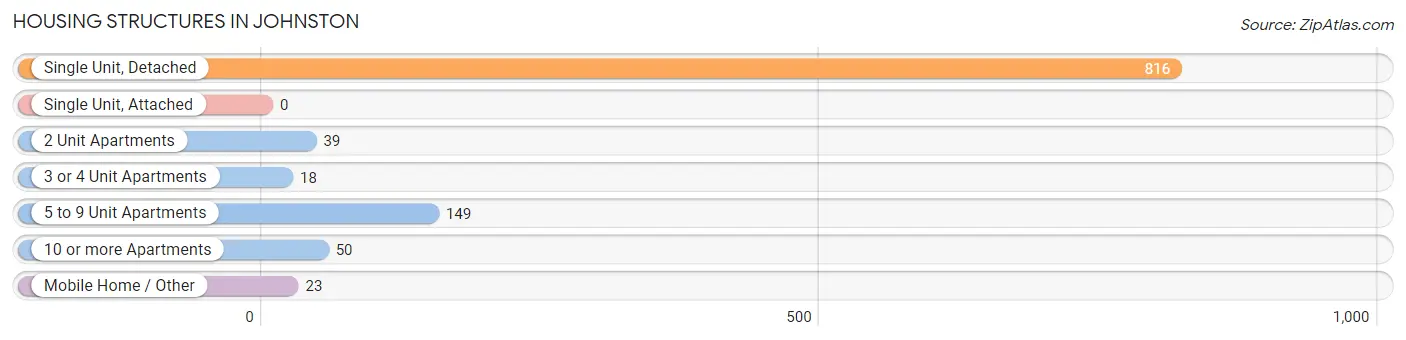
| Structure Type | # Housing Units | % Housing Units |
| Single Unit, Detached | 816 | 74.5% |
| Single Unit, Attached | 0 | 0.0% |
| 2 Unit Apartments | 39 | 3.6% |
| 3 or 4 Unit Apartments | 18 | 1.6% |
| 5 to 9 Unit Apartments | 149 | 13.6% |
| 10 or more Apartments | 50 | 4.6% |
| Mobile Home / Other | 23 | 2.1% |
| Total | 1,095 | 100.0% |
Housing Structures by Occupancy in Johnston
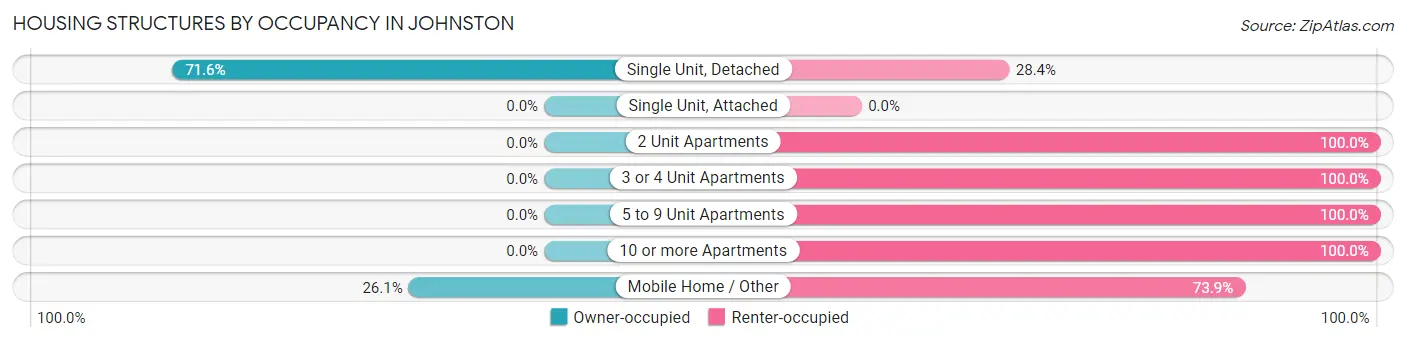
| Structure Type | Owner-occupied | Renter-occupied |
| Single Unit, Detached | 584 (71.6%) | 232 (28.4%) |
| Single Unit, Attached | 0 (0.0%) | 0 (0.0%) |
| 2 Unit Apartments | 0 (0.0%) | 39 (100.0%) |
| 3 or 4 Unit Apartments | 0 (0.0%) | 18 (100.0%) |
| 5 to 9 Unit Apartments | 0 (0.0%) | 149 (100.0%) |
| 10 or more Apartments | 0 (0.0%) | 50 (100.0%) |
| Mobile Home / Other | 6 (26.1%) | 17 (73.9%) |
| Total | 590 (53.9%) | 505 (46.1%) |
Housing Structures by Number of Rooms in Johnston
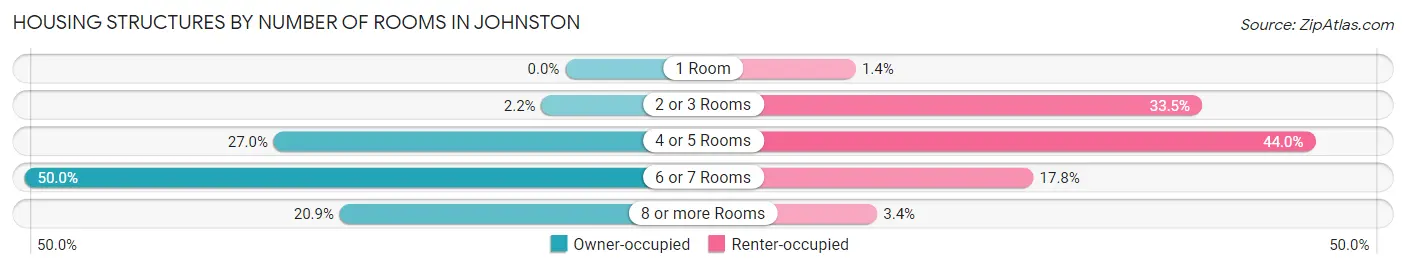
| Number of Rooms | Owner-occupied | Renter-occupied |
| 1 Room | 0 (0.0%) | 7 (1.4%) |
| 2 or 3 Rooms | 13 (2.2%) | 169 (33.5%) |
| 4 or 5 Rooms | 159 (27.0%) | 222 (44.0%) |
| 6 or 7 Rooms | 295 (50.0%) | 90 (17.8%) |
| 8 or more Rooms | 123 (20.8%) | 17 (3.4%) |
| Total | 590 (100.0%) | 505 (100.0%) |
Housing Structure by Heating Type in Johnston
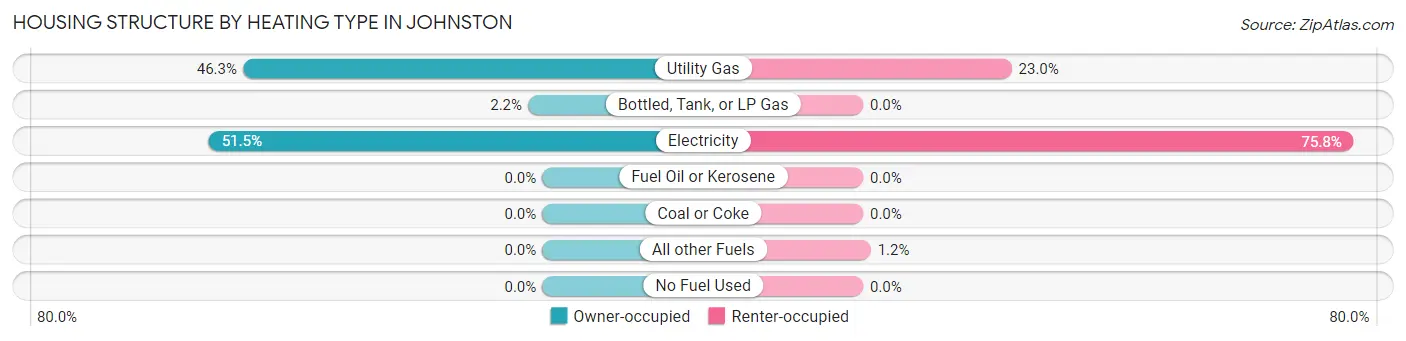
| Heating Type | Owner-occupied | Renter-occupied |
| Utility Gas | 273 (46.3%) | 116 (23.0%) |
| Bottled, Tank, or LP Gas | 13 (2.2%) | 0 (0.0%) |
| Electricity | 304 (51.5%) | 383 (75.8%) |
| Fuel Oil or Kerosene | 0 (0.0%) | 0 (0.0%) |
| Coal or Coke | 0 (0.0%) | 0 (0.0%) |
| All other Fuels | 0 (0.0%) | 6 (1.2%) |
| No Fuel Used | 0 (0.0%) | 0 (0.0%) |
| Total | 590 (100.0%) | 505 (100.0%) |
Household Vehicle Usage in Johnston
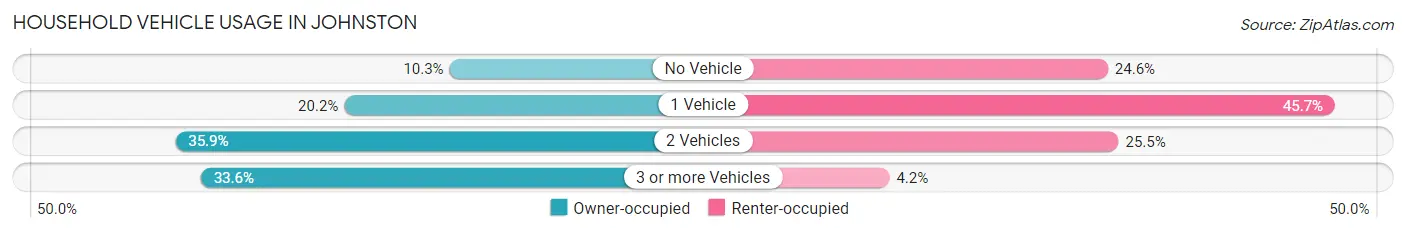
| Vehicles per Household | Owner-occupied | Renter-occupied |
| No Vehicle | 61 (10.3%) | 124 (24.5%) |
| 1 Vehicle | 119 (20.2%) | 231 (45.7%) |
| 2 Vehicles | 212 (35.9%) | 129 (25.5%) |
| 3 or more Vehicles | 198 (33.6%) | 21 (4.2%) |
| Total | 590 (100.0%) | 505 (100.0%) |
Real Estate & Mortgages in Johnston
Real Estate and Mortgage Overview in Johnston
| Characteristic | Without Mortgage | With Mortgage |
| Housing Units | 300 | 290 |
| Median Property Value | $68,700 | $135,600 |
| Median Household Income | $43,409 | $9 |
| Monthly Housing Costs | $347 | $0 |
| Real Estate Taxes | $480 | $0 |
Property Value by Mortgage Status in Johnston
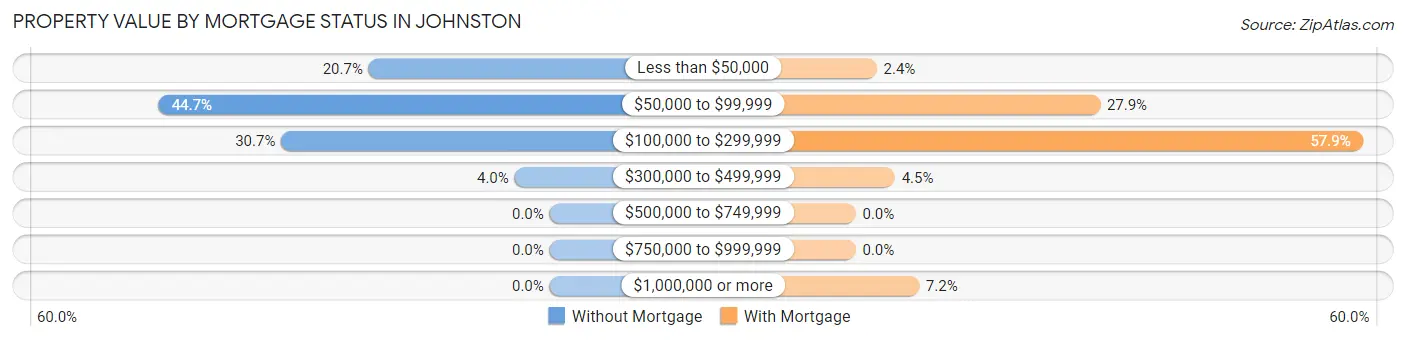
| Property Value | Without Mortgage | With Mortgage |
| Less than $50,000 | 62 (20.7%) | 7 (2.4%) |
| $50,000 to $99,999 | 134 (44.7%) | 81 (27.9%) |
| $100,000 to $299,999 | 92 (30.7%) | 168 (57.9%) |
| $300,000 to $499,999 | 12 (4.0%) | 13 (4.5%) |
| $500,000 to $749,999 | 0 (0.0%) | 0 (0.0%) |
| $750,000 to $999,999 | 0 (0.0%) | 0 (0.0%) |
| $1,000,000 or more | 0 (0.0%) | 21 (7.2%) |
| Total | 300 (100.0%) | 290 (100.0%) |
Household Income by Mortgage Status in Johnston
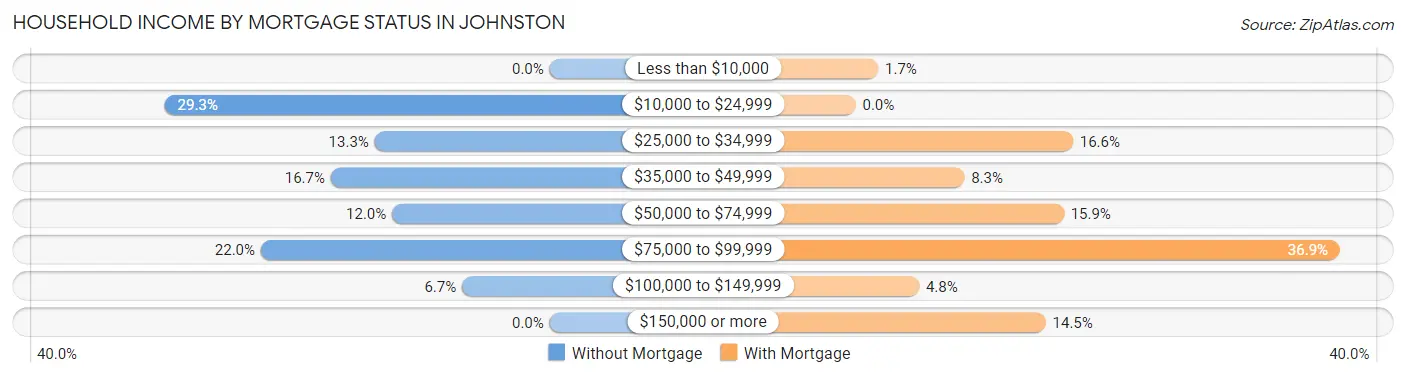
| Household Income | Without Mortgage | With Mortgage |
| Less than $10,000 | 0 (0.0%) | 5 (1.7%) |
| $10,000 to $24,999 | 88 (29.3%) | 0 (0.0%) |
| $25,000 to $34,999 | 40 (13.3%) | 48 (16.6%) |
| $35,000 to $49,999 | 50 (16.7%) | 24 (8.3%) |
| $50,000 to $74,999 | 36 (12.0%) | 46 (15.9%) |
| $75,000 to $99,999 | 66 (22.0%) | 107 (36.9%) |
| $100,000 to $149,999 | 20 (6.7%) | 14 (4.8%) |
| $150,000 or more | 0 (0.0%) | 42 (14.5%) |
| Total | 300 (100.0%) | 290 (100.0%) |
Property Value to Household Income Ratio in Johnston
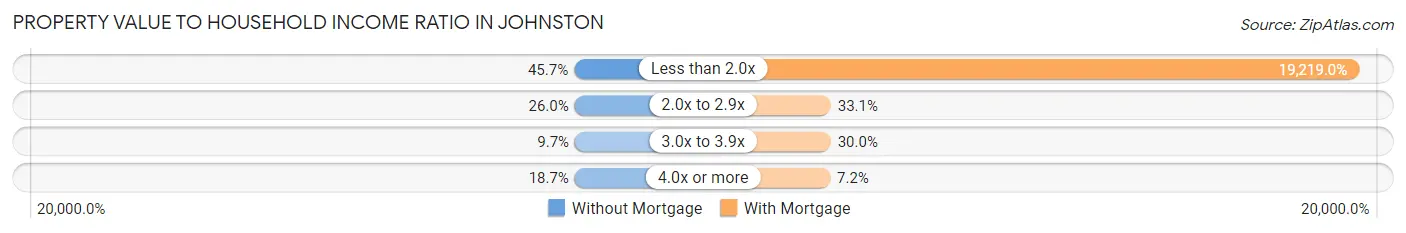
| Value-to-Income Ratio | Without Mortgage | With Mortgage |
| Less than 2.0x | 137 (45.7%) | 55,735 (19,219.0%) |
| 2.0x to 2.9x | 78 (26.0%) | 96 (33.1%) |
| 3.0x to 3.9x | 29 (9.7%) | 87 (30.0%) |
| 4.0x or more | 56 (18.7%) | 21 (7.2%) |
| Total | 300 (100.0%) | 290 (100.0%) |
Real Estate Taxes by Mortgage Status in Johnston
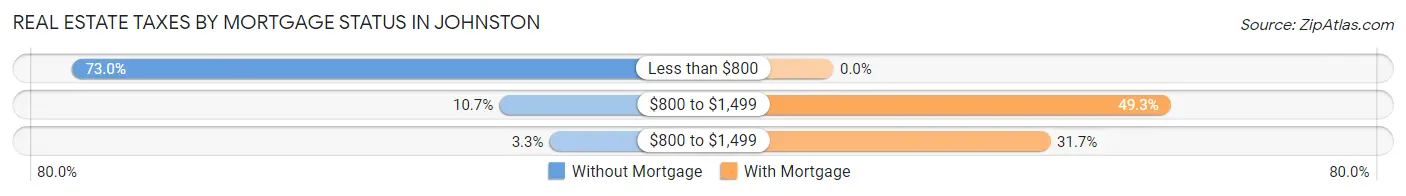
| Property Taxes | Without Mortgage | With Mortgage |
| Less than $800 | 219 (73.0%) | 0 (0.0%) |
| $800 to $1,499 | 32 (10.7%) | 143 (49.3%) |
| $800 to $1,499 | 10 (3.3%) | 92 (31.7%) |
| Total | 300 (100.0%) | 290 (100.0%) |
Health & Disability in Johnston
Health Insurance Coverage by Age in Johnston
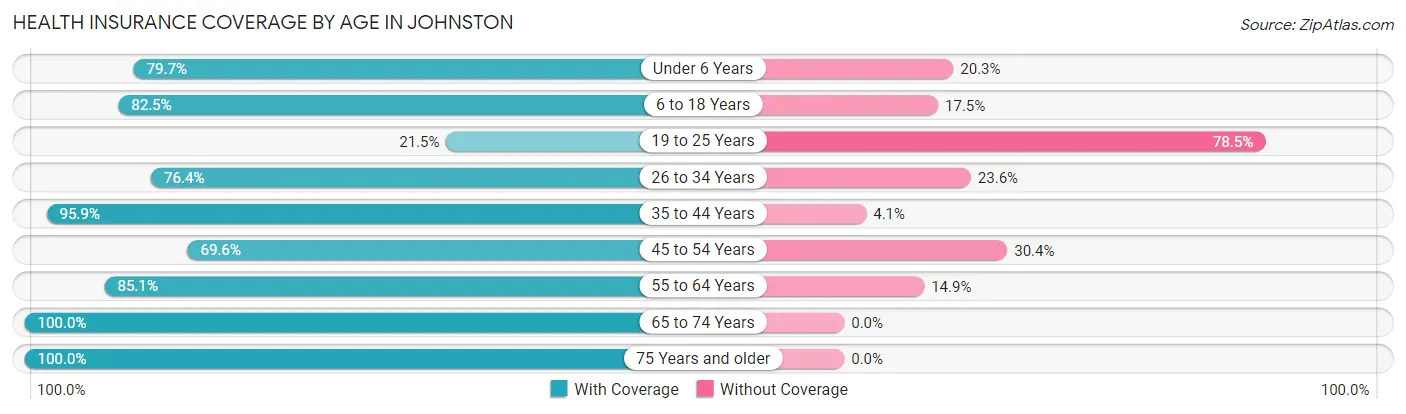
| Age Bracket | With Coverage | Without Coverage |
| Under 6 Years | 141 (79.7%) | 36 (20.3%) |
| 6 to 18 Years | 217 (82.5%) | 46 (17.5%) |
| 19 to 25 Years | 42 (21.5%) | 153 (78.5%) |
| 26 to 34 Years | 178 (76.4%) | 55 (23.6%) |
| 35 to 44 Years | 187 (95.9%) | 8 (4.1%) |
| 45 to 54 Years | 261 (69.6%) | 114 (30.4%) |
| 55 to 64 Years | 274 (85.1%) | 48 (14.9%) |
| 65 to 74 Years | 375 (100.0%) | 0 (0.0%) |
| 75 Years and older | 240 (100.0%) | 0 (0.0%) |
| Total | 1,915 (80.6%) | 460 (19.4%) |
Health Insurance Coverage by Citizenship Status in Johnston
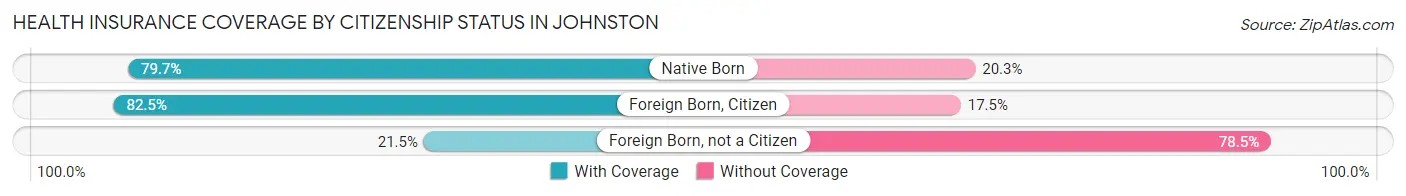
| Citizenship Status | With Coverage | Without Coverage |
| Native Born | 141 (79.7%) | 36 (20.3%) |
| Foreign Born, Citizen | 217 (82.5%) | 46 (17.5%) |
| Foreign Born, not a Citizen | 42 (21.5%) | 153 (78.5%) |
Health Insurance Coverage by Household Income in Johnston
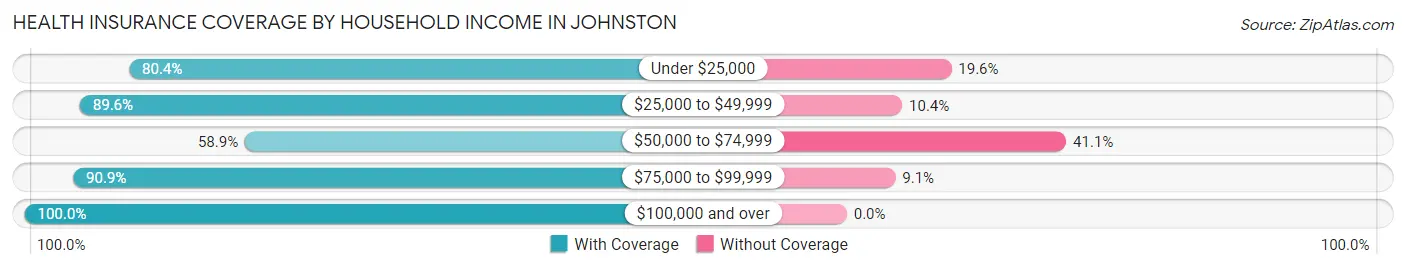
| Household Income | With Coverage | Without Coverage |
| Under $25,000 | 632 (80.4%) | 154 (19.6%) |
| $25,000 to $49,999 | 450 (89.6%) | 52 (10.4%) |
| $50,000 to $74,999 | 311 (58.9%) | 217 (41.1%) |
| $75,000 to $99,999 | 370 (90.9%) | 37 (9.1%) |
| $100,000 and over | 152 (100.0%) | 0 (0.0%) |
Public vs Private Health Insurance Coverage by Age in Johnston
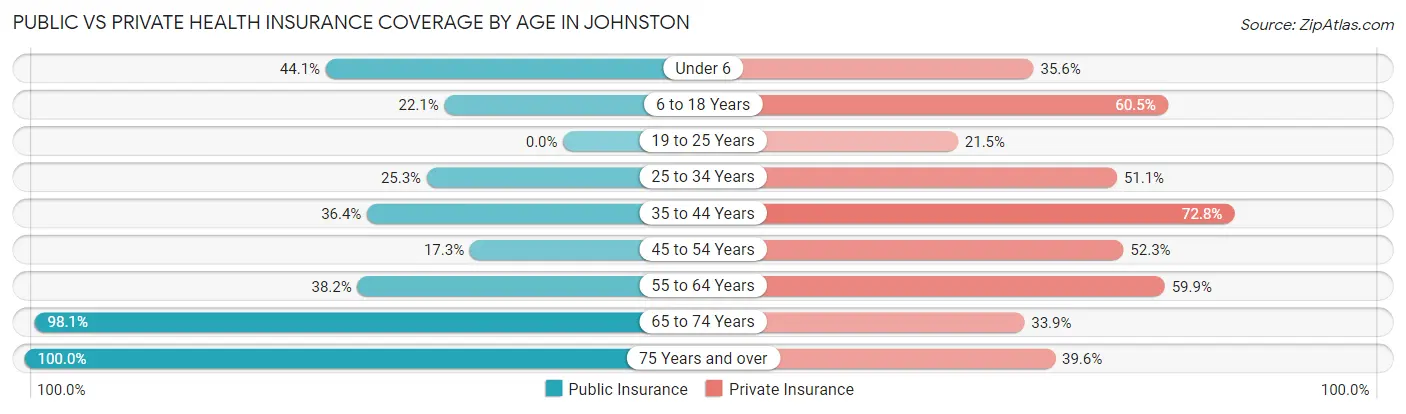
| Age Bracket | Public Insurance | Private Insurance |
| Under 6 | 78 (44.1%) | 63 (35.6%) |
| 6 to 18 Years | 58 (22.1%) | 159 (60.5%) |
| 19 to 25 Years | 0 (0.0%) | 42 (21.5%) |
| 25 to 34 Years | 59 (25.3%) | 119 (51.1%) |
| 35 to 44 Years | 71 (36.4%) | 142 (72.8%) |
| 45 to 54 Years | 65 (17.3%) | 196 (52.3%) |
| 55 to 64 Years | 123 (38.2%) | 193 (59.9%) |
| 65 to 74 Years | 368 (98.1%) | 127 (33.9%) |
| 75 Years and over | 240 (100.0%) | 95 (39.6%) |
| Total | 1,062 (44.7%) | 1,136 (47.8%) |
Disability Status by Sex by Age in Johnston
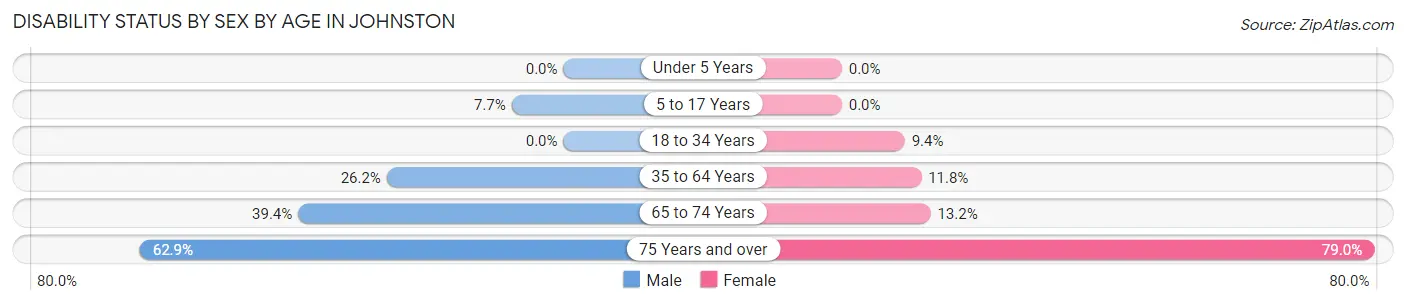
| Age Bracket | Male | Female |
| Under 5 Years | 0 (0.0%) | 0 (0.0%) |
| 5 to 17 Years | 15 (7.7%) | 0 (0.0%) |
| 18 to 34 Years | 0 (0.0%) | 20 (9.3%) |
| 35 to 64 Years | 96 (26.2%) | 62 (11.8%) |
| 65 to 74 Years | 52 (39.4%) | 32 (13.2%) |
| 75 Years and over | 61 (62.9%) | 113 (79.0%) |
Disability Class by Sex by Age in Johnston
Disability Class: Hearing Difficulty
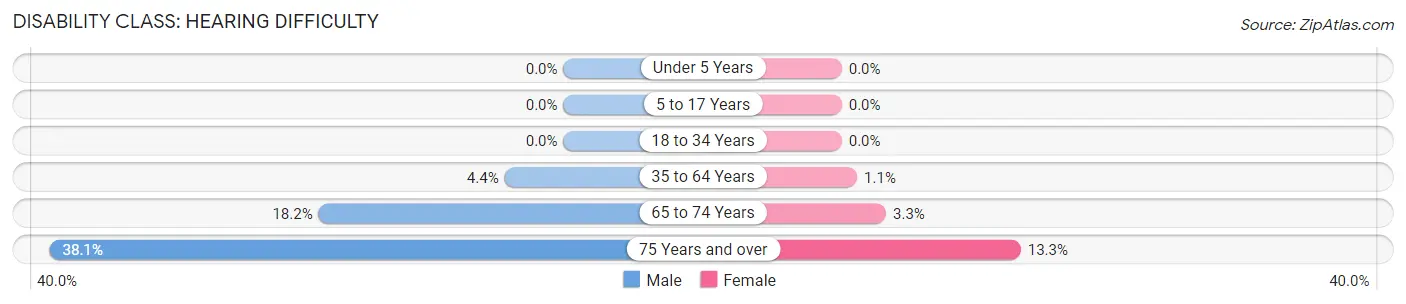
| Age Bracket | Male | Female |
| Under 5 Years | 0 (0.0%) | 0 (0.0%) |
| 5 to 17 Years | 0 (0.0%) | 0 (0.0%) |
| 18 to 34 Years | 0 (0.0%) | 0 (0.0%) |
| 35 to 64 Years | 16 (4.4%) | 6 (1.1%) |
| 65 to 74 Years | 24 (18.2%) | 8 (3.3%) |
| 75 Years and over | 37 (38.1%) | 19 (13.3%) |
Disability Class: Vision Difficulty
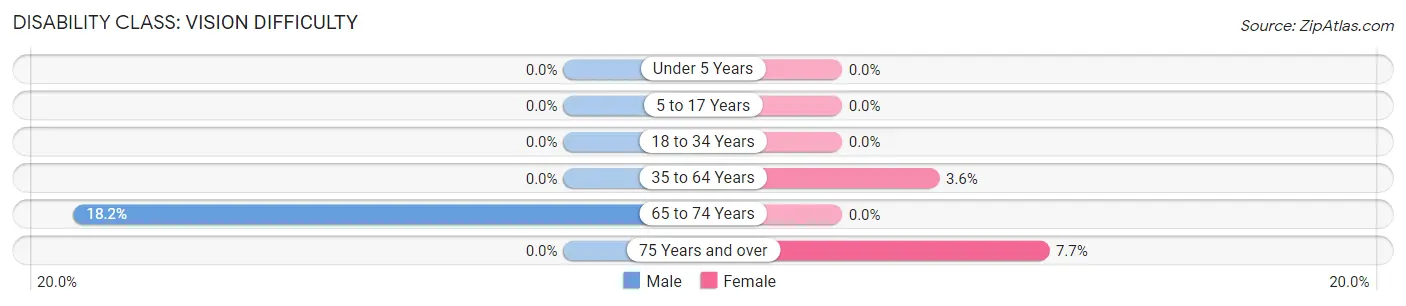
| Age Bracket | Male | Female |
| Under 5 Years | 0 (0.0%) | 0 (0.0%) |
| 5 to 17 Years | 0 (0.0%) | 0 (0.0%) |
| 18 to 34 Years | 0 (0.0%) | 0 (0.0%) |
| 35 to 64 Years | 0 (0.0%) | 19 (3.6%) |
| 65 to 74 Years | 24 (18.2%) | 0 (0.0%) |
| 75 Years and over | 0 (0.0%) | 11 (7.7%) |
Disability Class: Cognitive Difficulty
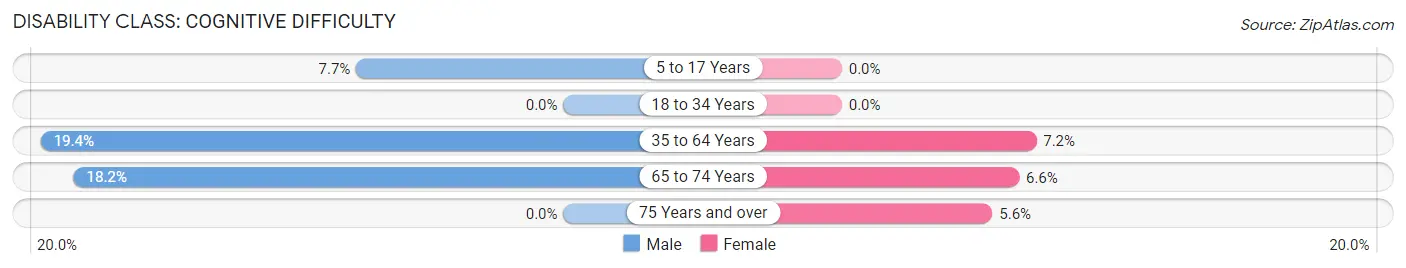
| Age Bracket | Male | Female |
| 5 to 17 Years | 15 (7.7%) | 0 (0.0%) |
| 18 to 34 Years | 0 (0.0%) | 0 (0.0%) |
| 35 to 64 Years | 71 (19.4%) | 38 (7.2%) |
| 65 to 74 Years | 24 (18.2%) | 16 (6.6%) |
| 75 Years and over | 0 (0.0%) | 8 (5.6%) |
Disability Class: Ambulatory Difficulty
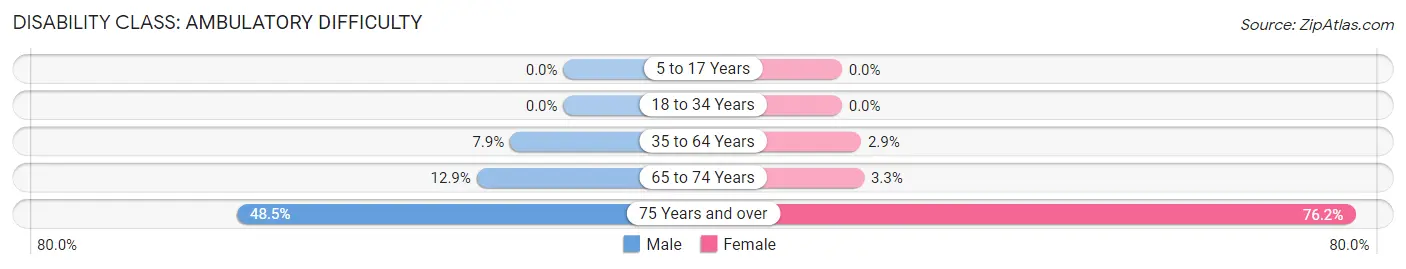
| Age Bracket | Male | Female |
| 5 to 17 Years | 0 (0.0%) | 0 (0.0%) |
| 18 to 34 Years | 0 (0.0%) | 0 (0.0%) |
| 35 to 64 Years | 29 (7.9%) | 15 (2.9%) |
| 65 to 74 Years | 17 (12.9%) | 8 (3.3%) |
| 75 Years and over | 47 (48.4%) | 109 (76.2%) |
Disability Class: Self-Care Difficulty
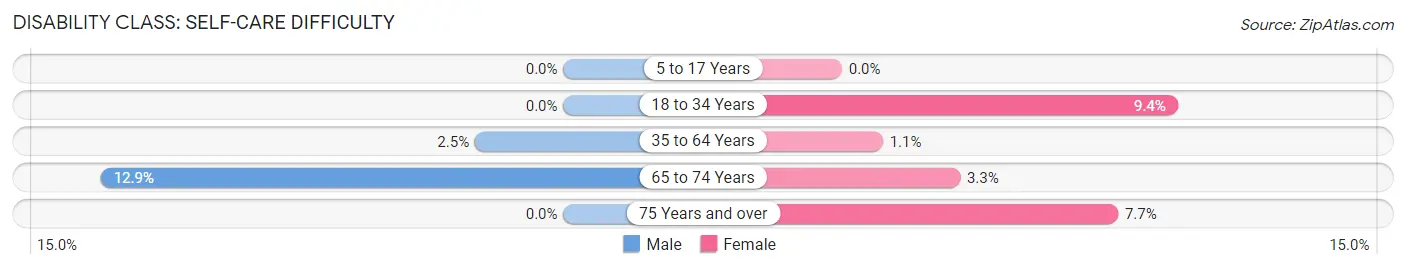
| Age Bracket | Male | Female |
| 5 to 17 Years | 0 (0.0%) | 0 (0.0%) |
| 18 to 34 Years | 0 (0.0%) | 20 (9.3%) |
| 35 to 64 Years | 9 (2.5%) | 6 (1.1%) |
| 65 to 74 Years | 17 (12.9%) | 8 (3.3%) |
| 75 Years and over | 0 (0.0%) | 11 (7.7%) |
Technology Access in Johnston
Computing Device Access in Johnston
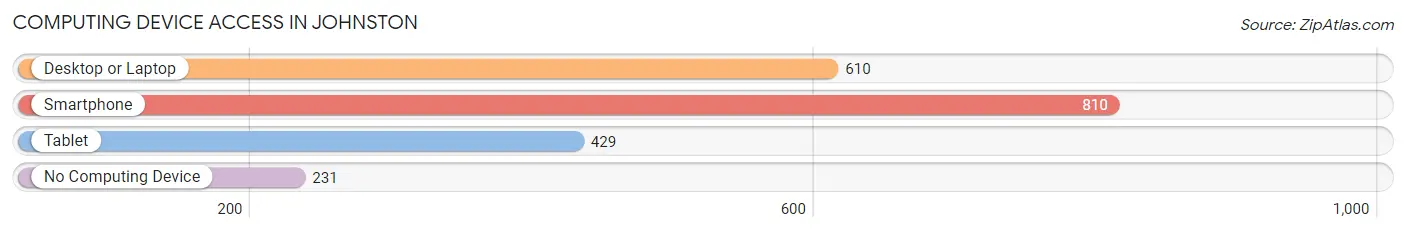
| Device Type | # Households | % Households |
| Desktop or Laptop | 610 | 55.7% |
| Smartphone | 810 | 74.0% |
| Tablet | 429 | 39.2% |
| No Computing Device | 231 | 21.1% |
| Total | 1,095 | 100.0% |
Internet Access in Johnston
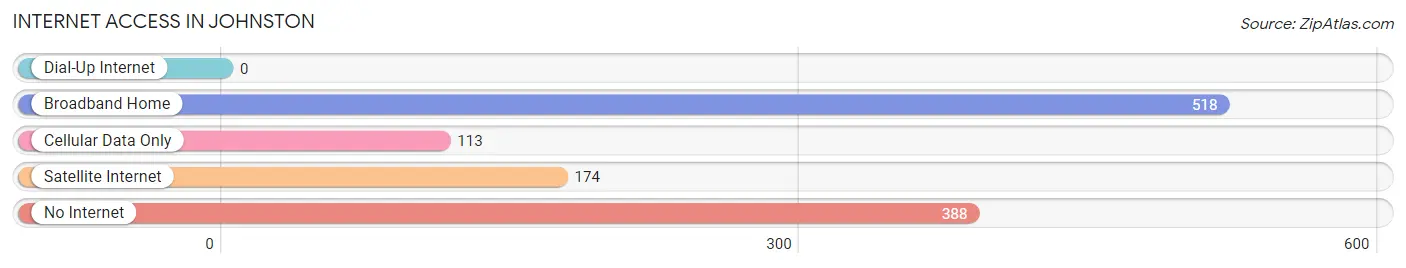
| Internet Type | # Households | % Households |
| Dial-Up Internet | 0 | 0.0% |
| Broadband Home | 518 | 47.3% |
| Cellular Data Only | 113 | 10.3% |
| Satellite Internet | 174 | 15.9% |
| No Internet | 388 | 35.4% |
| Total | 1,095 | 100.0% |
Johnston Summary
Johnston, South Carolina is a small town located in Edgefield County, South Carolina. It is situated along the Savannah River, approximately 20 miles from Augusta, Georgia. The town was founded in 1820 and is named after the Johnston family, who were among the first settlers in the area. The population of Johnston was 2,945 as of the 2010 census.
Geography
Johnston is located in the Piedmont region of South Carolina, which is characterized by rolling hills and flat plains. The town is situated along the Savannah River, which forms the border between South Carolina and Georgia. The town is located at an elevation of approximately 500 feet above sea level. The climate in Johnston is humid subtropical, with hot, humid summers and mild winters.
Economy
Johnston is a small town with a limited economy. The town is home to several small businesses, including a grocery store, a hardware store, and a few restaurants. The town is also home to a number of manufacturing companies, including a textile mill and a furniture factory. The town is also home to a number of farms, which produce a variety of crops, including cotton, corn, soybeans, and peanuts.
Demographics
As of the 2010 census, the population of Johnston was 2,945. The racial makeup of the town was 79.3% White, 17.7% African American, 0.3% Native American, 0.3% Asian, 0.1% Pacific Islander, and 2.3% from other races. The median household income in Johnston was $30,938, and the median family income was $37,813. The per capita income in Johnston was $15,945.
Education
Johnston is served by the Edgefield County School District. The town is home to Johnston Elementary School, Johnston Middle School, and Strom Thurmond High School. The town is also home to Johnston Technical College, which offers a variety of vocational and technical programs.
Conclusion
Johnston, South Carolina is a small town located in Edgefield County, South Carolina. It is situated along the Savannah River, approximately 20 miles from Augusta, Georgia. The town was founded in 1820 and is named after the Johnston family, who were among the first settlers in the area. The population of Johnston was 2,945 as of the 2010 census. The town is home to several small businesses, manufacturing companies, and farms. The racial makeup of the town was 79.3% White, 17.7% African American, 0.3% Native American, 0.3% Asian, 0.1% Pacific Islander, and 2.3% from other races. The median household income in Johnston was $30,938, and the median family income was $37,813. The town is served by the Edgefield County School District and is home to Johnston Technical College. Johnston is a small town with a limited economy, but it is a great place to live and work.
Common Questions
What is Per Capita Income in Johnston?
Per Capita income in Johnston is $21,618.
What is the Median Family Income in Johnston?
Median Family Income in Johnston is $50,972.
What is the Median Household income in Johnston?
Median Household Income in Johnston is $31,910.
What is Income or Wage Gap in Johnston?
Income or Wage Gap in Johnston is 45.6%.
Women in Johnston earn 54.4 cents for every dollar earned by a man.
What is Family Income Deficit in Johnston?
Family Income Deficit in Johnston is $9,325.
Families that are below poverty line in Johnston earn $9,325 less on average than the poverty threshold level.
What is Inequality or Gini Index in Johnston?
Inequality or Gini Index in Johnston is 0.45.
What is the Total Population of Johnston?
Total Population of Johnston is 2,375.
What is the Total Male Population of Johnston?
Total Male Population of Johnston is 1,060.
What is the Total Female Population of Johnston?
Total Female Population of Johnston is 1,315.
What is the Ratio of Males per 100 Females in Johnston?
There are 80.61 Males per 100 Females in Johnston.
What is the Ratio of Females per 100 Males in Johnston?
There are 124.06 Females per 100 Males in Johnston.
What is the Median Population Age in Johnston?
Median Population Age in Johnston is 48.3 Years.
What is the Average Family Size in Johnston
Average Family Size in Johnston is 3.0 People.
What is the Average Household Size in Johnston
Average Household Size in Johnston is 2.2 People.
How Large is the Labor Force in Johnston?
There are 1,021 People in the Labor Forcein in Johnston.
What is the Percentage of People in the Labor Force in Johnston?
50.8% of People are in the Labor Force in Johnston.
What is the Unemployment Rate in Johnston?
Unemployment Rate in Johnston is 6.6%.