Clinton, SC Map & Demographics
Clinton Map
Clinton Overview
$18,729
PER CAPITA INCOME
$59,848
AVG FAMILY INCOME
$38,350
AVG HOUSEHOLD INCOME
13.7%
WAGE / INCOME GAP [ % ]
86.3¢/ $1
WAGE / INCOME GAP [ $ ]
0.50
INEQUALITY / GINI INDEX
7,624
TOTAL POPULATION
3,572
MALE POPULATION
4,052
FEMALE POPULATION
88.15
MALES / 100 FEMALES
113.44
FEMALES / 100 MALES
35.4
MEDIAN AGE
3.9
AVG FAMILY SIZE
2.5
AVG HOUSEHOLD SIZE
3,211
LABOR FORCE [ PEOPLE ]
53.2%
PERCENT IN LABOR FORCE
7.8%
UNEMPLOYMENT RATE
Clinton Zip Codes
Clinton Area Codes
Income in Clinton
Income Overview in Clinton
Per Capita Income in Clinton is $18,729, while median incomes of families and households are $59,848 and $38,350 respectively.
| Characteristic | Number | Measure |
| Per Capita Income | 7,624 | $18,729 |
| Median Family Income | 1,166 | $59,848 |
| Mean Family Income | 1,166 | $75,948 |
| Median Household Income | 2,353 | $38,350 |
| Mean Household Income | 2,353 | $54,629 |
| Income Deficit | 1,166 | $0 |
| Wage / Income Gap (%) | 7,624 | 13.74% |
| Wage / Income Gap ($) | 7,624 | 86.26¢ per $1 |
| Gini / Inequality Index | 7,624 | 0.50 |
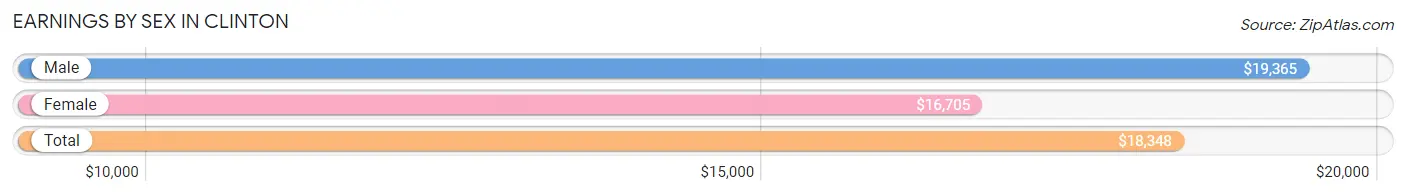
Earnings by Sex in Clinton
Average Earnings in Clinton are $18,348, $19,365 for men and $16,705 for women, a difference of 13.7%.
| Sex | Number | Average Earnings |
| Male | 1,663 (46.5%) | $19,365 |
| Female | 1,917 (53.5%) | $16,705 |
| Total | 3,580 (100.0%) | $18,348 |
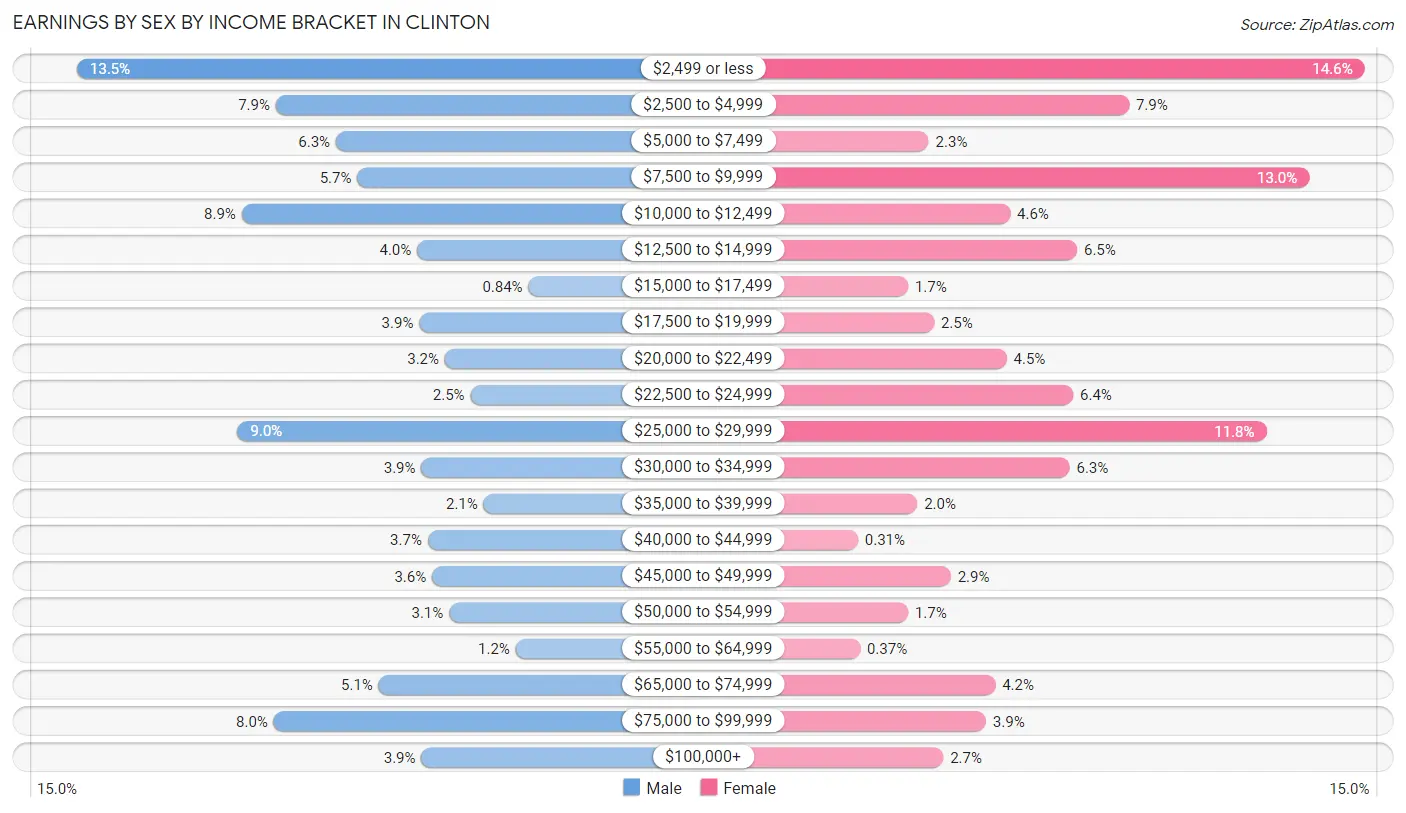
Earnings by Sex by Income Bracket in Clinton
The most common earnings brackets in Clinton are $2,499 or less for men (225 | 13.5%) and $2,499 or less for women (279 | 14.5%).
| Income | Male | Female |
| $2,499 or less | 225 (13.5%) | 279 (14.5%) |
| $2,500 to $4,999 | 132 (7.9%) | 152 (7.9%) |
| $5,000 to $7,499 | 104 (6.2%) | 44 (2.3%) |
| $7,500 to $9,999 | 94 (5.7%) | 249 (13.0%) |
| $10,000 to $12,499 | 148 (8.9%) | 88 (4.6%) |
| $12,500 to $14,999 | 66 (4.0%) | 124 (6.5%) |
| $15,000 to $17,499 | 14 (0.8%) | 33 (1.7%) |
| $17,500 to $19,999 | 65 (3.9%) | 47 (2.5%) |
| $20,000 to $22,499 | 53 (3.2%) | 86 (4.5%) |
| $22,500 to $24,999 | 41 (2.5%) | 122 (6.4%) |
| $25,000 to $29,999 | 150 (9.0%) | 226 (11.8%) |
| $30,000 to $34,999 | 64 (3.8%) | 120 (6.3%) |
| $35,000 to $39,999 | 35 (2.1%) | 38 (2.0%) |
| $40,000 to $44,999 | 61 (3.7%) | 6 (0.3%) |
| $45,000 to $49,999 | 59 (3.5%) | 56 (2.9%) |
| $50,000 to $54,999 | 51 (3.1%) | 33 (1.7%) |
| $55,000 to $64,999 | 20 (1.2%) | 7 (0.4%) |
| $65,000 to $74,999 | 84 (5.1%) | 80 (4.2%) |
| $75,000 to $99,999 | 133 (8.0%) | 75 (3.9%) |
| $100,000+ | 64 (3.8%) | 52 (2.7%) |
| Total | 1,663 (100.0%) | 1,917 (100.0%) |
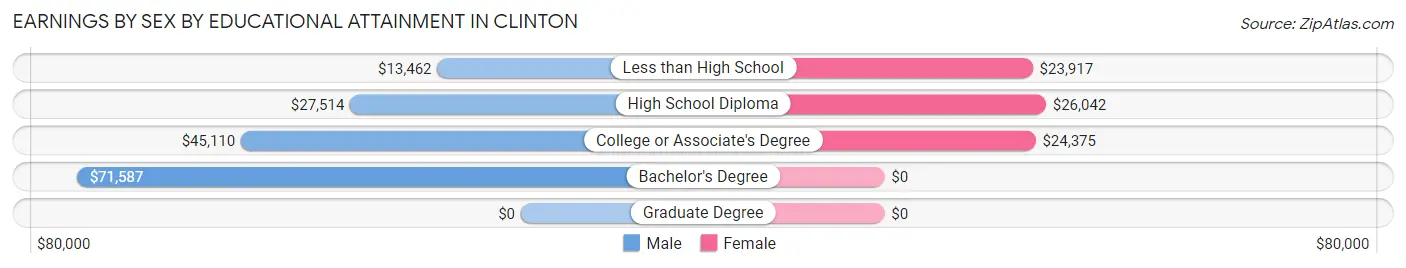
Earnings by Sex by Educational Attainment in Clinton
Average earnings in Clinton are $29,144 for men and $25,392 for women, a difference of 12.9%. Men with an educational attainment of bachelor's degree enjoy the highest average annual earnings of $71,587, while those with less than high school education earn the least with $13,462. Women with an educational attainment of high school diploma earn the most with the average annual earnings of $26,042, while those with less than high school education have the smallest earnings of $23,917.
| Educational Attainment | Male Income | Female Income |
| Less than High School | $13,462 | $23,917 |
| High School Diploma | $27,514 | $26,042 |
| College or Associate's Degree | $45,110 | $24,375 |
| Bachelor's Degree | $71,587 | $0 |
| Graduate Degree | - | - |
| Total | $29,144 | $25,392 |
Family Income in Clinton
Family Income Brackets in Clinton
According to the Clinton family income data, there are 252 families falling into the $50,000 to $74,999 income range, which is the most common income bracket and makes up 21.6% of all families. Conversely, the $10,000 to $14,999 income bracket is the least frequent group with only 29 families (2.5%) belonging to this category.
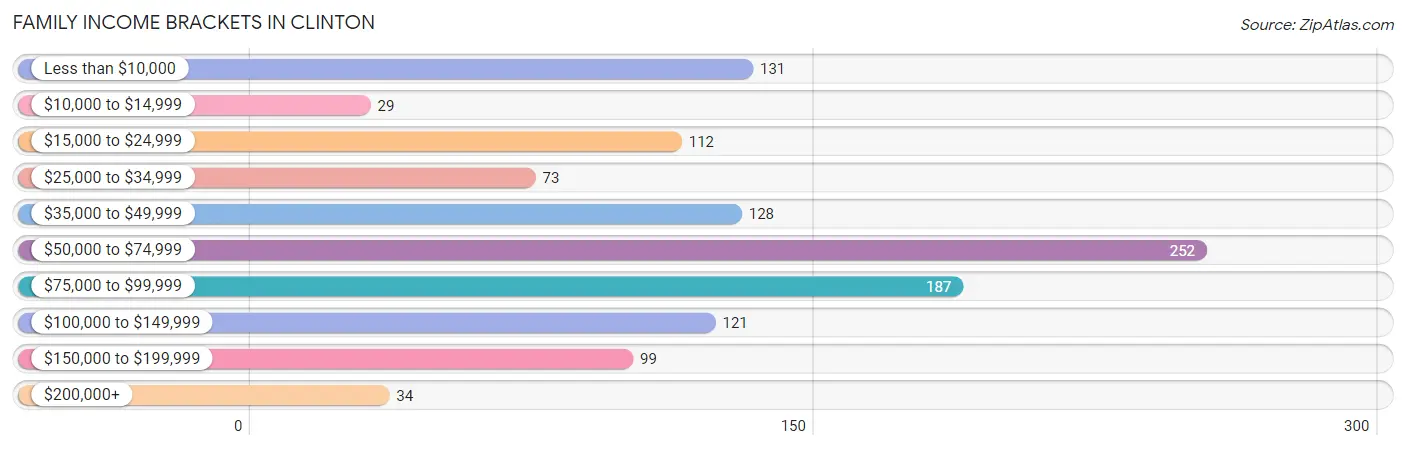
| Income Bracket | # Families | % Families |
| Less than $10,000 | 131 | 11.2% |
| $10,000 to $14,999 | 29 | 2.5% |
| $15,000 to $24,999 | 112 | 9.6% |
| $25,000 to $34,999 | 73 | 6.3% |
| $35,000 to $49,999 | 128 | 11.0% |
| $50,000 to $74,999 | 252 | 21.6% |
| $75,000 to $99,999 | 187 | 16.0% |
| $100,000 to $149,999 | 121 | 10.4% |
| $150,000 to $199,999 | 99 | 8.5% |
| $200,000+ | 34 | 2.9% |
Family Income by Famaliy Size in Clinton
4-person families (245 | 21.0%) account for the highest median family income in Clinton with $67,768 per family, while 2-person families (452 | 38.8%) have the highest median income of $31,300 per family member.
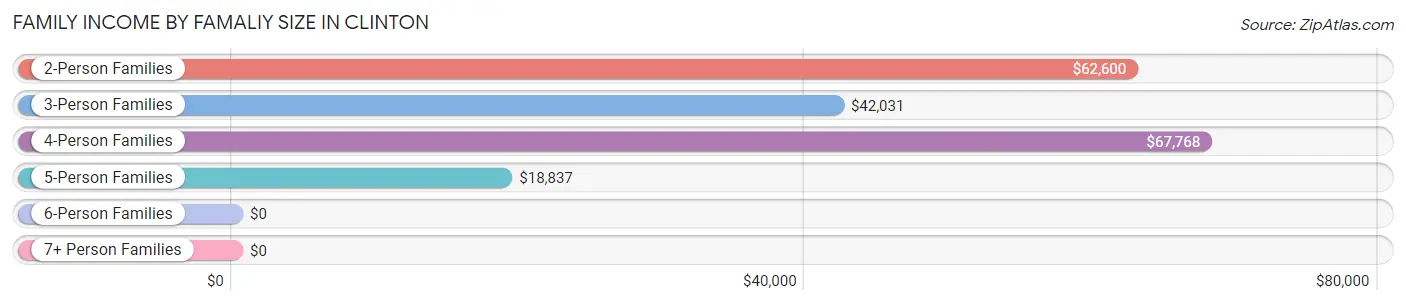
| Income Bracket | # Families | Median Income |
| 2-Person Families | 452 (38.8%) | $62,600 |
| 3-Person Families | 296 (25.4%) | $42,031 |
| 4-Person Families | 245 (21.0%) | $67,768 |
| 5-Person Families | 74 (6.4%) | $18,837 |
| 6-Person Families | 35 (3.0%) | $0 |
| 7+ Person Families | 64 (5.5%) | $0 |
| Total | 1,166 (100.0%) | $59,848 |
Family Income by Number of Earners in Clinton
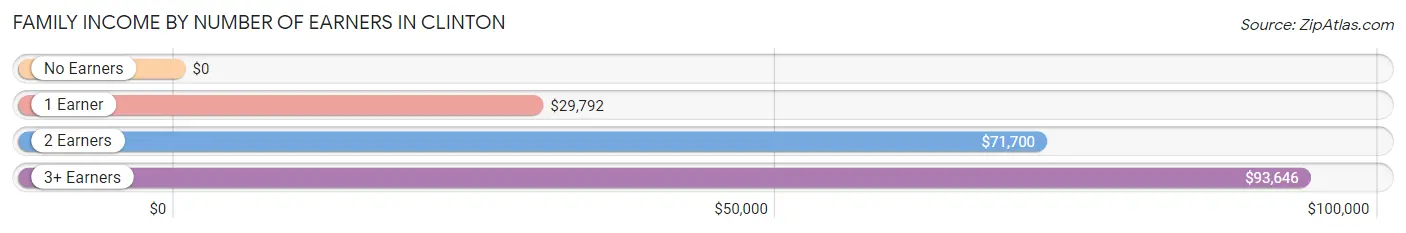
| Number of Earners | # Families | Median Income |
| No Earners | 185 (15.9%) | $0 |
| 1 Earner | 416 (35.7%) | $29,792 |
| 2 Earners | 450 (38.6%) | $71,700 |
| 3+ Earners | 115 (9.9%) | $93,646 |
| Total | 1,166 (100.0%) | $59,848 |
Household Income in Clinton
Household Income Brackets in Clinton
With 398 households falling in the category, the $50,000 to $74,999 income range is the most frequent in Clinton, accounting for 16.9% of all households. In contrast, only 33 households (1.4%) fall into the $200,000+ income bracket, making it the least populous group.
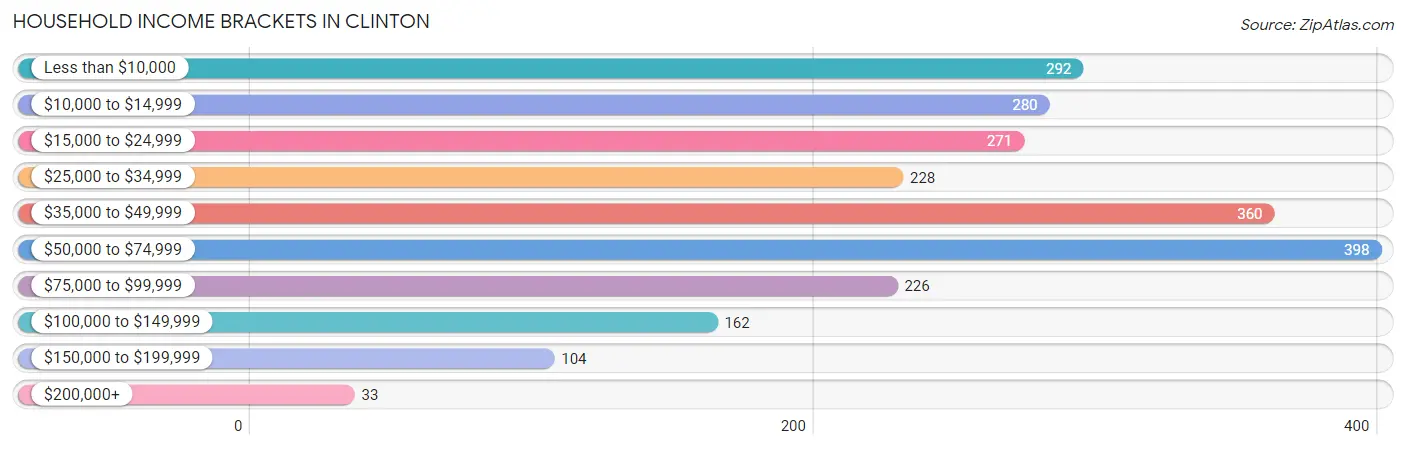
| Income Bracket | # Households | % Households |
| Less than $10,000 | 292 | 12.4% |
| $10,000 to $14,999 | 280 | 11.9% |
| $15,000 to $24,999 | 271 | 11.5% |
| $25,000 to $34,999 | 228 | 9.7% |
| $35,000 to $49,999 | 360 | 15.3% |
| $50,000 to $74,999 | 398 | 16.9% |
| $75,000 to $99,999 | 226 | 9.6% |
| $100,000 to $149,999 | 162 | 6.9% |
| $150,000 to $199,999 | 104 | 4.4% |
| $200,000+ | 33 | 1.4% |
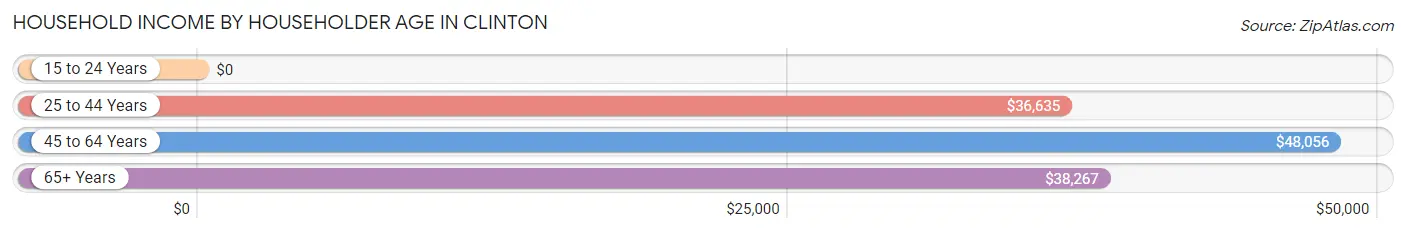
Household Income by Householder Age in Clinton
The median household income in Clinton is $38,350, with the highest median household income of $48,056 found in the 45 to 64 years age bracket for the primary householder. A total of 810 households (34.4%) fall into this category. Meanwhile, the 15 to 24 years age bracket for the primary householder has the lowest median household income of $0, with 95 households (4.0%) in this group.
| Income Bracket | # Households | Median Income |
| 15 to 24 Years | 95 (4.0%) | $0 |
| 25 to 44 Years | 689 (29.3%) | $36,635 |
| 45 to 64 Years | 810 (34.4%) | $48,056 |
| 65+ Years | 759 (32.3%) | $38,267 |
| Total | 2,353 (100.0%) | $38,350 |
Poverty in Clinton
Income Below Poverty by Sex and Age in Clinton
With 23.3% poverty level for males and 27.9% for females among the residents of Clinton, 6 to 11 year old males and 5 year old females are the most vulnerable to poverty, with 179 males (61.7%) and 97 females (77.0%) in their respective age groups living below the poverty level.
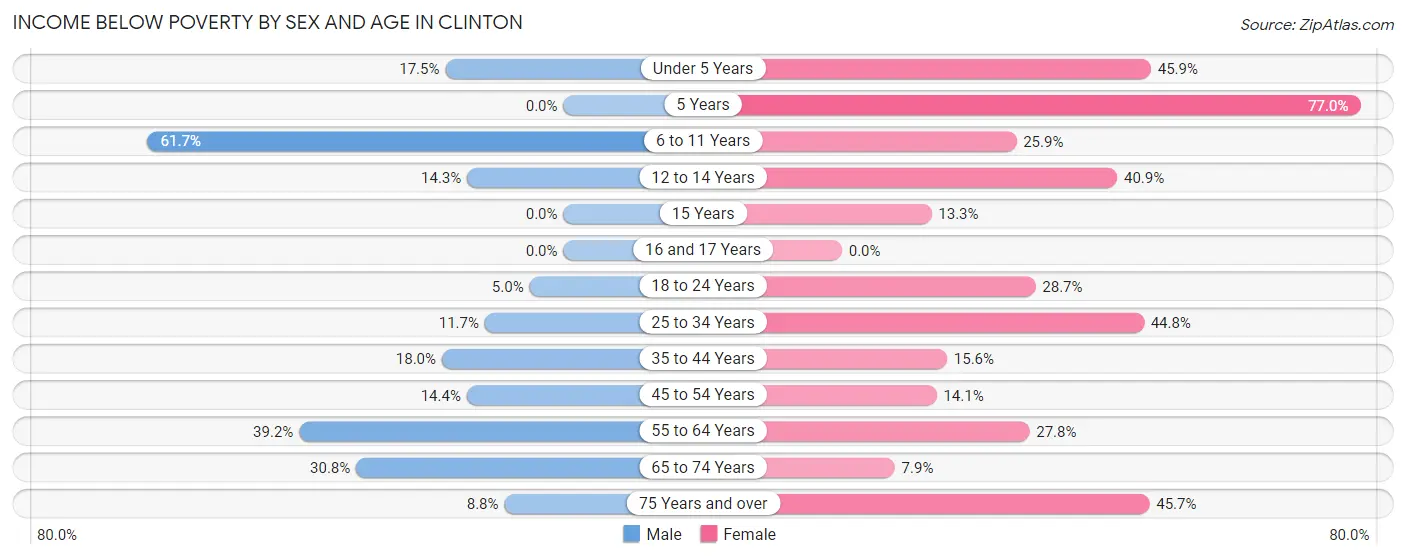
| Age Bracket | Male | Female |
| Under 5 Years | 44 (17.5%) | 78 (45.9%) |
| 5 Years | 0 (0.0%) | 97 (77.0%) |
| 6 to 11 Years | 179 (61.7%) | 36 (25.9%) |
| 12 to 14 Years | 8 (14.3%) | 85 (40.9%) |
| 15 Years | 0 (0.0%) | 31 (13.3%) |
| 16 and 17 Years | 0 (0.0%) | 0 (0.0%) |
| 18 to 24 Years | 16 (5.0%) | 50 (28.7%) |
| 25 to 34 Years | 30 (11.7%) | 195 (44.8%) |
| 35 to 44 Years | 68 (18.0%) | 78 (15.6%) |
| 45 to 54 Years | 61 (14.3%) | 44 (14.1%) |
| 55 to 64 Years | 184 (39.2%) | 71 (27.8%) |
| 65 to 74 Years | 40 (30.8%) | 35 (7.9%) |
| 75 Years and over | 12 (8.8%) | 121 (45.7%) |
| Total | 642 (23.3%) | 921 (27.9%) |
Income Above Poverty by Sex and Age in Clinton
According to the poverty statistics in Clinton, males aged 15 years and females aged 16 and 17 years are the age groups that are most secure financially, with 100.0% of males and 100.0% of females in these age groups living above the poverty line.
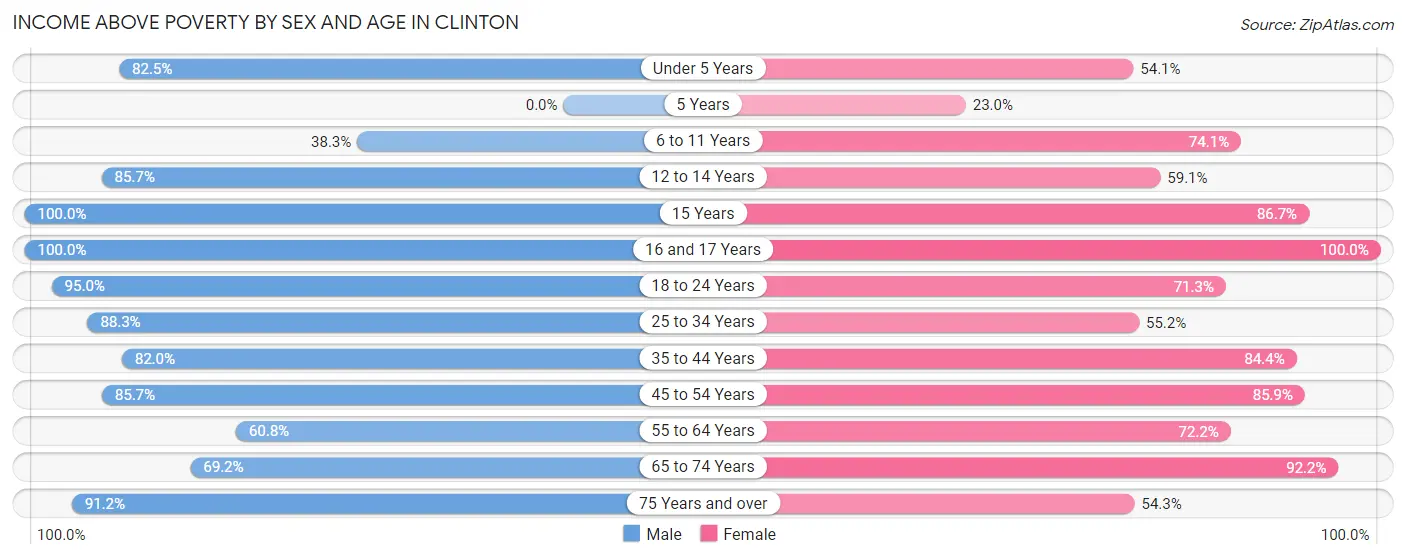
| Age Bracket | Male | Female |
| Under 5 Years | 207 (82.5%) | 92 (54.1%) |
| 5 Years | 0 (0.0%) | 29 (23.0%) |
| 6 to 11 Years | 111 (38.3%) | 103 (74.1%) |
| 12 to 14 Years | 48 (85.7%) | 123 (59.1%) |
| 15 Years | 12 (100.0%) | 202 (86.7%) |
| 16 and 17 Years | 36 (100.0%) | 33 (100.0%) |
| 18 to 24 Years | 302 (95.0%) | 124 (71.3%) |
| 25 to 34 Years | 227 (88.3%) | 240 (55.2%) |
| 35 to 44 Years | 309 (82.0%) | 422 (84.4%) |
| 45 to 54 Years | 364 (85.7%) | 269 (85.9%) |
| 55 to 64 Years | 285 (60.8%) | 184 (72.2%) |
| 65 to 74 Years | 90 (69.2%) | 411 (92.1%) |
| 75 Years and over | 125 (91.2%) | 144 (54.3%) |
| Total | 2,116 (76.7%) | 2,376 (72.1%) |
Income Below Poverty Among Married-Couple Families in Clinton
The poverty statistics for married-couple families in Clinton show that 2.2% or 13 of the total 582 families live below the poverty line. Families with no children have the highest poverty rate of 4.6%, comprising of 13 families. On the other hand, families with 1 or 2 children have the lowest poverty rate of 0.0%, which includes 0 families.
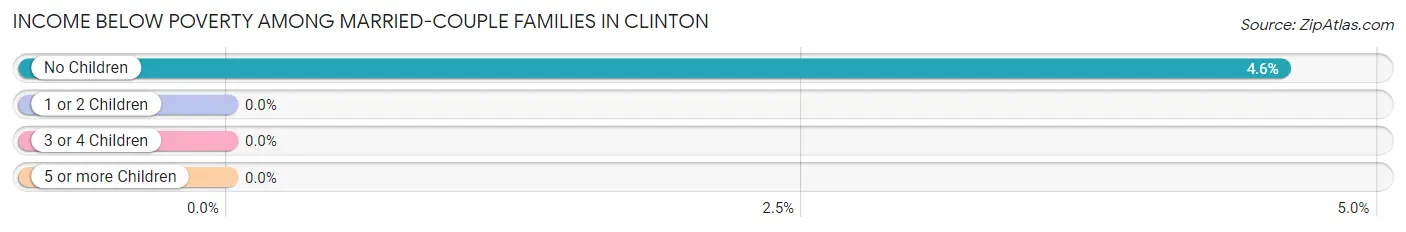
| Children | Above Poverty | Below Poverty |
| No Children | 271 (95.4%) | 13 (4.6%) |
| 1 or 2 Children | 243 (100.0%) | 0 (0.0%) |
| 3 or 4 Children | 55 (100.0%) | 0 (0.0%) |
| 5 or more Children | 0 (0.0%) | 0 (0.0%) |
| Total | 569 (97.8%) | 13 (2.2%) |
Income Below Poverty Among Single-Parent Households in Clinton
According to the poverty data in Clinton, 13.4% or 25 single-father households and 51.8% or 206 single-mother households are living below the poverty line. Among single-father households, those with 3 or 4 children have the highest poverty rate, with 8 households (100.0%) experiencing poverty. Likewise, among single-mother households, those with 3 or 4 children have the highest poverty rate, with 93 households (95.9%) falling below the poverty line.
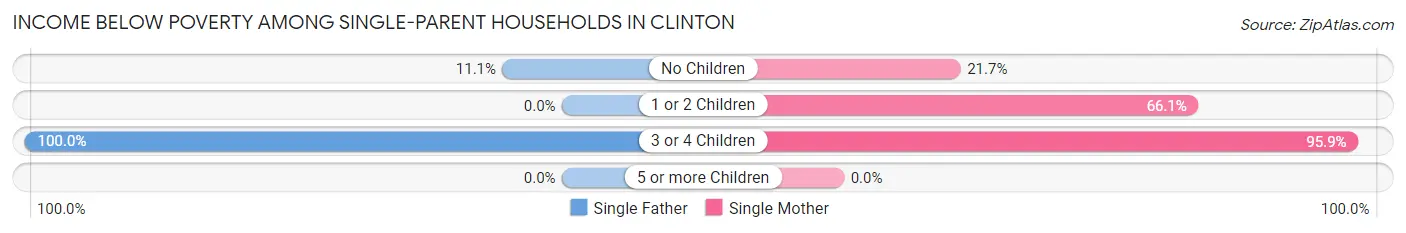
| Children | Single Father | Single Mother |
| No Children | 17 (11.1%) | 33 (21.7%) |
| 1 or 2 Children | 0 (0.0%) | 80 (66.1%) |
| 3 or 4 Children | 8 (100.0%) | 93 (95.9%) |
| 5 or more Children | 0 (0.0%) | 0 (0.0%) |
| Total | 25 (13.4%) | 206 (51.8%) |
Income Below Poverty Among Married-Couple vs Single-Parent Households in Clinton
The poverty data for Clinton shows that 13 of the married-couple family households (2.2%) and 231 of the single-parent households (39.6%) are living below the poverty level. Within the married-couple family households, those with no children have the highest poverty rate, with 13 households (4.6%) falling below the poverty line. Among the single-parent households, those with 3 or 4 children have the highest poverty rate, with 101 household (96.2%) living below poverty.
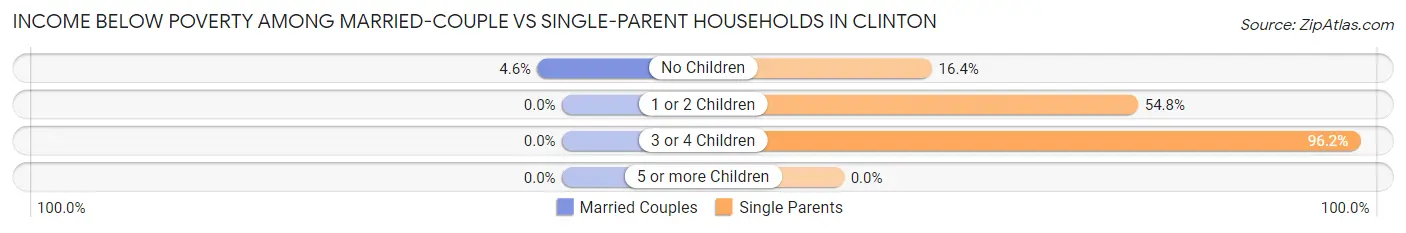
| Children | Married-Couple Families | Single-Parent Households |
| No Children | 13 (4.6%) | 50 (16.4%) |
| 1 or 2 Children | 0 (0.0%) | 80 (54.8%) |
| 3 or 4 Children | 0 (0.0%) | 101 (96.2%) |
| 5 or more Children | 0 (0.0%) | 0 (0.0%) |
| Total | 13 (2.2%) | 231 (39.6%) |
Race in Clinton
The most populous races in Clinton are White / Caucasian (4,325 | 56.7%), Black / African American (2,847 | 37.3%), and Two or more Races (271 | 3.5%).
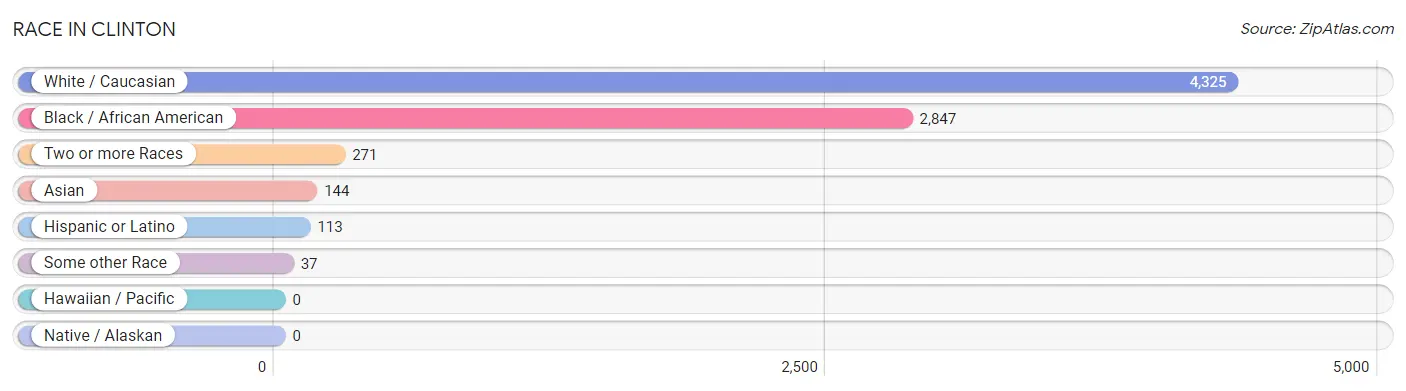
| Race | # Population | % Population |
| Asian | 144 | 1.9% |
| Black / African American | 2,847 | 37.3% |
| Hawaiian / Pacific | 0 | 0.0% |
| Hispanic or Latino | 113 | 1.5% |
| Native / Alaskan | 0 | 0.0% |
| White / Caucasian | 4,325 | 56.7% |
| Two or more Races | 271 | 3.5% |
| Some other Race | 37 | 0.5% |
| Total | 7,624 | 100.0% |
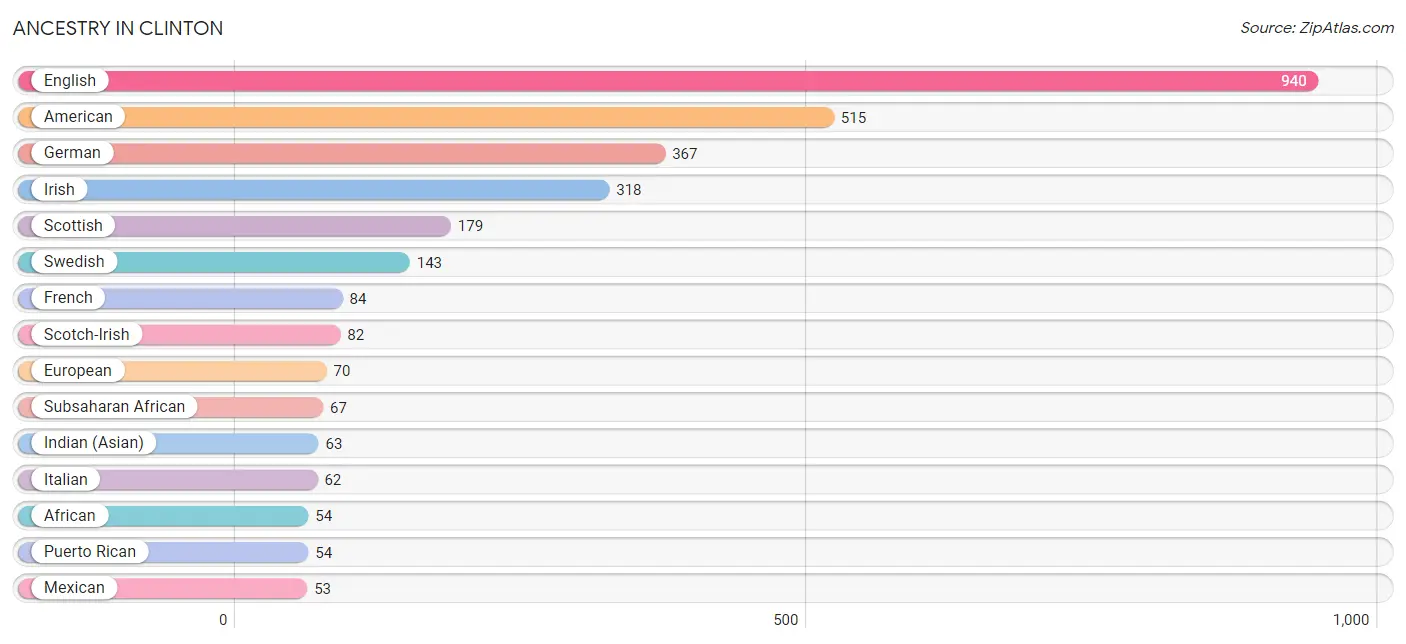
Ancestry in Clinton
The most populous ancestries reported in Clinton are English (940 | 12.3%), American (515 | 6.8%), German (367 | 4.8%), Irish (318 | 4.2%), and Scottish (179 | 2.4%), together accounting for 30.4% of all Clinton residents.
| Ancestry | # Population | % Population |
| African | 54 | 0.7% |
| Alsatian | 6 | 0.1% |
| American | 515 | 6.8% |
| Brazilian | 2 | 0.0% |
| British | 16 | 0.2% |
| Canadian | 8 | 0.1% |
| Cherokee | 16 | 0.2% |
| Dutch | 1 | 0.0% |
| English | 940 | 12.3% |
| European | 70 | 0.9% |
| French | 84 | 1.1% |
| German | 367 | 4.8% |
| Hungarian | 8 | 0.1% |
| Indian (Asian) | 63 | 0.8% |
| Irish | 318 | 4.2% |
| Italian | 62 | 0.8% |
| Jamaican | 32 | 0.4% |
| Korean | 36 | 0.5% |
| Mexican | 53 | 0.7% |
| Nigerian | 8 | 0.1% |
| Pakistani | 17 | 0.2% |
| Polish | 50 | 0.7% |
| Puerto Rican | 54 | 0.7% |
| Russian | 8 | 0.1% |
| Scandinavian | 2 | 0.0% |
| Scotch-Irish | 82 | 1.1% |
| Scottish | 179 | 2.4% |
| Slovene | 10 | 0.1% |
| Sri Lankan | 16 | 0.2% |
| Subsaharan African | 67 | 0.9% |
| Swedish | 143 | 1.9% |
| Thai | 6 | 0.1% |
| Ukrainian | 6 | 0.1% |
| Welsh | 14 | 0.2% |
| West Indian | 2 | 0.0% | View All 35 Rows |
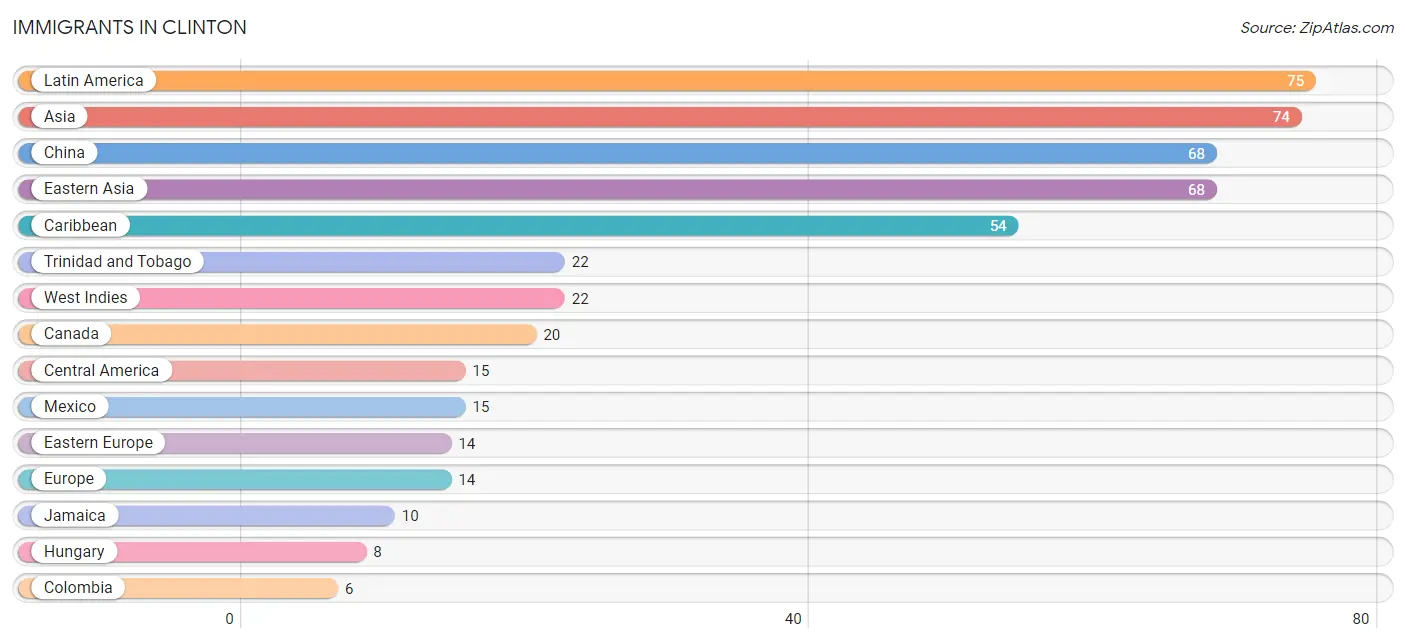
Immigrants in Clinton
The most numerous immigrant groups reported in Clinton came from Latin America (75 | 1.0%), Asia (74 | 1.0%), China (68 | 0.9%), Eastern Asia (68 | 0.9%), and Caribbean (54 | 0.7%), together accounting for 4.4% of all Clinton residents.
| Immigration Origin | # Population | % Population |
| Africa | 5 | 0.1% |
| Asia | 74 | 1.0% |
| Canada | 20 | 0.3% |
| Caribbean | 54 | 0.7% |
| Central America | 15 | 0.2% |
| China | 68 | 0.9% |
| Colombia | 6 | 0.1% |
| Eastern Asia | 68 | 0.9% |
| Eastern Europe | 14 | 0.2% |
| Europe | 14 | 0.2% |
| Hungary | 8 | 0.1% |
| India | 6 | 0.1% |
| Jamaica | 10 | 0.1% |
| Latin America | 75 | 1.0% |
| Mexico | 15 | 0.2% |
| South America | 6 | 0.1% |
| South Central Asia | 6 | 0.1% |
| Trinidad and Tobago | 22 | 0.3% |
| Ukraine | 6 | 0.1% |
| West Indies | 22 | 0.3% |
| Western Africa | 5 | 0.1% | View All 21 Rows |
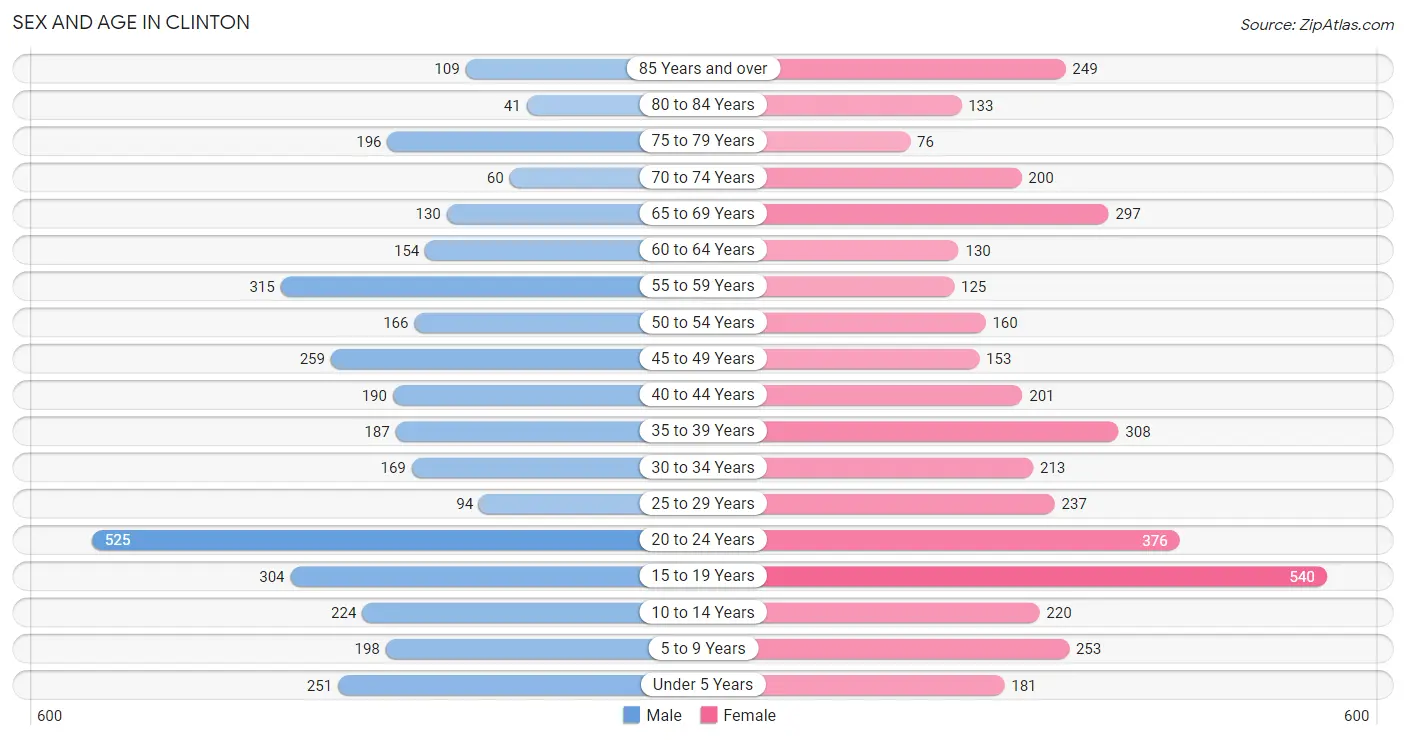
Sex and Age in Clinton
Sex and Age in Clinton
The most populous age groups in Clinton are 20 to 24 Years (525 | 14.7%) for men and 15 to 19 Years (540 | 13.3%) for women.
| Age Bracket | Male | Female |
| Under 5 Years | 251 (7.0%) | 181 (4.5%) |
| 5 to 9 Years | 198 (5.5%) | 253 (6.2%) |
| 10 to 14 Years | 224 (6.3%) | 220 (5.4%) |
| 15 to 19 Years | 304 (8.5%) | 540 (13.3%) |
| 20 to 24 Years | 525 (14.7%) | 376 (9.3%) |
| 25 to 29 Years | 94 (2.6%) | 237 (5.9%) |
| 30 to 34 Years | 169 (4.7%) | 213 (5.3%) |
| 35 to 39 Years | 187 (5.2%) | 308 (7.6%) |
| 40 to 44 Years | 190 (5.3%) | 201 (5.0%) |
| 45 to 49 Years | 259 (7.2%) | 153 (3.8%) |
| 50 to 54 Years | 166 (4.6%) | 160 (4.0%) |
| 55 to 59 Years | 315 (8.8%) | 125 (3.1%) |
| 60 to 64 Years | 154 (4.3%) | 130 (3.2%) |
| 65 to 69 Years | 130 (3.6%) | 297 (7.3%) |
| 70 to 74 Years | 60 (1.7%) | 200 (4.9%) |
| 75 to 79 Years | 196 (5.5%) | 76 (1.9%) |
| 80 to 84 Years | 41 (1.1%) | 133 (3.3%) |
| 85 Years and over | 109 (3.0%) | 249 (6.1%) |
| Total | 3,572 (100.0%) | 4,052 (100.0%) |
Families and Households in Clinton
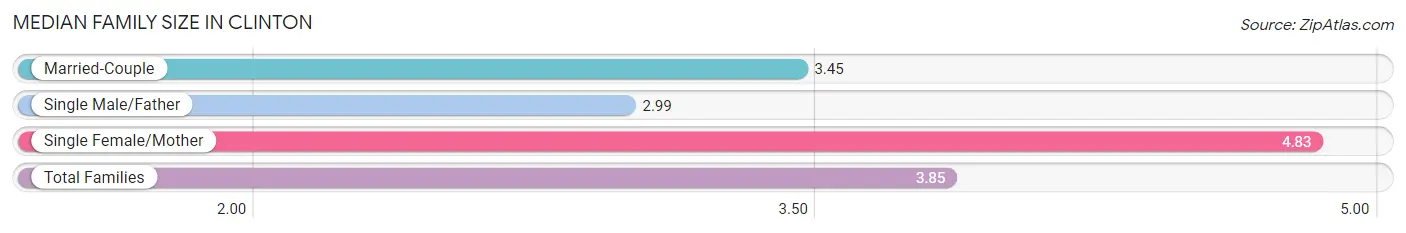
Median Family Size in Clinton
The median family size in Clinton is 3.85 persons per family, with single female/mother families (398 | 34.1%) accounting for the largest median family size of 4.83 persons per family. On the other hand, single male/father families (186 | 16.0%) represent the smallest median family size with 2.99 persons per family.
| Family Type | # Families | Family Size |
| Married-Couple | 582 (49.9%) | 3.45 |
| Single Male/Father | 186 (16.0%) | 2.99 |
| Single Female/Mother | 398 (34.1%) | 4.83 |
| Total Families | 1,166 (100.0%) | 3.85 |
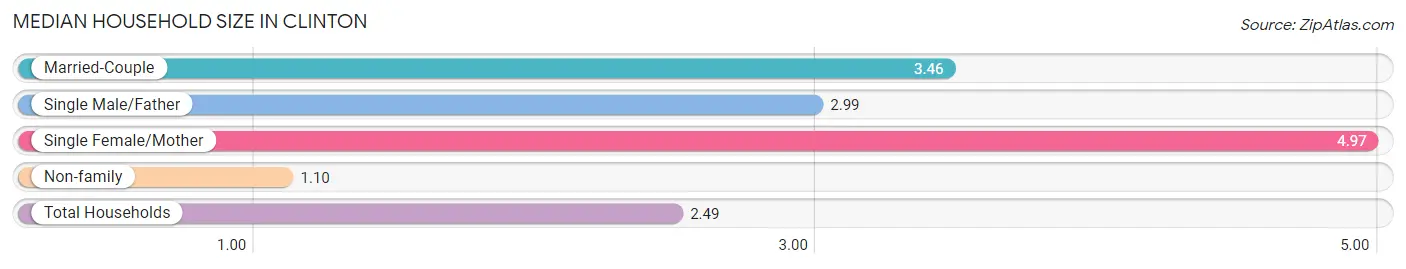
Median Household Size in Clinton
The median household size in Clinton is 2.49 persons per household, with single female/mother households (398 | 16.9%) accounting for the largest median household size of 4.97 persons per household. non-family households (1,187 | 50.4%) represent the smallest median household size with 1.10 persons per household.
| Household Type | # Households | Household Size |
| Married-Couple | 582 (24.7%) | 3.46 |
| Single Male/Father | 186 (7.9%) | 2.99 |
| Single Female/Mother | 398 (16.9%) | 4.97 |
| Non-family | 1,187 (50.4%) | 1.10 |
| Total Households | 2,353 (100.0%) | 2.49 |
Household Size by Marriage Status in Clinton
Out of a total of 2,353 households in Clinton, 1,166 (49.5%) are family households, while 1,187 (50.4%) are nonfamily households. The most numerous type of family households are 2-person households, comprising 446, and the most common type of nonfamily households are 1-person households, comprising 1,056.
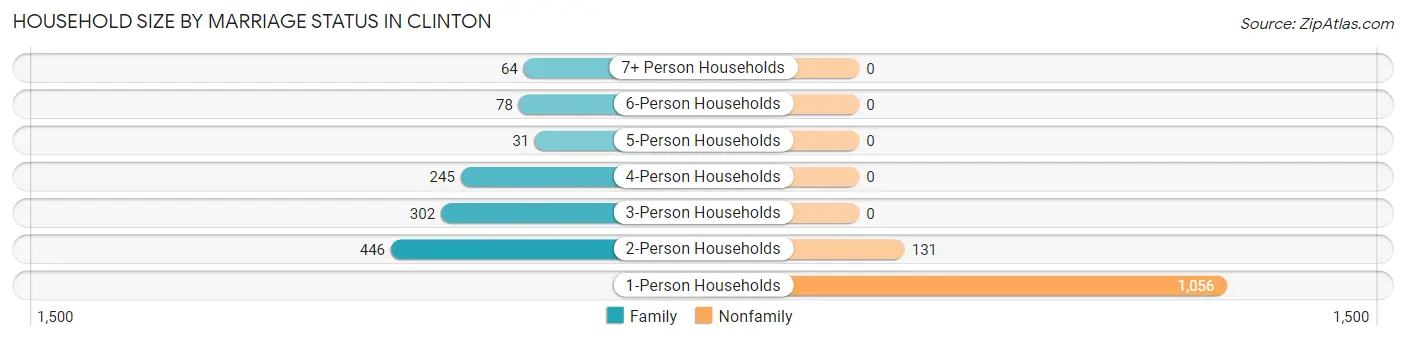
| Household Size | Family Households | Nonfamily Households |
| 1-Person Households | - | 1,056 (44.9%) |
| 2-Person Households | 446 (19.0%) | 131 (5.6%) |
| 3-Person Households | 302 (12.8%) | 0 (0.0%) |
| 4-Person Households | 245 (10.4%) | 0 (0.0%) |
| 5-Person Households | 31 (1.3%) | 0 (0.0%) |
| 6-Person Households | 78 (3.3%) | 0 (0.0%) |
| 7+ Person Households | 64 (2.7%) | 0 (0.0%) |
| Total | 1,166 (49.5%) | 1,187 (50.4%) |
Female Fertility in Clinton
Fertility by Age in Clinton
Average fertility rate in Clinton is 12.0 births per 1,000 women. Women in the age bracket of 35 to 50 years have the highest fertility rate with 36.0 births per 1,000 women. Women in the age bracket of 35 to 50 years acount for 100.0% of all women with births.
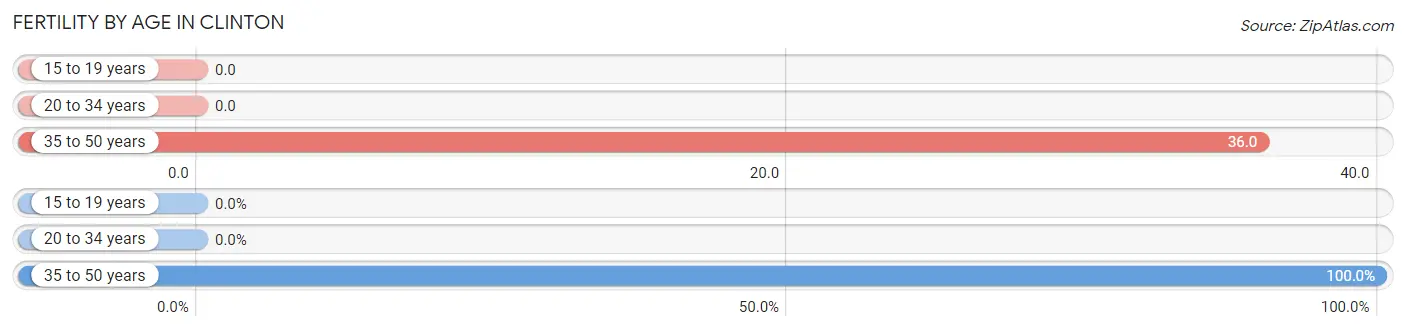
| Age Bracket | Women with Births | Births / 1,000 Women |
| 15 to 19 years | 0 (0.0%) | 0.0 |
| 20 to 34 years | 0 (0.0%) | 0.0 |
| 35 to 50 years | 25 (100.0%) | 36.0 |
| Total | 25 (100.0%) | 12.0 |
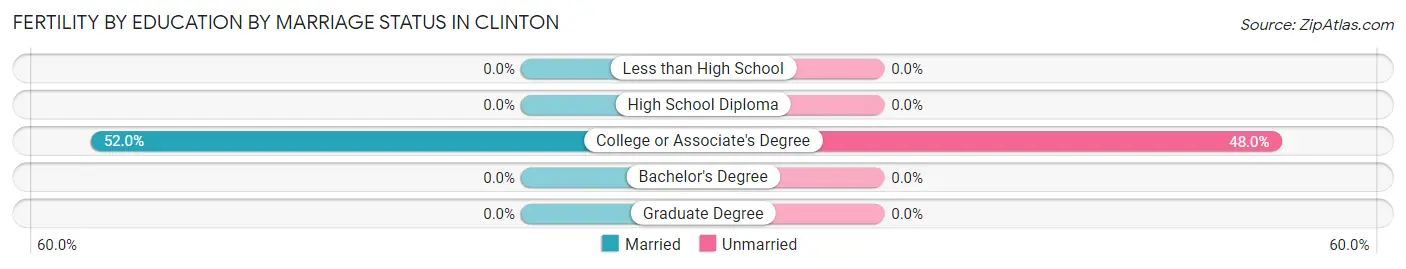
Fertility by Age by Marriage Status in Clinton
52.0% of women with births (25) in Clinton are married. The highest percentage of unmarried women with births falls into 35 to 50 years age bracket with 48.0% of them unmarried at the time of birth, while the lowest percentage of unmarried women with births belong to 35 to 50 years age bracket with 48.0% of them unmarried.
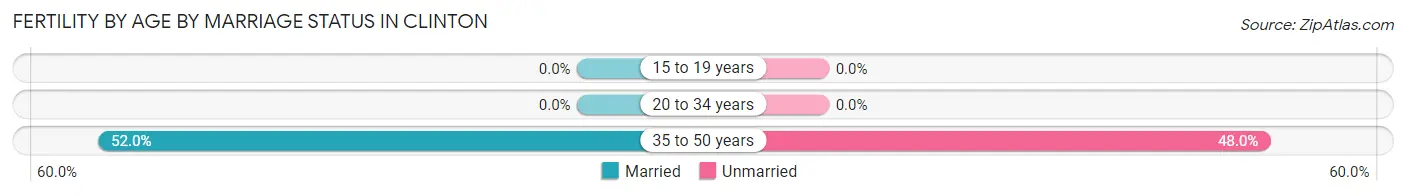
| Age Bracket | Married | Unmarried |
| 15 to 19 years | 0 (0.0%) | 0 (0.0%) |
| 20 to 34 years | 0 (0.0%) | 0 (0.0%) |
| 35 to 50 years | 13 (52.0%) | 12 (48.0%) |
| Total | 13 (52.0%) | 12 (48.0%) |
Fertility by Education in Clinton
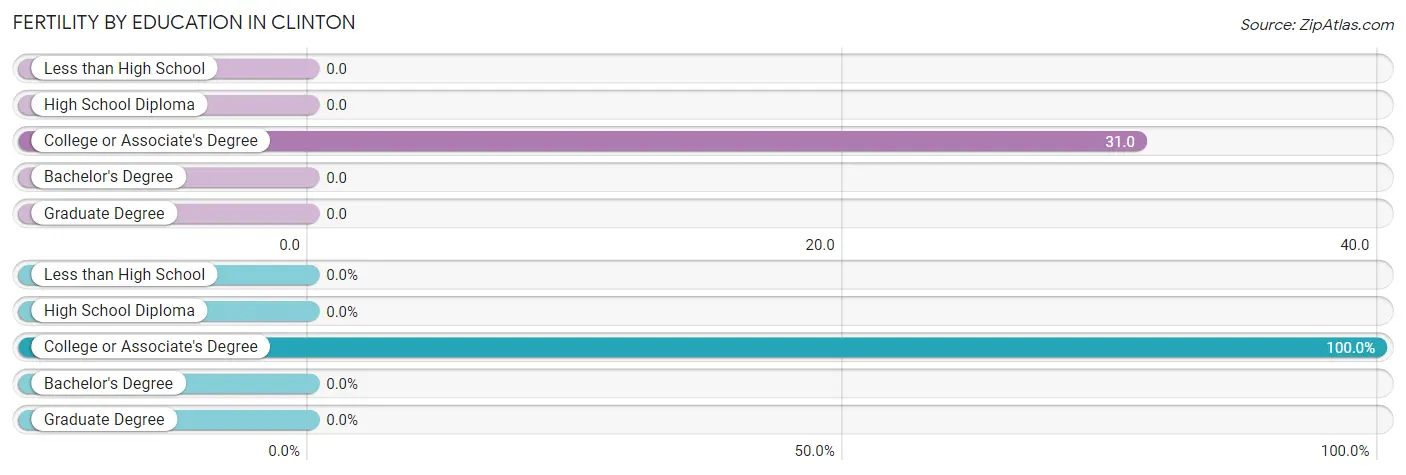
| Educational Attainment | Women with Births | Births / 1,000 Women |
| Less than High School | 0 (0.0%) | 0.0 |
| High School Diploma | 0 (0.0%) | 0.0 |
| College or Associate's Degree | 25 (100.0%) | 31.0 |
| Bachelor's Degree | 0 (0.0%) | 0.0 |
| Graduate Degree | 0 (0.0%) | 0.0 |
| Total | 25 (100.0%) | 12.0 |
Fertility by Education by Marriage Status in Clinton
48.0% of women with births in Clinton are unmarried. Women with the educational attainment of college or associate's degree are most likely to be married with 52.0% of them married at childbirth, while women with the educational attainment of college or associate's degree are least likely to be married with 48.0% of them unmarried at childbirth.
| Educational Attainment | Married | Unmarried |
| Less than High School | 0 (0.0%) | 0 (0.0%) |
| High School Diploma | 0 (0.0%) | 0 (0.0%) |
| College or Associate's Degree | 13 (52.0%) | 12 (48.0%) |
| Bachelor's Degree | 0 (0.0%) | 0 (0.0%) |
| Graduate Degree | 0 (0.0%) | 0 (0.0%) |
| Total | 13 (52.0%) | 12 (48.0%) |
Employment Characteristics in Clinton
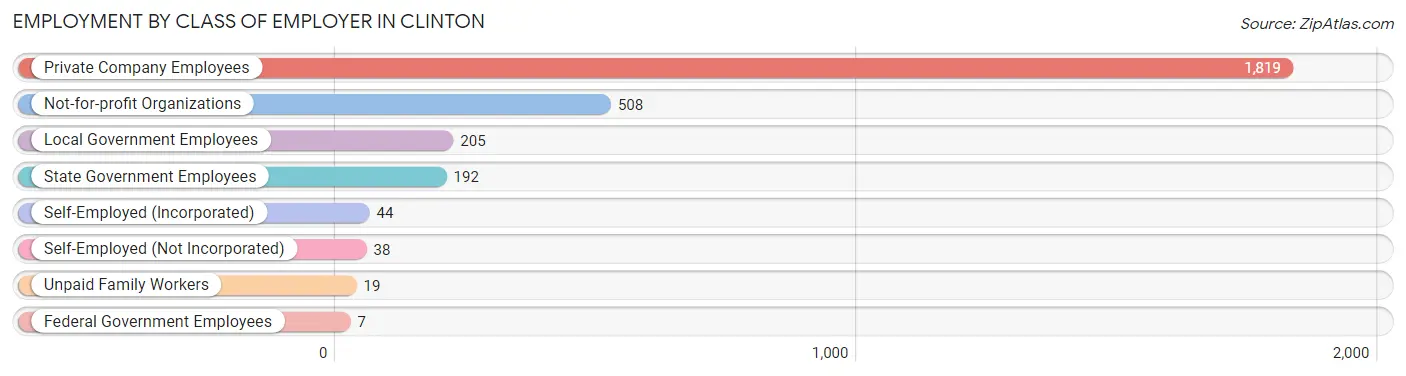
Employment by Class of Employer in Clinton
Among the 2,832 employed individuals in Clinton, private company employees (1,819 | 64.2%), not-for-profit organizations (508 | 17.9%), and local government employees (205 | 7.2%) make up the most common classes of employment.
| Employer Class | # Employees | % Employees |
| Private Company Employees | 1,819 | 64.2% |
| Self-Employed (Incorporated) | 44 | 1.5% |
| Self-Employed (Not Incorporated) | 38 | 1.3% |
| Not-for-profit Organizations | 508 | 17.9% |
| Local Government Employees | 205 | 7.2% |
| State Government Employees | 192 | 6.8% |
| Federal Government Employees | 7 | 0.3% |
| Unpaid Family Workers | 19 | 0.7% |
| Total | 2,832 | 100.0% |
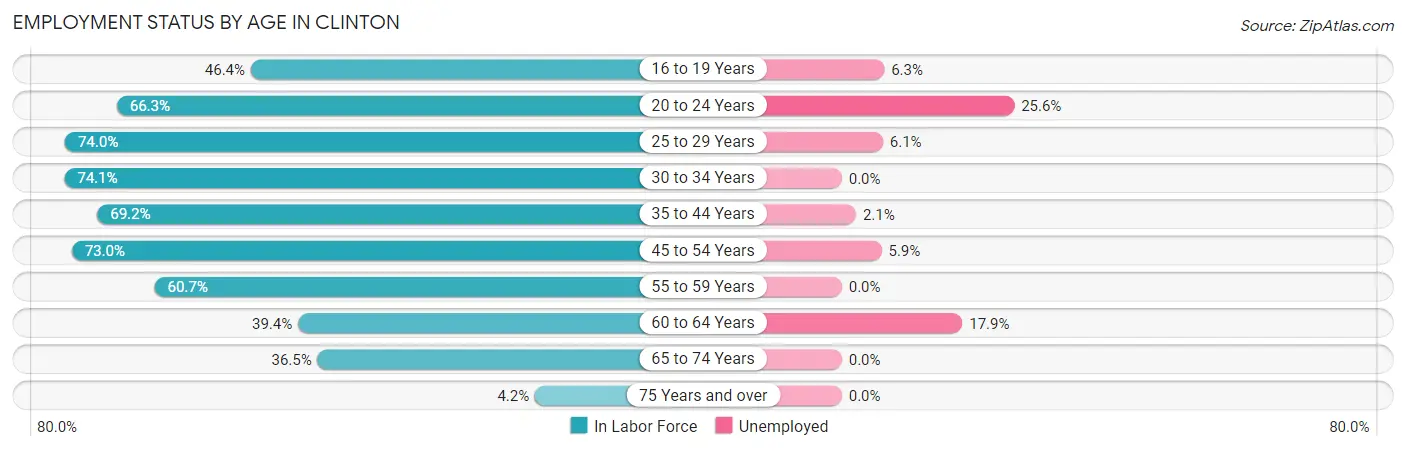
Employment Status by Age in Clinton
According to the labor force statistics for Clinton, out of the total population over 16 years of age (6,035), 53.2% or 3,211 individuals are in the labor force, with 7.8% or 250 of them unemployed. The age group with the highest labor force participation rate is 30 to 34 years, with 74.1% or 283 individuals in the labor force. Within the labor force, the 20 to 24 years age range has the highest percentage of unemployed individuals, with 25.6% or 153 of them being unemployed.
| Age Bracket | In Labor Force | Unemployed |
| 16 to 19 Years | 270 (46.4%) | 17 (6.3%) |
| 20 to 24 Years | 597 (66.3%) | 153 (25.6%) |
| 25 to 29 Years | 245 (74.0%) | 15 (6.1%) |
| 30 to 34 Years | 283 (74.1%) | 0 (0.0%) |
| 35 to 44 Years | 613 (69.2%) | 13 (2.1%) |
| 45 to 54 Years | 539 (73.0%) | 32 (5.9%) |
| 55 to 59 Years | 267 (60.7%) | 0 (0.0%) |
| 60 to 64 Years | 112 (39.4%) | 20 (17.9%) |
| 65 to 74 Years | 251 (36.5%) | 0 (0.0%) |
| 75 Years and over | 34 (4.2%) | 0 (0.0%) |
| Total | 3,211 (53.2%) | 250 (7.8%) |
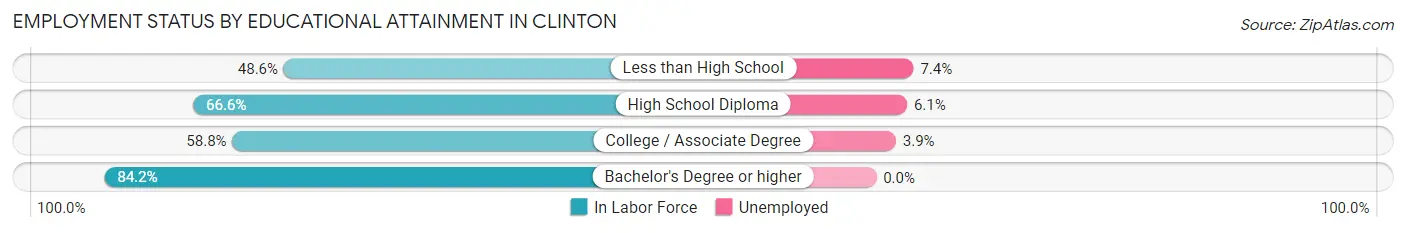
Employment Status by Educational Attainment in Clinton
According to labor force statistics for Clinton, 67.3% of individuals (2,060) out of the total population between 25 and 64 years of age (3,061) are in the labor force, with 3.9% or 80 of them being unemployed. The group with the highest labor force participation rate are those with the educational attainment of bachelor's degree or higher, with 84.2% or 669 individuals in the labor force. Within the labor force, individuals with less than high school education have the highest percentage of unemployment, with 7.4% or 15 of them being unemployed.
| Educational Attainment | In Labor Force | Unemployed |
| Less than High School | 202 (48.6%) | 31 (7.4%) |
| High School Diploma | 850 (66.6%) | 78 (6.1%) |
| College / Associate Degree | 337 (58.8%) | 22 (3.9%) |
| Bachelor's Degree or higher | 669 (84.2%) | 0 (0.0%) |
| Total | 2,060 (67.3%) | 119 (3.9%) |
Employment Occupations by Sex in Clinton
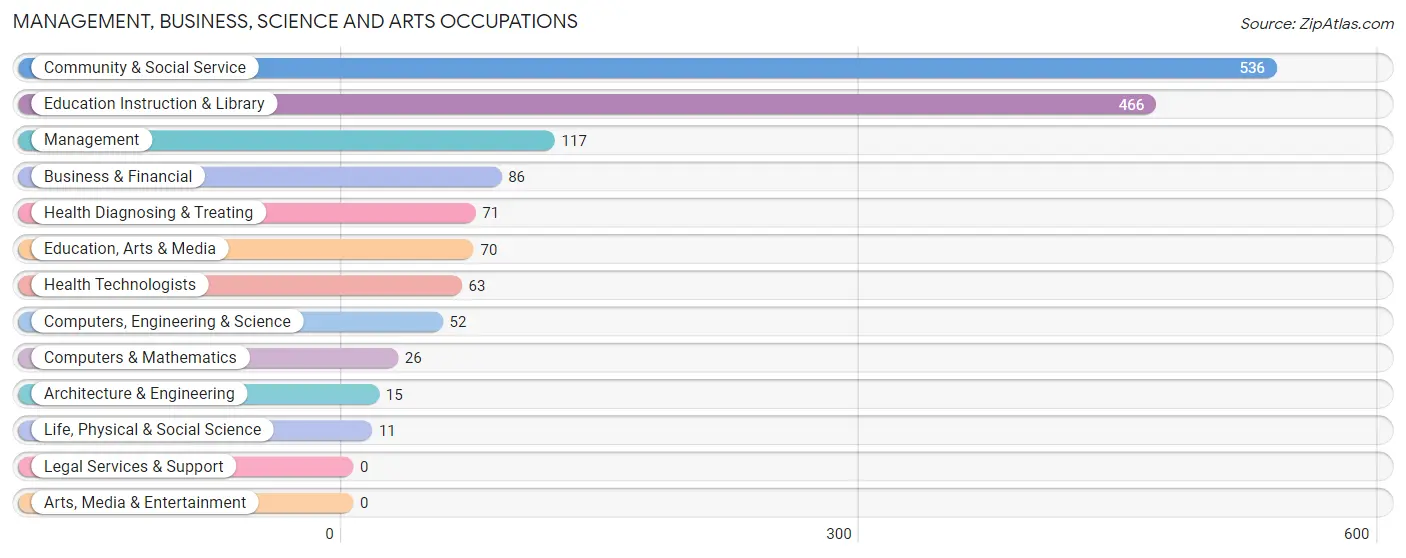
Management, Business, Science and Arts Occupations
The most common Management, Business, Science and Arts occupations in Clinton are Community & Social Service (536 | 18.1%), Education Instruction & Library (466 | 15.7%), Management (117 | 4.0%), Business & Financial (86 | 2.9%), and Health Diagnosing & Treating (71 | 2.4%).
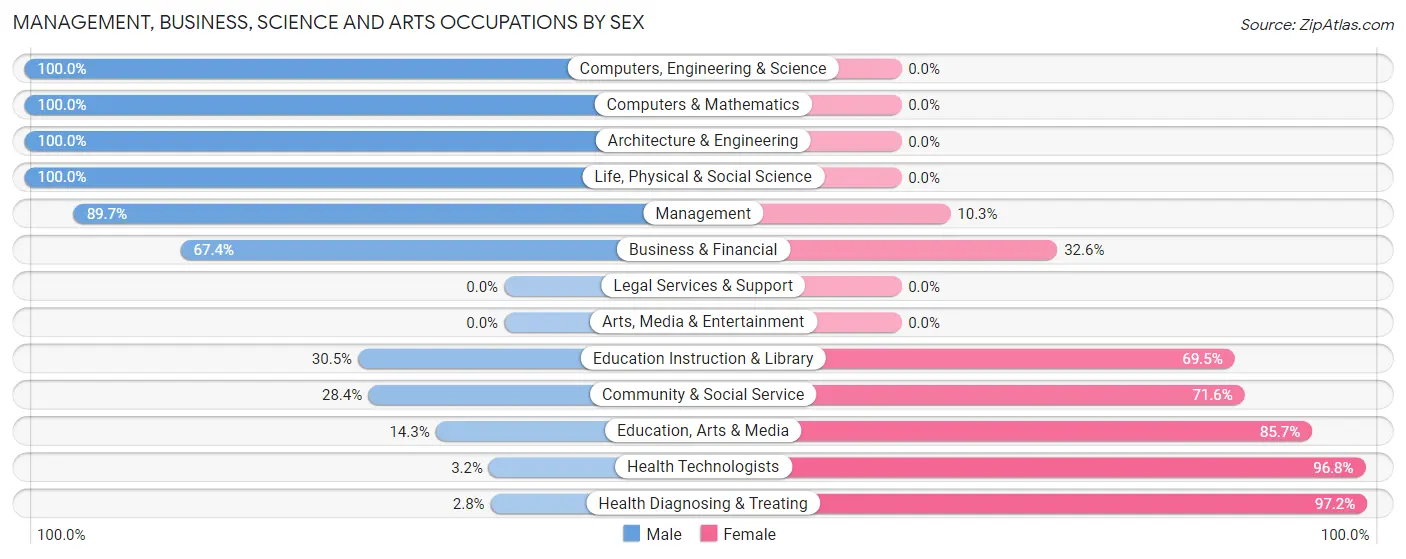
Management, Business, Science and Arts Occupations by Sex
Within the Management, Business, Science and Arts occupations in Clinton, the most male-oriented occupations are Computers, Engineering & Science (100.0%), Computers & Mathematics (100.0%), and Architecture & Engineering (100.0%), while the most female-oriented occupations are Health Diagnosing & Treating (97.2%), Health Technologists (96.8%), and Education, Arts & Media (85.7%).
| Occupation | Male | Female |
| Management | 105 (89.7%) | 12 (10.3%) |
| Business & Financial | 58 (67.4%) | 28 (32.6%) |
| Computers, Engineering & Science | 52 (100.0%) | 0 (0.0%) |
| Computers & Mathematics | 26 (100.0%) | 0 (0.0%) |
| Architecture & Engineering | 15 (100.0%) | 0 (0.0%) |
| Life, Physical & Social Science | 11 (100.0%) | 0 (0.0%) |
| Community & Social Service | 152 (28.4%) | 384 (71.6%) |
| Education, Arts & Media | 10 (14.3%) | 60 (85.7%) |
| Legal Services & Support | 0 (0.0%) | 0 (0.0%) |
| Education Instruction & Library | 142 (30.5%) | 324 (69.5%) |
| Arts, Media & Entertainment | 0 (0.0%) | 0 (0.0%) |
| Health Diagnosing & Treating | 2 (2.8%) | 69 (97.2%) |
| Health Technologists | 2 (3.2%) | 61 (96.8%) |
| Total (Category) | 369 (42.8%) | 493 (57.2%) |
| Total (Overall) | 1,362 (46.0%) | 1,599 (54.0%) |
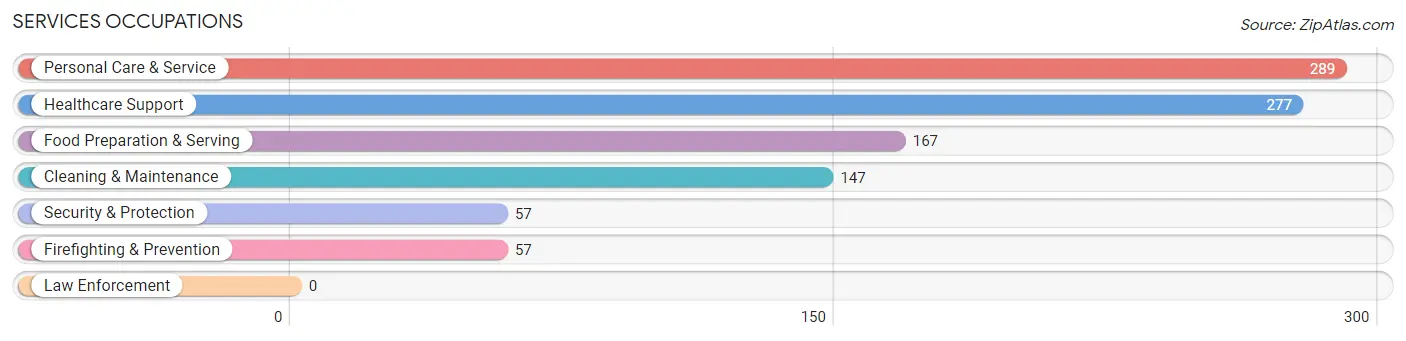
Services Occupations
The most common Services occupations in Clinton are Personal Care & Service (289 | 9.8%), Healthcare Support (277 | 9.3%), Food Preparation & Serving (167 | 5.6%), Cleaning & Maintenance (147 | 5.0%), and Security & Protection (57 | 1.9%).
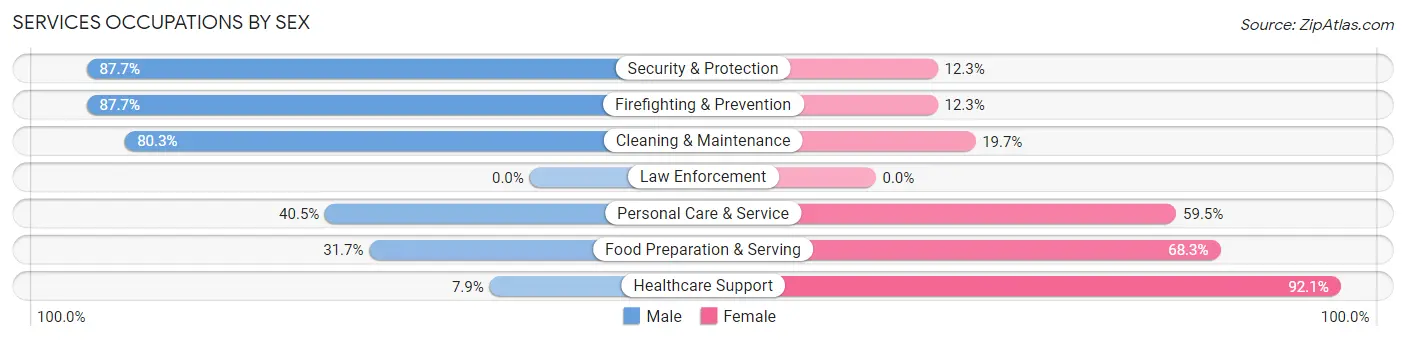
Services Occupations by Sex
Within the Services occupations in Clinton, the most male-oriented occupations are Security & Protection (87.7%), Firefighting & Prevention (87.7%), and Cleaning & Maintenance (80.3%), while the most female-oriented occupations are Healthcare Support (92.1%), Food Preparation & Serving (68.3%), and Personal Care & Service (59.5%).
| Occupation | Male | Female |
| Healthcare Support | 22 (7.9%) | 255 (92.1%) |
| Security & Protection | 50 (87.7%) | 7 (12.3%) |
| Firefighting & Prevention | 50 (87.7%) | 7 (12.3%) |
| Law Enforcement | 0 (0.0%) | 0 (0.0%) |
| Food Preparation & Serving | 53 (31.7%) | 114 (68.3%) |
| Cleaning & Maintenance | 118 (80.3%) | 29 (19.7%) |
| Personal Care & Service | 117 (40.5%) | 172 (59.5%) |
| Total (Category) | 360 (38.4%) | 577 (61.6%) |
| Total (Overall) | 1,362 (46.0%) | 1,599 (54.0%) |
Sales and Office Occupations
The most common Sales and Office occupations in Clinton are Sales & Related (288 | 9.7%), and Office & Administration (185 | 6.2%).
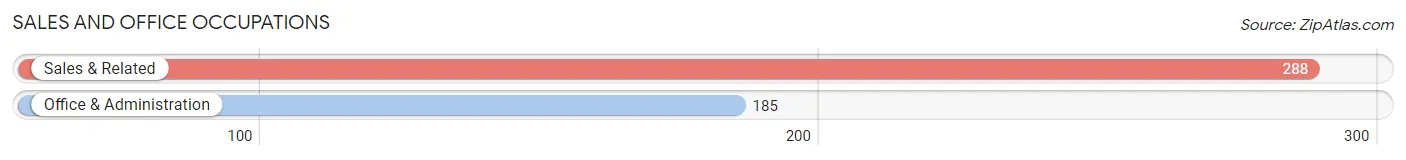
Sales and Office Occupations by Sex
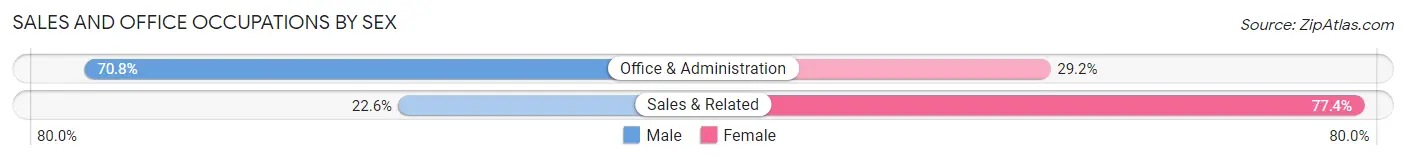
| Occupation | Male | Female |
| Sales & Related | 65 (22.6%) | 223 (77.4%) |
| Office & Administration | 131 (70.8%) | 54 (29.2%) |
| Total (Category) | 196 (41.4%) | 277 (58.6%) |
| Total (Overall) | 1,362 (46.0%) | 1,599 (54.0%) |
Natural Resources, Construction and Maintenance Occupations
The most common Natural Resources, Construction and Maintenance occupations in Clinton are Installation, Maintenance & Repair (42 | 1.4%), and Construction & Extraction (41 | 1.4%).
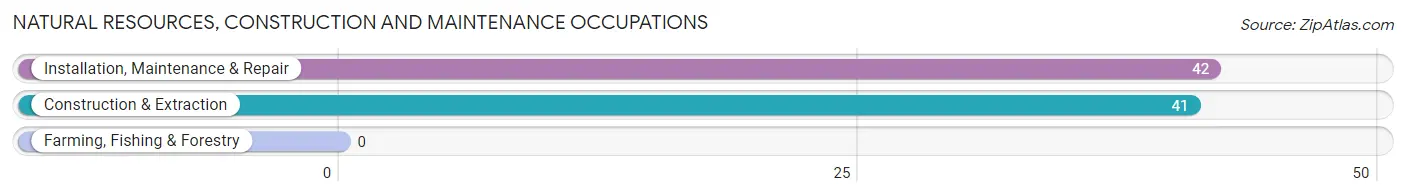
Natural Resources, Construction and Maintenance Occupations by Sex
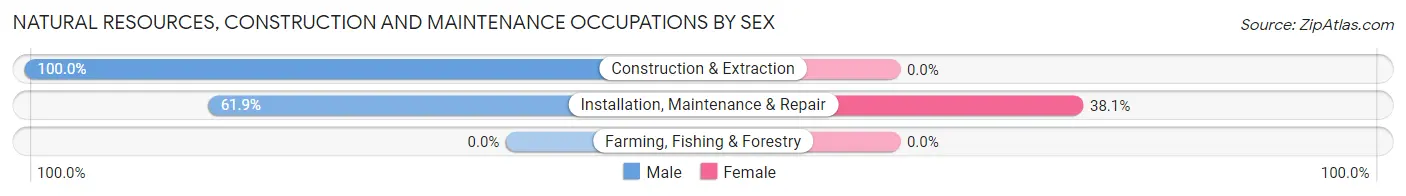
| Occupation | Male | Female |
| Farming, Fishing & Forestry | 0 (0.0%) | 0 (0.0%) |
| Construction & Extraction | 41 (100.0%) | 0 (0.0%) |
| Installation, Maintenance & Repair | 26 (61.9%) | 16 (38.1%) |
| Total (Category) | 67 (80.7%) | 16 (19.3%) |
| Total (Overall) | 1,362 (46.0%) | 1,599 (54.0%) |
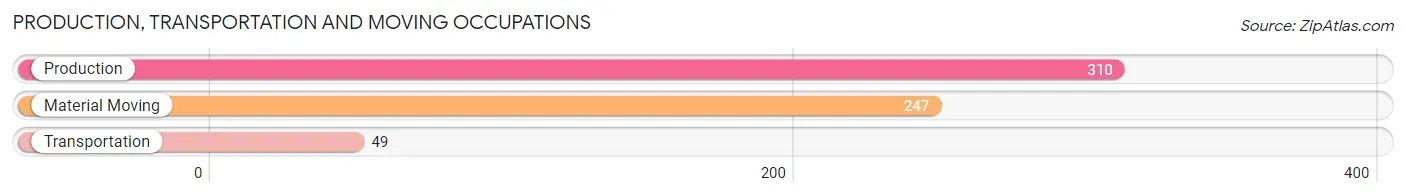
Production, Transportation and Moving Occupations
The most common Production, Transportation and Moving occupations in Clinton are Production (310 | 10.5%), Material Moving (247 | 8.3%), and Transportation (49 | 1.7%).
Production, Transportation and Moving Occupations by Sex
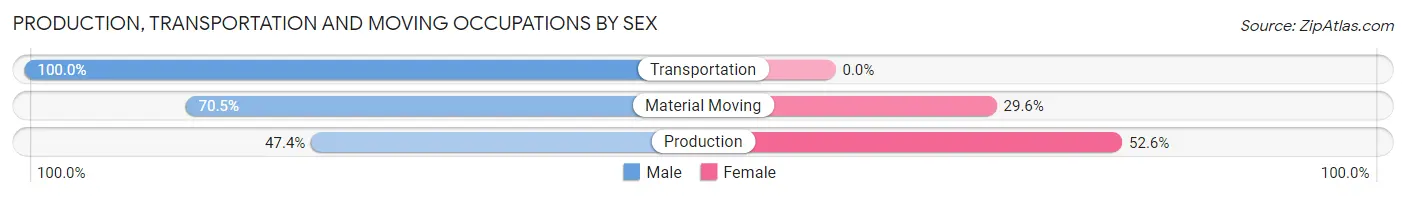
| Occupation | Male | Female |
| Production | 147 (47.4%) | 163 (52.6%) |
| Transportation | 49 (100.0%) | 0 (0.0%) |
| Material Moving | 174 (70.5%) | 73 (29.5%) |
| Total (Category) | 370 (61.1%) | 236 (38.9%) |
| Total (Overall) | 1,362 (46.0%) | 1,599 (54.0%) |
Employment Industries by Sex in Clinton
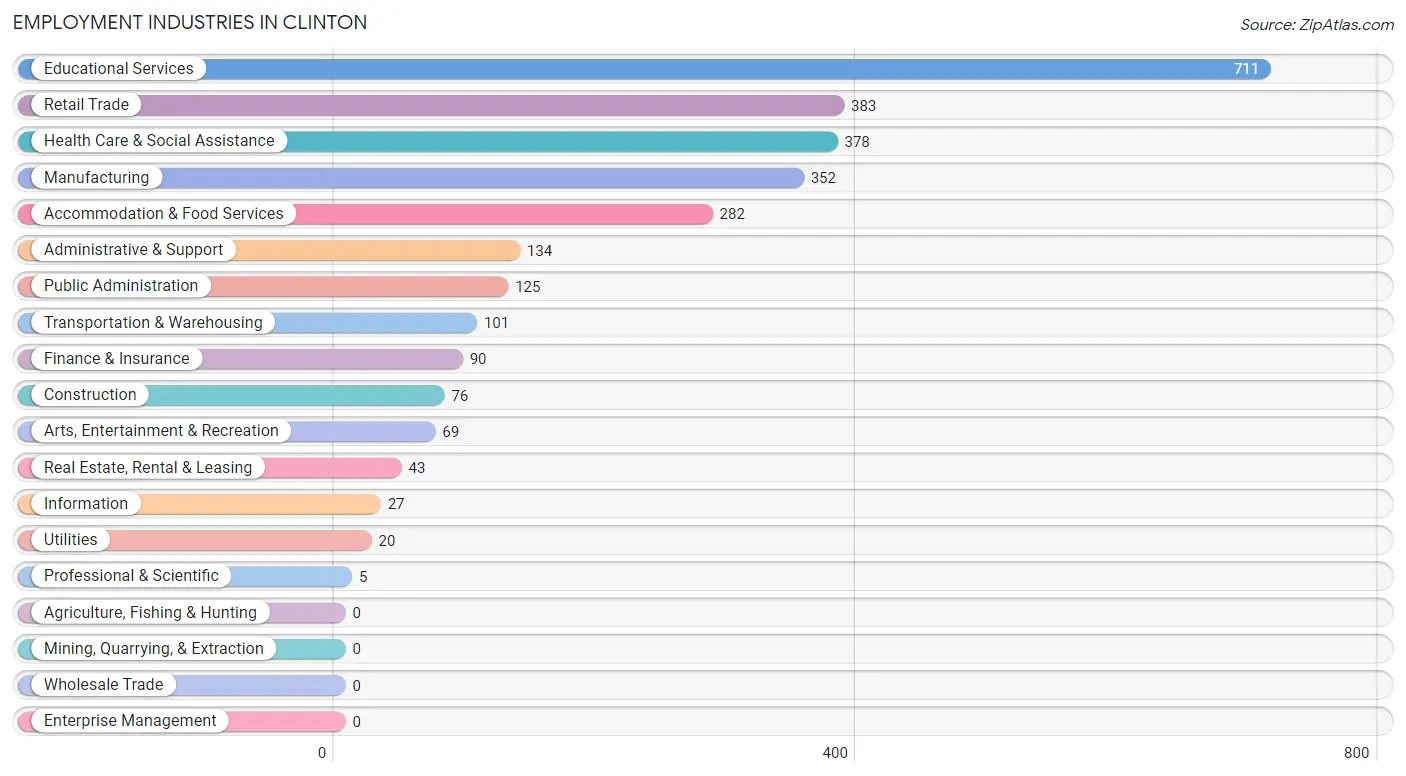
Employment Industries in Clinton
The major employment industries in Clinton include Educational Services (711 | 24.0%), Retail Trade (383 | 12.9%), Health Care & Social Assistance (378 | 12.8%), Manufacturing (352 | 11.9%), and Accommodation & Food Services (282 | 9.5%).
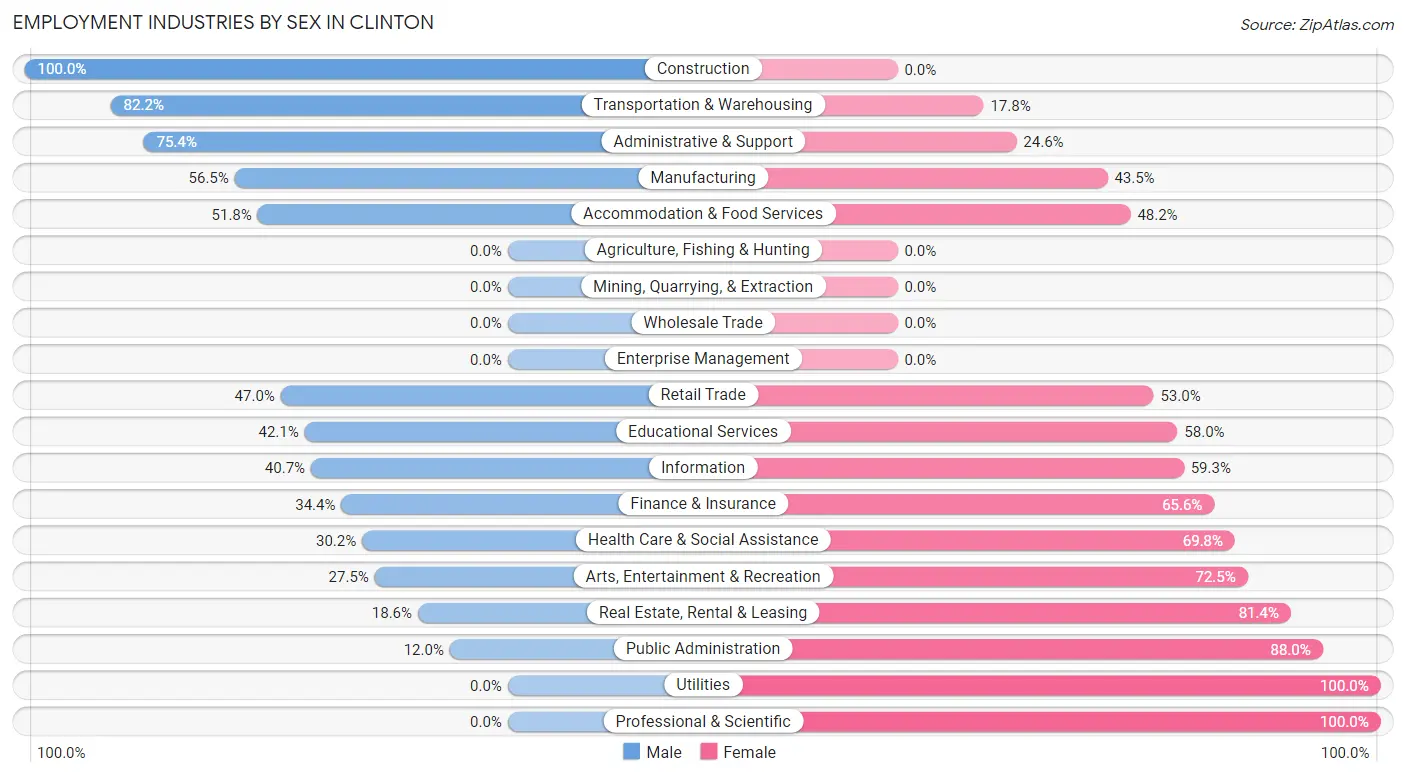
Employment Industries by Sex in Clinton
The Clinton industries that see more men than women are Construction (100.0%), Transportation & Warehousing (82.2%), and Administrative & Support (75.4%), whereas the industries that tend to have a higher number of women are Utilities (100.0%), Professional & Scientific (100.0%), and Public Administration (88.0%).
| Industry | Male | Female |
| Agriculture, Fishing & Hunting | 0 (0.0%) | 0 (0.0%) |
| Mining, Quarrying, & Extraction | 0 (0.0%) | 0 (0.0%) |
| Construction | 76 (100.0%) | 0 (0.0%) |
| Manufacturing | 199 (56.5%) | 153 (43.5%) |
| Wholesale Trade | 0 (0.0%) | 0 (0.0%) |
| Retail Trade | 180 (47.0%) | 203 (53.0%) |
| Transportation & Warehousing | 83 (82.2%) | 18 (17.8%) |
| Utilities | 0 (0.0%) | 20 (100.0%) |
| Information | 11 (40.7%) | 16 (59.3%) |
| Finance & Insurance | 31 (34.4%) | 59 (65.6%) |
| Real Estate, Rental & Leasing | 8 (18.6%) | 35 (81.4%) |
| Professional & Scientific | 0 (0.0%) | 5 (100.0%) |
| Enterprise Management | 0 (0.0%) | 0 (0.0%) |
| Administrative & Support | 101 (75.4%) | 33 (24.6%) |
| Educational Services | 299 (42.0%) | 412 (58.0%) |
| Health Care & Social Assistance | 114 (30.2%) | 264 (69.8%) |
| Arts, Entertainment & Recreation | 19 (27.5%) | 50 (72.5%) |
| Accommodation & Food Services | 146 (51.8%) | 136 (48.2%) |
| Public Administration | 15 (12.0%) | 110 (88.0%) |
| Total | 1,362 (46.0%) | 1,599 (54.0%) |
Education in Clinton
School Enrollment in Clinton
The most common levels of schooling among the 2,361 students in Clinton are college / undergraduate (988 | 41.8%), high school (444 | 18.8%), and middle school (352 | 14.9%).
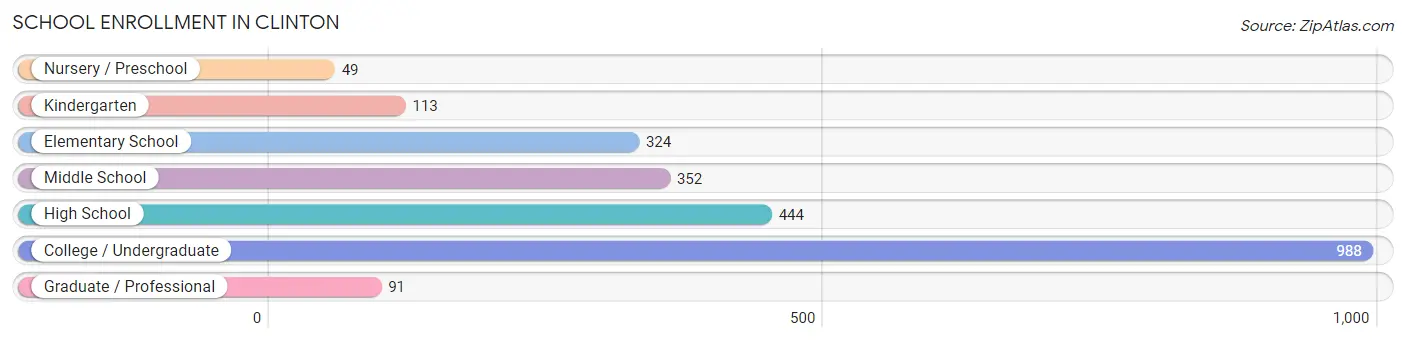
| School Level | # Students | % Students |
| Nursery / Preschool | 49 | 2.1% |
| Kindergarten | 113 | 4.8% |
| Elementary School | 324 | 13.7% |
| Middle School | 352 | 14.9% |
| High School | 444 | 18.8% |
| College / Undergraduate | 988 | 41.8% |
| Graduate / Professional | 91 | 3.8% |
| Total | 2,361 | 100.0% |
School Enrollment by Age by Funding Source in Clinton
Out of a total of 2,361 students who are enrolled in schools in Clinton, 907 (38.4%) attend a private institution, while the remaining 1,454 (61.6%) are enrolled in public schools. The age group of 20 to 24 year olds has the highest likelihood of being enrolled in private schools, with 415 (79.6% in the age bracket) enrolled. Conversely, the age group of 15 to 17 year olds has the lowest likelihood of being enrolled in a private school, with 338 (100.0% in the age bracket) attending a public institution.
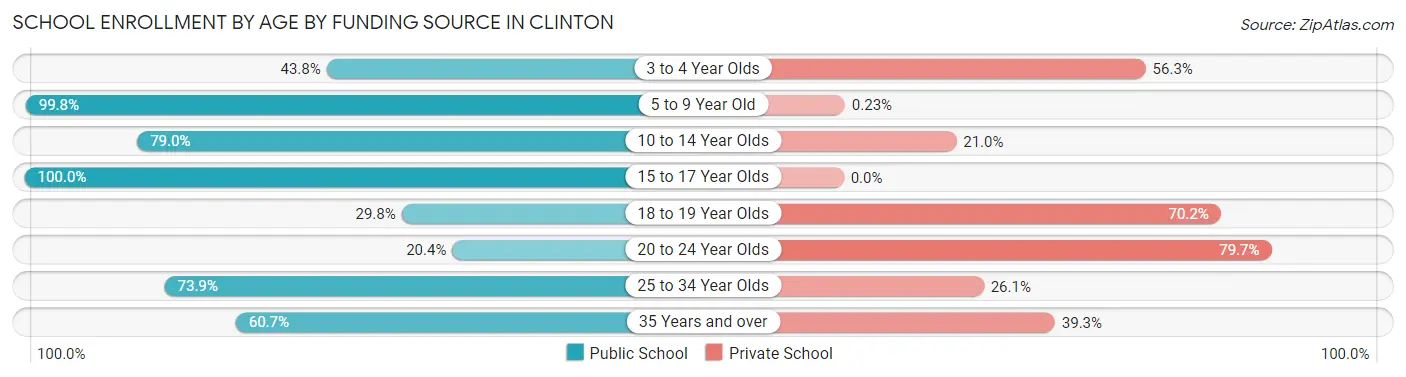
| Age Bracket | Public School | Private School |
| 3 to 4 Year Olds | 21 (43.8%) | 27 (56.2%) |
| 5 to 9 Year Old | 437 (99.8%) | 1 (0.2%) |
| 10 to 14 Year Olds | 339 (79.0%) | 90 (21.0%) |
| 15 to 17 Year Olds | 338 (100.0%) | 0 (0.0%) |
| 18 to 19 Year Olds | 143 (29.8%) | 337 (70.2%) |
| 20 to 24 Year Olds | 106 (20.3%) | 415 (79.6%) |
| 25 to 34 Year Olds | 34 (73.9%) | 12 (26.1%) |
| 35 Years and over | 37 (60.7%) | 24 (39.3%) |
| Total | 1,454 (61.6%) | 907 (38.4%) |
Educational Attainment by Field of Study in Clinton
Education (385 | 28.7%), business (209 | 15.6%), bio, nature & agricultural (141 | 10.5%), liberal arts & history (109 | 8.1%), and computers & mathematics (86 | 6.4%) are the most common fields of study among 1,341 individuals in Clinton who have obtained a bachelor's degree or higher.
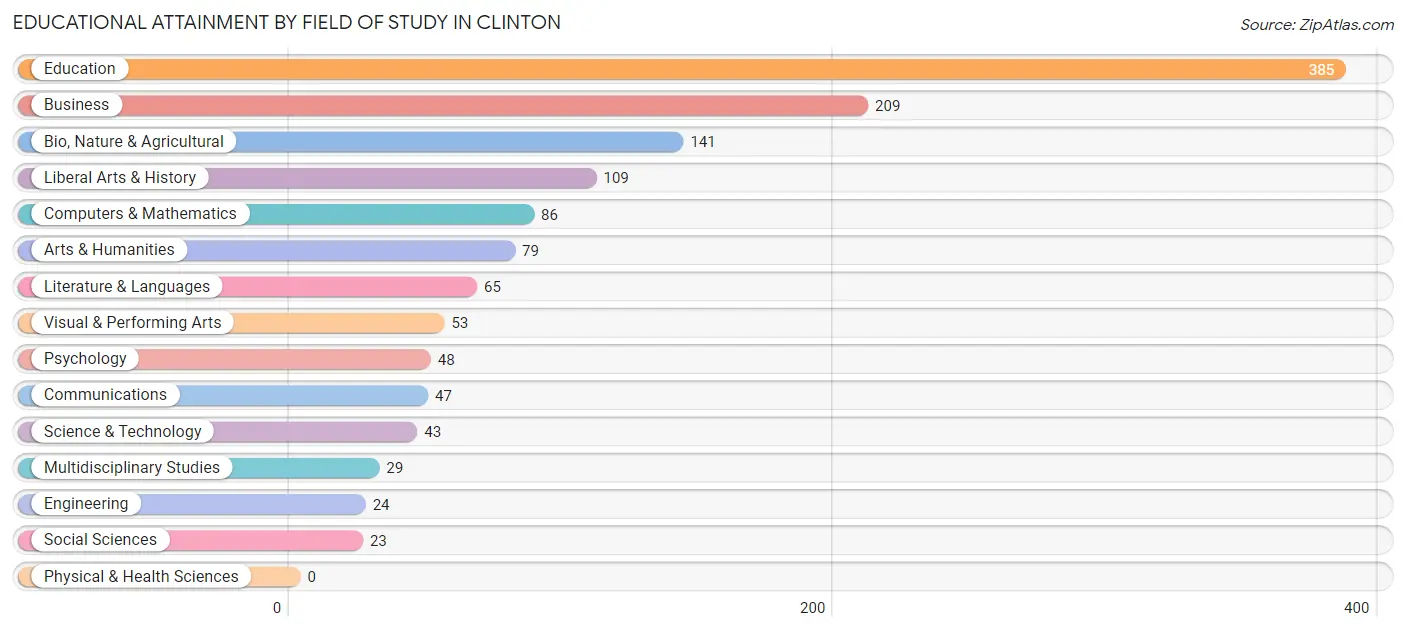
| Field of Study | # Graduates | % Graduates |
| Computers & Mathematics | 86 | 6.4% |
| Bio, Nature & Agricultural | 141 | 10.5% |
| Physical & Health Sciences | 0 | 0.0% |
| Psychology | 48 | 3.6% |
| Social Sciences | 23 | 1.7% |
| Engineering | 24 | 1.8% |
| Multidisciplinary Studies | 29 | 2.2% |
| Science & Technology | 43 | 3.2% |
| Business | 209 | 15.6% |
| Education | 385 | 28.7% |
| Literature & Languages | 65 | 4.9% |
| Liberal Arts & History | 109 | 8.1% |
| Visual & Performing Arts | 53 | 4.0% |
| Communications | 47 | 3.5% |
| Arts & Humanities | 79 | 5.9% |
| Total | 1,341 | 100.0% |
Transportation & Commute in Clinton
Vehicle Availability by Sex in Clinton
The most prevalent vehicle ownership categories in Clinton are males with 2 vehicles (305, accounting for 29.4%) and females with 2 vehicles (273, making up 23.5%).
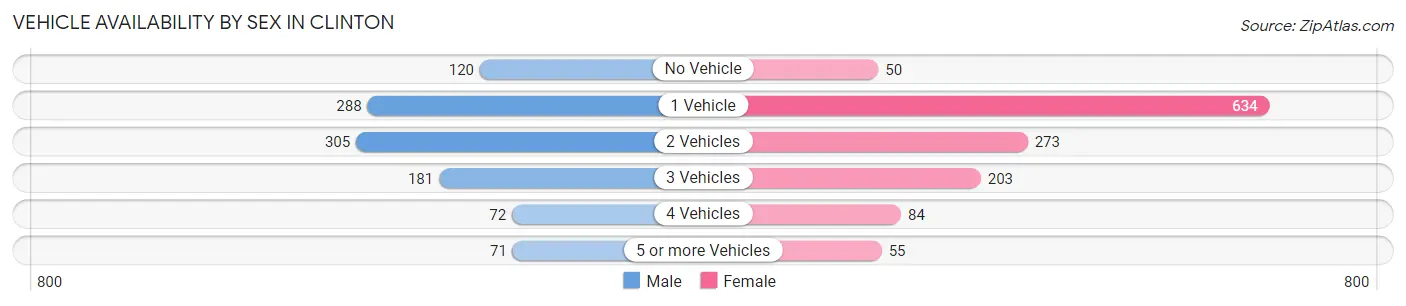
| Vehicles Available | Male | Female |
| No Vehicle | 120 (11.6%) | 50 (3.8%) |
| 1 Vehicle | 288 (27.8%) | 634 (48.8%) |
| 2 Vehicles | 305 (29.4%) | 273 (21.0%) |
| 3 Vehicles | 181 (17.4%) | 203 (15.6%) |
| 4 Vehicles | 72 (6.9%) | 84 (6.5%) |
| 5 or more Vehicles | 71 (6.9%) | 55 (4.2%) |
| Total | 1,037 (100.0%) | 1,299 (100.0%) |
Commute Time in Clinton
The most frequently occuring commute durations in Clinton are 5 to 9 minutes (609 commuters, 22.5%), 10 to 14 minutes (504 commuters, 18.6%), and less than 5 minutes (356 commuters, 13.2%).
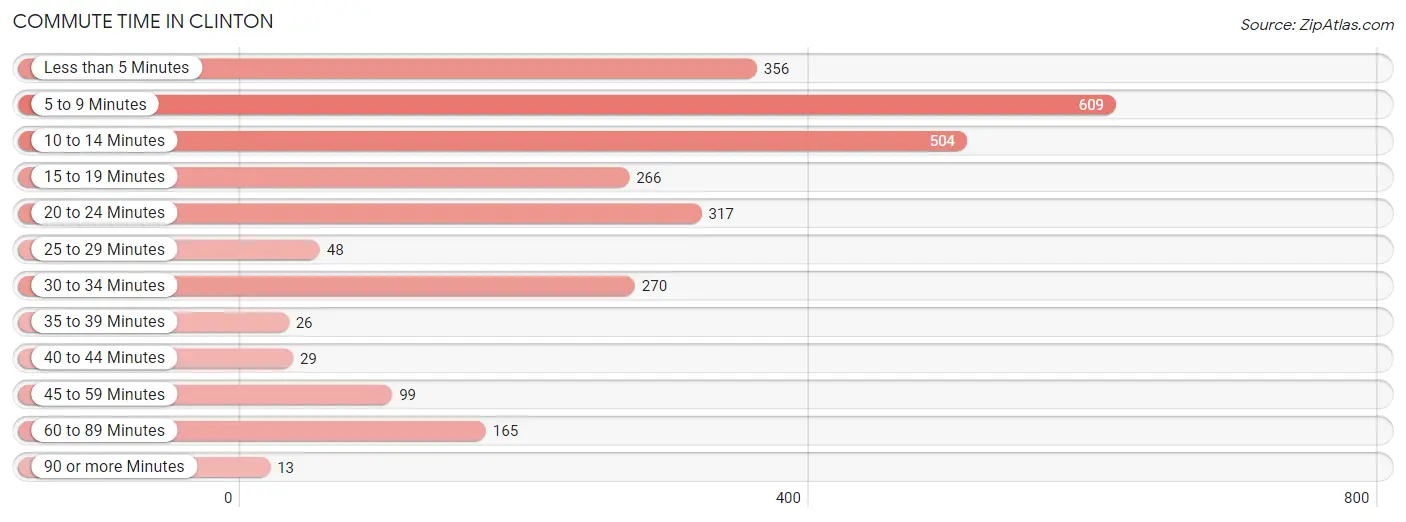
| Commute Time | # Commuters | % Commuters |
| Less than 5 Minutes | 356 | 13.2% |
| 5 to 9 Minutes | 609 | 22.5% |
| 10 to 14 Minutes | 504 | 18.6% |
| 15 to 19 Minutes | 266 | 9.8% |
| 20 to 24 Minutes | 317 | 11.7% |
| 25 to 29 Minutes | 48 | 1.8% |
| 30 to 34 Minutes | 270 | 10.0% |
| 35 to 39 Minutes | 26 | 1.0% |
| 40 to 44 Minutes | 29 | 1.1% |
| 45 to 59 Minutes | 99 | 3.7% |
| 60 to 89 Minutes | 165 | 6.1% |
| 90 or more Minutes | 13 | 0.5% |
Commute Time by Sex in Clinton
The most common commute times in Clinton are 10 to 14 minutes (228 commuters, 19.3%) for males and 5 to 9 minutes (441 commuters, 29.0%) for females.
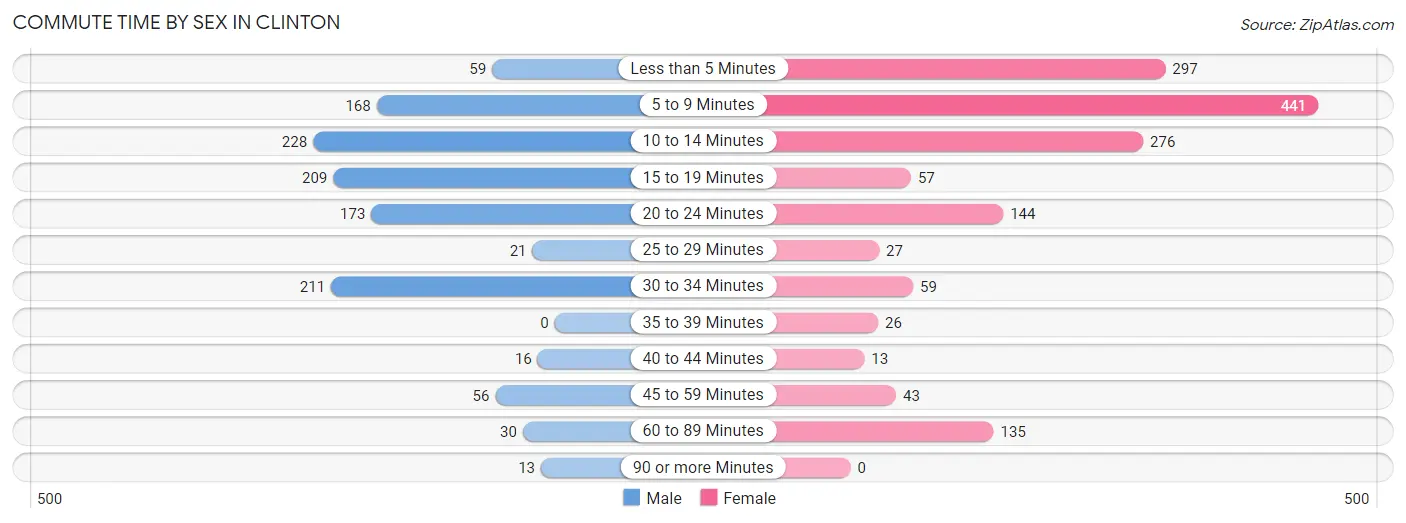
| Commute Time | Male | Female |
| Less than 5 Minutes | 59 (5.0%) | 297 (19.6%) |
| 5 to 9 Minutes | 168 (14.2%) | 441 (29.0%) |
| 10 to 14 Minutes | 228 (19.3%) | 276 (18.2%) |
| 15 to 19 Minutes | 209 (17.6%) | 57 (3.7%) |
| 20 to 24 Minutes | 173 (14.6%) | 144 (9.5%) |
| 25 to 29 Minutes | 21 (1.8%) | 27 (1.8%) |
| 30 to 34 Minutes | 211 (17.8%) | 59 (3.9%) |
| 35 to 39 Minutes | 0 (0.0%) | 26 (1.7%) |
| 40 to 44 Minutes | 16 (1.3%) | 13 (0.9%) |
| 45 to 59 Minutes | 56 (4.7%) | 43 (2.8%) |
| 60 to 89 Minutes | 30 (2.5%) | 135 (8.9%) |
| 90 or more Minutes | 13 (1.1%) | 0 (0.0%) |
Time of Departure to Work by Sex in Clinton
The most frequent times of departure to work in Clinton are 4:00 PM to 11:59 PM (257, 21.7%) for males and 4:00 PM to 11:59 PM (297, 19.6%) for females.
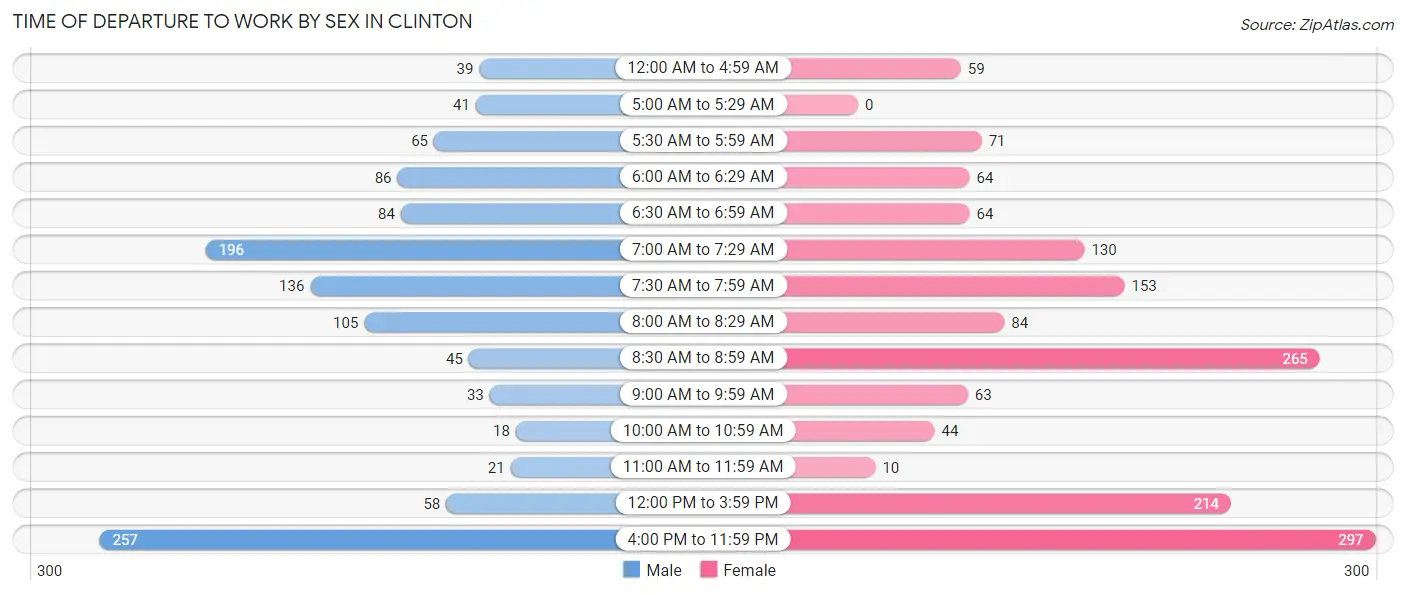
| Time of Departure | Male | Female |
| 12:00 AM to 4:59 AM | 39 (3.3%) | 59 (3.9%) |
| 5:00 AM to 5:29 AM | 41 (3.5%) | 0 (0.0%) |
| 5:30 AM to 5:59 AM | 65 (5.5%) | 71 (4.7%) |
| 6:00 AM to 6:29 AM | 86 (7.3%) | 64 (4.2%) |
| 6:30 AM to 6:59 AM | 84 (7.1%) | 64 (4.2%) |
| 7:00 AM to 7:29 AM | 196 (16.6%) | 130 (8.6%) |
| 7:30 AM to 7:59 AM | 136 (11.5%) | 153 (10.1%) |
| 8:00 AM to 8:29 AM | 105 (8.9%) | 84 (5.5%) |
| 8:30 AM to 8:59 AM | 45 (3.8%) | 265 (17.5%) |
| 9:00 AM to 9:59 AM | 33 (2.8%) | 63 (4.2%) |
| 10:00 AM to 10:59 AM | 18 (1.5%) | 44 (2.9%) |
| 11:00 AM to 11:59 AM | 21 (1.8%) | 10 (0.7%) |
| 12:00 PM to 3:59 PM | 58 (4.9%) | 214 (14.1%) |
| 4:00 PM to 11:59 PM | 257 (21.7%) | 297 (19.6%) |
| Total | 1,184 (100.0%) | 1,518 (100.0%) |
Housing Occupancy in Clinton
Occupancy by Ownership in Clinton
Of the total 2,353 dwellings in Clinton, owner-occupied units account for 1,124 (47.8%), while renter-occupied units make up 1,229 (52.2%).
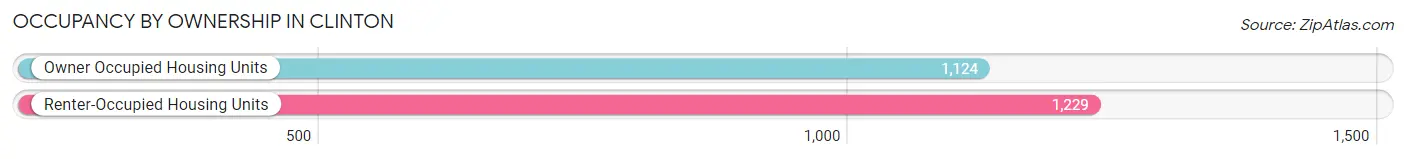
| Occupancy | # Housing Units | % Housing Units |
| Owner Occupied Housing Units | 1,124 | 47.8% |
| Renter-Occupied Housing Units | 1,229 | 52.2% |
| Total Occupied Housing Units | 2,353 | 100.0% |
Occupancy by Household Size in Clinton
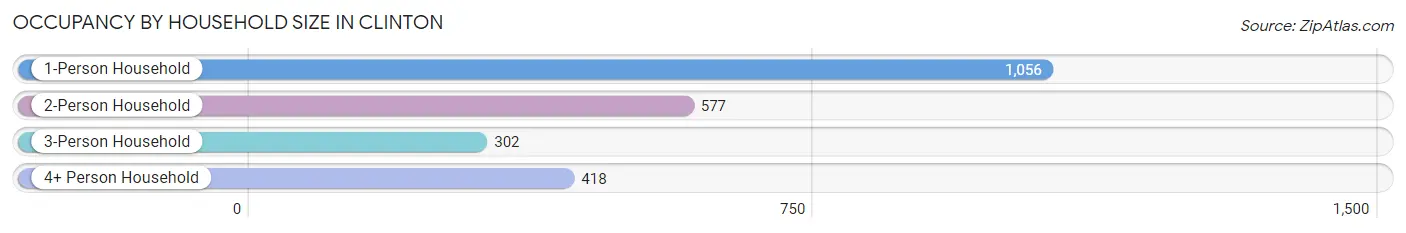
| Household Size | # Housing Units | % Housing Units |
| 1-Person Household | 1,056 | 44.9% |
| 2-Person Household | 577 | 24.5% |
| 3-Person Household | 302 | 12.8% |
| 4+ Person Household | 418 | 17.8% |
| Total Housing Units | 2,353 | 100.0% |
Occupancy by Ownership by Household Size in Clinton
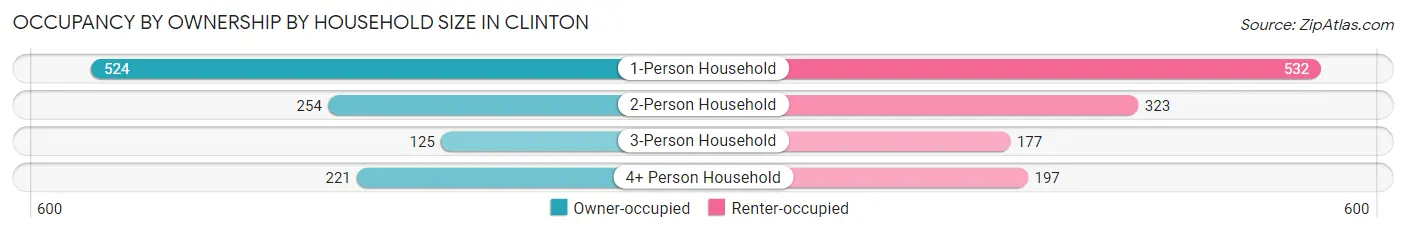
| Household Size | Owner-occupied | Renter-occupied |
| 1-Person Household | 524 (49.6%) | 532 (50.4%) |
| 2-Person Household | 254 (44.0%) | 323 (56.0%) |
| 3-Person Household | 125 (41.4%) | 177 (58.6%) |
| 4+ Person Household | 221 (52.9%) | 197 (47.1%) |
| Total Housing Units | 1,124 (47.8%) | 1,229 (52.2%) |
Occupancy by Educational Attainment in Clinton
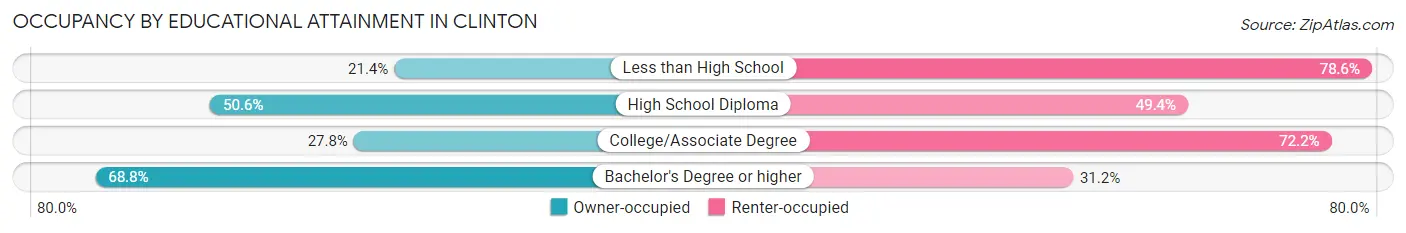
| Household Size | Owner-occupied | Renter-occupied |
| Less than High School | 83 (21.4%) | 305 (78.6%) |
| High School Diploma | 396 (50.6%) | 387 (49.4%) |
| College/Associate Degree | 114 (27.8%) | 296 (72.2%) |
| Bachelor's Degree or higher | 531 (68.8%) | 241 (31.2%) |
Occupancy by Age of Householder in Clinton
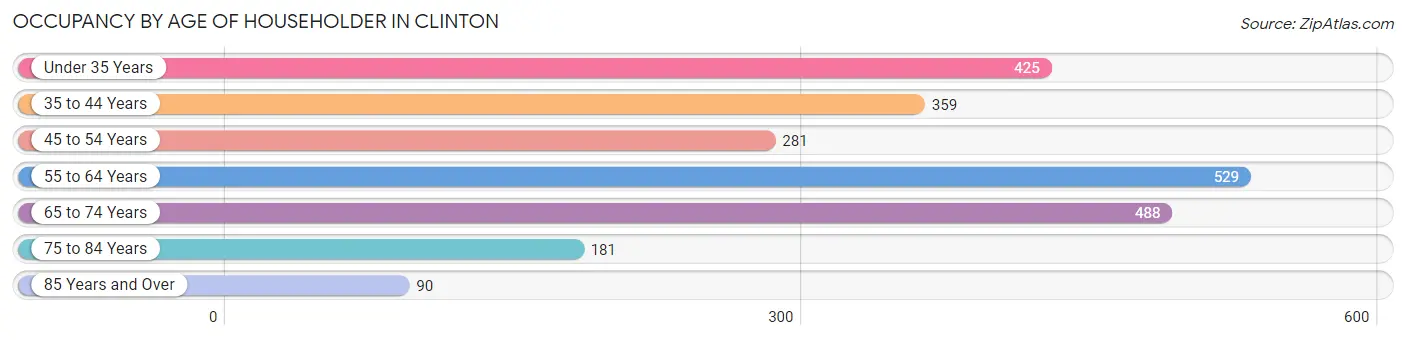
| Age Bracket | # Households | % Households |
| Under 35 Years | 425 | 18.1% |
| 35 to 44 Years | 359 | 15.3% |
| 45 to 54 Years | 281 | 11.9% |
| 55 to 64 Years | 529 | 22.5% |
| 65 to 74 Years | 488 | 20.7% |
| 75 to 84 Years | 181 | 7.7% |
| 85 Years and Over | 90 | 3.8% |
| Total | 2,353 | 100.0% |
Housing Finances in Clinton
Median Income by Occupancy in Clinton
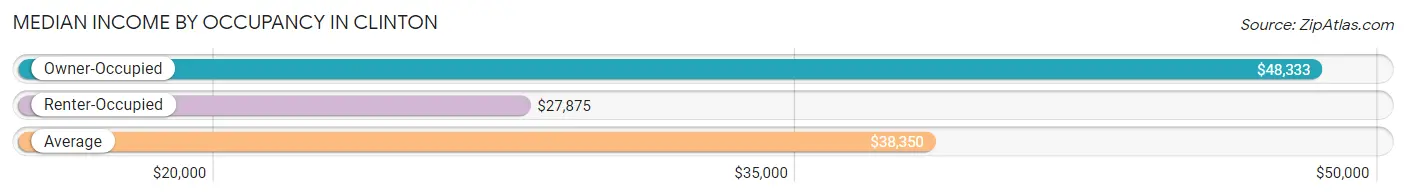
| Occupancy Type | # Households | Median Income |
| Owner-Occupied | 1,124 (47.8%) | $48,333 |
| Renter-Occupied | 1,229 (52.2%) | $27,875 |
| Average | 2,353 (100.0%) | $38,350 |
Occupancy by Householder Income Bracket in Clinton
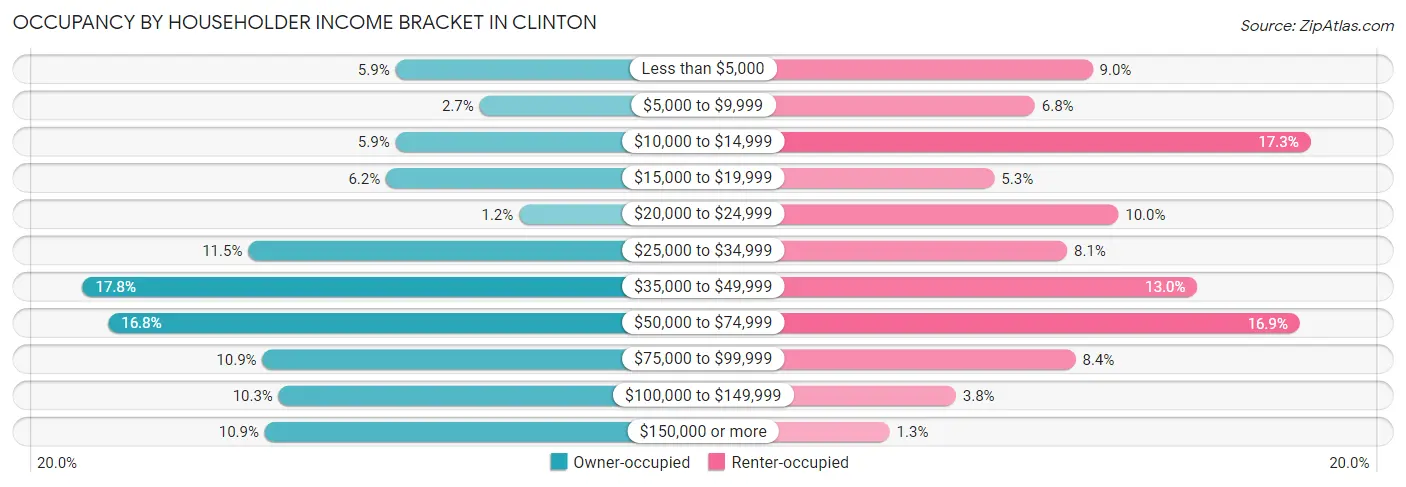
| Income Bracket | Owner-occupied | Renter-occupied |
| Less than $5,000 | 66 (5.9%) | 111 (9.0%) |
| $5,000 to $9,999 | 30 (2.7%) | 84 (6.8%) |
| $10,000 to $14,999 | 66 (5.9%) | 213 (17.3%) |
| $15,000 to $19,999 | 70 (6.2%) | 65 (5.3%) |
| $20,000 to $24,999 | 13 (1.2%) | 123 (10.0%) |
| $25,000 to $34,999 | 129 (11.5%) | 99 (8.1%) |
| $35,000 to $49,999 | 200 (17.8%) | 160 (13.0%) |
| $50,000 to $74,999 | 189 (16.8%) | 208 (16.9%) |
| $75,000 to $99,999 | 123 (10.9%) | 103 (8.4%) |
| $100,000 to $149,999 | 116 (10.3%) | 47 (3.8%) |
| $150,000 or more | 122 (10.8%) | 16 (1.3%) |
| Total | 1,124 (100.0%) | 1,229 (100.0%) |
Monthly Housing Cost Tiers in Clinton
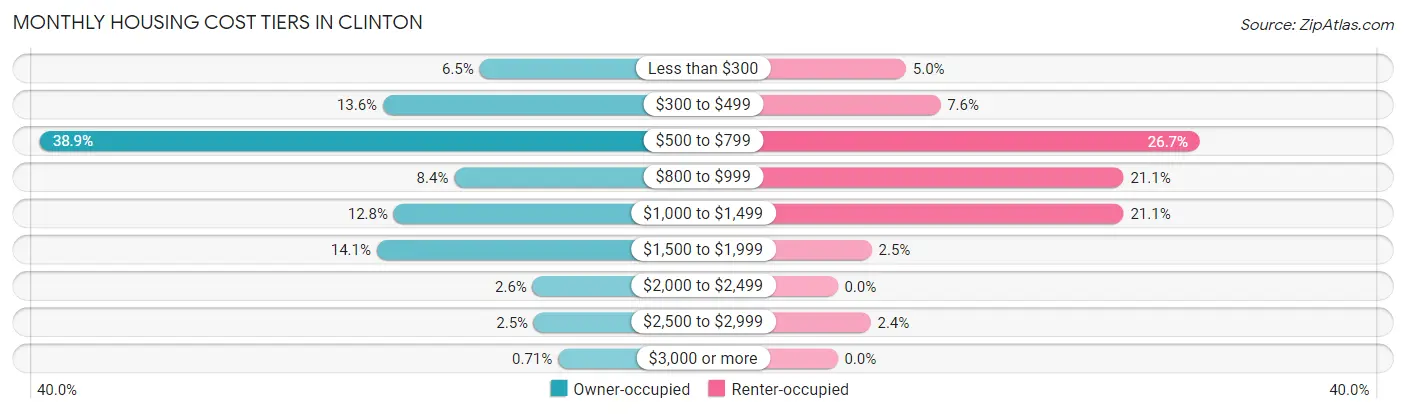
| Monthly Cost | Owner-occupied | Renter-occupied |
| Less than $300 | 73 (6.5%) | 62 (5.0%) |
| $300 to $499 | 153 (13.6%) | 93 (7.6%) |
| $500 to $799 | 437 (38.9%) | 328 (26.7%) |
| $800 to $999 | 94 (8.4%) | 259 (21.1%) |
| $1,000 to $1,499 | 144 (12.8%) | 259 (21.1%) |
| $1,500 to $1,999 | 158 (14.1%) | 31 (2.5%) |
| $2,000 to $2,499 | 29 (2.6%) | 0 (0.0%) |
| $2,500 to $2,999 | 28 (2.5%) | 30 (2.4%) |
| $3,000 or more | 8 (0.7%) | 0 (0.0%) |
| Total | 1,124 (100.0%) | 1,229 (100.0%) |
Physical Housing Characteristics in Clinton
Housing Structures in Clinton
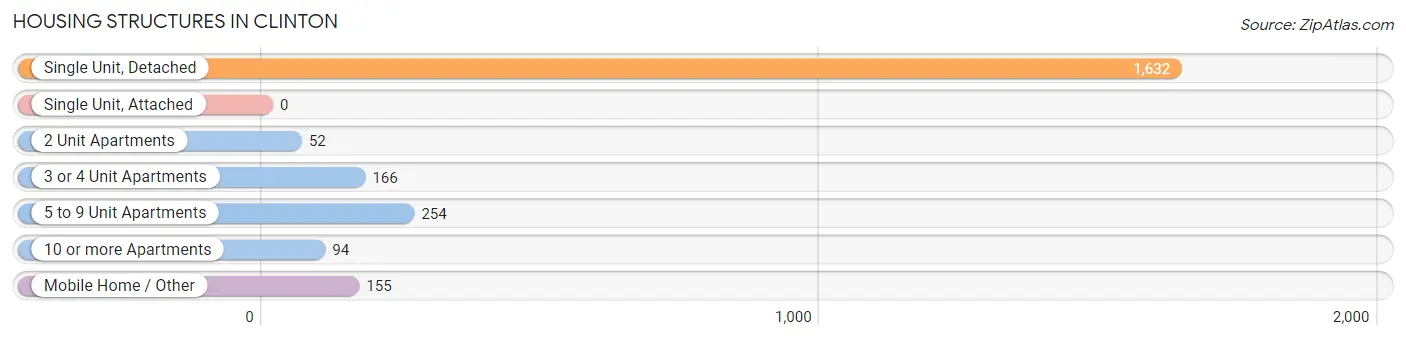
| Structure Type | # Housing Units | % Housing Units |
| Single Unit, Detached | 1,632 | 69.4% |
| Single Unit, Attached | 0 | 0.0% |
| 2 Unit Apartments | 52 | 2.2% |
| 3 or 4 Unit Apartments | 166 | 7.0% |
| 5 to 9 Unit Apartments | 254 | 10.8% |
| 10 or more Apartments | 94 | 4.0% |
| Mobile Home / Other | 155 | 6.6% |
| Total | 2,353 | 100.0% |
Housing Structures by Occupancy in Clinton
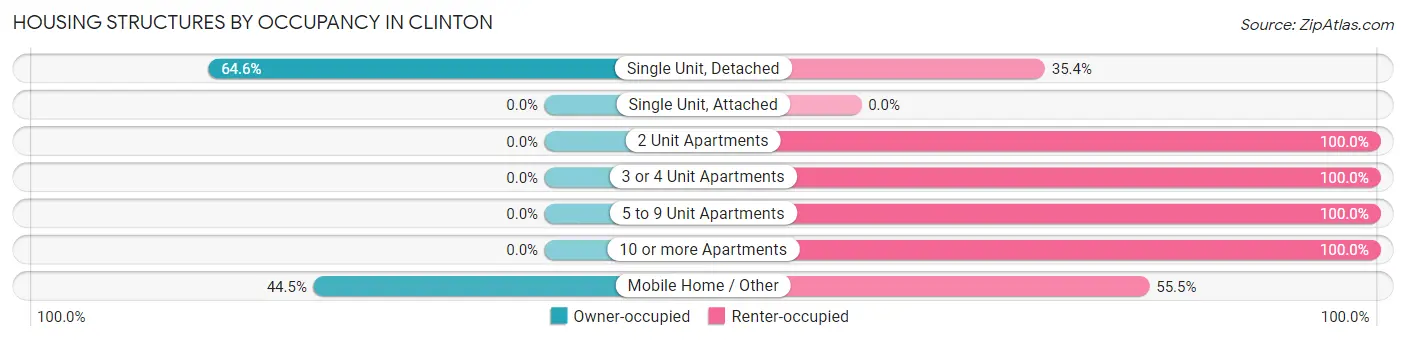
| Structure Type | Owner-occupied | Renter-occupied |
| Single Unit, Detached | 1,055 (64.6%) | 577 (35.4%) |
| Single Unit, Attached | 0 (0.0%) | 0 (0.0%) |
| 2 Unit Apartments | 0 (0.0%) | 52 (100.0%) |
| 3 or 4 Unit Apartments | 0 (0.0%) | 166 (100.0%) |
| 5 to 9 Unit Apartments | 0 (0.0%) | 254 (100.0%) |
| 10 or more Apartments | 0 (0.0%) | 94 (100.0%) |
| Mobile Home / Other | 69 (44.5%) | 86 (55.5%) |
| Total | 1,124 (47.8%) | 1,229 (52.2%) |
Housing Structures by Number of Rooms in Clinton
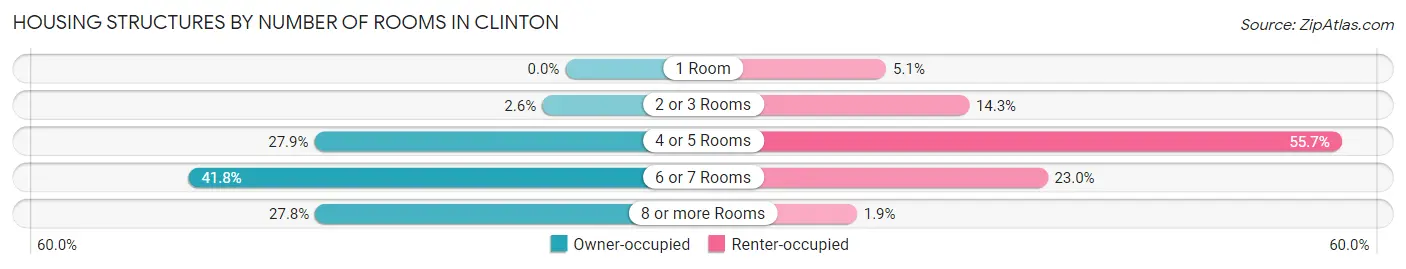
| Number of Rooms | Owner-occupied | Renter-occupied |
| 1 Room | 0 (0.0%) | 63 (5.1%) |
| 2 or 3 Rooms | 29 (2.6%) | 176 (14.3%) |
| 4 or 5 Rooms | 313 (27.9%) | 684 (55.7%) |
| 6 or 7 Rooms | 470 (41.8%) | 283 (23.0%) |
| 8 or more Rooms | 312 (27.8%) | 23 (1.9%) |
| Total | 1,124 (100.0%) | 1,229 (100.0%) |
Housing Structure by Heating Type in Clinton
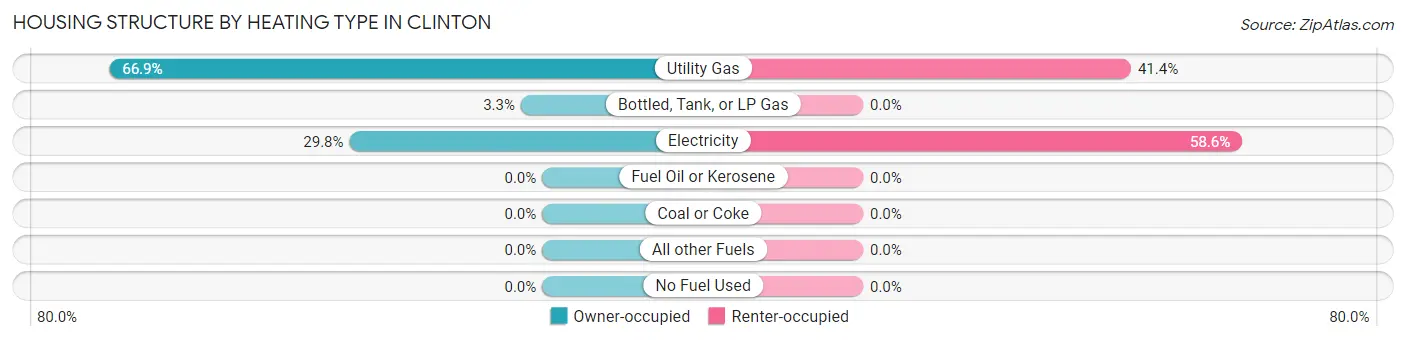
| Heating Type | Owner-occupied | Renter-occupied |
| Utility Gas | 752 (66.9%) | 509 (41.4%) |
| Bottled, Tank, or LP Gas | 37 (3.3%) | 0 (0.0%) |
| Electricity | 335 (29.8%) | 720 (58.6%) |
| Fuel Oil or Kerosene | 0 (0.0%) | 0 (0.0%) |
| Coal or Coke | 0 (0.0%) | 0 (0.0%) |
| All other Fuels | 0 (0.0%) | 0 (0.0%) |
| No Fuel Used | 0 (0.0%) | 0 (0.0%) |
| Total | 1,124 (100.0%) | 1,229 (100.0%) |
Household Vehicle Usage in Clinton
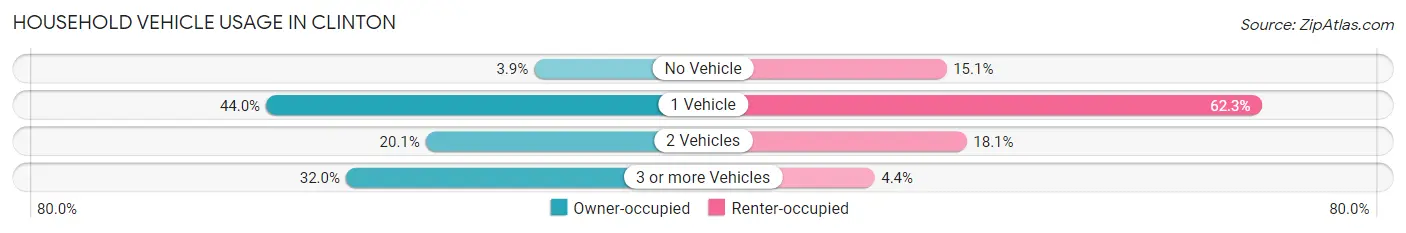
| Vehicles per Household | Owner-occupied | Renter-occupied |
| No Vehicle | 44 (3.9%) | 186 (15.1%) |
| 1 Vehicle | 494 (44.0%) | 766 (62.3%) |
| 2 Vehicles | 226 (20.1%) | 223 (18.1%) |
| 3 or more Vehicles | 360 (32.0%) | 54 (4.4%) |
| Total | 1,124 (100.0%) | 1,229 (100.0%) |
Real Estate & Mortgages in Clinton
Real Estate and Mortgage Overview in Clinton
| Characteristic | Without Mortgage | With Mortgage |
| Housing Units | 548 | 576 |
| Median Property Value | $112,300 | $160,200 |
| Median Household Income | $31,429 | $58 |
| Monthly Housing Costs | $566 | $8 |
| Real Estate Taxes | $502 | $0 |
Property Value by Mortgage Status in Clinton
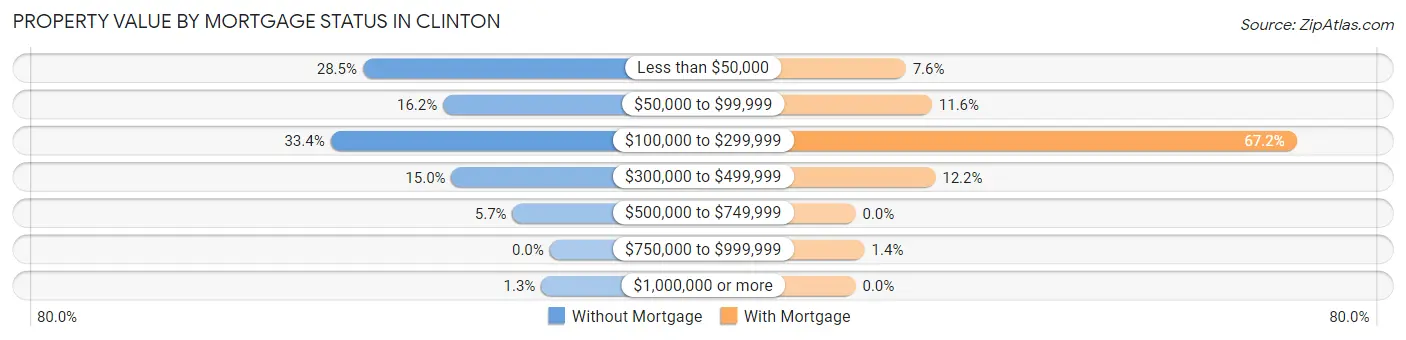
| Property Value | Without Mortgage | With Mortgage |
| Less than $50,000 | 156 (28.5%) | 44 (7.6%) |
| $50,000 to $99,999 | 89 (16.2%) | 67 (11.6%) |
| $100,000 to $299,999 | 183 (33.4%) | 387 (67.2%) |
| $300,000 to $499,999 | 82 (15.0%) | 70 (12.1%) |
| $500,000 to $749,999 | 31 (5.7%) | 0 (0.0%) |
| $750,000 to $999,999 | 0 (0.0%) | 8 (1.4%) |
| $1,000,000 or more | 7 (1.3%) | 0 (0.0%) |
| Total | 548 (100.0%) | 576 (100.0%) |
Household Income by Mortgage Status in Clinton
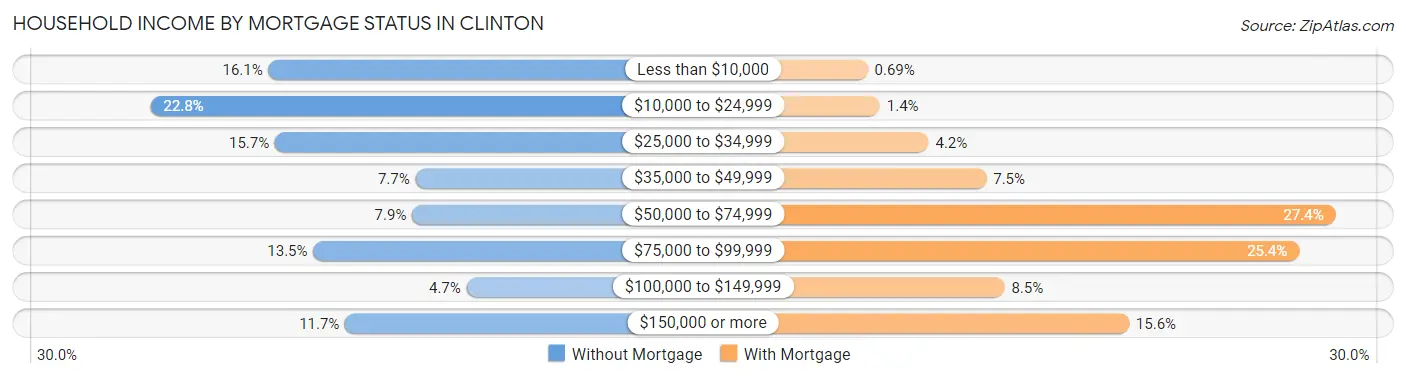
| Household Income | Without Mortgage | With Mortgage |
| Less than $10,000 | 88 (16.1%) | 4 (0.7%) |
| $10,000 to $24,999 | 125 (22.8%) | 8 (1.4%) |
| $25,000 to $34,999 | 86 (15.7%) | 24 (4.2%) |
| $35,000 to $49,999 | 42 (7.7%) | 43 (7.5%) |
| $50,000 to $74,999 | 43 (7.9%) | 158 (27.4%) |
| $75,000 to $99,999 | 74 (13.5%) | 146 (25.4%) |
| $100,000 to $149,999 | 26 (4.7%) | 49 (8.5%) |
| $150,000 or more | 64 (11.7%) | 90 (15.6%) |
| Total | 548 (100.0%) | 576 (100.0%) |
Property Value to Household Income Ratio in Clinton
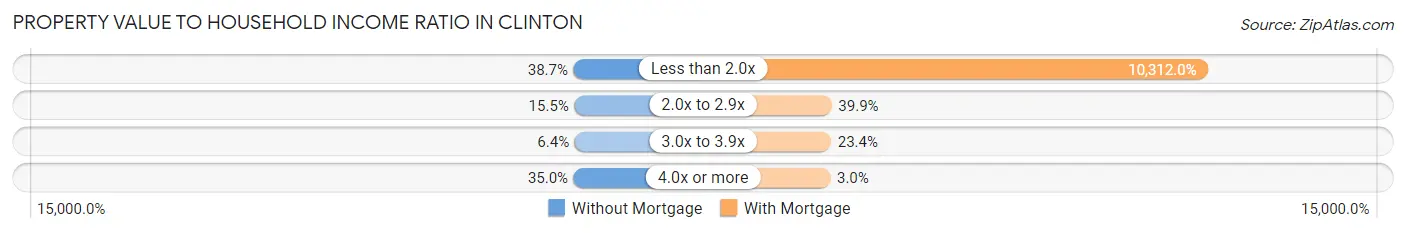
| Value-to-Income Ratio | Without Mortgage | With Mortgage |
| Less than 2.0x | 212 (38.7%) | 59,397 (10,312.0%) |
| 2.0x to 2.9x | 85 (15.5%) | 230 (39.9%) |
| 3.0x to 3.9x | 35 (6.4%) | 135 (23.4%) |
| 4.0x or more | 192 (35.0%) | 17 (2.9%) |
| Total | 548 (100.0%) | 576 (100.0%) |
Real Estate Taxes by Mortgage Status in Clinton
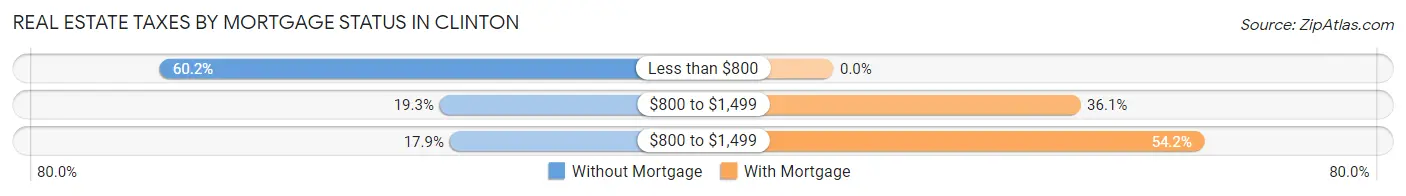
| Property Taxes | Without Mortgage | With Mortgage |
| Less than $800 | 330 (60.2%) | 0 (0.0%) |
| $800 to $1,499 | 106 (19.3%) | 208 (36.1%) |
| $800 to $1,499 | 98 (17.9%) | 312 (54.2%) |
| Total | 548 (100.0%) | 576 (100.0%) |
Health & Disability in Clinton
Health Insurance Coverage by Age in Clinton
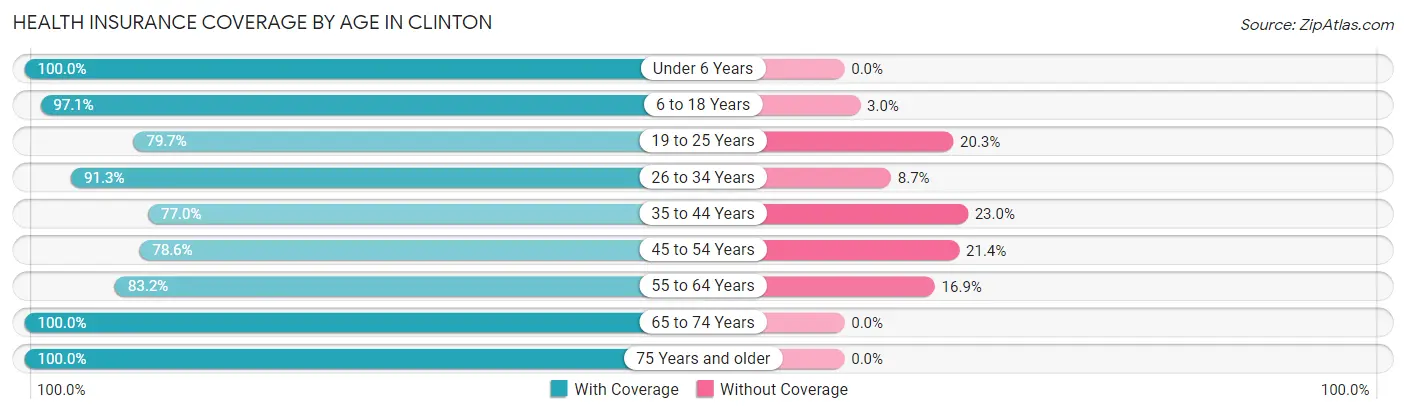
| Age Bracket | With Coverage | Without Coverage |
| Under 6 Years | 558 (100.0%) | 0 (0.0%) |
| 6 to 18 Years | 1,150 (97.1%) | 35 (2.9%) |
| 19 to 25 Years | 1,049 (79.7%) | 267 (20.3%) |
| 26 to 34 Years | 568 (91.3%) | 54 (8.7%) |
| 35 to 44 Years | 682 (77.0%) | 204 (23.0%) |
| 45 to 54 Years | 580 (78.6%) | 158 (21.4%) |
| 55 to 64 Years | 602 (83.2%) | 122 (16.9%) |
| 65 to 74 Years | 576 (100.0%) | 0 (0.0%) |
| 75 Years and older | 402 (100.0%) | 0 (0.0%) |
| Total | 6,167 (88.0%) | 840 (12.0%) |
Health Insurance Coverage by Citizenship Status in Clinton
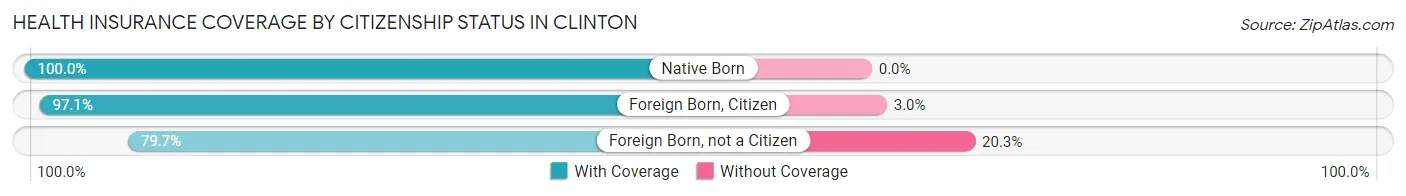
| Citizenship Status | With Coverage | Without Coverage |
| Native Born | 558 (100.0%) | 0 (0.0%) |
| Foreign Born, Citizen | 1,150 (97.1%) | 35 (2.9%) |
| Foreign Born, not a Citizen | 1,049 (79.7%) | 267 (20.3%) |
Health Insurance Coverage by Household Income in Clinton
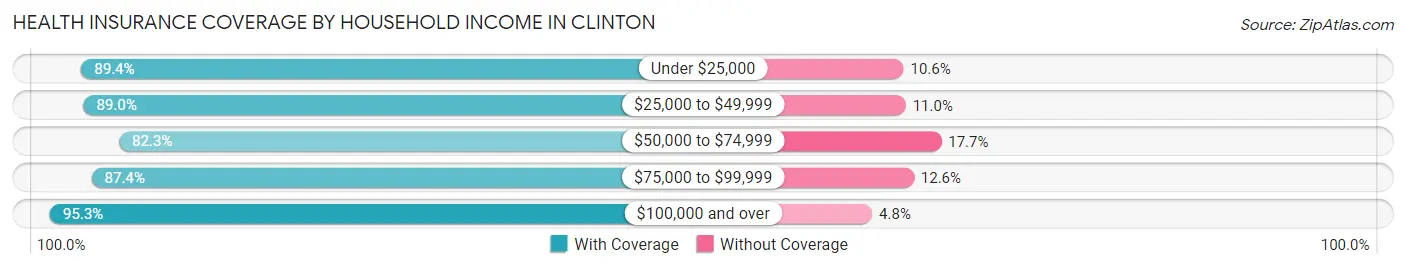
| Household Income | With Coverage | Without Coverage |
| Under $25,000 | 1,226 (89.4%) | 146 (10.6%) |
| $25,000 to $49,999 | 1,144 (89.0%) | 142 (11.0%) |
| $50,000 to $74,999 | 1,167 (82.3%) | 251 (17.7%) |
| $75,000 to $99,999 | 689 (87.4%) | 99 (12.6%) |
| $100,000 and over | 943 (95.3%) | 47 (4.8%) |
Public vs Private Health Insurance Coverage by Age in Clinton
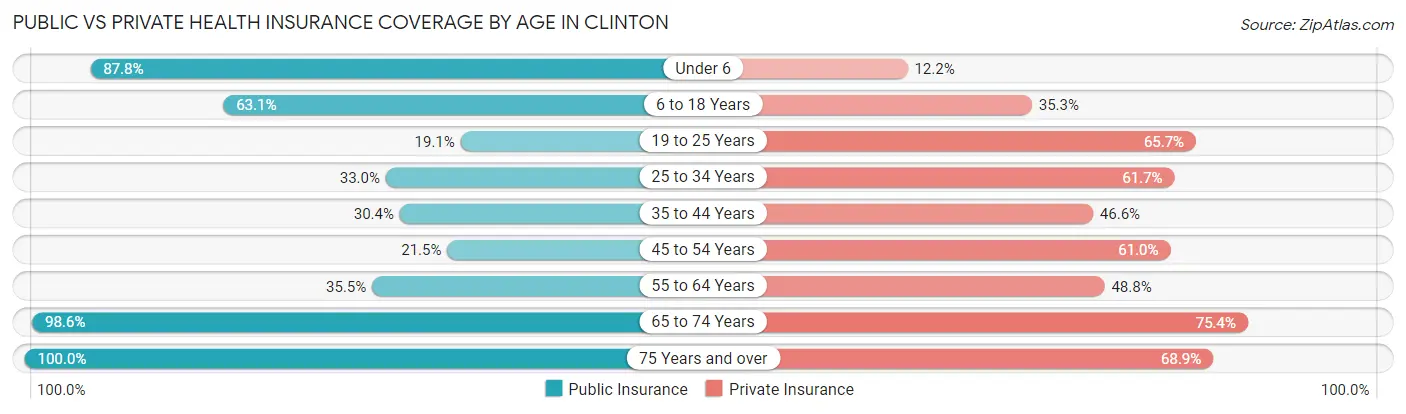
| Age Bracket | Public Insurance | Private Insurance |
| Under 6 | 490 (87.8%) | 68 (12.2%) |
| 6 to 18 Years | 748 (63.1%) | 418 (35.3%) |
| 19 to 25 Years | 251 (19.1%) | 865 (65.7%) |
| 25 to 34 Years | 205 (33.0%) | 384 (61.7%) |
| 35 to 44 Years | 269 (30.4%) | 413 (46.6%) |
| 45 to 54 Years | 159 (21.5%) | 450 (61.0%) |
| 55 to 64 Years | 257 (35.5%) | 353 (48.8%) |
| 65 to 74 Years | 568 (98.6%) | 434 (75.3%) |
| 75 Years and over | 402 (100.0%) | 277 (68.9%) |
| Total | 3,349 (47.8%) | 3,662 (52.3%) |
Disability Status by Sex by Age in Clinton
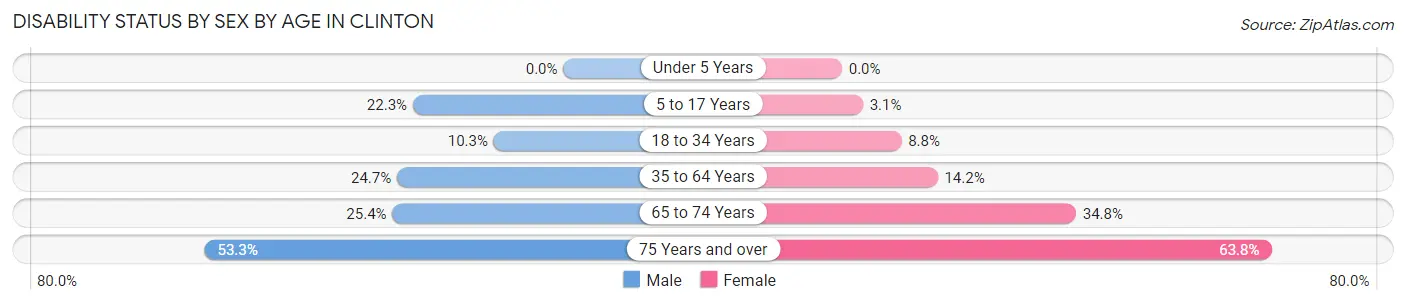
| Age Bracket | Male | Female |
| Under 5 Years | 0 (0.0%) | 0 (0.0%) |
| 5 to 17 Years | 88 (22.3%) | 23 (3.1%) |
| 18 to 34 Years | 105 (10.3%) | 97 (8.8%) |
| 35 to 64 Years | 314 (24.7%) | 153 (14.2%) |
| 65 to 74 Years | 33 (25.4%) | 155 (34.7%) |
| 75 Years and over | 73 (53.3%) | 169 (63.8%) |
Disability Class by Sex by Age in Clinton
Disability Class: Hearing Difficulty
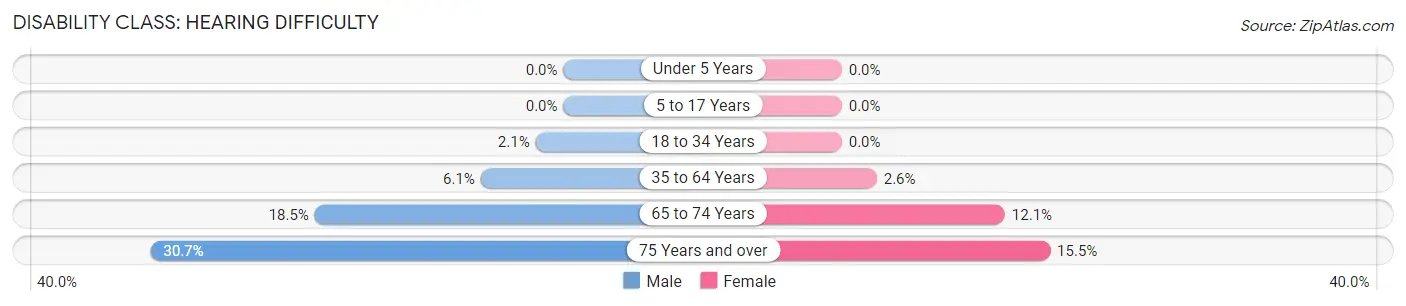
| Age Bracket | Male | Female |
| Under 5 Years | 0 (0.0%) | 0 (0.0%) |
| 5 to 17 Years | 0 (0.0%) | 0 (0.0%) |
| 18 to 34 Years | 21 (2.1%) | 0 (0.0%) |
| 35 to 64 Years | 78 (6.1%) | 28 (2.6%) |
| 65 to 74 Years | 24 (18.5%) | 54 (12.1%) |
| 75 Years and over | 42 (30.7%) | 41 (15.5%) |
Disability Class: Vision Difficulty
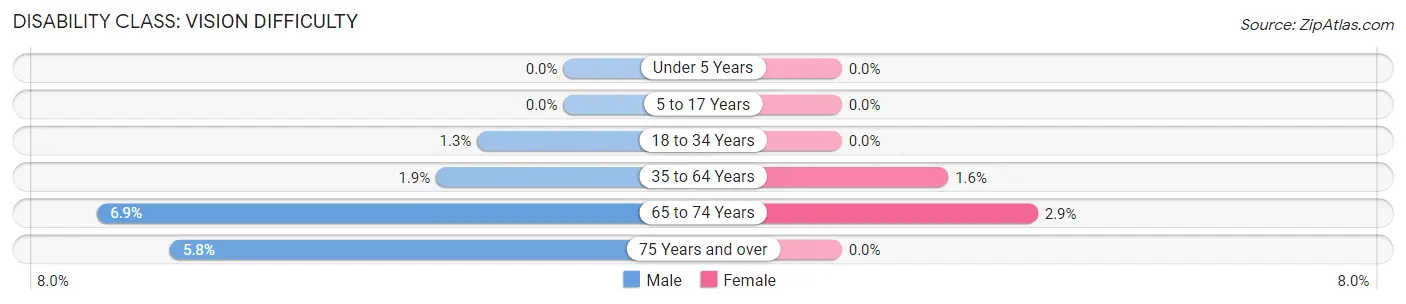
| Age Bracket | Male | Female |
| Under 5 Years | 0 (0.0%) | 0 (0.0%) |
| 5 to 17 Years | 0 (0.0%) | 0 (0.0%) |
| 18 to 34 Years | 13 (1.3%) | 0 (0.0%) |
| 35 to 64 Years | 24 (1.9%) | 17 (1.6%) |
| 65 to 74 Years | 9 (6.9%) | 13 (2.9%) |
| 75 Years and over | 8 (5.8%) | 0 (0.0%) |
Disability Class: Cognitive Difficulty
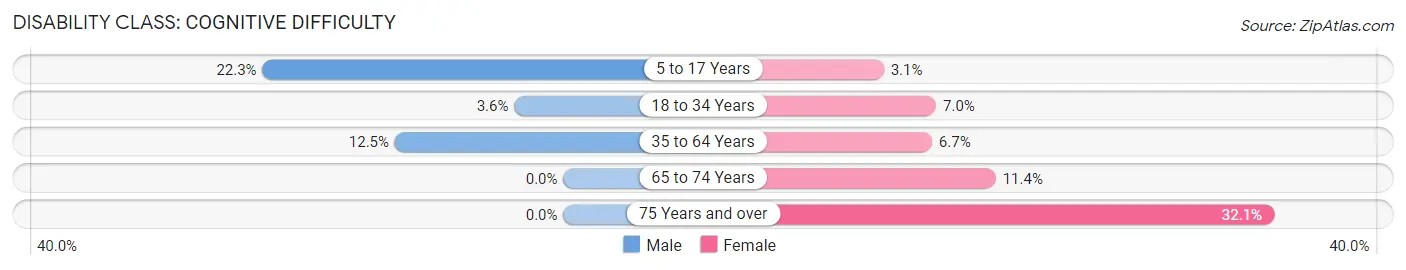
| Age Bracket | Male | Female |
| 5 to 17 Years | 88 (22.3%) | 23 (3.1%) |
| 18 to 34 Years | 37 (3.6%) | 77 (7.0%) |
| 35 to 64 Years | 159 (12.5%) | 72 (6.7%) |
| 65 to 74 Years | 0 (0.0%) | 51 (11.4%) |
| 75 Years and over | 0 (0.0%) | 85 (32.1%) |
Disability Class: Ambulatory Difficulty
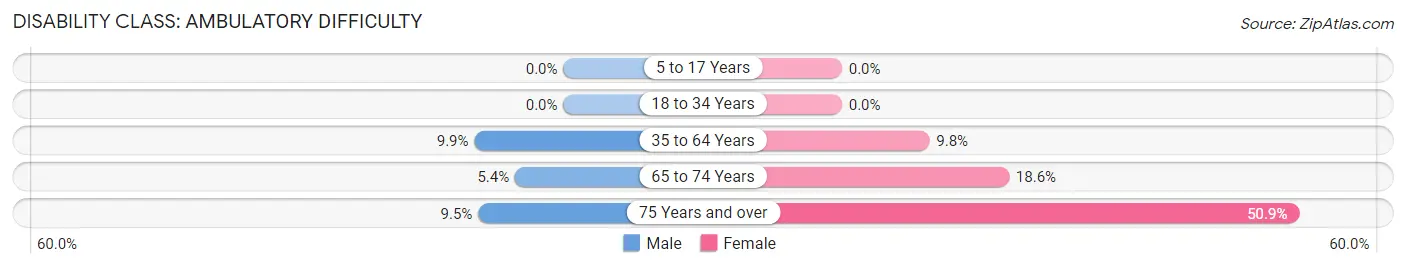
| Age Bracket | Male | Female |
| 5 to 17 Years | 0 (0.0%) | 0 (0.0%) |
| 18 to 34 Years | 0 (0.0%) | 0 (0.0%) |
| 35 to 64 Years | 126 (9.9%) | 105 (9.8%) |
| 65 to 74 Years | 7 (5.4%) | 83 (18.6%) |
| 75 Years and over | 13 (9.5%) | 135 (50.9%) |
Disability Class: Self-Care Difficulty
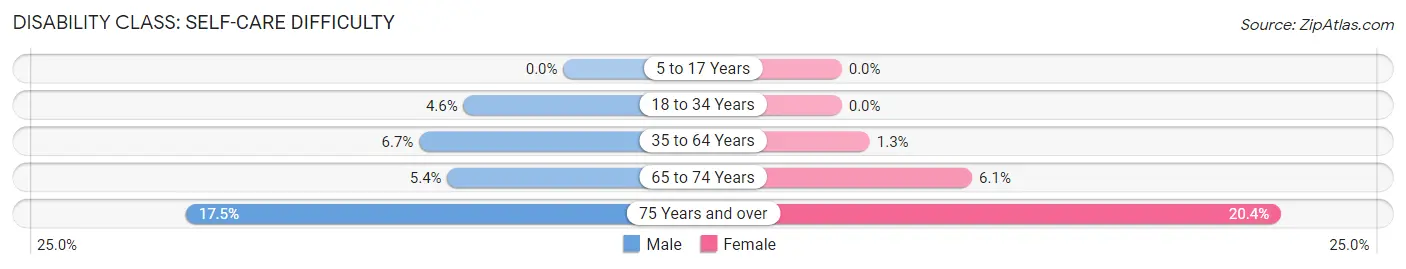
| Age Bracket | Male | Female |
| 5 to 17 Years | 0 (0.0%) | 0 (0.0%) |
| 18 to 34 Years | 47 (4.6%) | 0 (0.0%) |
| 35 to 64 Years | 85 (6.7%) | 14 (1.3%) |
| 65 to 74 Years | 7 (5.4%) | 27 (6.0%) |
| 75 Years and over | 24 (17.5%) | 54 (20.4%) |
Technology Access in Clinton
Computing Device Access in Clinton
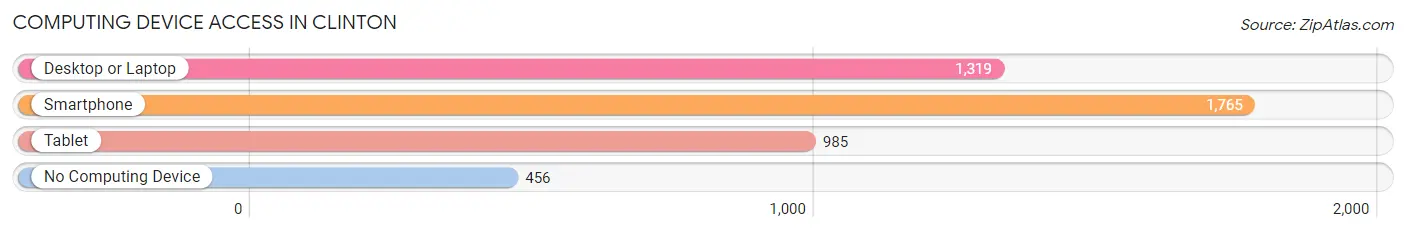
| Device Type | # Households | % Households |
| Desktop or Laptop | 1,319 | 56.1% |
| Smartphone | 1,765 | 75.0% |
| Tablet | 985 | 41.9% |
| No Computing Device | 456 | 19.4% |
| Total | 2,353 | 100.0% |
Internet Access in Clinton
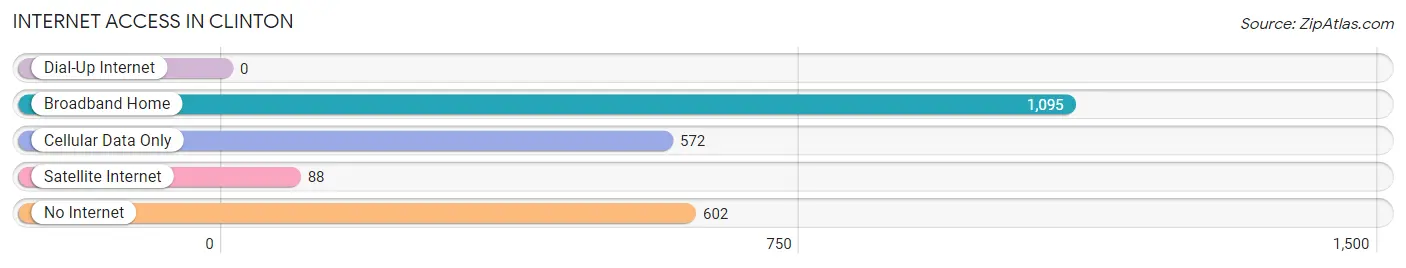
| Internet Type | # Households | % Households |
| Dial-Up Internet | 0 | 0.0% |
| Broadband Home | 1,095 | 46.5% |
| Cellular Data Only | 572 | 24.3% |
| Satellite Internet | 88 | 3.7% |
| No Internet | 602 | 25.6% |
| Total | 2,353 | 100.0% |
Clinton Summary
Clinton, South Carolina is a small city located in Laurens County in the Upstate region of the state. It is situated along the banks of the Saluda River and is part of the Greenville-Spartanburg-Anderson Combined Statistical Area. The city has a population of 8,490 as of the 2020 census, making it the largest city in Laurens County.
History
The area that is now Clinton was first settled in the late 1700s by Scotch-Irish immigrants. The town was originally known as Mountville, but was renamed in 1852 in honor of Henry Clinton Young, a local politician and Confederate veteran. The town was officially incorporated in 1852 and was the county seat of Laurens County until 1895, when the county seat was moved to Laurens.
Clinton was an important center of commerce in the late 19th and early 20th centuries, with several cotton mills and other industries located in the city. The city was also home to several prominent educational institutions, including Thornwell Orphanage, Presbyterian College, and Clinton Junior College.
Geography
Clinton is located in the Upstate region of South Carolina, approximately 40 miles south of Greenville and 40 miles northwest of Columbia. The city is situated along the banks of the Saluda River and is part of the Greenville-Spartanburg-Anderson Combined Statistical Area. The city has a total area of 8.3 square miles, all of which is land.
Economy
Clinton’s economy is largely based on manufacturing and agriculture. The city is home to several manufacturing plants, including a plant owned by the textile company Milliken & Company. The city is also home to several agricultural operations, including poultry farms, dairy farms, and vegetable farms.
Demographics
As of the 2020 census, Clinton had a population of 8,490. The racial makeup of the city was 73.2% White, 22.2% African American, 0.7% Native American, 0.7% Asian, 0.1% Pacific Islander, 1.7% from other races, and 1.4% from two or more races. Hispanic or Latino of any race were 3.2% of the population.
The median household income in Clinton was $37,945 in 2019, and the median home value was $117,400. The city’s poverty rate was 22.2% in 2019. The city’s unemployment rate was 4.2% in 2019.
Common Questions
What is Per Capita Income in Clinton?
Per Capita income in Clinton is $18,729.
What is the Median Family Income in Clinton?
Median Family Income in Clinton is $59,848.
What is the Median Household income in Clinton?
Median Household Income in Clinton is $38,350.
What is Income or Wage Gap in Clinton?
Income or Wage Gap in Clinton is 13.7%.
Women in Clinton earn 86.3 cents for every dollar earned by a man.
What is Inequality or Gini Index in Clinton?
Inequality or Gini Index in Clinton is 0.50.
What is the Total Population of Clinton?
Total Population of Clinton is 7,624.
What is the Total Male Population of Clinton?
Total Male Population of Clinton is 3,572.
What is the Total Female Population of Clinton?
Total Female Population of Clinton is 4,052.
What is the Ratio of Males per 100 Females in Clinton?
There are 88.15 Males per 100 Females in Clinton.
What is the Ratio of Females per 100 Males in Clinton?
There are 113.44 Females per 100 Males in Clinton.
What is the Median Population Age in Clinton?
Median Population Age in Clinton is 35.4 Years.
What is the Average Family Size in Clinton
Average Family Size in Clinton is 3.9 People.
What is the Average Household Size in Clinton
Average Household Size in Clinton is 2.5 People.
How Large is the Labor Force in Clinton?
There are 3,211 People in the Labor Forcein in Clinton.
What is the Percentage of People in the Labor Force in Clinton?
53.2% of People are in the Labor Force in Clinton.
What is the Unemployment Rate in Clinton?
Unemployment Rate in Clinton is 7.8%.