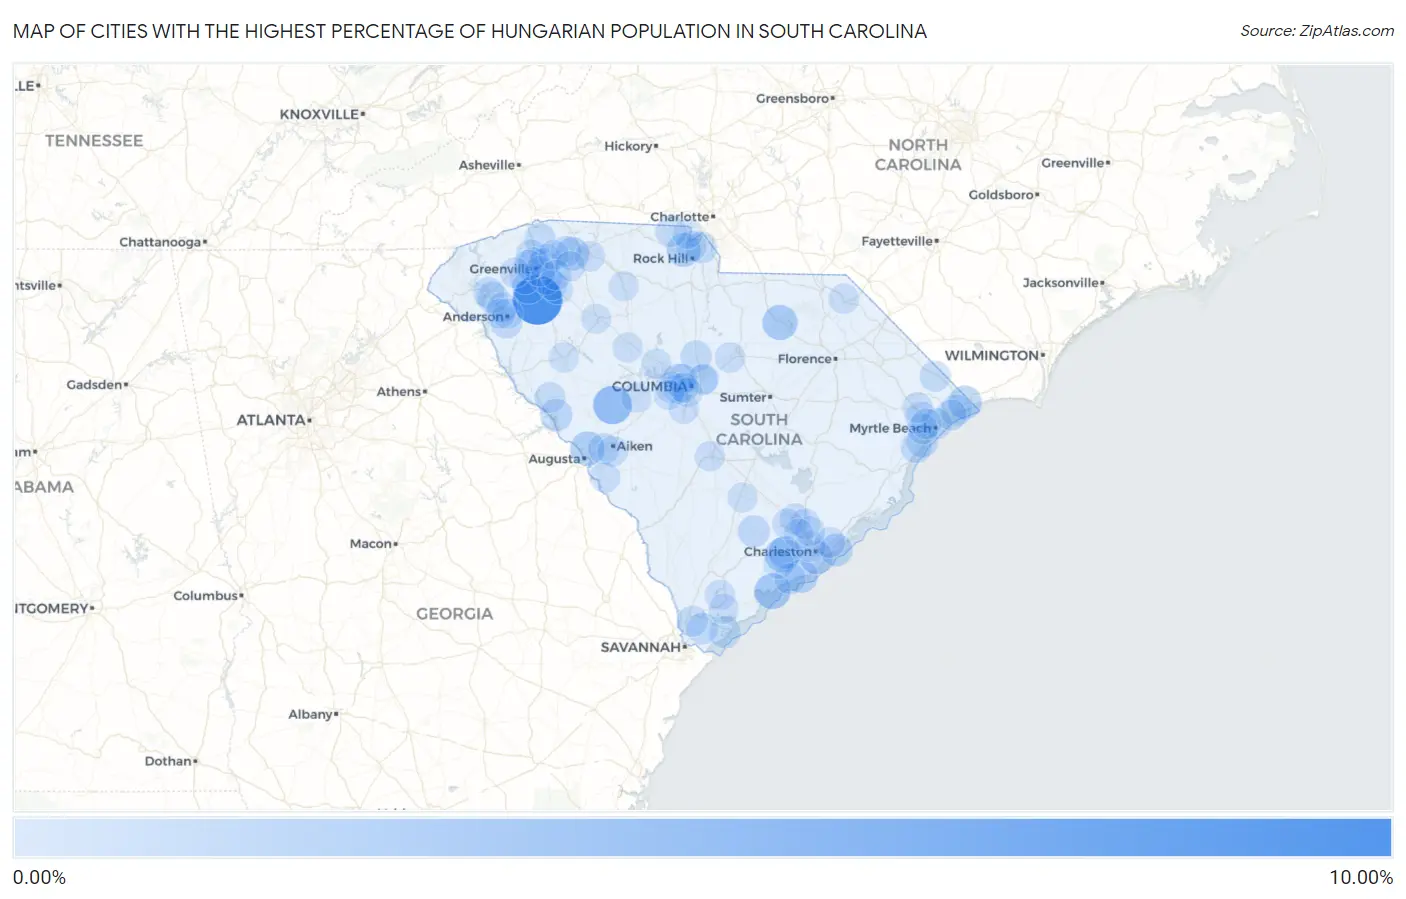
Cities with the Highest Percentage of Hungarian Population in South Carolina
RELATED REPORTS & OPTIONS
Hungarian
South Carolina
Compare Cities
Map of Cities with the Highest Percentage of Hungarian Population in South Carolina
0.00%
10.00%
Cities with the Highest Percentage of Hungarian Population in South Carolina
| City | Hungarian | vs State | vs National | |
| 1. | Ware Place | 8.33% | 0.22%(+8.11)#1 | 0.39%(+7.94)#114 |
| 2. | Ward | 3.57% | 0.22%(+3.35)#2 | 0.39%(+3.18)#504 |
| 3. | Debordieu Colony | 3.16% | 0.22%(+2.94)#3 | 0.39%(+2.77)#614 |
| 4. | Edisto Beach | 2.38% | 0.22%(+2.15)#4 | 0.39%(+1.98)#960 |
| 5. | Mcbee | 2.10% | 0.22%(+1.88)#5 | 0.39%(+1.71)#1,136 |
| 6. | Hollywood | 2.06% | 0.22%(+1.83)#6 | 0.39%(+1.67)#1,167 |
| 7. | Belvedere | 1.90% | 0.22%(+1.68)#7 | 0.39%(+1.51)#1,311 |
| 8. | Newport | 1.61% | 0.22%(+1.38)#8 | 0.39%(+1.22)#1,623 |
| 9. | Little River | 1.49% | 0.22%(+1.26)#9 | 0.39%(+1.10)#1,770 |
| 10. | Wellford | 1.44% | 0.22%(+1.22)#10 | 0.39%(+1.05)#1,844 |
| 11. | Daufuskie Island | 1.41% | 0.22%(+1.18)#11 | 0.39%(+1.02)#1,889 |
| 12. | Kiawah Island | 1.36% | 0.22%(+1.14)#12 | 0.39%(+0.971)#1,968 |
| 13. | James Island | 1.36% | 0.22%(+1.14)#13 | 0.39%(+0.969)#1,974 |
| 14. | Keowee Key | 1.34% | 0.22%(+1.12)#14 | 0.39%(+0.949)#1,997 |
| 15. | Ravenel | 1.21% | 0.22%(+0.981)#15 | 0.39%(+0.814)#2,253 |
| 16. | Isle Of Palms | 1.13% | 0.22%(+0.903)#16 | 0.39%(+0.736)#2,448 |
| 17. | Piedmont | 1.07% | 0.22%(+0.847)#17 | 0.39%(+0.680)#2,589 |
| 18. | Seven Oaks | 1.02% | 0.22%(+0.799)#18 | 0.39%(+0.633)#2,711 |
| 19. | Parksville | 0.96% | 0.22%(+0.737)#19 | 0.39%(+0.571)#2,894 |
| 20. | Garden City | 0.83% | 0.22%(+0.603)#20 | 0.39%(+0.436)#3,324 |
| 21. | Cottageville | 0.79% | 0.22%(+0.563)#21 | 0.39%(+0.396)#3,504 |
| 22. | Homeland Park | 0.76% | 0.22%(+0.541)#22 | 0.39%(+0.374)#3,591 |
| 23. | Hilton Head Island | 0.70% | 0.22%(+0.476)#23 | 0.39%(+0.309)#3,845 |
| 24. | Clover | 0.62% | 0.22%(+0.394)#24 | 0.39%(+0.227)#4,223 |
| 25. | Bluffton | 0.62% | 0.22%(+0.392)#25 | 0.39%(+0.225)#4,232 |
| 26. | Blythewood | 0.61% | 0.22%(+0.389)#26 | 0.39%(+0.223)#4,240 |
| 27. | Mauldin | 0.61% | 0.22%(+0.381)#27 | 0.39%(+0.215)#4,303 |
| 28. | Pendleton | 0.60% | 0.22%(+0.376)#28 | 0.39%(+0.209)#4,330 |
| 29. | Fort Mill | 0.60% | 0.22%(+0.375)#29 | 0.39%(+0.209)#4,333 |
| 30. | North Myrtle Beach | 0.60% | 0.22%(+0.375)#30 | 0.39%(+0.209)#4,334 |
| 31. | Red Hill | 0.59% | 0.22%(+0.366)#31 | 0.39%(+0.199)#4,383 |
| 32. | Taylors | 0.53% | 0.22%(+0.311)#32 | 0.39%(+0.144)#4,735 |
| 33. | Tigerville | 0.52% | 0.22%(+0.294)#33 | 0.39%(+0.128)#4,847 |
| 34. | Lexington | 0.52% | 0.22%(+0.291)#34 | 0.39%(+0.125)#4,864 |
| 35. | Myrtle Beach | 0.51% | 0.22%(+0.289)#35 | 0.39%(+0.122)#4,883 |
| 36. | Warrenville | 0.51% | 0.22%(+0.285)#36 | 0.39%(+0.118)#4,919 |
| 37. | Litchfield Beach | 0.51% | 0.22%(+0.281)#37 | 0.39%(+0.114)#4,938 |
| 38. | Carolina Forest | 0.50% | 0.22%(+0.279)#38 | 0.39%(+0.113)#4,942 |
| 39. | Murrells Inlet | 0.50% | 0.22%(+0.271)#39 | 0.39%(+0.104)#5,016 |
| 40. | Travelers Rest | 0.49% | 0.22%(+0.268)#40 | 0.39%(+0.101)#5,042 |
| 41. | Seabrook Island | 0.48% | 0.22%(+0.261)#41 | 0.39%(+0.094)#5,094 |
| 42. | Clemson | 0.47% | 0.22%(+0.243)#42 | 0.39%(+0.076)#5,235 |
| 43. | Hardeeville | 0.46% | 0.22%(+0.236)#43 | 0.39%(+0.069)#5,281 |
| 44. | Loris | 0.44% | 0.22%(+0.214)#44 | 0.39%(+0.047)#5,467 |
| 45. | Fountain Inn | 0.42% | 0.22%(+0.197)#45 | 0.39%(+0.031)#5,598 |
| 46. | India Hook | 0.41% | 0.22%(+0.186)#46 | 0.39%(+0.020)#5,697 |
| 47. | White Knoll | 0.40% | 0.22%(+0.179)#47 | 0.39%(+0.013)#5,755 |
| 48. | Mccormick | 0.40% | 0.22%(+0.174)#48 | 0.39%(+0.008)#5,800 |
| 49. | Charleston | 0.40% | 0.22%(+0.174)#49 | 0.39%(+0.007)#5,804 |
| 50. | Powdersville | 0.39% | 0.22%(+0.169)#50 | 0.39%(+0.002)#5,843 |
| 51. | Socastee | 0.38% | 0.22%(+0.152)#51 | 0.39%(-0.015)#6,019 |
| 52. | Aiken | 0.37% | 0.22%(+0.144)#52 | 0.39%(-0.022)#6,069 |
| 53. | Briarcliffe Acres | 0.35% | 0.22%(+0.128)#53 | 0.39%(-0.039)#6,218 |
| 54. | Wade Hampton | 0.34% | 0.22%(+0.118)#54 | 0.39%(-0.048)#6,310 |
| 55. | Sangaree | 0.32% | 0.22%(+0.098)#55 | 0.39%(-0.068)#6,503 |
| 56. | Lyman | 0.31% | 0.22%(+0.087)#56 | 0.39%(-0.079)#6,594 |
| 57. | Mount Pleasant | 0.29% | 0.22%(+0.064)#57 | 0.39%(-0.103)#6,876 |
| 58. | Sans Souci | 0.27% | 0.22%(+0.049)#58 | 0.39%(-0.117)#7,050 |
| 59. | Northlake | 0.25% | 0.22%(+0.027)#59 | 0.39%(-0.140)#7,305 |
| 60. | Goose Creek | 0.24% | 0.22%(+0.020)#60 | 0.39%(-0.147)#7,378 |
| 61. | Conway | 0.24% | 0.22%(+0.019)#61 | 0.39%(-0.148)#7,401 |
| 62. | Forestbrook | 0.23% | 0.22%(+0.005)#62 | 0.39%(-0.162)#7,612 |
| 63. | Lugoff | 0.22% | 0.22%(-0.001)#63 | 0.39%(-0.168)#7,704 |
| 64. | Summerville | 0.22% | 0.22%(-0.004)#64 | 0.39%(-0.171)#7,734 |
| 65. | Anderson | 0.22% | 0.22%(-0.006)#65 | 0.39%(-0.173)#7,774 |
| 66. | Greenville | 0.21% | 0.22%(-0.012)#66 | 0.39%(-0.179)#7,878 |
| 67. | Columbia | 0.21% | 0.22%(-0.015)#67 | 0.39%(-0.182)#7,913 |
| 68. | Gaston | 0.20% | 0.22%(-0.023)#68 | 0.39%(-0.190)#8,008 |
| 69. | Chapin | 0.19% | 0.22%(-0.030)#69 | 0.39%(-0.196)#8,121 |
| 70. | Whitney | 0.19% | 0.22%(-0.037)#70 | 0.39%(-0.203)#8,217 |
| 71. | Laurel Bay | 0.18% | 0.22%(-0.043)#71 | 0.39%(-0.209)#8,301 |
| 72. | Woodfield | 0.18% | 0.22%(-0.045)#72 | 0.39%(-0.211)#8,322 |
| 73. | Berea | 0.17% | 0.22%(-0.051)#73 | 0.39%(-0.218)#8,410 |
| 74. | Bennettsville | 0.17% | 0.22%(-0.052)#74 | 0.39%(-0.219)#8,427 |
| 75. | Orangeburg | 0.17% | 0.22%(-0.058)#75 | 0.39%(-0.224)#8,508 |
| 76. | Spartanburg | 0.16% | 0.22%(-0.062)#76 | 0.39%(-0.229)#8,579 |
| 77. | Batesburg Leesville | 0.16% | 0.22%(-0.064)#77 | 0.39%(-0.231)#8,608 |
| 78. | Jackson | 0.16% | 0.22%(-0.065)#78 | 0.39%(-0.231)#8,615 |
| 79. | Easley | 0.16% | 0.22%(-0.069)#79 | 0.39%(-0.235)#8,679 |
| 80. | Meggett | 0.15% | 0.22%(-0.076)#80 | 0.39%(-0.242)#8,789 |
| 81. | Greer | 0.14% | 0.22%(-0.084)#81 | 0.39%(-0.250)#8,879 |
| 82. | Union | 0.14% | 0.22%(-0.088)#82 | 0.39%(-0.255)#8,943 |
| 83. | Oak Grove | 0.13% | 0.22%(-0.092)#83 | 0.39%(-0.259)#8,990 |
| 84. | Newberry | 0.13% | 0.22%(-0.093)#84 | 0.39%(-0.260)#9,002 |
| 85. | Fripp Island | 0.13% | 0.22%(-0.094)#85 | 0.39%(-0.260)#9,009 |
| 86. | Simpsonville | 0.13% | 0.22%(-0.096)#86 | 0.39%(-0.262)#9,032 |
| 87. | Lake Wylie | 0.13% | 0.22%(-0.099)#87 | 0.39%(-0.266)#9,078 |
| 88. | Five Forks | 0.12% | 0.22%(-0.100)#88 | 0.39%(-0.267)#9,093 |
| 89. | Hanahan | 0.12% | 0.22%(-0.104)#89 | 0.39%(-0.270)#9,132 |
| 90. | Reidville | 0.12% | 0.22%(-0.109)#90 | 0.39%(-0.276)#9,195 |
| 91. | Greenwood | 0.11% | 0.22%(-0.113)#91 | 0.39%(-0.280)#9,253 |
| 92. | Centerville | 0.11% | 0.22%(-0.113)#92 | 0.39%(-0.280)#9,256 |
| 93. | St George | 0.11% | 0.22%(-0.119)#93 | 0.39%(-0.286)#9,314 |
| 94. | Clinton | 0.10% | 0.22%(-0.119)#94 | 0.39%(-0.286)#9,316 |
| 95. | St Andrews | 0.10% | 0.22%(-0.124)#95 | 0.39%(-0.290)#9,369 |
| 96. | Red Bank | 0.095% | 0.22%(-0.129)#96 | 0.39%(-0.296)#9,442 |
| 97. | North Charleston | 0.091% | 0.22%(-0.133)#97 | 0.39%(-0.300)#9,497 |
| 98. | Port Royal | 0.089% | 0.22%(-0.135)#98 | 0.39%(-0.302)#9,512 |
| 99. | Cayce | 0.087% | 0.22%(-0.137)#99 | 0.39%(-0.304)#9,535 |
| 100. | West Columbia | 0.086% | 0.22%(-0.138)#100 | 0.39%(-0.305)#9,543 |
Common Questions
What are the Top 10 Cities with the Highest Percentage of Hungarian Population in South Carolina?
Top 10 Cities with the Highest Percentage of Hungarian Population in South Carolina are:
#1
8.33%
#2
3.57%
#3
2.38%
#4
2.10%
#5
2.06%
#6
1.90%
#7
1.61%
#8
1.49%
#9
1.44%
#10
1.36%
What city has the Highest Percentage of Hungarian Population in South Carolina?
Ware Place has the Highest Percentage of Hungarian Population in South Carolina with 8.33%.
What is the Percentage of Hungarian Population in the State of South Carolina?
Percentage of Hungarian Population in South Carolina is 0.22%.
What is the Percentage of Hungarian Population in the United States?
Percentage of Hungarian Population in the United States is 0.39%.