Cities with the Lowest Costs of Housing as Percentage of Income in South Carolina
RELATED REPORTS & OPTIONS
Lowest Housing Costs / Income
South Carolina
Compare Cities
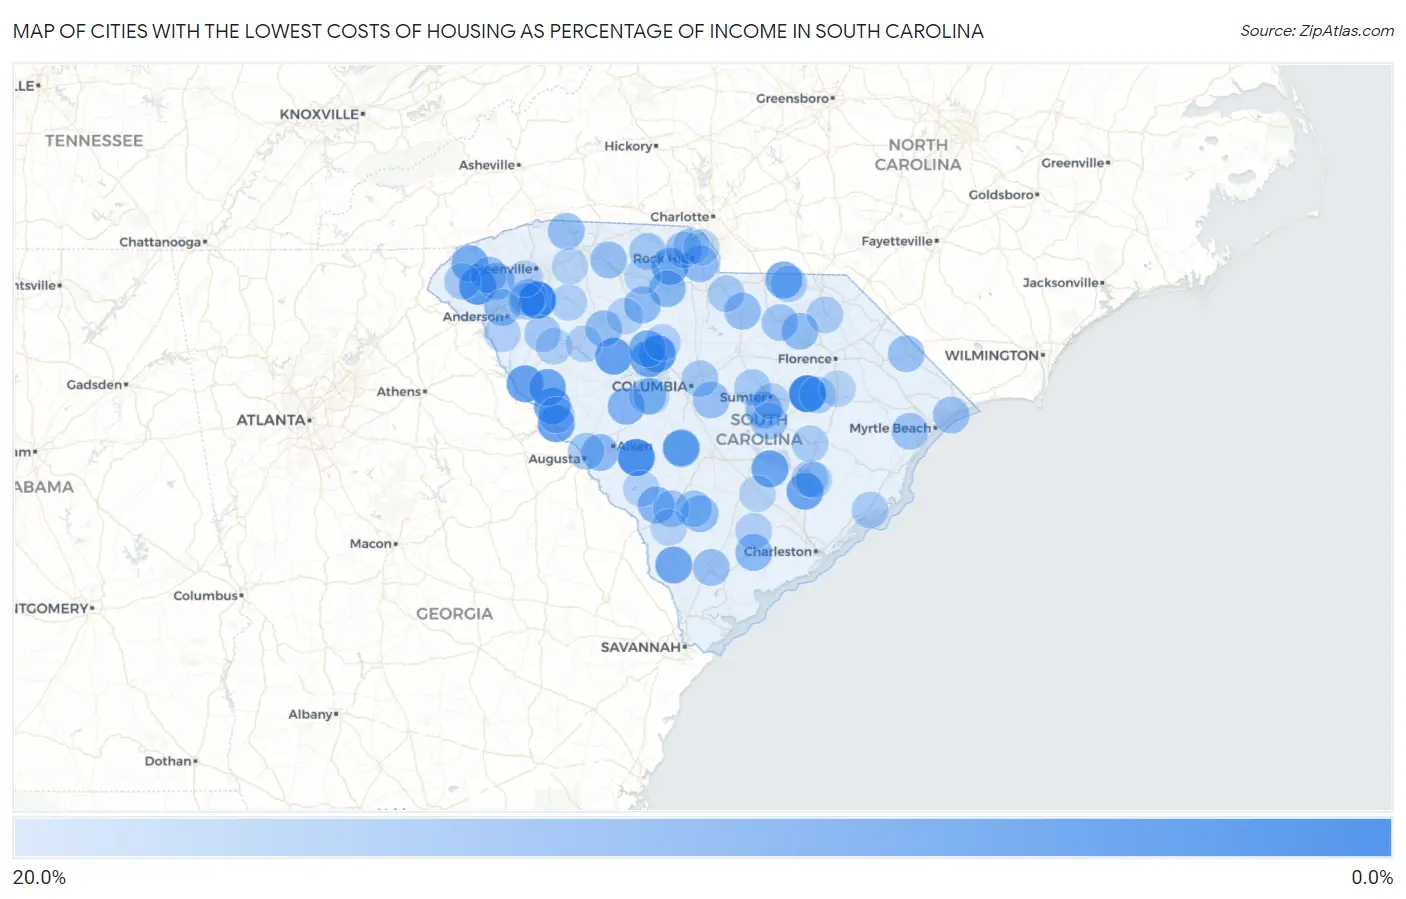
Map of Cities with the Lowest Costs of Housing as Percentage of Income in South Carolina
20.0%
0.0%
Cities with the Lowest Costs of Housing as Percentage of Income in South Carolina
| City | Housing Costs / Income | vs State | vs National | |
| 1. | Danwood | 4.5% | 18.8%(-14.2)#1 | 20.4%(-15.8)#49 |
| 2. | Ware Place | 4.6% | 18.8%(-14.2)#2 | 20.4%(-15.8)#53 |
| 3. | Shiloh | 4.9% | 18.8%(-13.8)#3 | 20.4%(-15.4)#73 |
| 4. | Windsor | 6.1% | 18.8%(-12.7)#4 | 20.4%(-14.3)#172 |
| 5. | Newry | 8.0% | 18.8%(-10.8)#5 | 20.4%(-12.4)#566 |
| 6. | Peak | 8.0% | 18.8%(-10.7)#6 | 20.4%(-12.3)#587 |
| 7. | Sandy Springs | 8.1% | 18.8%(-10.7)#7 | 20.4%(-12.3)#599 |
| 8. | Silverstreet | 8.5% | 18.8%(-10.3)#8 | 20.4%(-11.9)#715 |
| 9. | Modoc | 8.8% | 18.8%(-10.0)#9 | 20.4%(-11.6)#809 |
| 10. | Pauline | 8.8% | 18.8%(-10.0)#10 | 20.4%(-11.6)#815 |
| 11. | Plum Branch | 8.8% | 18.8%(-9.96)#11 | 20.4%(-11.6)#826 |
| 12. | Mount Carmel | 8.8% | 18.8%(-9.95)#12 | 20.4%(-11.5)#828 |
| 13. | Eutawville | 9.2% | 18.8%(-9.62)#13 | 20.4%(-11.2)#961 |
| 14. | Pinopolis | 9.3% | 18.8%(-9.53)#14 | 20.4%(-11.1)#1,000 |
| 15. | Troy | 9.3% | 18.8%(-9.51)#15 | 20.4%(-11.1)#1,008 |
| 16. | Mcconnells | 9.3% | 18.8%(-9.44)#16 | 20.4%(-11.0)#1,046 |
| 17. | Furman | 9.6% | 18.8%(-9.21)#17 | 20.4%(-10.8)#1,172 |
| 18. | Fairview Crossroads | 9.8% | 18.8%(-8.99)#18 | 20.4%(-10.6)#1,290 |
| 19. | Dacusville | 9.8% | 18.8%(-8.99)#19 | 20.4%(-10.6)#1,294 |
| 20. | Little Mountain | 9.9% | 18.8%(-8.87)#20 | 20.4%(-10.5)#1,361 |
| 21. | Keowee Key | 9.9% | 18.8%(-8.86)#21 | 20.4%(-10.4)#1,369 |
| 22. | Mount Croghan | 10.3% | 18.8%(-8.48)#22 | 20.4%(-10.1)#1,583 |
| 23. | Pomaria | 10.5% | 18.8%(-8.29)#23 | 20.4%(-9.88)#1,724 |
| 24. | Salem | 10.5% | 18.8%(-8.25)#24 | 20.4%(-9.84)#1,754 |
| 25. | Neeses | 10.6% | 18.8%(-8.16)#25 | 20.4%(-9.75)#1,819 |
| 26. | Monetta | 11.3% | 18.8%(-7.47)#26 | 20.4%(-9.06)#2,343 |
| 27. | Kline | 11.7% | 18.8%(-7.11)#27 | 20.4%(-8.70)#2,685 |
| 28. | Gayle Mill | 11.8% | 18.8%(-6.97)#28 | 20.4%(-8.56)#2,845 |
| 29. | Jacksonboro | 11.9% | 18.8%(-6.85)#29 | 20.4%(-8.44)#2,969 |
| 30. | Privateer | 12.0% | 18.8%(-6.81)#30 | 20.4%(-8.40)#3,010 |
| 31. | Langley | 12.2% | 18.8%(-6.60)#31 | 20.4%(-8.19)#3,238 |
| 32. | Carlisle | 12.3% | 18.8%(-6.48)#32 | 20.4%(-8.07)#3,361 |
| 33. | Seabrook | 12.4% | 18.8%(-6.39)#33 | 20.4%(-7.98)#3,454 |
| 34. | Finklea | 12.6% | 18.8%(-6.19)#34 | 20.4%(-7.78)#3,703 |
| 35. | North Hartsville | 12.6% | 18.8%(-6.16)#35 | 20.4%(-7.75)#3,739 |
| 36. | Norris | 12.7% | 18.8%(-6.12)#36 | 20.4%(-7.71)#3,786 |
| 37. | Lodge | 12.7% | 18.8%(-6.11)#37 | 20.4%(-7.70)#3,803 |
| 38. | Harbor Island | 12.7% | 18.8%(-6.08)#38 | 20.4%(-7.67)#3,837 |
| 39. | Lesslie | 12.7% | 18.8%(-6.06)#39 | 20.4%(-7.65)#3,856 |
| 40. | Elliott | 12.7% | 18.8%(-6.05)#40 | 20.4%(-7.64)#3,859 |
| 41. | Pelzer | 12.8% | 18.8%(-5.96)#41 | 20.4%(-7.55)#3,974 |
| 42. | The Cliffs Valley | 12.8% | 18.8%(-5.96)#42 | 20.4%(-7.55)#3,983 |
| 43. | Kershaw | 12.9% | 18.8%(-5.85)#43 | 20.4%(-7.44)#4,107 |
| 44. | Campobello | 13.0% | 18.8%(-5.83)#44 | 20.4%(-7.42)#4,138 |
| 45. | Six Mile | 13.0% | 18.8%(-5.81)#45 | 20.4%(-7.40)#4,160 |
| 46. | Pacolet | 13.0% | 18.8%(-5.80)#46 | 20.4%(-7.38)#4,174 |
| 47. | Northlake | 13.0% | 18.8%(-5.79)#47 | 20.4%(-7.38)#4,182 |
| 48. | Joanna | 13.0% | 18.8%(-5.77)#48 | 20.4%(-7.36)#4,202 |
| 49. | Hopkins | 13.1% | 18.8%(-5.73)#49 | 20.4%(-7.32)#4,257 |
| 50. | Yemassee | 13.2% | 18.8%(-5.63)#50 | 20.4%(-7.22)#4,394 |
| 51. | Nichols | 13.3% | 18.8%(-5.52)#51 | 20.4%(-7.11)#4,553 |
| 52. | La France | 13.3% | 18.8%(-5.51)#52 | 20.4%(-7.10)#4,568 |
| 53. | Summit | 13.3% | 18.8%(-5.47)#53 | 20.4%(-7.06)#4,633 |
| 54. | Bucksport | 13.5% | 18.8%(-5.31)#54 | 20.4%(-6.90)#4,854 |
| 55. | Sheldon | 13.5% | 18.8%(-5.29)#55 | 20.4%(-6.88)#4,889 |
| 56. | Newport | 13.6% | 18.8%(-5.22)#56 | 20.4%(-6.81)#4,991 |
| 57. | Paxville | 13.6% | 18.8%(-5.20)#57 | 20.4%(-6.79)#5,019 |
| 58. | Briarcliffe Acres | 13.6% | 18.8%(-5.17)#58 | 20.4%(-6.76)#5,081 |
| 59. | Mcbee | 13.7% | 18.8%(-5.13)#59 | 20.4%(-6.72)#5,126 |
| 60. | Wyboo | 13.8% | 18.8%(-4.94)#60 | 20.4%(-6.53)#5,432 |
| 61. | Debordieu Colony | 13.9% | 18.8%(-4.89)#61 | 20.4%(-6.48)#5,498 |
| 62. | Ehrhardt | 13.9% | 18.8%(-4.89)#62 | 20.4%(-6.48)#5,514 |
| 63. | Livingston | 14.0% | 18.8%(-4.83)#63 | 20.4%(-6.42)#5,596 |
| 64. | Hickory Grove | 14.0% | 18.8%(-4.75)#64 | 20.4%(-6.34)#5,730 |
| 65. | Ulmer | 14.1% | 18.8%(-4.71)#65 | 20.4%(-6.30)#5,802 |
| 66. | North Augusta | 14.1% | 18.8%(-4.67)#66 | 20.4%(-6.26)#5,870 |
| 67. | Donalds | 14.1% | 18.8%(-4.65)#67 | 20.4%(-6.24)#5,911 |
| 68. | Arcadia Lakes | 14.2% | 18.8%(-4.56)#68 | 20.4%(-6.15)#6,077 |
| 69. | West Union | 14.3% | 18.8%(-4.50)#69 | 20.4%(-6.09)#6,178 |
| 70. | Ruby | 14.4% | 18.8%(-4.42)#70 | 20.4%(-6.01)#6,313 |
| 71. | Elgin | 14.4% | 18.8%(-4.40)#71 | 20.4%(-5.99)#6,349 |
| 72. | Oakland | 14.4% | 18.8%(-4.35)#72 | 20.4%(-5.94)#6,423 |
| 73. | Bonneau Beach | 14.7% | 18.8%(-4.12)#73 | 20.4%(-5.71)#6,789 |
| 74. | Society Hill | 14.7% | 18.8%(-4.09)#74 | 20.4%(-5.68)#6,846 |
| 75. | India Hook | 14.7% | 18.8%(-4.07)#75 | 20.4%(-5.66)#6,877 |
| 76. | Olanta | 14.8% | 18.8%(-3.99)#76 | 20.4%(-5.58)#7,036 |
| 77. | Greeleyville | 14.8% | 18.8%(-3.97)#77 | 20.4%(-5.56)#7,064 |
| 78. | Mcclellanville | 14.8% | 18.8%(-3.94)#78 | 20.4%(-5.53)#7,124 |
| 79. | Williamston | 14.9% | 18.8%(-3.93)#79 | 20.4%(-5.52)#7,149 |
| 80. | South Sumter | 15.0% | 18.8%(-3.83)#80 | 20.4%(-5.42)#7,306 |
| 81. | Homewood | 15.1% | 18.8%(-3.67)#81 | 20.4%(-5.26)#7,603 |
| 82. | Baxter | 15.1% | 18.8%(-3.65)#82 | 20.4%(-5.24)#7,629 |
| 83. | Cottageville | 15.1% | 18.8%(-3.65)#83 | 20.4%(-5.24)#7,635 |
| 84. | Gray Court | 15.2% | 18.8%(-3.61)#84 | 20.4%(-5.20)#7,711 |
| 85. | Jenkinsville | 15.2% | 18.8%(-3.55)#85 | 20.4%(-5.14)#7,847 |
| 86. | Starr | 15.3% | 18.8%(-3.53)#86 | 20.4%(-5.12)#7,886 |
| 87. | Parksville | 15.3% | 18.8%(-3.49)#87 | 20.4%(-5.08)#7,951 |
| 88. | Hodges | 15.3% | 18.8%(-3.48)#88 | 20.4%(-5.07)#7,966 |
| 89. | Whitmire | 15.3% | 18.8%(-3.46)#89 | 20.4%(-5.05)#8,001 |
| 90. | Snelling | 15.4% | 18.8%(-3.42)#90 | 20.4%(-5.01)#8,084 |
| 91. | Powdersville | 15.4% | 18.8%(-3.41)#91 | 20.4%(-4.99)#8,106 |
| 92. | Cross Hill | 15.4% | 18.8%(-3.37)#92 | 20.4%(-4.96)#8,165 |
| 93. | Lockhart | 15.5% | 18.8%(-3.33)#93 | 20.4%(-4.92)#8,253 |
| 94. | Fort Mill | 15.5% | 18.8%(-3.31)#94 | 20.4%(-4.90)#8,296 |
| 95. | Gilbert | 15.5% | 18.8%(-3.31)#95 | 20.4%(-4.90)#8,298 |
| 96. | Bonneau | 15.5% | 18.8%(-3.28)#96 | 20.4%(-4.87)#8,375 |
| 97. | Harleyville | 15.5% | 18.8%(-3.26)#97 | 20.4%(-4.85)#8,424 |
| 98. | Reidville | 15.6% | 18.8%(-3.18)#98 | 20.4%(-4.77)#8,578 |
| 99. | Coward | 15.6% | 18.8%(-3.15)#99 | 20.4%(-4.74)#8,633 |
| 100. | Fairfax | 15.7% | 18.8%(-3.07)#100 | 20.4%(-4.66)#8,793 |
Common Questions
What are the Top 10 Cities with the Lowest Costs of Housing as Percentage of Income in South Carolina?
Top 10 Cities with the Lowest Costs of Housing as Percentage of Income in South Carolina are:
#1
4.6%
#2
4.9%
#3
6.1%
#4
8.0%
#5
8.0%
#6
8.5%
#7
8.8%
#8
8.8%
#9
8.8%
#10
9.2%
What city has the Lowest Costs of Housing as Percentage of Income in South Carolina?
Ware Place has the Lowest Costs of Housing as Percentage of Income in South Carolina with 4.6%.
What is the Average Housing Costs as Percentage of Income in the State of South Carolina?
Average Housing Costs as Percentage of Income in South Carolina is 18.8%.
What is the Average Housing Costs as Percentage of Income in the United States?
Average Housing Costs as Percentage of Income in the United States is 20.4%.