Mullins, SC Map & Demographics
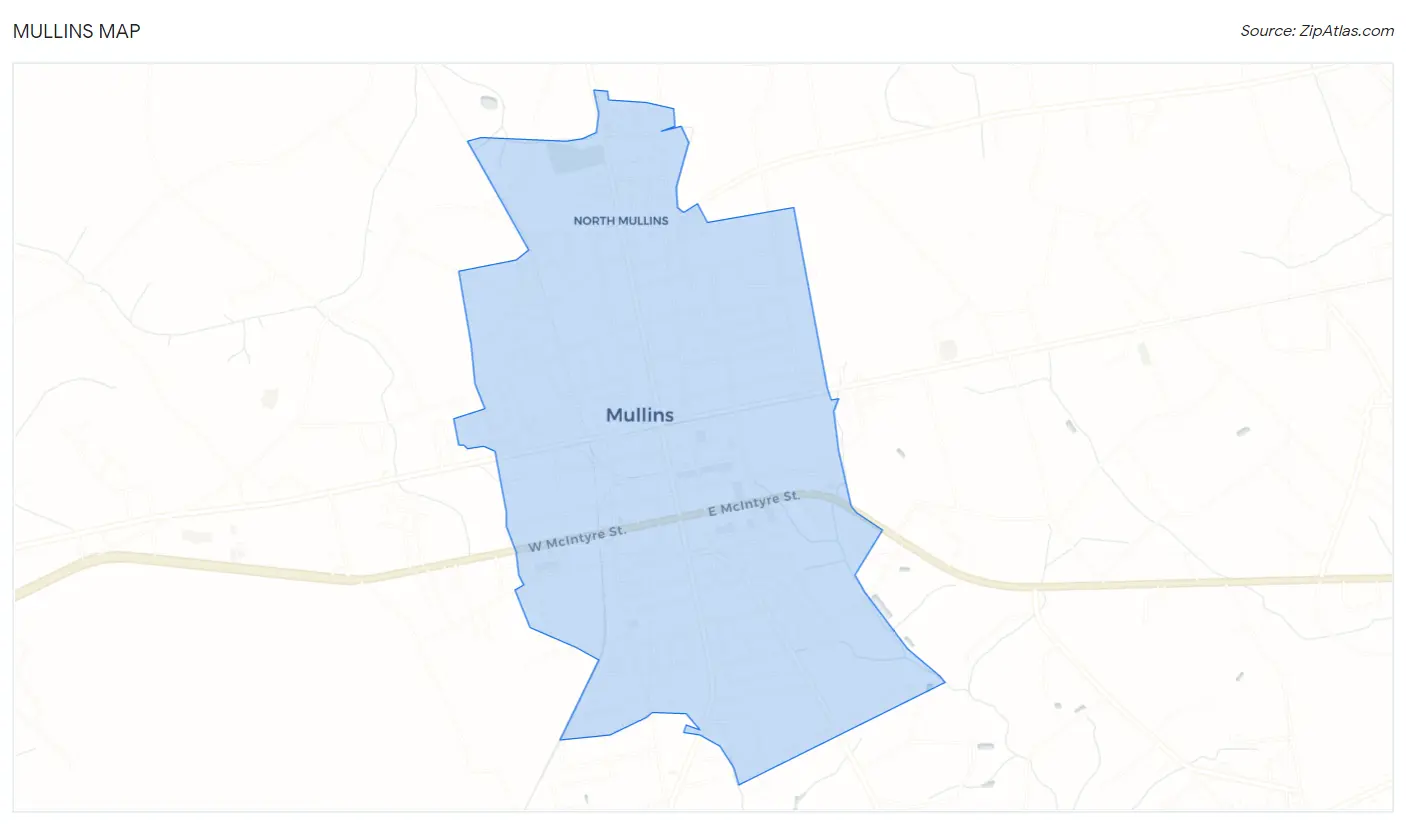
Mullins Map
Mullins Overview
$17,901
PER CAPITA INCOME
$49,722
AVG FAMILY INCOME
$38,304
AVG HOUSEHOLD INCOME
36.9%
WAGE / INCOME GAP [ % ]
63.1¢/ $1
WAGE / INCOME GAP [ $ ]
0.45
INEQUALITY / GINI INDEX
4,014
TOTAL POPULATION
1,583
MALE POPULATION
2,431
FEMALE POPULATION
65.12
MALES / 100 FEMALES
153.57
FEMALES / 100 MALES
36.2
MEDIAN AGE
3.9
AVG FAMILY SIZE
2.8
AVG HOUSEHOLD SIZE
1,630
LABOR FORCE [ PEOPLE ]
54.6%
PERCENT IN LABOR FORCE
9.4%
UNEMPLOYMENT RATE
Mullins Zip Codes
Mullins Area Codes
Income in Mullins
Income Overview in Mullins
Per Capita Income in Mullins is $17,901, while median incomes of families and households are $49,722 and $38,304 respectively.
| Characteristic | Number | Measure |
| Per Capita Income | 4,014 | $17,901 |
| Median Family Income | 820 | $49,722 |
| Mean Family Income | 820 | $59,194 |
| Median Household Income | 1,398 | $38,304 |
| Mean Household Income | 1,398 | $45,138 |
| Income Deficit | 820 | $0 |
| Wage / Income Gap (%) | 4,014 | 36.88% |
| Wage / Income Gap ($) | 4,014 | 63.12¢ per $1 |
| Gini / Inequality Index | 4,014 | 0.45 |
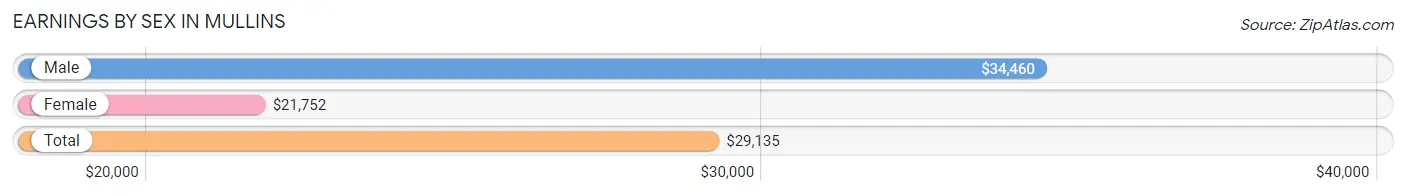
Earnings by Sex in Mullins
Average Earnings in Mullins are $29,135, $34,460 for men and $21,752 for women, a difference of 36.9%.
| Sex | Number | Average Earnings |
| Male | 699 (43.0%) | $34,460 |
| Female | 927 (57.0%) | $21,752 |
| Total | 1,626 (100.0%) | $29,135 |
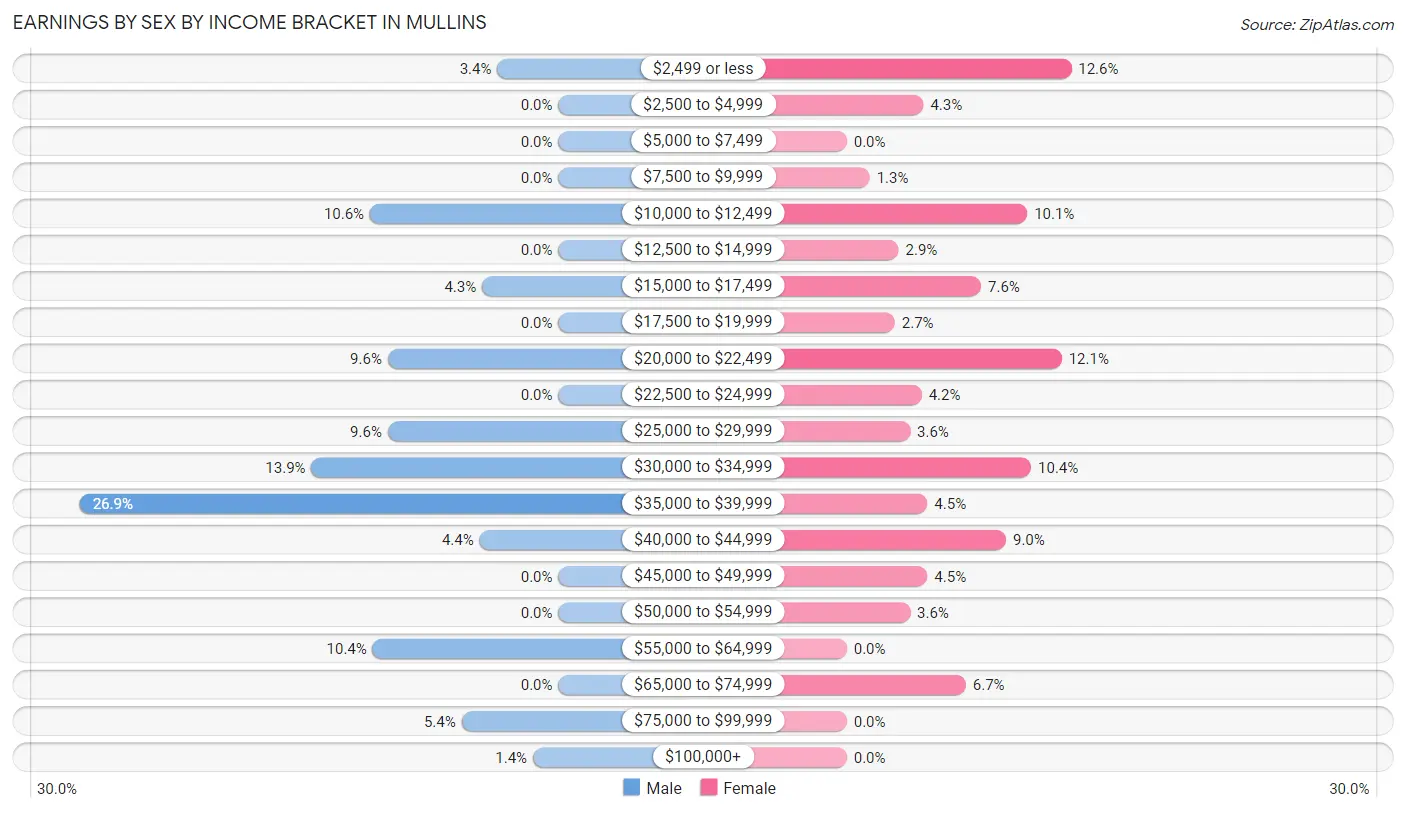
Earnings by Sex by Income Bracket in Mullins
The most common earnings brackets in Mullins are $35,000 to $39,999 for men (188 | 26.9%) and $2,499 or less for women (117 | 12.6%).
| Income | Male | Female |
| $2,499 or less | 24 (3.4%) | 117 (12.6%) |
| $2,500 to $4,999 | 0 (0.0%) | 40 (4.3%) |
| $5,000 to $7,499 | 0 (0.0%) | 0 (0.0%) |
| $7,500 to $9,999 | 0 (0.0%) | 12 (1.3%) |
| $10,000 to $12,499 | 74 (10.6%) | 94 (10.1%) |
| $12,500 to $14,999 | 0 (0.0%) | 27 (2.9%) |
| $15,000 to $17,499 | 30 (4.3%) | 70 (7.5%) |
| $17,500 to $19,999 | 0 (0.0%) | 25 (2.7%) |
| $20,000 to $22,499 | 67 (9.6%) | 112 (12.1%) |
| $22,500 to $24,999 | 0 (0.0%) | 39 (4.2%) |
| $25,000 to $29,999 | 67 (9.6%) | 33 (3.6%) |
| $30,000 to $34,999 | 97 (13.9%) | 96 (10.4%) |
| $35,000 to $39,999 | 188 (26.9%) | 42 (4.5%) |
| $40,000 to $44,999 | 31 (4.4%) | 83 (8.9%) |
| $45,000 to $49,999 | 0 (0.0%) | 42 (4.5%) |
| $50,000 to $54,999 | 0 (0.0%) | 33 (3.6%) |
| $55,000 to $64,999 | 73 (10.4%) | 0 (0.0%) |
| $65,000 to $74,999 | 0 (0.0%) | 62 (6.7%) |
| $75,000 to $99,999 | 38 (5.4%) | 0 (0.0%) |
| $100,000+ | 10 (1.4%) | 0 (0.0%) |
| Total | 699 (100.0%) | 927 (100.0%) |
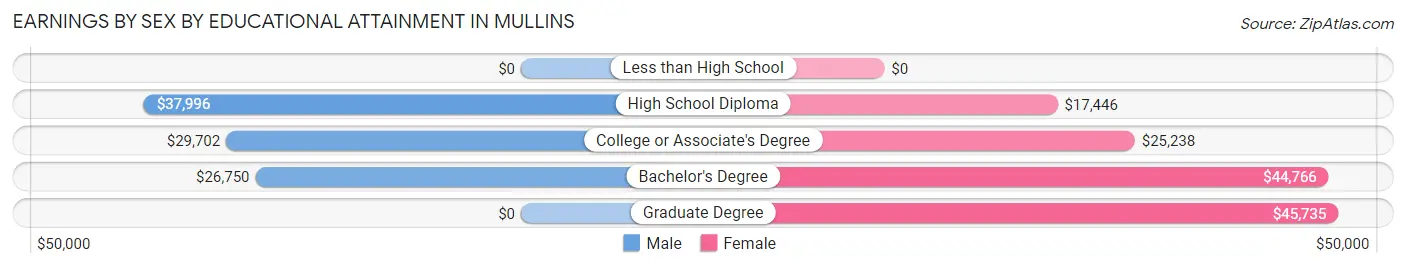
Earnings by Sex by Educational Attainment in Mullins
Average earnings in Mullins are $36,855 for men and $24,327 for women, a difference of 34.0%. Men with an educational attainment of high school diploma enjoy the highest average annual earnings of $37,996, while those with bachelor's degree education earn the least with $26,750. Women with an educational attainment of graduate degree earn the most with the average annual earnings of $45,735, while those with high school diploma education have the smallest earnings of $17,446.
| Educational Attainment | Male Income | Female Income |
| Less than High School | - | - |
| High School Diploma | $37,996 | $17,446 |
| College or Associate's Degree | $29,702 | $25,238 |
| Bachelor's Degree | $26,750 | $44,766 |
| Graduate Degree | - | - |
| Total | $36,855 | $24,327 |
Family Income in Mullins
Family Income Brackets in Mullins
According to the Mullins family income data, there are 180 families falling into the $75,000 to $99,999 income range, which is the most common income bracket and makes up 22.0% of all families. Conversely, the $150,000 to $199,999 income bracket is the least frequent group with only 3 families (0.4%) belonging to this category.
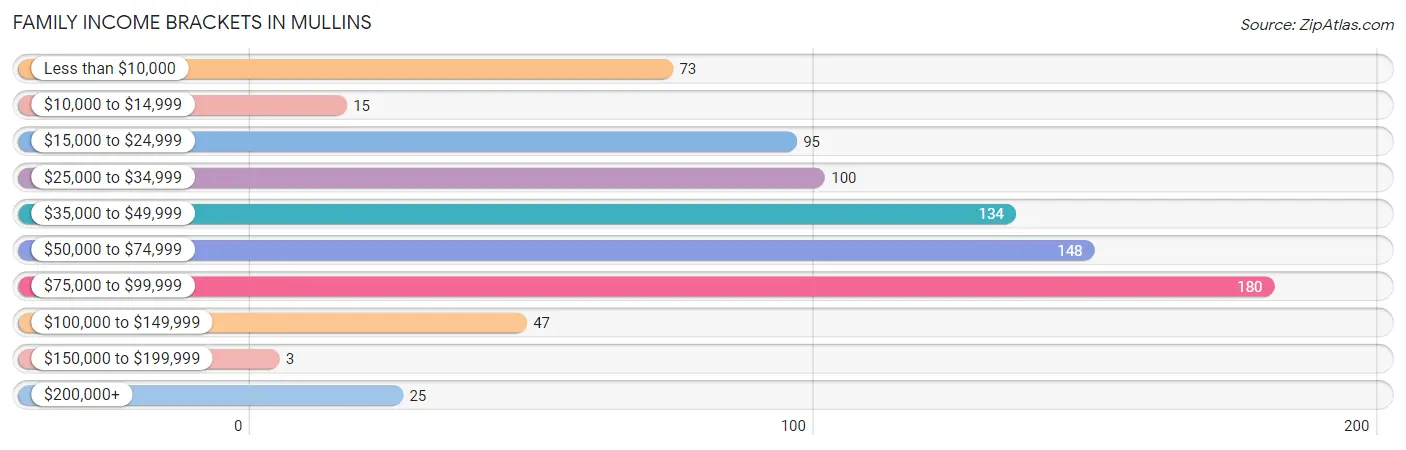
| Income Bracket | # Families | % Families |
| Less than $10,000 | 73 | 8.9% |
| $10,000 to $14,999 | 15 | 1.8% |
| $15,000 to $24,999 | 95 | 11.6% |
| $25,000 to $34,999 | 100 | 12.2% |
| $35,000 to $49,999 | 134 | 16.3% |
| $50,000 to $74,999 | 148 | 18.0% |
| $75,000 to $99,999 | 180 | 22.0% |
| $100,000 to $149,999 | 47 | 5.7% |
| $150,000 to $199,999 | 3 | 0.4% |
| $200,000+ | 25 | 3.0% |
Family Income by Famaliy Size in Mullins
6-person families (128 | 15.6%) account for the highest median family income in Mullins with $80,350 per family, while 2-person families (368 | 44.9%) have the highest median income of $24,584 per family member.
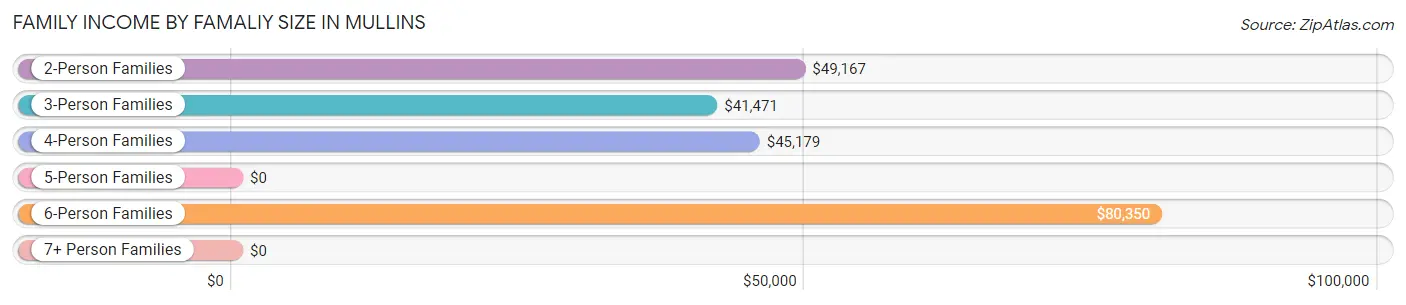
| Income Bracket | # Families | Median Income |
| 2-Person Families | 368 (44.9%) | $49,167 |
| 3-Person Families | 214 (26.1%) | $41,471 |
| 4-Person Families | 73 (8.9%) | $45,179 |
| 5-Person Families | 22 (2.7%) | $0 |
| 6-Person Families | 128 (15.6%) | $80,350 |
| 7+ Person Families | 15 (1.8%) | $0 |
| Total | 820 (100.0%) | $49,722 |
Family Income by Number of Earners in Mullins
The median family income in Mullins is $49,722, with families comprising 3+ earners (113) having the highest median family income of $80,425, while families with 1 earner (298) have the lowest median family income of $31,582, accounting for 13.8% and 36.3% of families, respectively.
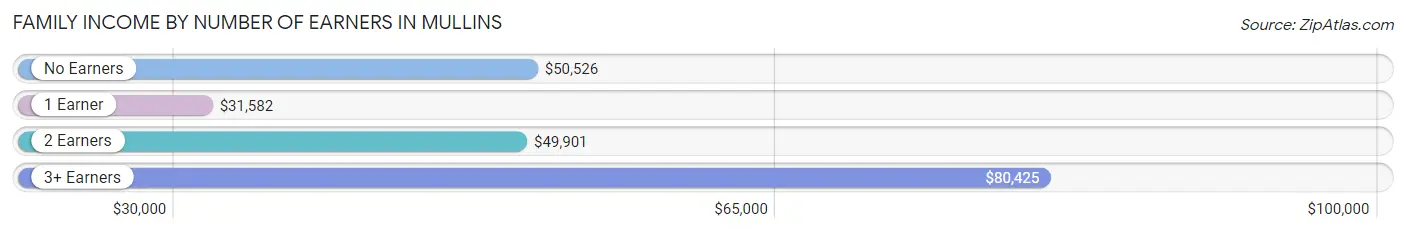
| Number of Earners | # Families | Median Income |
| No Earners | 216 (26.3%) | $50,526 |
| 1 Earner | 298 (36.3%) | $31,582 |
| 2 Earners | 193 (23.5%) | $49,901 |
| 3+ Earners | 113 (13.8%) | $80,425 |
| Total | 820 (100.0%) | $49,722 |
Household Income in Mullins
Household Income Brackets in Mullins
With 285 households falling in the category, the $35,000 to $49,999 income range is the most frequent in Mullins, accounting for 20.4% of all households. In contrast, only 3 households (0.2%) fall into the $150,000 to $199,999 income bracket, making it the least populous group.
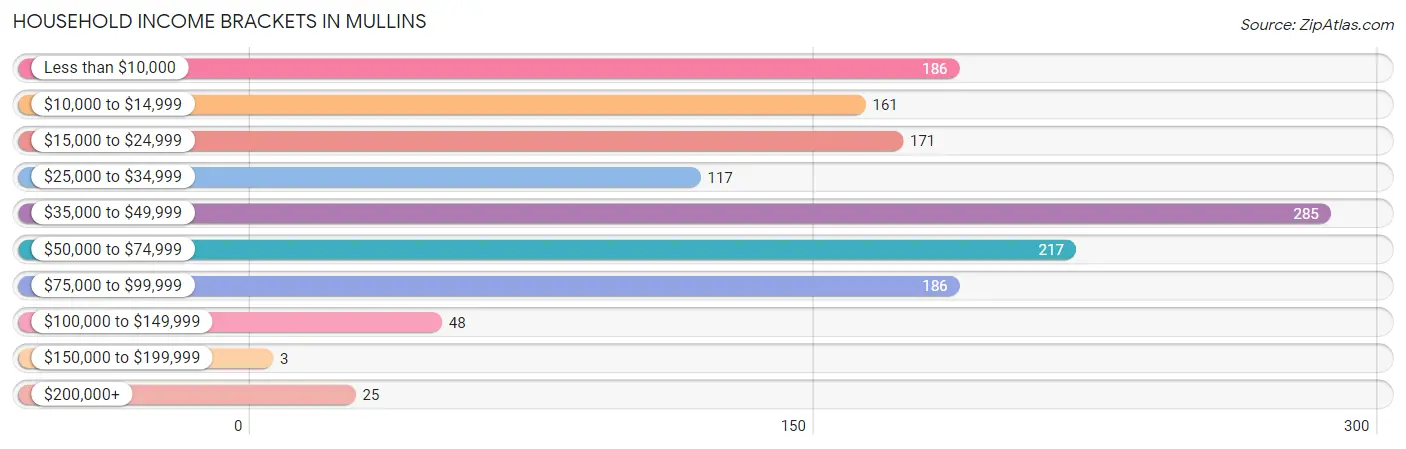
| Income Bracket | # Households | % Households |
| Less than $10,000 | 186 | 13.3% |
| $10,000 to $14,999 | 161 | 11.5% |
| $15,000 to $24,999 | 171 | 12.2% |
| $25,000 to $34,999 | 117 | 8.4% |
| $35,000 to $49,999 | 285 | 20.4% |
| $50,000 to $74,999 | 217 | 15.5% |
| $75,000 to $99,999 | 186 | 13.3% |
| $100,000 to $149,999 | 48 | 3.4% |
| $150,000 to $199,999 | 3 | 0.2% |
| $200,000+ | 25 | 1.8% |
Household Income by Householder Age in Mullins
The median household income in Mullins is $38,304, with the highest median household income of $49,722 found in the 65+ years age bracket for the primary householder. A total of 416 households (29.8%) fall into this category. Meanwhile, the 15 to 24 years age bracket for the primary householder has the lowest median household income of $0, with 44 households (3.2%) in this group.
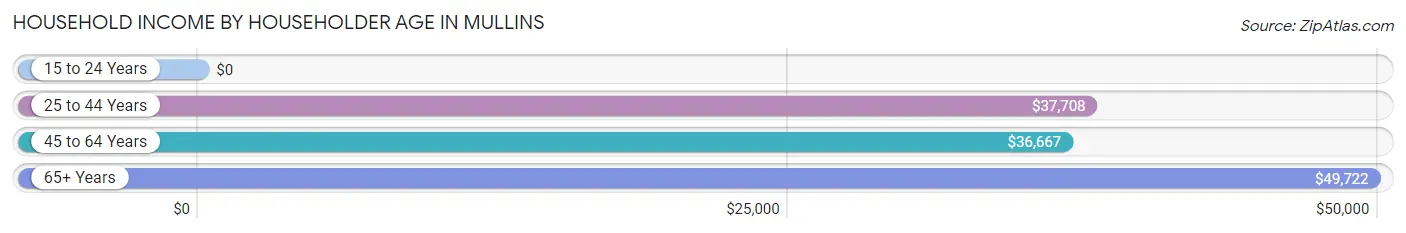
| Income Bracket | # Households | Median Income |
| 15 to 24 Years | 44 (3.2%) | $0 |
| 25 to 44 Years | 528 (37.8%) | $37,708 |
| 45 to 64 Years | 410 (29.3%) | $36,667 |
| 65+ Years | 416 (29.8%) | $49,722 |
| Total | 1,398 (100.0%) | $38,304 |
Poverty in Mullins
Income Below Poverty by Sex and Age in Mullins
With 15.7% poverty level for males and 37.4% for females among the residents of Mullins, under 5 year old males and 6 to 11 year old females are the most vulnerable to poverty, with 78 males (74.3%) and 155 females (68.0%) in their respective age groups living below the poverty level.
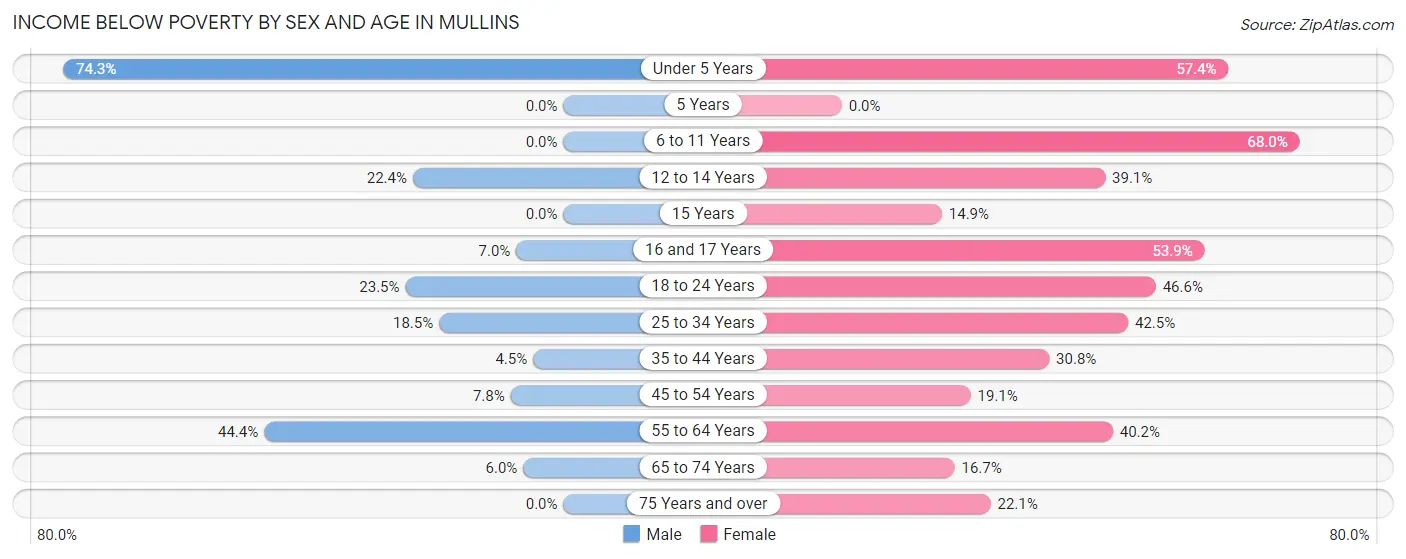
| Age Bracket | Male | Female |
| Under 5 Years | 78 (74.3%) | 124 (57.4%) |
| 5 Years | 0 (0.0%) | 0 (0.0%) |
| 6 to 11 Years | 0 (0.0%) | 155 (68.0%) |
| 12 to 14 Years | 19 (22.4%) | 61 (39.1%) |
| 15 Years | 0 (0.0%) | 11 (14.9%) |
| 16 and 17 Years | 7 (7.0%) | 42 (53.8%) |
| 18 to 24 Years | 42 (23.5%) | 62 (46.6%) |
| 25 to 34 Years | 24 (18.5%) | 105 (42.5%) |
| 35 to 44 Years | 15 (4.5%) | 109 (30.8%) |
| 45 to 54 Years | 12 (7.8%) | 35 (19.1%) |
| 55 to 64 Years | 36 (44.4%) | 99 (40.2%) |
| 65 to 74 Years | 9 (6.0%) | 40 (16.7%) |
| 75 Years and over | 0 (0.0%) | 36 (22.1%) |
| Total | 242 (15.7%) | 879 (37.4%) |
Income Above Poverty by Sex and Age in Mullins
According to the poverty statistics in Mullins, males aged 5 years and females aged 5 years are the age groups that are most secure financially, with 100.0% of males and 100.0% of females in these age groups living above the poverty line.
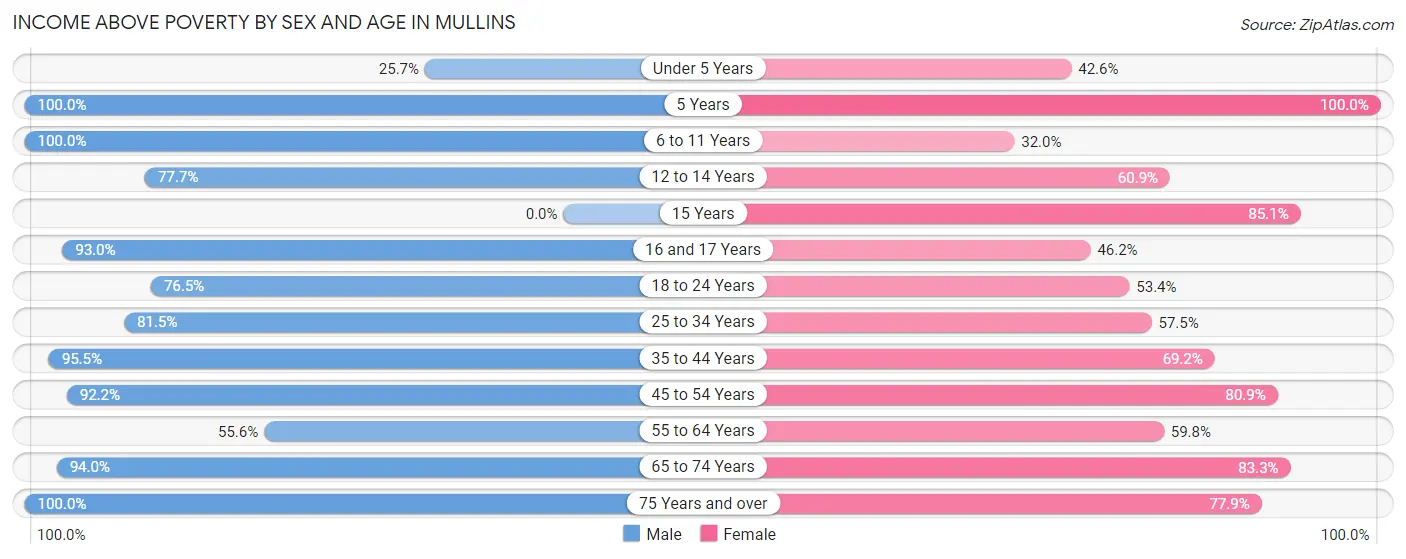
| Age Bracket | Male | Female |
| Under 5 Years | 27 (25.7%) | 92 (42.6%) |
| 5 Years | 30 (100.0%) | 31 (100.0%) |
| 6 to 11 Years | 104 (100.0%) | 73 (32.0%) |
| 12 to 14 Years | 66 (77.6%) | 95 (60.9%) |
| 15 Years | 0 (0.0%) | 63 (85.1%) |
| 16 and 17 Years | 93 (93.0%) | 36 (46.2%) |
| 18 to 24 Years | 137 (76.5%) | 71 (53.4%) |
| 25 to 34 Years | 106 (81.5%) | 142 (57.5%) |
| 35 to 44 Years | 318 (95.5%) | 245 (69.2%) |
| 45 to 54 Years | 141 (92.2%) | 148 (80.9%) |
| 55 to 64 Years | 45 (55.6%) | 147 (59.8%) |
| 65 to 74 Years | 142 (94.0%) | 199 (83.3%) |
| 75 Years and over | 89 (100.0%) | 127 (77.9%) |
| Total | 1,298 (84.3%) | 1,469 (62.6%) |
Income Below Poverty Among Married-Couple Families in Mullins
The poverty statistics for married-couple families in Mullins show that 5.3% or 15 of the total 285 families live below the poverty line. Families with 1 or 2 children have the highest poverty rate of 20.3%, comprising of 15 families. On the other hand, families with no children have the lowest poverty rate of 0.0%, which includes 0 families.
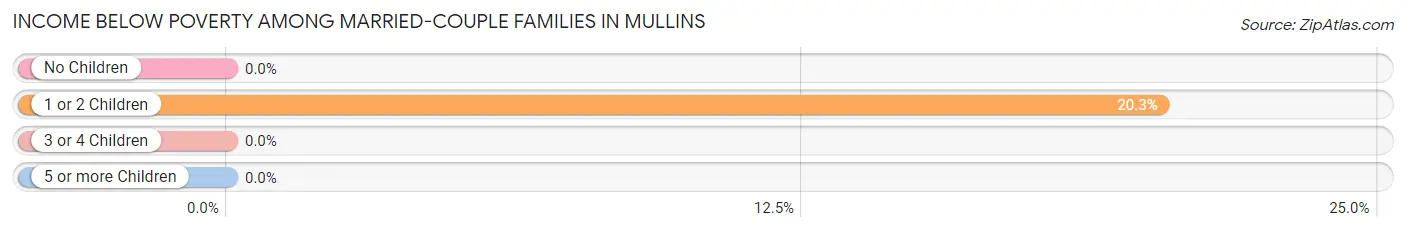
| Children | Above Poverty | Below Poverty |
| No Children | 153 (100.0%) | 0 (0.0%) |
| 1 or 2 Children | 59 (79.7%) | 15 (20.3%) |
| 3 or 4 Children | 58 (100.0%) | 0 (0.0%) |
| 5 or more Children | 0 (0.0%) | 0 (0.0%) |
| Total | 270 (94.7%) | 15 (5.3%) |
Income Below Poverty Among Single-Parent Households in Mullins
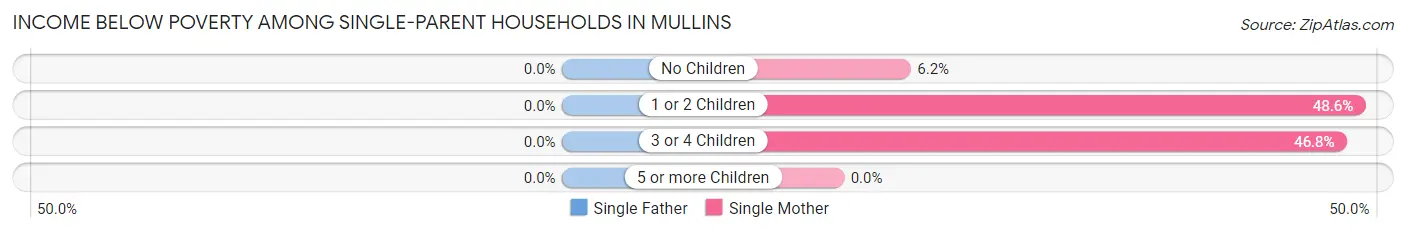
| Children | Single Father | Single Mother |
| No Children | 0 (0.0%) | 10 (6.2%) |
| 1 or 2 Children | 0 (0.0%) | 135 (48.6%) |
| 3 or 4 Children | 0 (0.0%) | 22 (46.8%) |
| 5 or more Children | 0 (0.0%) | 0 (0.0%) |
| Total | 0 (0.0%) | 167 (34.4%) |
Income Below Poverty Among Married-Couple vs Single-Parent Households in Mullins
The poverty data for Mullins shows that 15 of the married-couple family households (5.3%) and 167 of the single-parent households (31.2%) are living below the poverty level. Within the married-couple family households, those with 1 or 2 children have the highest poverty rate, with 15 households (20.3%) falling below the poverty line. Among the single-parent households, those with 1 or 2 children have the highest poverty rate, with 135 household (48.6%) living below poverty.
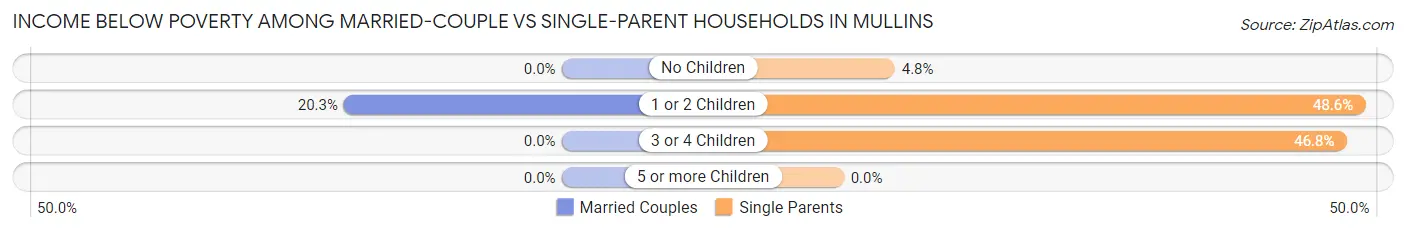
| Children | Married-Couple Families | Single-Parent Households |
| No Children | 0 (0.0%) | 10 (4.8%) |
| 1 or 2 Children | 15 (20.3%) | 135 (48.6%) |
| 3 or 4 Children | 0 (0.0%) | 22 (46.8%) |
| 5 or more Children | 0 (0.0%) | 0 (0.0%) |
| Total | 15 (5.3%) | 167 (31.2%) |
Race in Mullins
The most populous races in Mullins are Black / African American (3,002 | 74.8%), White / Caucasian (814 | 20.3%), and Hispanic or Latino (156 | 3.9%).
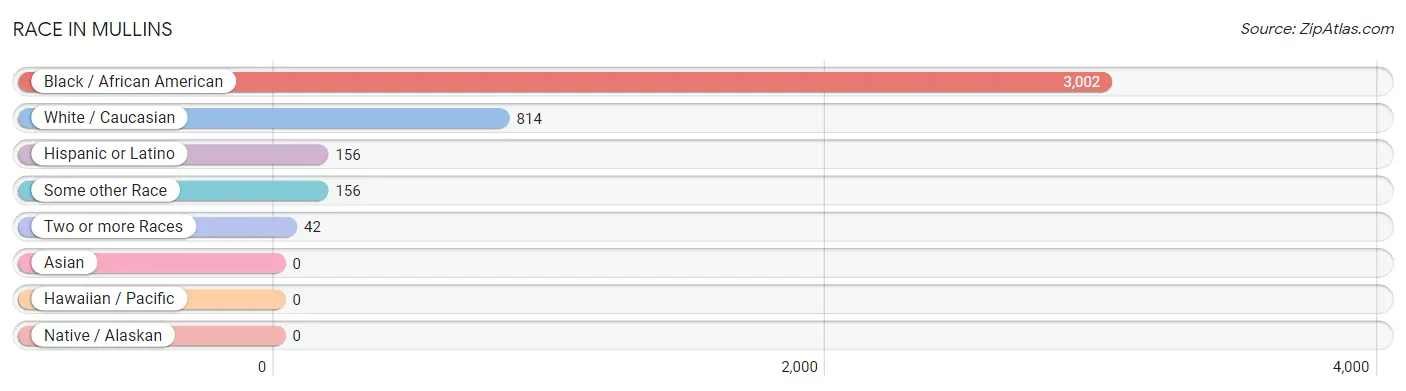
| Race | # Population | % Population |
| Asian | 0 | 0.0% |
| Black / African American | 3,002 | 74.8% |
| Hawaiian / Pacific | 0 | 0.0% |
| Hispanic or Latino | 156 | 3.9% |
| Native / Alaskan | 0 | 0.0% |
| White / Caucasian | 814 | 20.3% |
| Two or more Races | 42 | 1.1% |
| Some other Race | 156 | 3.9% |
| Total | 4,014 | 100.0% |
Ancestry in Mullins
The most populous ancestries reported in Mullins are American (223 | 5.6%), Mexican (156 | 3.9%), English (125 | 3.1%), German (103 | 2.6%), and Scotch-Irish (58 | 1.4%), together accounting for 16.6% of all Mullins residents.
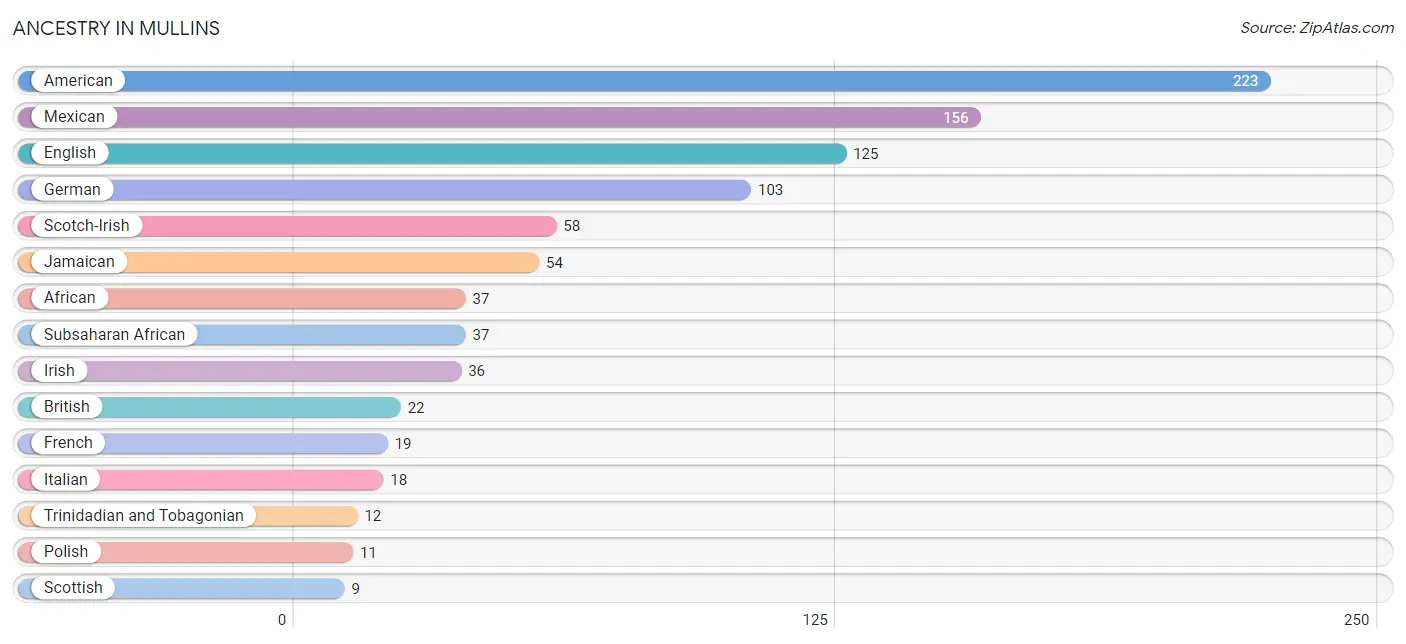
| Ancestry | # Population | % Population |
| African | 37 | 0.9% |
| American | 223 | 5.6% |
| British | 22 | 0.5% |
| English | 125 | 3.1% |
| French | 19 | 0.5% |
| German | 103 | 2.6% |
| Irish | 36 | 0.9% |
| Italian | 18 | 0.4% |
| Jamaican | 54 | 1.3% |
| Mexican | 156 | 3.9% |
| Polish | 11 | 0.3% |
| Russian | 6 | 0.2% |
| Scotch-Irish | 58 | 1.4% |
| Scottish | 9 | 0.2% |
| Subsaharan African | 37 | 0.9% |
| Thai | 6 | 0.2% |
| Trinidadian and Tobagonian | 12 | 0.3% | View All 17 Rows |
Immigrants in Mullins
The most numerous immigrant groups reported in Mullins came from Caribbean (62 | 1.5%), Latin America (62 | 1.5%), Jamaica (54 | 1.3%), Trinidad and Tobago (8 | 0.2%), and England (5 | 0.1%), together accounting for 4.8% of all Mullins residents.
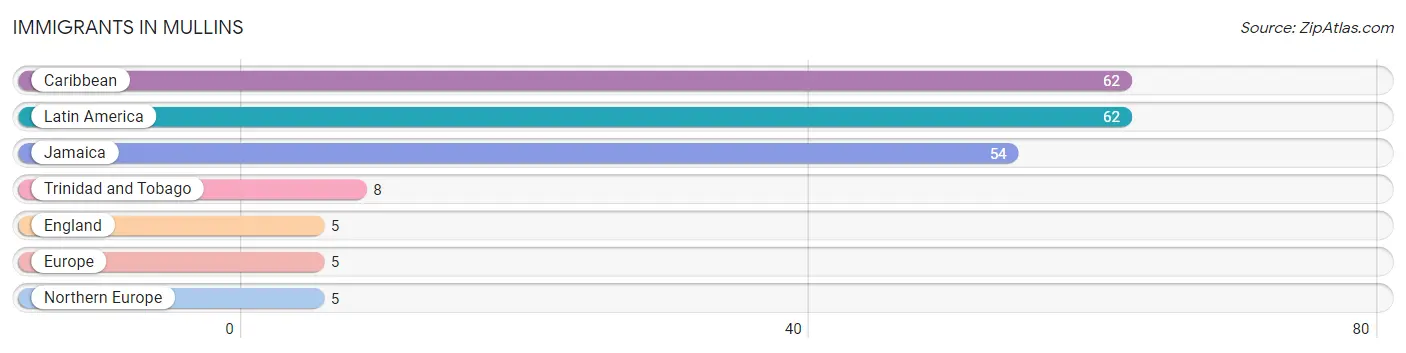
| Immigration Origin | # Population | % Population |
| Caribbean | 62 | 1.5% |
| England | 5 | 0.1% |
| Europe | 5 | 0.1% |
| Jamaica | 54 | 1.3% |
| Latin America | 62 | 1.5% |
| Northern Europe | 5 | 0.1% |
| Trinidad and Tobago | 8 | 0.2% | View All 7 Rows |
Sex and Age in Mullins
Sex and Age in Mullins
The most populous age groups in Mullins are 35 to 39 Years (255 | 16.1%) for men and 10 to 14 Years (220 | 9.0%) for women.
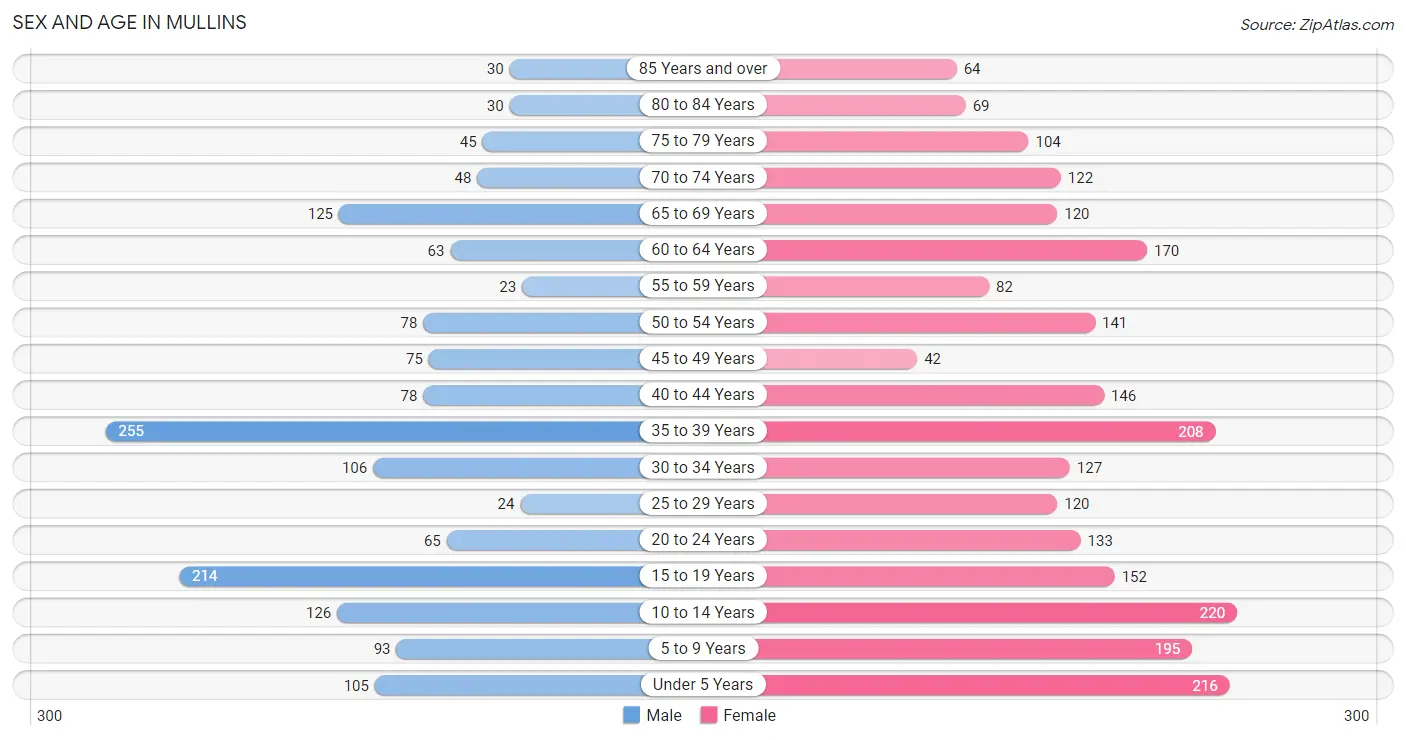
| Age Bracket | Male | Female |
| Under 5 Years | 105 (6.6%) | 216 (8.9%) |
| 5 to 9 Years | 93 (5.9%) | 195 (8.0%) |
| 10 to 14 Years | 126 (8.0%) | 220 (9.0%) |
| 15 to 19 Years | 214 (13.5%) | 152 (6.2%) |
| 20 to 24 Years | 65 (4.1%) | 133 (5.5%) |
| 25 to 29 Years | 24 (1.5%) | 120 (4.9%) |
| 30 to 34 Years | 106 (6.7%) | 127 (5.2%) |
| 35 to 39 Years | 255 (16.1%) | 208 (8.6%) |
| 40 to 44 Years | 78 (4.9%) | 146 (6.0%) |
| 45 to 49 Years | 75 (4.7%) | 42 (1.7%) |
| 50 to 54 Years | 78 (4.9%) | 141 (5.8%) |
| 55 to 59 Years | 23 (1.5%) | 82 (3.4%) |
| 60 to 64 Years | 63 (4.0%) | 170 (7.0%) |
| 65 to 69 Years | 125 (7.9%) | 120 (4.9%) |
| 70 to 74 Years | 48 (3.0%) | 122 (5.0%) |
| 75 to 79 Years | 45 (2.8%) | 104 (4.3%) |
| 80 to 84 Years | 30 (1.9%) | 69 (2.8%) |
| 85 Years and over | 30 (1.9%) | 64 (2.6%) |
| Total | 1,583 (100.0%) | 2,431 (100.0%) |
Families and Households in Mullins
Median Family Size in Mullins
The median family size in Mullins is 3.93 persons per family, with single female/mother families (486 | 59.3%) accounting for the largest median family size of 4.09 persons per family. On the other hand, single male/father families (49 | 6.0%) represent the smallest median family size with 3.53 persons per family.
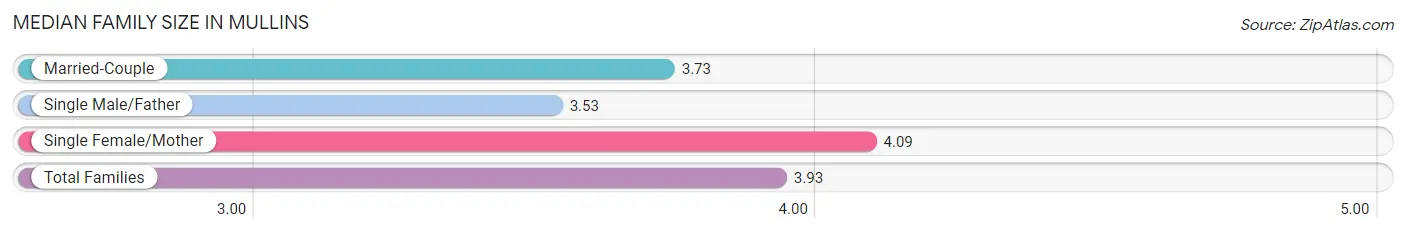
| Family Type | # Families | Family Size |
| Married-Couple | 285 (34.8%) | 3.73 |
| Single Male/Father | 49 (6.0%) | 3.53 |
| Single Female/Mother | 486 (59.3%) | 4.09 |
| Total Families | 820 (100.0%) | 3.93 |
Median Household Size in Mullins
The median household size in Mullins is 2.77 persons per household, with single female/mother households (486 | 34.8%) accounting for the largest median household size of 4.13 persons per household. non-family households (578 | 41.3%) represent the smallest median household size with 1.07 persons per household.
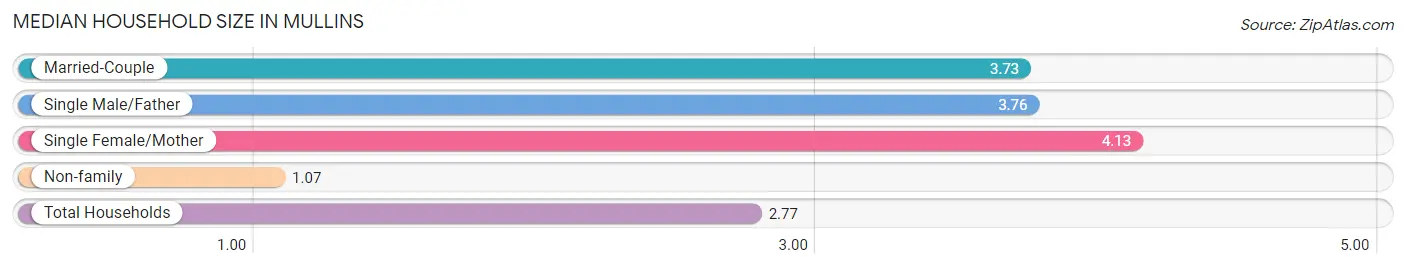
| Household Type | # Households | Household Size |
| Married-Couple | 285 (20.4%) | 3.73 |
| Single Male/Father | 49 (3.5%) | 3.76 |
| Single Female/Mother | 486 (34.8%) | 4.13 |
| Non-family | 578 (41.3%) | 1.07 |
| Total Households | 1,398 (100.0%) | 2.77 |
Household Size by Marriage Status in Mullins
Out of a total of 1,398 households in Mullins, 820 (58.7%) are family households, while 578 (41.3%) are nonfamily households. The most numerous type of family households are 2-person households, comprising 368, and the most common type of nonfamily households are 1-person households, comprising 539.

| Household Size | Family Households | Nonfamily Households |
| 1-Person Households | - | 539 (38.6%) |
| 2-Person Households | 368 (26.3%) | 39 (2.8%) |
| 3-Person Households | 196 (14.0%) | 0 (0.0%) |
| 4-Person Households | 78 (5.6%) | 0 (0.0%) |
| 5-Person Households | 35 (2.5%) | 0 (0.0%) |
| 6-Person Households | 128 (9.2%) | 0 (0.0%) |
| 7+ Person Households | 15 (1.1%) | 0 (0.0%) |
| Total | 820 (58.7%) | 578 (41.3%) |
Female Fertility in Mullins
Fertility by Age in Mullins
Average fertility rate in Mullins is 82.0 births per 1,000 women. Women in the age bracket of 20 to 34 years have the highest fertility rate with 161.0 births per 1,000 women. Women in the age bracket of 20 to 34 years acount for 78.2% of all women with births.
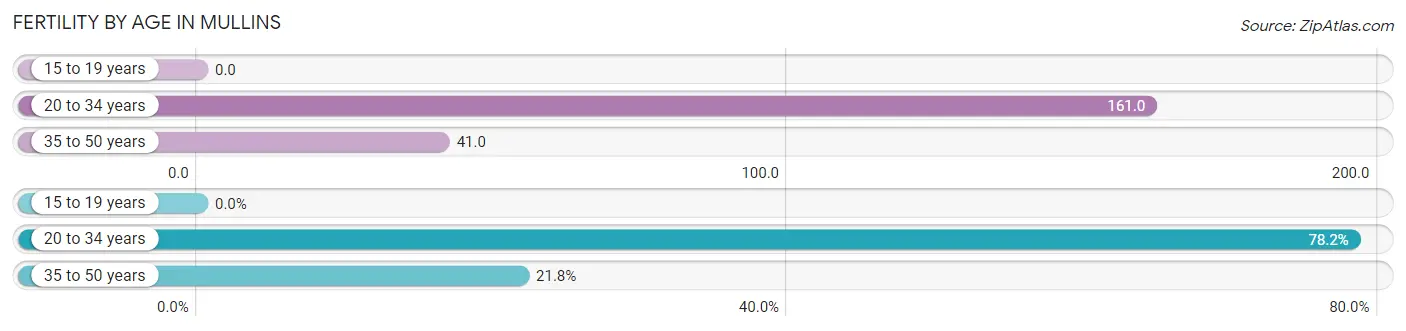
| Age Bracket | Women with Births | Births / 1,000 Women |
| 15 to 19 years | 0 (0.0%) | 0.0 |
| 20 to 34 years | 61 (78.2%) | 161.0 |
| 35 to 50 years | 17 (21.8%) | 41.0 |
| Total | 78 (100.0%) | 82.0 |
Fertility by Age by Marriage Status in Mullins
21.8% of women with births (78) in Mullins are married. The highest percentage of unmarried women with births falls into 20 to 34 years age bracket with 100.0% of them unmarried at the time of birth, while the lowest percentage of unmarried women with births belong to 35 to 50 years age bracket with 0.0% of them unmarried.
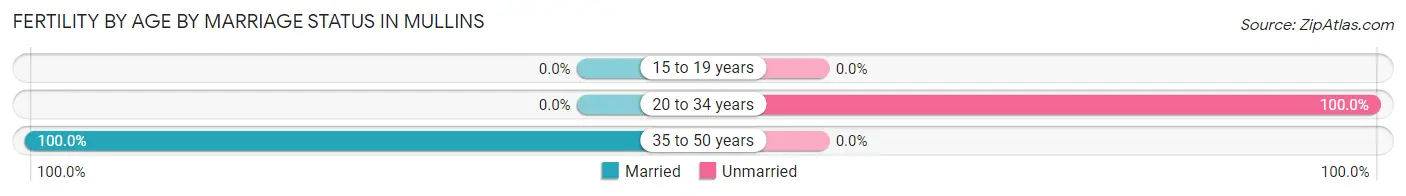
| Age Bracket | Married | Unmarried |
| 15 to 19 years | 0 (0.0%) | 0 (0.0%) |
| 20 to 34 years | 0 (0.0%) | 61 (100.0%) |
| 35 to 50 years | 17 (100.0%) | 0 (0.0%) |
| Total | 17 (21.8%) | 61 (78.2%) |
Fertility by Education in Mullins
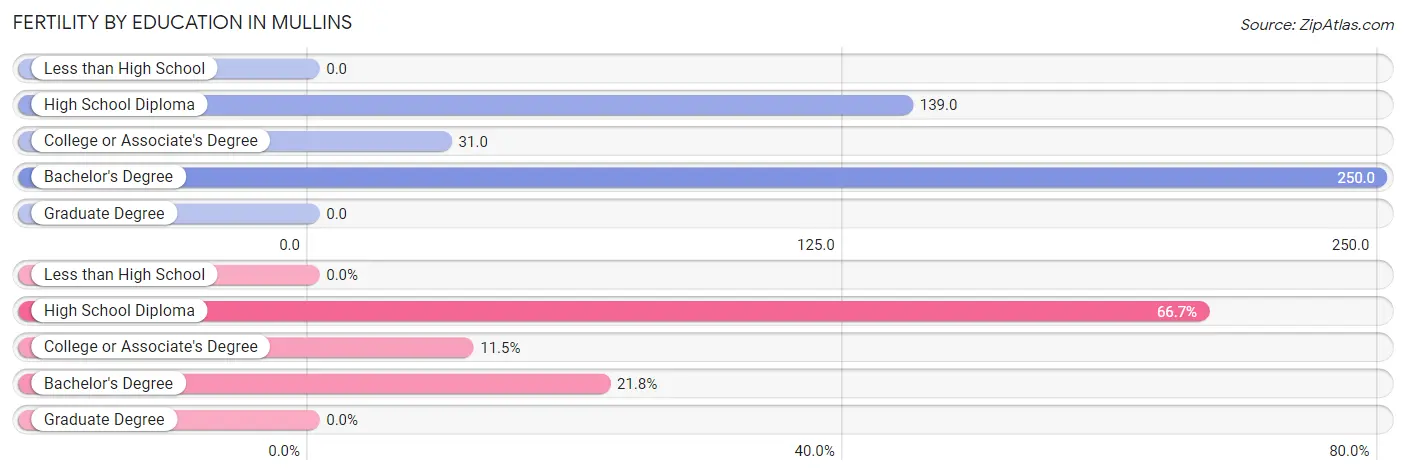
| Educational Attainment | Women with Births | Births / 1,000 Women |
| Less than High School | 0 (0.0%) | 0.0 |
| High School Diploma | 52 (66.7%) | 139.0 |
| College or Associate's Degree | 9 (11.5%) | 31.0 |
| Bachelor's Degree | 17 (21.8%) | 250.0 |
| Graduate Degree | 0 (0.0%) | 0.0 |
| Total | 78 (100.0%) | 82.0 |
Fertility by Education by Marriage Status in Mullins
78.2% of women with births in Mullins are unmarried. Women with the educational attainment of bachelor's degree are most likely to be married with 100.0% of them married at childbirth, while women with the educational attainment of high school diploma are least likely to be married with 100.0% of them unmarried at childbirth.
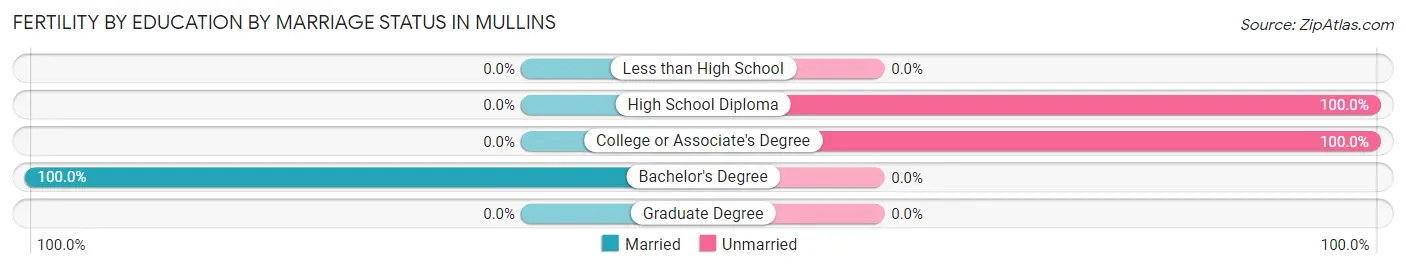
| Educational Attainment | Married | Unmarried |
| Less than High School | 0 (0.0%) | 0 (0.0%) |
| High School Diploma | 0 (0.0%) | 52 (100.0%) |
| College or Associate's Degree | 0 (0.0%) | 9 (100.0%) |
| Bachelor's Degree | 17 (100.0%) | 0 (0.0%) |
| Graduate Degree | 0 (0.0%) | 0 (0.0%) |
| Total | 17 (21.8%) | 61 (78.2%) |
Employment Characteristics in Mullins
Employment by Class of Employer in Mullins
Among the 1,476 employed individuals in Mullins, private company employees (1,186 | 80.3%), state government employees (105 | 7.1%), and federal government employees (72 | 4.9%) make up the most common classes of employment.
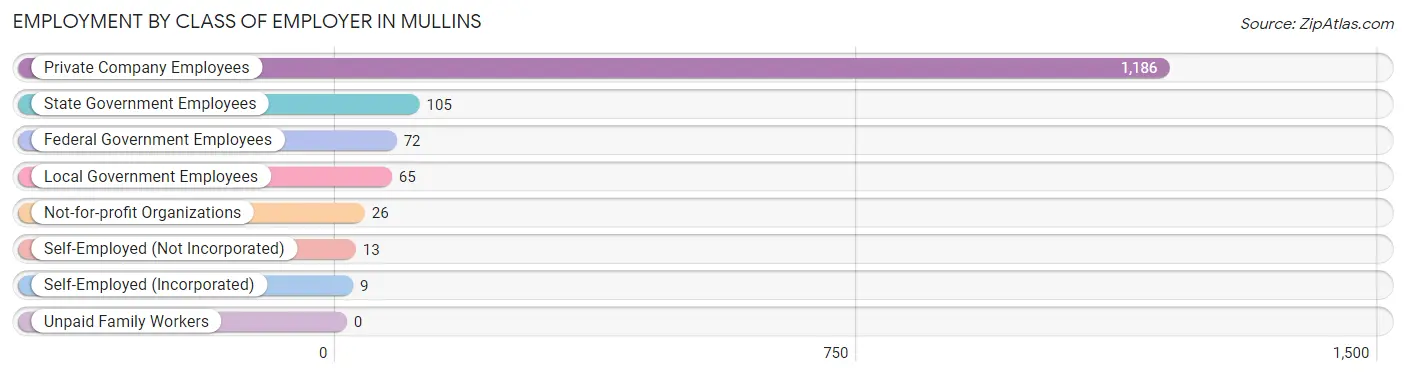
| Employer Class | # Employees | % Employees |
| Private Company Employees | 1,186 | 80.3% |
| Self-Employed (Incorporated) | 9 | 0.6% |
| Self-Employed (Not Incorporated) | 13 | 0.9% |
| Not-for-profit Organizations | 26 | 1.8% |
| Local Government Employees | 65 | 4.4% |
| State Government Employees | 105 | 7.1% |
| Federal Government Employees | 72 | 4.9% |
| Unpaid Family Workers | 0 | 0.0% |
| Total | 1,476 | 100.0% |
Employment Status by Age in Mullins
According to the labor force statistics for Mullins, out of the total population over 16 years of age (2,985), 54.6% or 1,630 individuals are in the labor force, with 9.4% or 153 of them unemployed. The age group with the highest labor force participation rate is 35 to 44 years, with 90.0% or 618 individuals in the labor force. Within the labor force, the 25 to 29 years age range has the highest percentage of unemployed individuals, with 32.7% or 36 of them being unemployed.
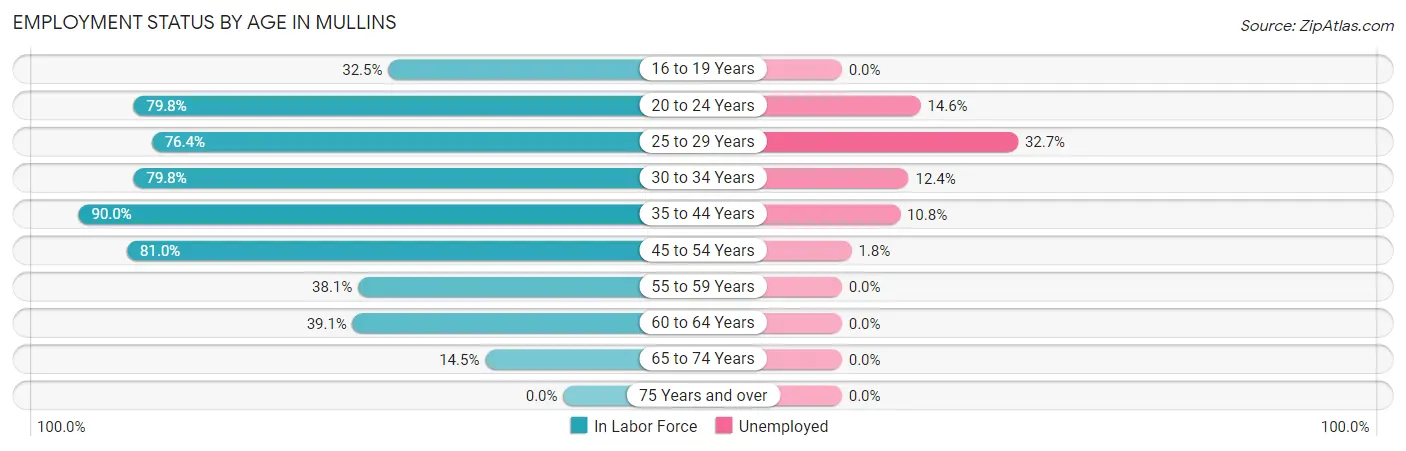
| Age Bracket | In Labor Force | Unemployed |
| 16 to 19 Years | 95 (32.5%) | 0 (0.0%) |
| 20 to 24 Years | 158 (79.8%) | 23 (14.6%) |
| 25 to 29 Years | 110 (76.4%) | 36 (32.7%) |
| 30 to 34 Years | 186 (79.8%) | 23 (12.4%) |
| 35 to 44 Years | 618 (90.0%) | 67 (10.8%) |
| 45 to 54 Years | 272 (81.0%) | 5 (1.8%) |
| 55 to 59 Years | 40 (38.1%) | 0 (0.0%) |
| 60 to 64 Years | 91 (39.1%) | 0 (0.0%) |
| 65 to 74 Years | 60 (14.5%) | 0 (0.0%) |
| 75 Years and over | 0 (0.0%) | 0 (0.0%) |
| Total | 1,630 (54.6%) | 153 (9.4%) |
Employment Status by Educational Attainment in Mullins
According to labor force statistics for Mullins, 75.8% of individuals (1,317) out of the total population between 25 and 64 years of age (1,738) are in the labor force, with 9.9% or 130 of them being unemployed. The group with the highest labor force participation rate are those with the educational attainment of high school diploma, with 83.7% or 731 individuals in the labor force. Within the labor force, individuals with high school diploma education have the highest percentage of unemployment, with 14.8% or 108 of them being unemployed.
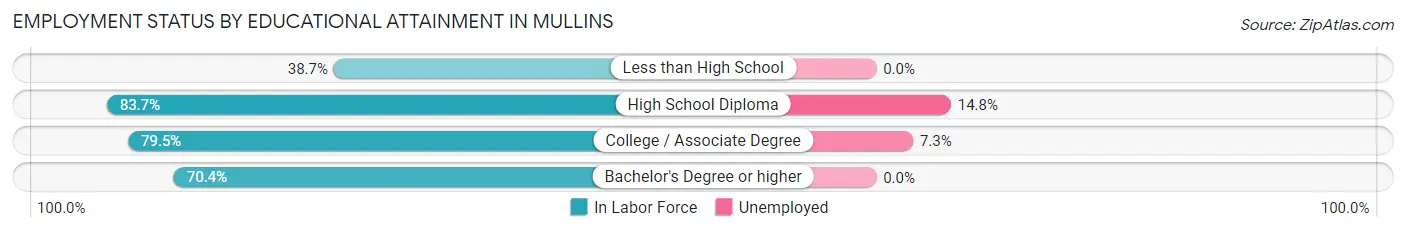
| Educational Attainment | In Labor Force | Unemployed |
| Less than High School | 72 (38.7%) | 0 (0.0%) |
| High School Diploma | 731 (83.7%) | 129 (14.8%) |
| College / Associate Degree | 314 (79.5%) | 29 (7.3%) |
| Bachelor's Degree or higher | 200 (70.4%) | 0 (0.0%) |
| Total | 1,317 (75.8%) | 172 (9.9%) |
Employment Occupations by Sex in Mullins
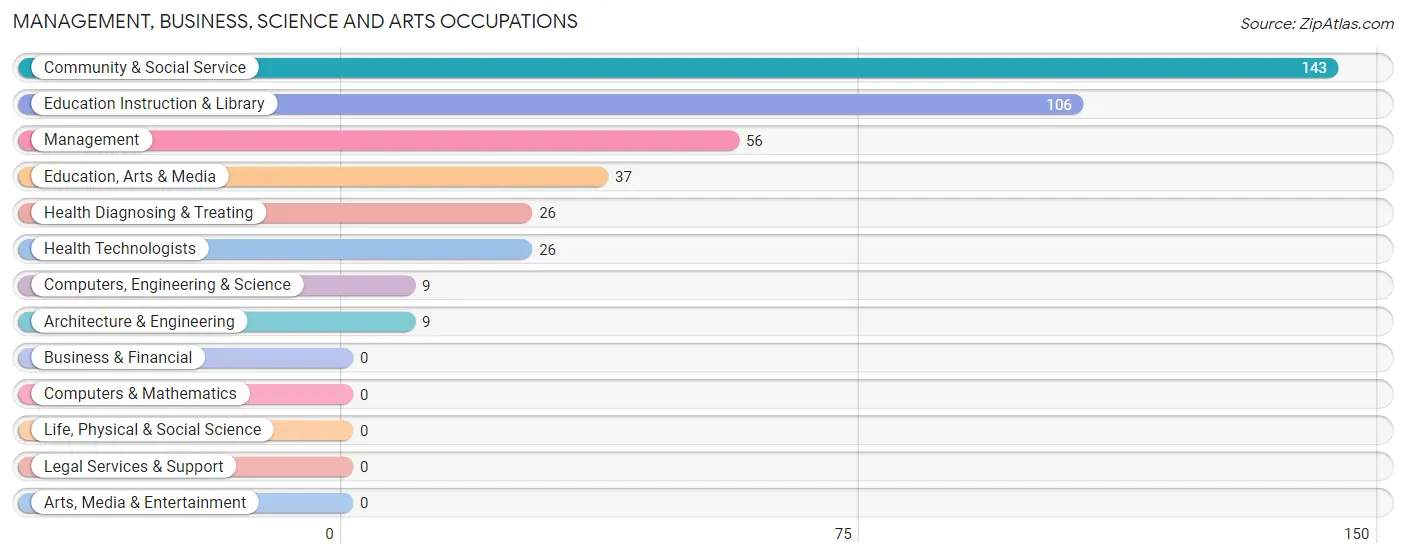
Management, Business, Science and Arts Occupations
The most common Management, Business, Science and Arts occupations in Mullins are Community & Social Service (143 | 9.7%), Education Instruction & Library (106 | 7.2%), Management (56 | 3.8%), Education, Arts & Media (37 | 2.5%), and Health Diagnosing & Treating (26 | 1.8%).
Management, Business, Science and Arts Occupations by Sex
Within the Management, Business, Science and Arts occupations in Mullins, the most male-oriented occupations are Computers, Engineering & Science (100.0%), Architecture & Engineering (100.0%), and Management (87.5%), while the most female-oriented occupations are Education, Arts & Media (100.0%), Community & Social Service (85.3%), and Education Instruction & Library (80.2%).
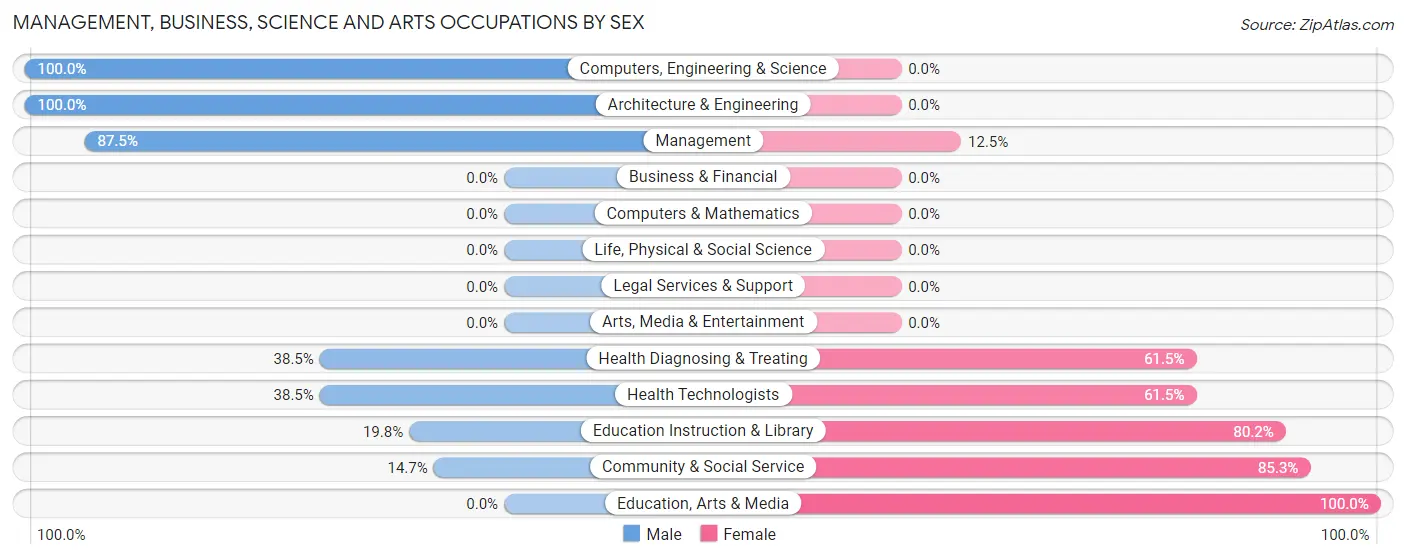
| Occupation | Male | Female |
| Management | 49 (87.5%) | 7 (12.5%) |
| Business & Financial | 0 (0.0%) | 0 (0.0%) |
| Computers, Engineering & Science | 9 (100.0%) | 0 (0.0%) |
| Computers & Mathematics | 0 (0.0%) | 0 (0.0%) |
| Architecture & Engineering | 9 (100.0%) | 0 (0.0%) |
| Life, Physical & Social Science | 0 (0.0%) | 0 (0.0%) |
| Community & Social Service | 21 (14.7%) | 122 (85.3%) |
| Education, Arts & Media | 0 (0.0%) | 37 (100.0%) |
| Legal Services & Support | 0 (0.0%) | 0 (0.0%) |
| Education Instruction & Library | 21 (19.8%) | 85 (80.2%) |
| Arts, Media & Entertainment | 0 (0.0%) | 0 (0.0%) |
| Health Diagnosing & Treating | 10 (38.5%) | 16 (61.5%) |
| Health Technologists | 10 (38.5%) | 16 (61.5%) |
| Total (Category) | 89 (38.0%) | 145 (62.0%) |
| Total (Overall) | 632 (42.8%) | 844 (57.2%) |
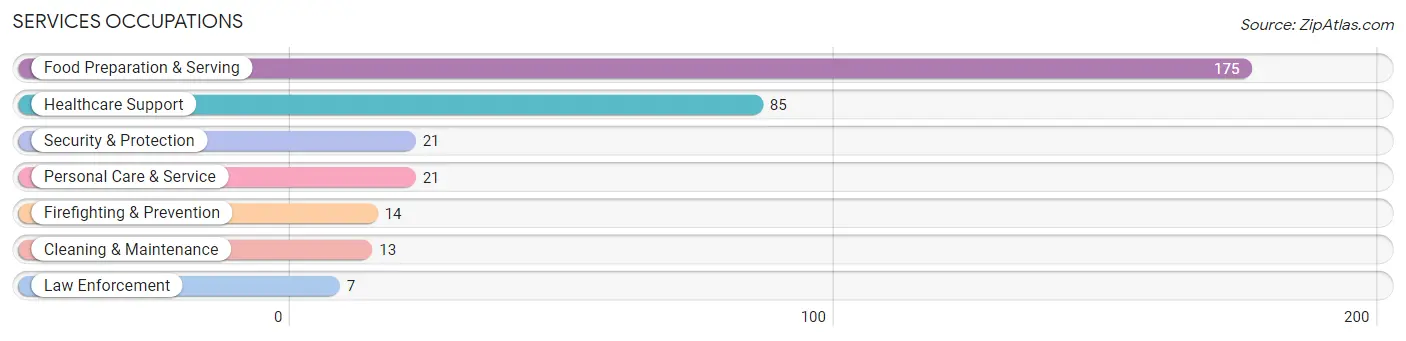
Services Occupations
The most common Services occupations in Mullins are Food Preparation & Serving (175 | 11.9%), Healthcare Support (85 | 5.8%), Security & Protection (21 | 1.4%), Personal Care & Service (21 | 1.4%), and Firefighting & Prevention (14 | 0.9%).
Services Occupations by Sex
Within the Services occupations in Mullins, the most male-oriented occupations are Law Enforcement (100.0%), Cleaning & Maintenance (100.0%), and Personal Care & Service (100.0%), while the most female-oriented occupations are Healthcare Support (100.0%), Firefighting & Prevention (100.0%), and Food Preparation & Serving (80.0%).
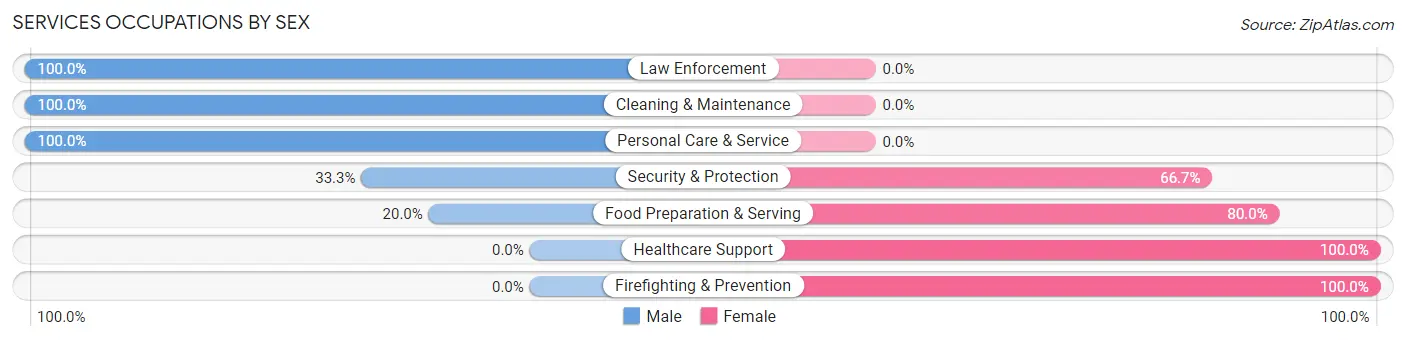
| Occupation | Male | Female |
| Healthcare Support | 0 (0.0%) | 85 (100.0%) |
| Security & Protection | 7 (33.3%) | 14 (66.7%) |
| Firefighting & Prevention | 0 (0.0%) | 14 (100.0%) |
| Law Enforcement | 7 (100.0%) | 0 (0.0%) |
| Food Preparation & Serving | 35 (20.0%) | 140 (80.0%) |
| Cleaning & Maintenance | 13 (100.0%) | 0 (0.0%) |
| Personal Care & Service | 21 (100.0%) | 0 (0.0%) |
| Total (Category) | 76 (24.1%) | 239 (75.9%) |
| Total (Overall) | 632 (42.8%) | 844 (57.2%) |
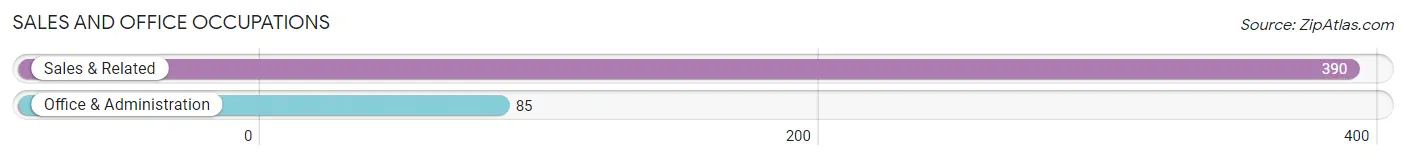
Sales and Office Occupations
The most common Sales and Office occupations in Mullins are Sales & Related (390 | 26.4%), and Office & Administration (85 | 5.8%).
Sales and Office Occupations by Sex
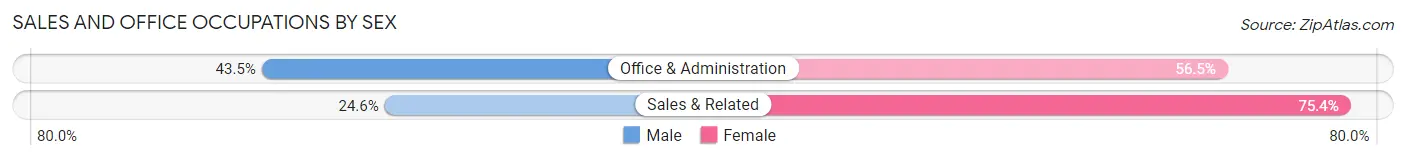
| Occupation | Male | Female |
| Sales & Related | 96 (24.6%) | 294 (75.4%) |
| Office & Administration | 37 (43.5%) | 48 (56.5%) |
| Total (Category) | 133 (28.0%) | 342 (72.0%) |
| Total (Overall) | 632 (42.8%) | 844 (57.2%) |
Natural Resources, Construction and Maintenance Occupations
The most common Natural Resources, Construction and Maintenance occupations in Mullins are Construction & Extraction (84 | 5.7%), and Farming, Fishing & Forestry (16 | 1.1%).
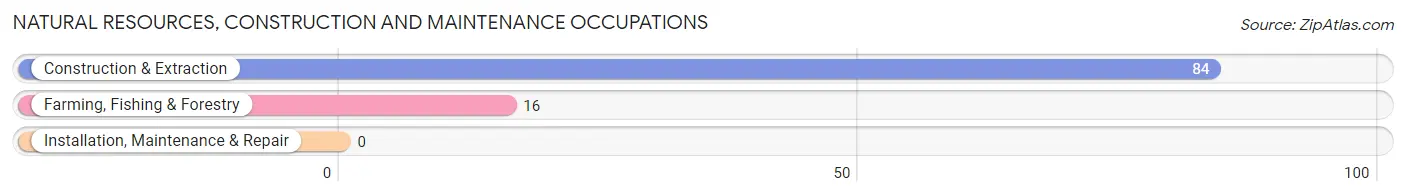
Natural Resources, Construction and Maintenance Occupations by Sex
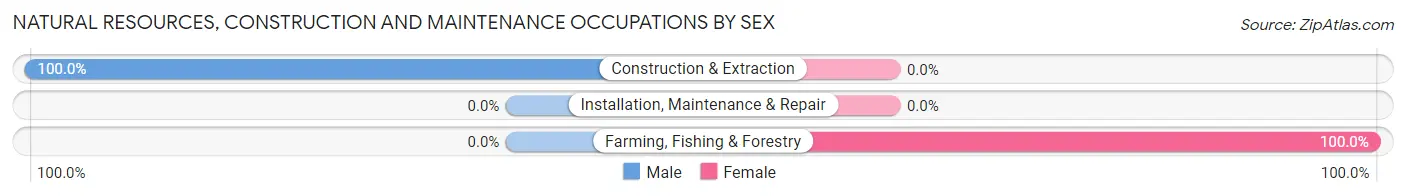
| Occupation | Male | Female |
| Farming, Fishing & Forestry | 0 (0.0%) | 16 (100.0%) |
| Construction & Extraction | 84 (100.0%) | 0 (0.0%) |
| Installation, Maintenance & Repair | 0 (0.0%) | 0 (0.0%) |
| Total (Category) | 84 (84.0%) | 16 (16.0%) |
| Total (Overall) | 632 (42.8%) | 844 (57.2%) |
Production, Transportation and Moving Occupations
The most common Production, Transportation and Moving occupations in Mullins are Material Moving (141 | 9.6%), Transportation (129 | 8.7%), and Production (82 | 5.6%).
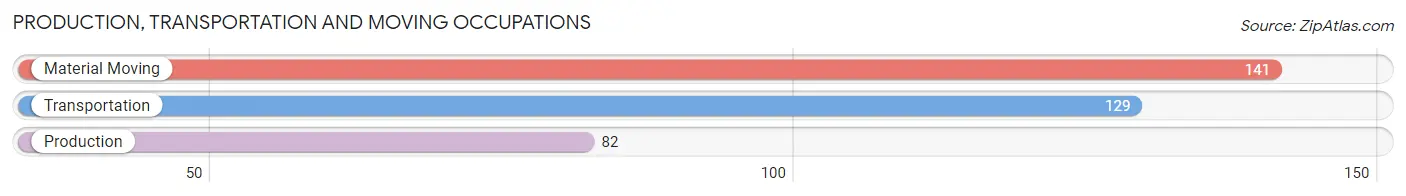
Production, Transportation and Moving Occupations by Sex
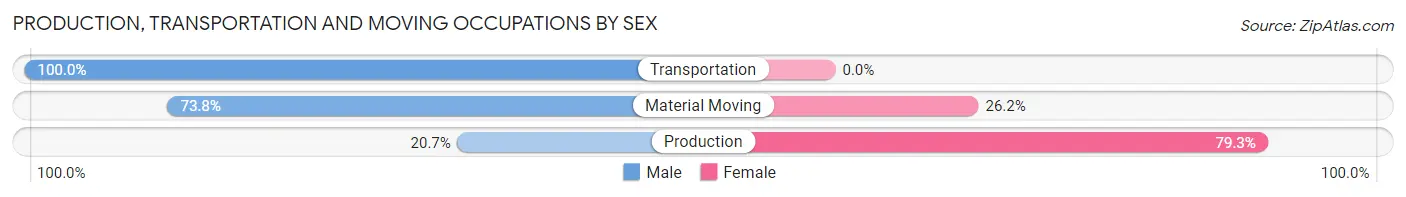
| Occupation | Male | Female |
| Production | 17 (20.7%) | 65 (79.3%) |
| Transportation | 129 (100.0%) | 0 (0.0%) |
| Material Moving | 104 (73.8%) | 37 (26.2%) |
| Total (Category) | 250 (71.0%) | 102 (29.0%) |
| Total (Overall) | 632 (42.8%) | 844 (57.2%) |
Employment Industries by Sex in Mullins
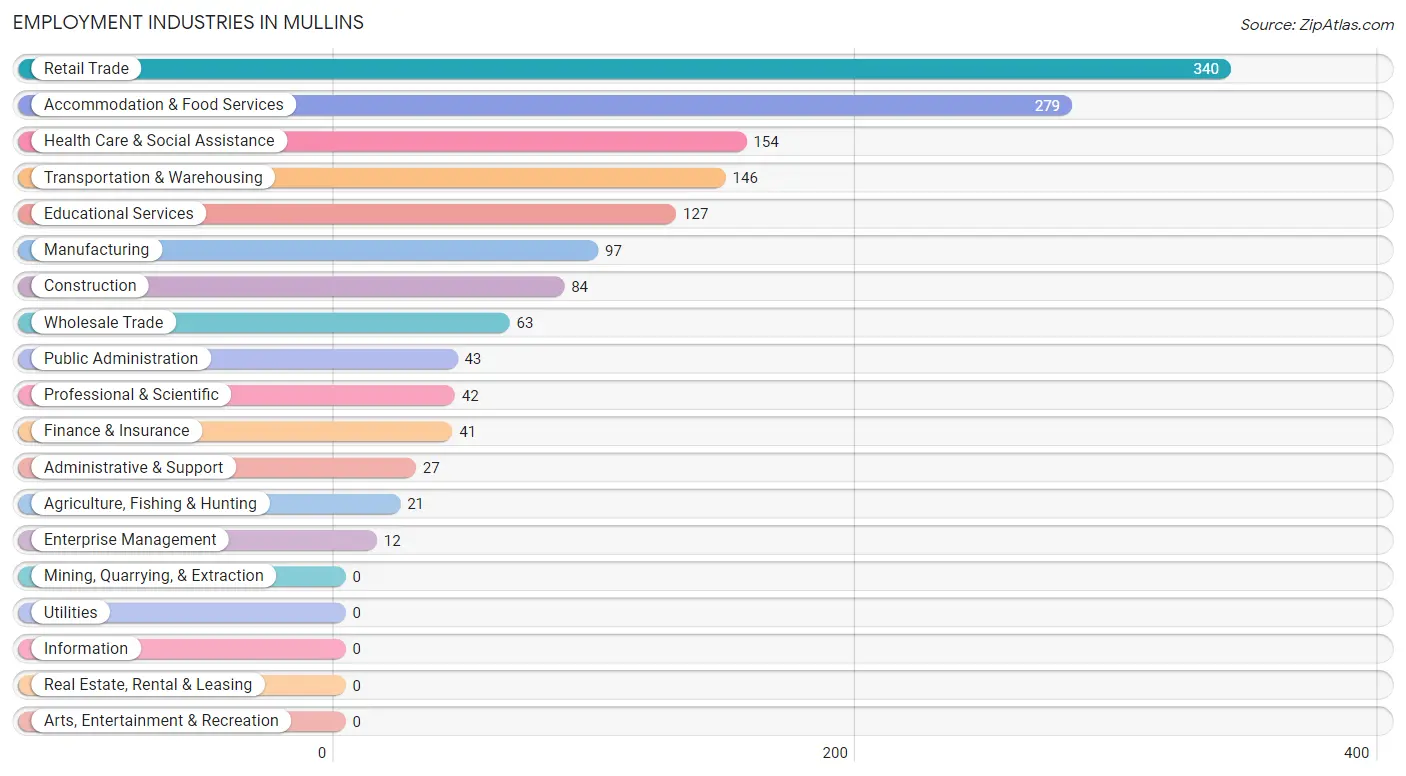
Employment Industries in Mullins
The major employment industries in Mullins include Retail Trade (340 | 23.0%), Accommodation & Food Services (279 | 18.9%), Health Care & Social Assistance (154 | 10.4%), Transportation & Warehousing (146 | 9.9%), and Educational Services (127 | 8.6%).
Employment Industries by Sex in Mullins
The Mullins industries that see more men than women are Agriculture, Fishing & Hunting (100.0%), Construction (100.0%), and Transportation & Warehousing (100.0%), whereas the industries that tend to have a higher number of women are Public Administration (83.7%), Health Care & Social Assistance (79.9%), and Retail Trade (76.8%).
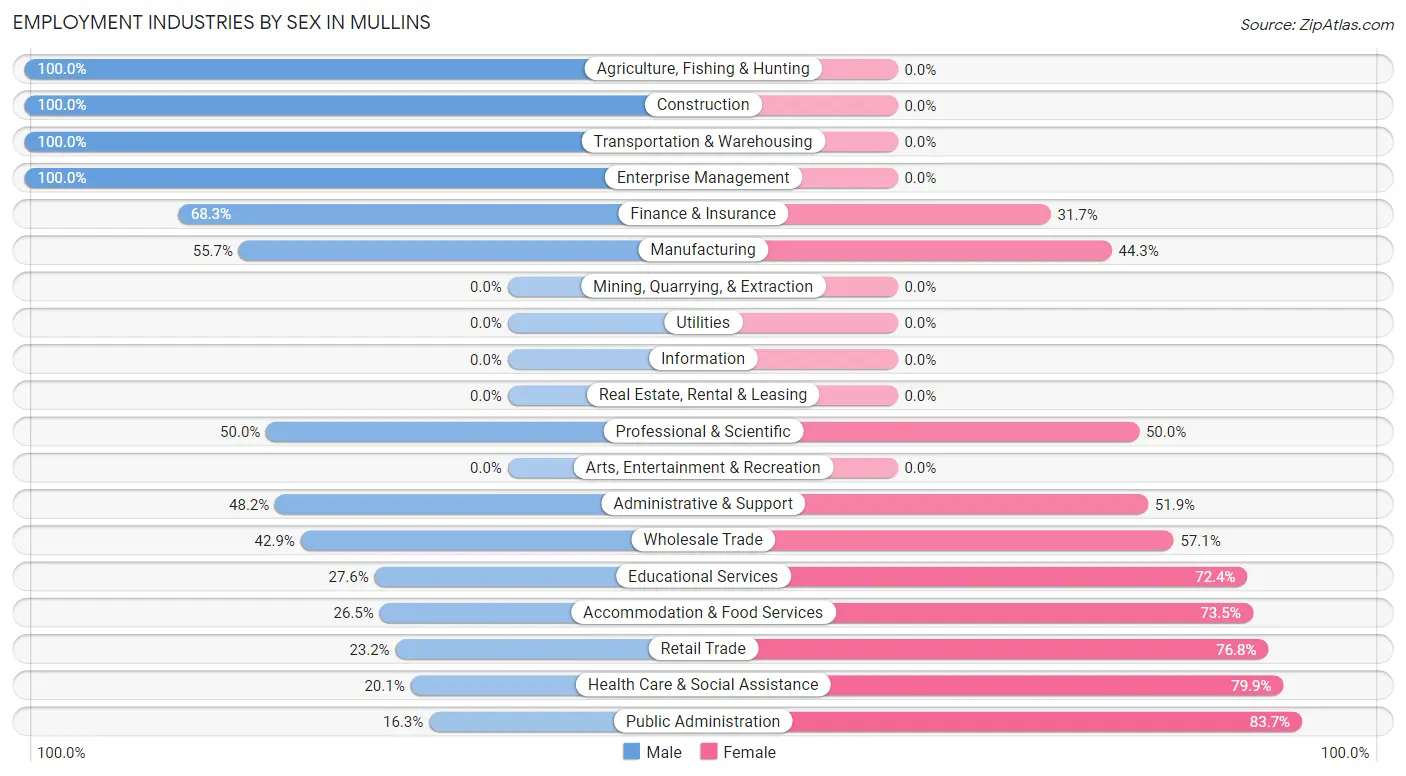
| Industry | Male | Female |
| Agriculture, Fishing & Hunting | 21 (100.0%) | 0 (0.0%) |
| Mining, Quarrying, & Extraction | 0 (0.0%) | 0 (0.0%) |
| Construction | 84 (100.0%) | 0 (0.0%) |
| Manufacturing | 54 (55.7%) | 43 (44.3%) |
| Wholesale Trade | 27 (42.9%) | 36 (57.1%) |
| Retail Trade | 79 (23.2%) | 261 (76.8%) |
| Transportation & Warehousing | 146 (100.0%) | 0 (0.0%) |
| Utilities | 0 (0.0%) | 0 (0.0%) |
| Information | 0 (0.0%) | 0 (0.0%) |
| Finance & Insurance | 28 (68.3%) | 13 (31.7%) |
| Real Estate, Rental & Leasing | 0 (0.0%) | 0 (0.0%) |
| Professional & Scientific | 21 (50.0%) | 21 (50.0%) |
| Enterprise Management | 12 (100.0%) | 0 (0.0%) |
| Administrative & Support | 13 (48.1%) | 14 (51.8%) |
| Educational Services | 35 (27.6%) | 92 (72.4%) |
| Health Care & Social Assistance | 31 (20.1%) | 123 (79.9%) |
| Arts, Entertainment & Recreation | 0 (0.0%) | 0 (0.0%) |
| Accommodation & Food Services | 74 (26.5%) | 205 (73.5%) |
| Public Administration | 7 (16.3%) | 36 (83.7%) |
| Total | 632 (42.8%) | 844 (57.2%) |
Education in Mullins
School Enrollment in Mullins
The most common levels of schooling among the 981 students in Mullins are high school (294 | 30.0%), middle school (272 | 27.7%), and elementary school (221 | 22.5%).
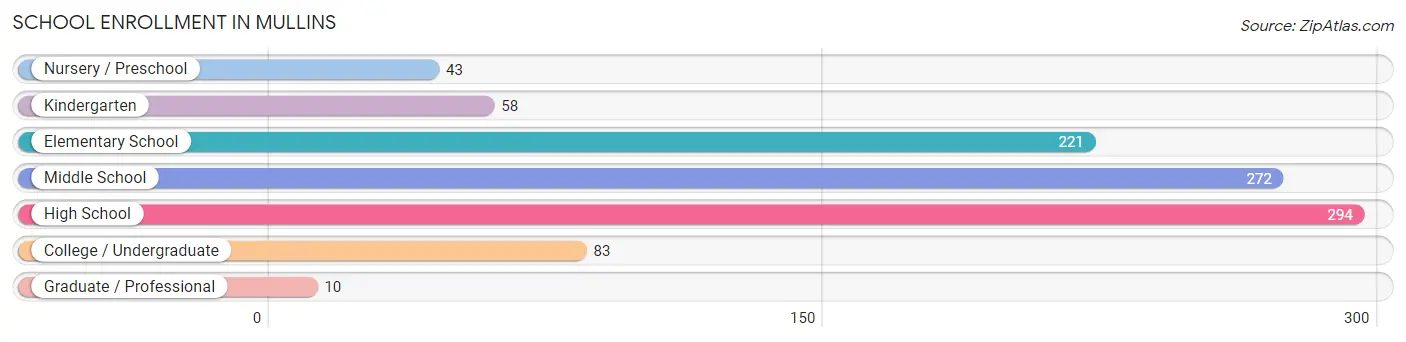
| School Level | # Students | % Students |
| Nursery / Preschool | 43 | 4.4% |
| Kindergarten | 58 | 5.9% |
| Elementary School | 221 | 22.5% |
| Middle School | 272 | 27.7% |
| High School | 294 | 30.0% |
| College / Undergraduate | 83 | 8.5% |
| Graduate / Professional | 10 | 1.0% |
| Total | 981 | 100.0% |
School Enrollment by Age by Funding Source in Mullins
Out of a total of 981 students who are enrolled in schools in Mullins, 138 (14.1%) attend a private institution, while the remaining 843 (85.9%) are enrolled in public schools. The age group of 15 to 17 year olds has the highest likelihood of being enrolled in private schools, with 46 (19.1% in the age bracket) enrolled. Conversely, the age group of 18 to 19 year olds has the lowest likelihood of being enrolled in a private school, with 55 (100.0% in the age bracket) attending a public institution.
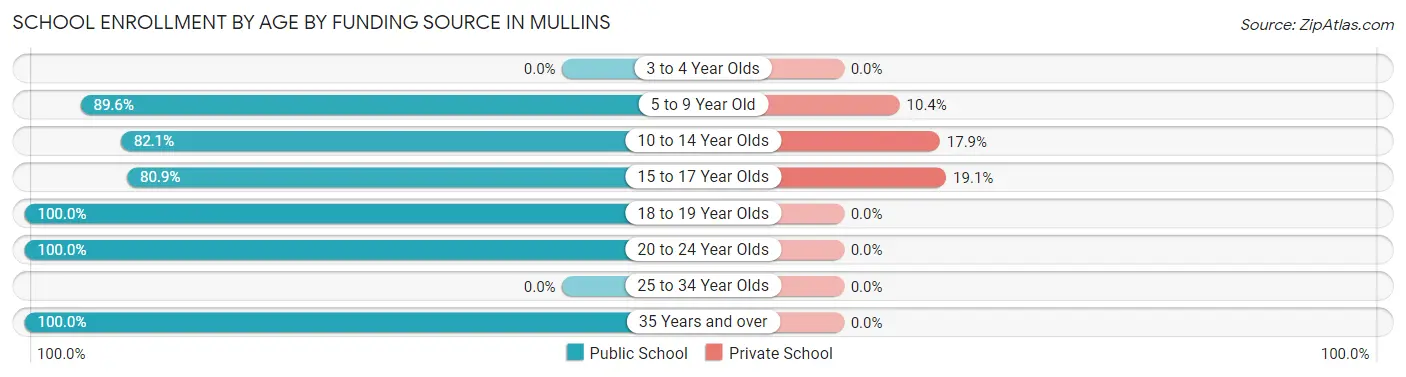
| Age Bracket | Public School | Private School |
| 3 to 4 Year Olds | 0 (0.0%) | 0 (0.0%) |
| 5 to 9 Year Old | 258 (89.6%) | 30 (10.4%) |
| 10 to 14 Year Olds | 284 (82.1%) | 62 (17.9%) |
| 15 to 17 Year Olds | 195 (80.9%) | 46 (19.1%) |
| 18 to 19 Year Olds | 55 (100.0%) | 0 (0.0%) |
| 20 to 24 Year Olds | 24 (100.0%) | 0 (0.0%) |
| 25 to 34 Year Olds | 0 (0.0%) | 0 (0.0%) |
| 35 Years and over | 27 (100.0%) | 0 (0.0%) |
| Total | 843 (85.9%) | 138 (14.1%) |
Educational Attainment by Field of Study in Mullins
Education (155 | 33.1%), business (64 | 13.7%), computers & mathematics (50 | 10.7%), science & technology (43 | 9.2%), and bio, nature & agricultural (36 | 7.7%) are the most common fields of study among 468 individuals in Mullins who have obtained a bachelor's degree or higher.
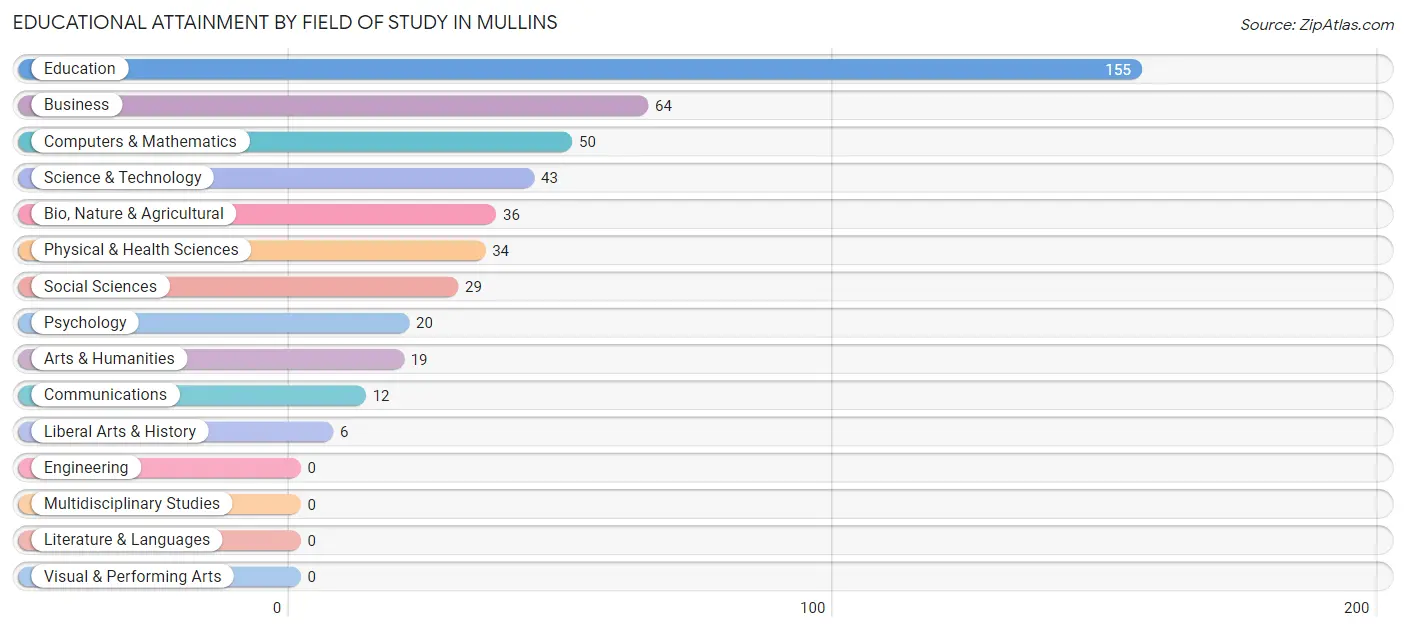
| Field of Study | # Graduates | % Graduates |
| Computers & Mathematics | 50 | 10.7% |
| Bio, Nature & Agricultural | 36 | 7.7% |
| Physical & Health Sciences | 34 | 7.3% |
| Psychology | 20 | 4.3% |
| Social Sciences | 29 | 6.2% |
| Engineering | 0 | 0.0% |
| Multidisciplinary Studies | 0 | 0.0% |
| Science & Technology | 43 | 9.2% |
| Business | 64 | 13.7% |
| Education | 155 | 33.1% |
| Literature & Languages | 0 | 0.0% |
| Liberal Arts & History | 6 | 1.3% |
| Visual & Performing Arts | 0 | 0.0% |
| Communications | 12 | 2.6% |
| Arts & Humanities | 19 | 4.1% |
| Total | 468 | 100.0% |
Transportation & Commute in Mullins
Vehicle Availability by Sex in Mullins
The most prevalent vehicle ownership categories in Mullins are males with 2 vehicles (289, accounting for 45.7%) and females with 2 vehicles (289, making up 34.2%).
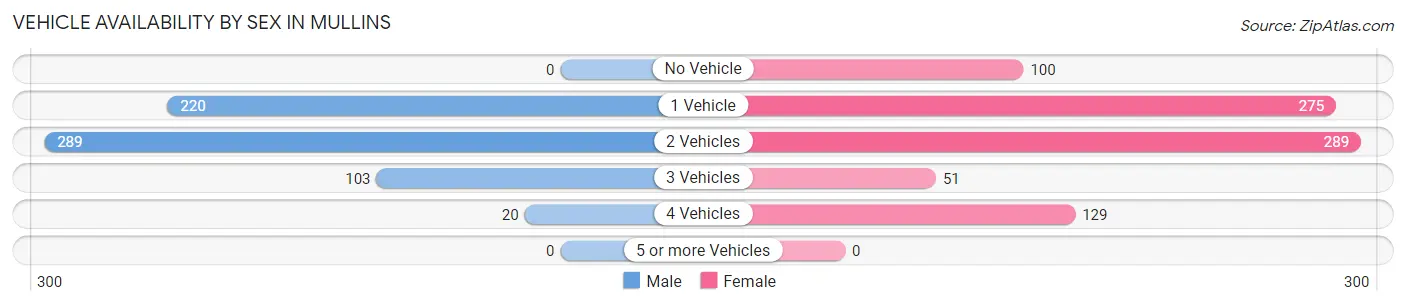
| Vehicles Available | Male | Female |
| No Vehicle | 0 (0.0%) | 100 (11.8%) |
| 1 Vehicle | 220 (34.8%) | 275 (32.6%) |
| 2 Vehicles | 289 (45.7%) | 289 (34.2%) |
| 3 Vehicles | 103 (16.3%) | 51 (6.0%) |
| 4 Vehicles | 20 (3.2%) | 129 (15.3%) |
| 5 or more Vehicles | 0 (0.0%) | 0 (0.0%) |
| Total | 632 (100.0%) | 844 (100.0%) |
Commute Time in Mullins
The most frequently occuring commute durations in Mullins are 90 or more minutes (288 commuters, 20.3%), 10 to 14 minutes (231 commuters, 16.3%), and 45 to 59 minutes (179 commuters, 12.6%).
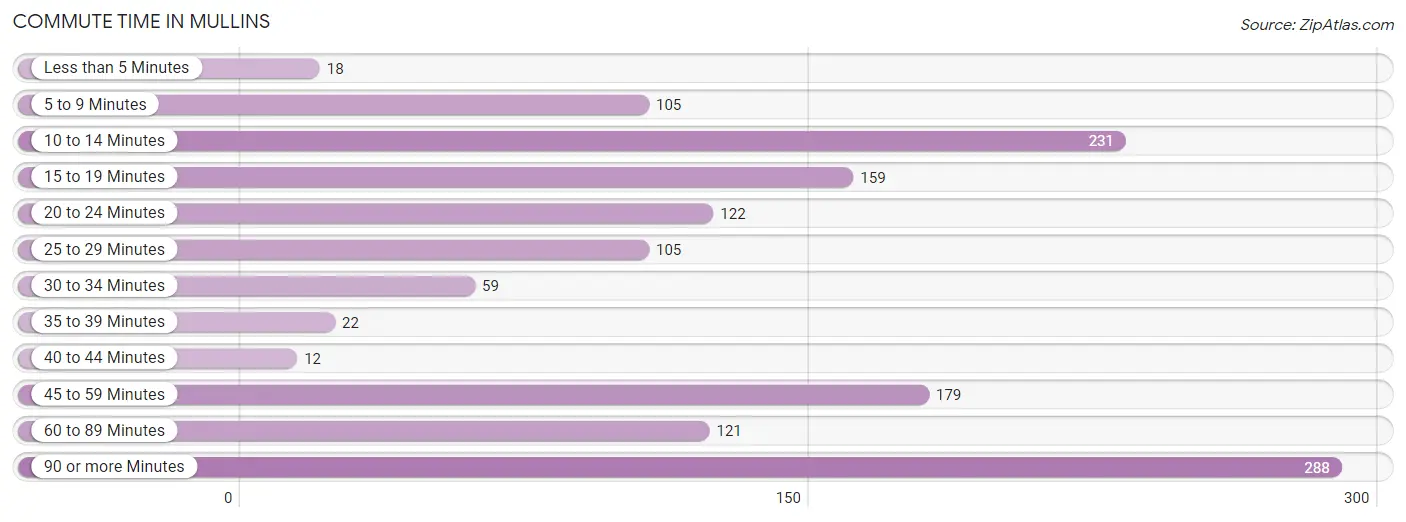
| Commute Time | # Commuters | % Commuters |
| Less than 5 Minutes | 18 | 1.3% |
| 5 to 9 Minutes | 105 | 7.4% |
| 10 to 14 Minutes | 231 | 16.3% |
| 15 to 19 Minutes | 159 | 11.2% |
| 20 to 24 Minutes | 122 | 8.6% |
| 25 to 29 Minutes | 105 | 7.4% |
| 30 to 34 Minutes | 59 | 4.2% |
| 35 to 39 Minutes | 22 | 1.5% |
| 40 to 44 Minutes | 12 | 0.8% |
| 45 to 59 Minutes | 179 | 12.6% |
| 60 to 89 Minutes | 121 | 8.5% |
| 90 or more Minutes | 288 | 20.3% |
Commute Time by Sex in Mullins
The most common commute times in Mullins are 90 or more minutes (177 commuters, 29.6%) for males and 10 to 14 minutes (138 commuters, 16.8%) for females.
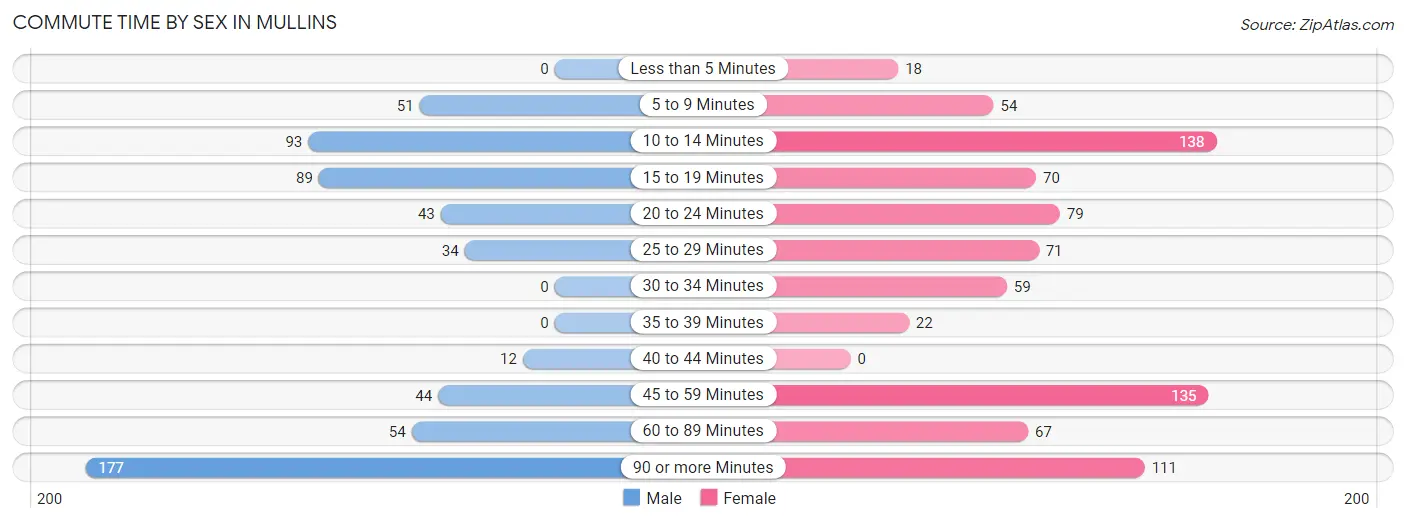
| Commute Time | Male | Female |
| Less than 5 Minutes | 0 (0.0%) | 18 (2.2%) |
| 5 to 9 Minutes | 51 (8.5%) | 54 (6.6%) |
| 10 to 14 Minutes | 93 (15.6%) | 138 (16.8%) |
| 15 to 19 Minutes | 89 (14.9%) | 70 (8.5%) |
| 20 to 24 Minutes | 43 (7.2%) | 79 (9.6%) |
| 25 to 29 Minutes | 34 (5.7%) | 71 (8.6%) |
| 30 to 34 Minutes | 0 (0.0%) | 59 (7.2%) |
| 35 to 39 Minutes | 0 (0.0%) | 22 (2.7%) |
| 40 to 44 Minutes | 12 (2.0%) | 0 (0.0%) |
| 45 to 59 Minutes | 44 (7.4%) | 135 (16.4%) |
| 60 to 89 Minutes | 54 (9.0%) | 67 (8.1%) |
| 90 or more Minutes | 177 (29.6%) | 111 (13.5%) |
Time of Departure to Work by Sex in Mullins
The most frequent times of departure to work in Mullins are 12:00 AM to 4:59 AM (126, 21.1%) for males and 12:00 PM to 3:59 PM (244, 29.6%) for females.
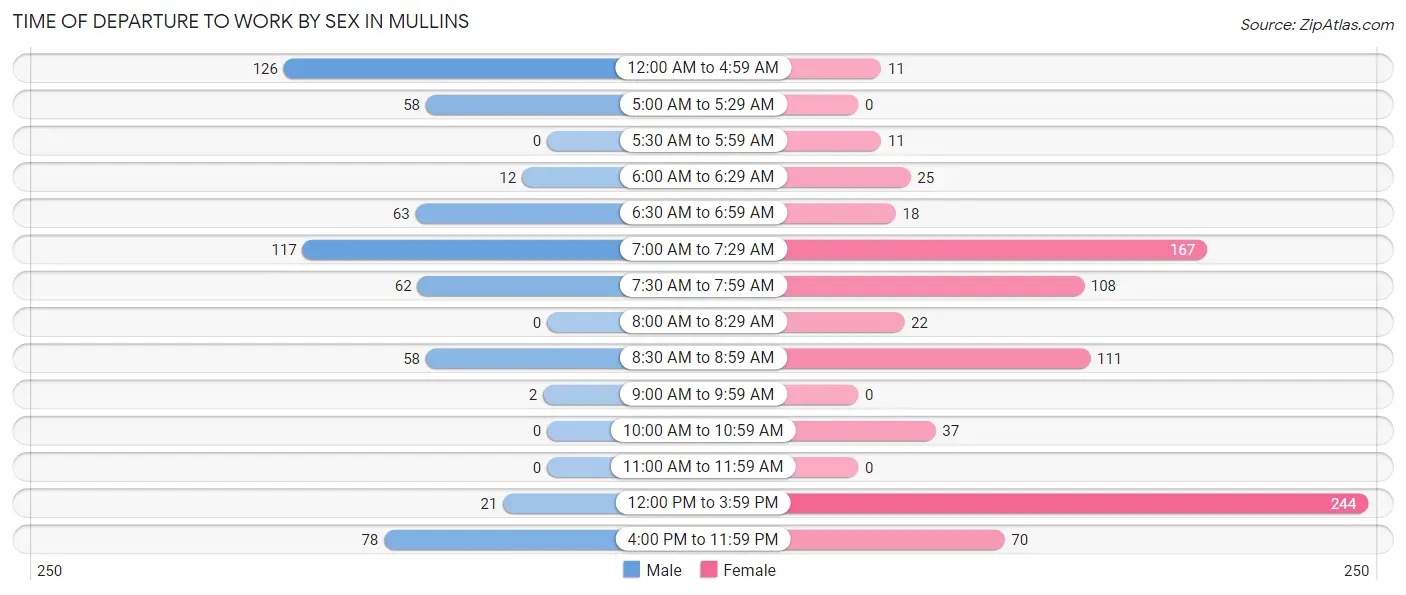
| Time of Departure | Male | Female |
| 12:00 AM to 4:59 AM | 126 (21.1%) | 11 (1.3%) |
| 5:00 AM to 5:29 AM | 58 (9.7%) | 0 (0.0%) |
| 5:30 AM to 5:59 AM | 0 (0.0%) | 11 (1.3%) |
| 6:00 AM to 6:29 AM | 12 (2.0%) | 25 (3.0%) |
| 6:30 AM to 6:59 AM | 63 (10.5%) | 18 (2.2%) |
| 7:00 AM to 7:29 AM | 117 (19.6%) | 167 (20.3%) |
| 7:30 AM to 7:59 AM | 62 (10.4%) | 108 (13.1%) |
| 8:00 AM to 8:29 AM | 0 (0.0%) | 22 (2.7%) |
| 8:30 AM to 8:59 AM | 58 (9.7%) | 111 (13.5%) |
| 9:00 AM to 9:59 AM | 2 (0.3%) | 0 (0.0%) |
| 10:00 AM to 10:59 AM | 0 (0.0%) | 37 (4.5%) |
| 11:00 AM to 11:59 AM | 0 (0.0%) | 0 (0.0%) |
| 12:00 PM to 3:59 PM | 21 (3.5%) | 244 (29.6%) |
| 4:00 PM to 11:59 PM | 78 (13.1%) | 70 (8.5%) |
| Total | 597 (100.0%) | 824 (100.0%) |
Housing Occupancy in Mullins
Occupancy by Ownership in Mullins
Of the total 1,398 dwellings in Mullins, owner-occupied units account for 572 (40.9%), while renter-occupied units make up 826 (59.1%).
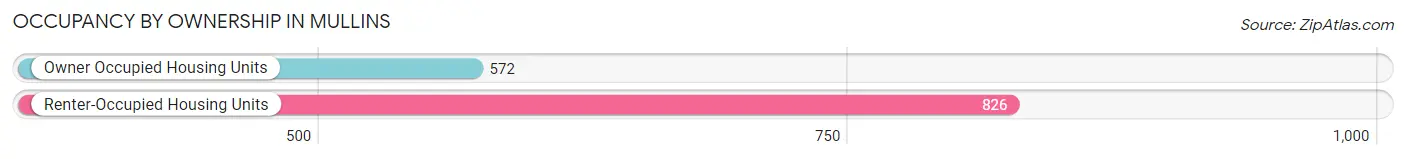
| Occupancy | # Housing Units | % Housing Units |
| Owner Occupied Housing Units | 572 | 40.9% |
| Renter-Occupied Housing Units | 826 | 59.1% |
| Total Occupied Housing Units | 1,398 | 100.0% |
Occupancy by Household Size in Mullins
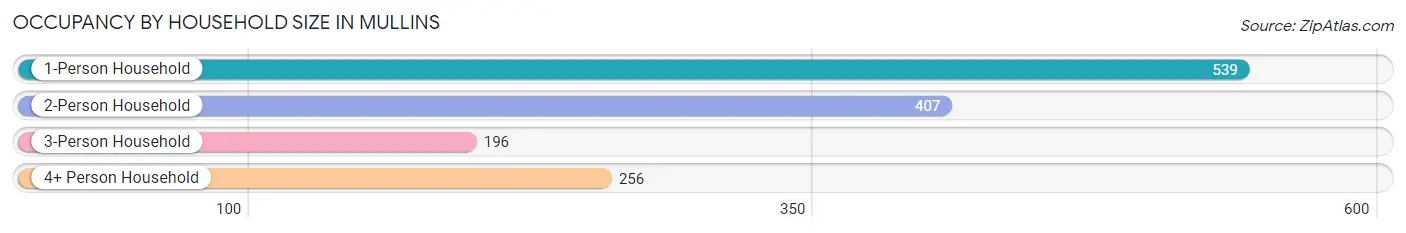
| Household Size | # Housing Units | % Housing Units |
| 1-Person Household | 539 | 38.6% |
| 2-Person Household | 407 | 29.1% |
| 3-Person Household | 196 | 14.0% |
| 4+ Person Household | 256 | 18.3% |
| Total Housing Units | 1,398 | 100.0% |
Occupancy by Ownership by Household Size in Mullins
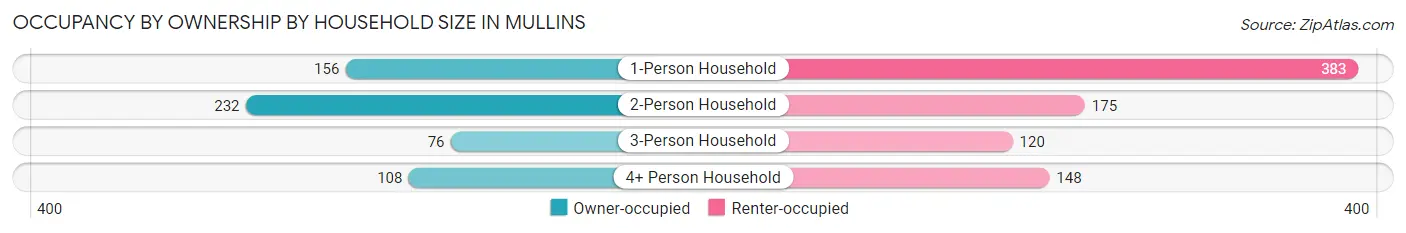
| Household Size | Owner-occupied | Renter-occupied |
| 1-Person Household | 156 (28.9%) | 383 (71.1%) |
| 2-Person Household | 232 (57.0%) | 175 (43.0%) |
| 3-Person Household | 76 (38.8%) | 120 (61.2%) |
| 4+ Person Household | 108 (42.2%) | 148 (57.8%) |
| Total Housing Units | 572 (40.9%) | 826 (59.1%) |
Occupancy by Educational Attainment in Mullins
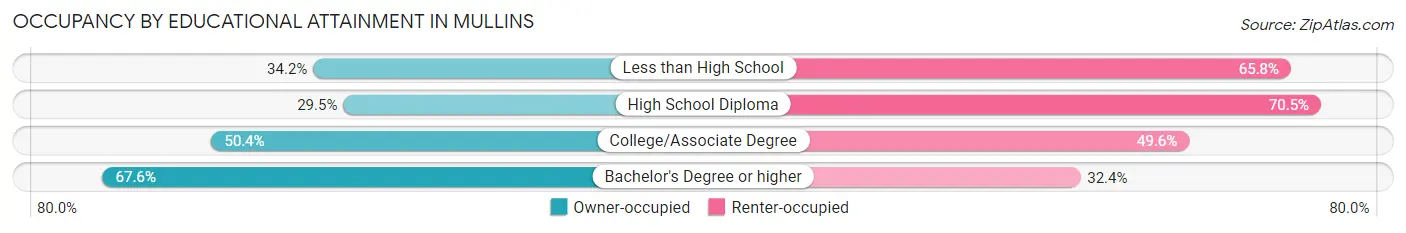
| Household Size | Owner-occupied | Renter-occupied |
| Less than High School | 76 (34.2%) | 146 (65.8%) |
| High School Diploma | 195 (29.5%) | 467 (70.5%) |
| College/Associate Degree | 136 (50.4%) | 134 (49.6%) |
| Bachelor's Degree or higher | 165 (67.6%) | 79 (32.4%) |
Occupancy by Age of Householder in Mullins
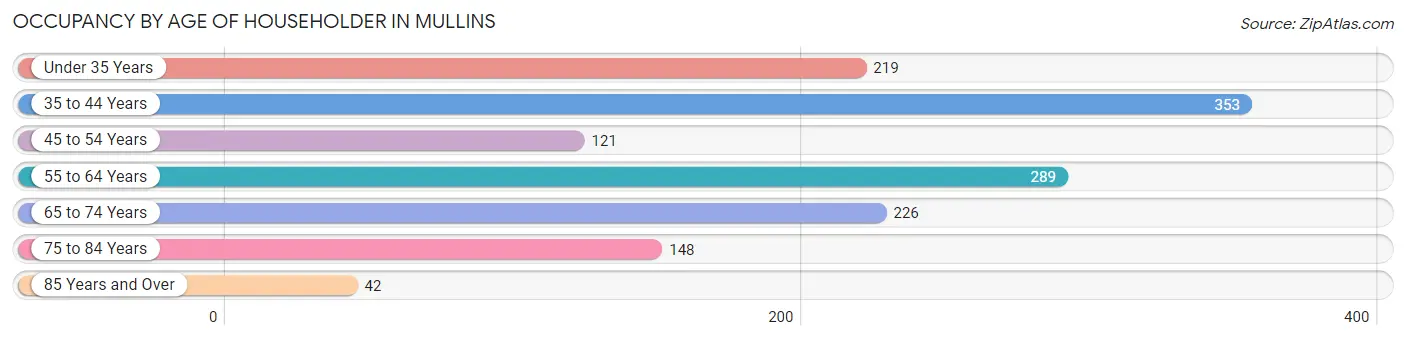
| Age Bracket | # Households | % Households |
| Under 35 Years | 219 | 15.7% |
| 35 to 44 Years | 353 | 25.3% |
| 45 to 54 Years | 121 | 8.7% |
| 55 to 64 Years | 289 | 20.7% |
| 65 to 74 Years | 226 | 16.2% |
| 75 to 84 Years | 148 | 10.6% |
| 85 Years and Over | 42 | 3.0% |
| Total | 1,398 | 100.0% |
Housing Finances in Mullins
Median Income by Occupancy in Mullins
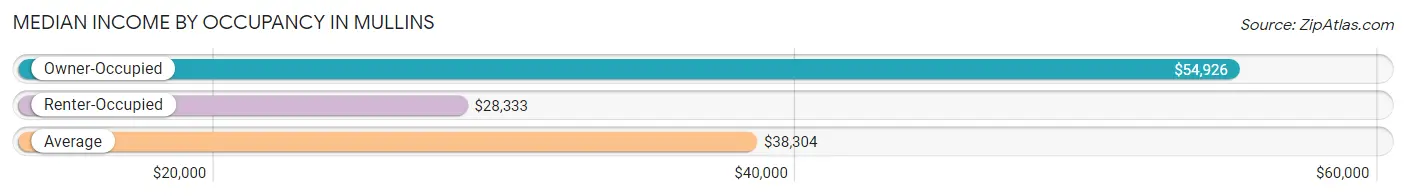
| Occupancy Type | # Households | Median Income |
| Owner-Occupied | 572 (40.9%) | $54,926 |
| Renter-Occupied | 826 (59.1%) | $28,333 |
| Average | 1,398 (100.0%) | $38,304 |
Occupancy by Householder Income Bracket in Mullins
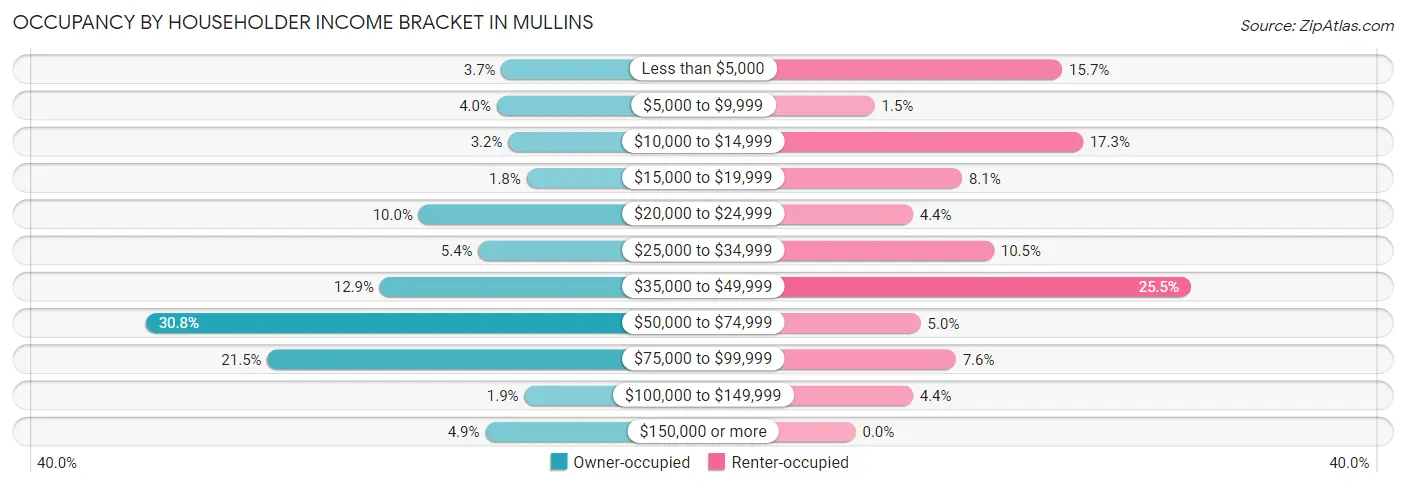
| Income Bracket | Owner-occupied | Renter-occupied |
| Less than $5,000 | 21 (3.7%) | 130 (15.7%) |
| $5,000 to $9,999 | 23 (4.0%) | 12 (1.5%) |
| $10,000 to $14,999 | 18 (3.2%) | 143 (17.3%) |
| $15,000 to $19,999 | 10 (1.8%) | 67 (8.1%) |
| $20,000 to $24,999 | 57 (10.0%) | 36 (4.4%) |
| $25,000 to $34,999 | 31 (5.4%) | 87 (10.5%) |
| $35,000 to $49,999 | 74 (12.9%) | 211 (25.5%) |
| $50,000 to $74,999 | 176 (30.8%) | 41 (5.0%) |
| $75,000 to $99,999 | 123 (21.5%) | 63 (7.6%) |
| $100,000 to $149,999 | 11 (1.9%) | 36 (4.4%) |
| $150,000 or more | 28 (4.9%) | 0 (0.0%) |
| Total | 572 (100.0%) | 826 (100.0%) |
Monthly Housing Cost Tiers in Mullins
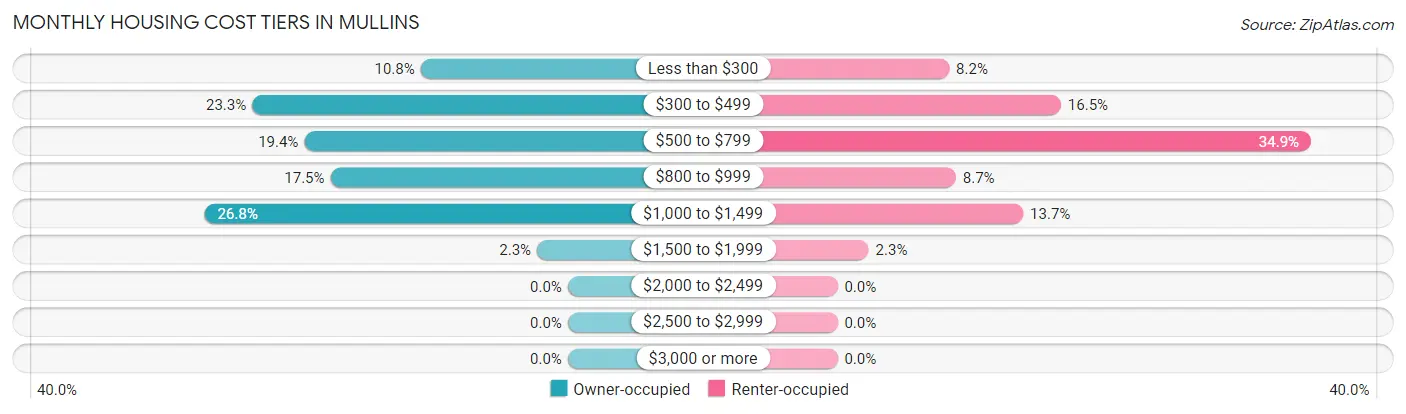
| Monthly Cost | Owner-occupied | Renter-occupied |
| Less than $300 | 62 (10.8%) | 68 (8.2%) |
| $300 to $499 | 133 (23.3%) | 136 (16.5%) |
| $500 to $799 | 111 (19.4%) | 288 (34.9%) |
| $800 to $999 | 100 (17.5%) | 72 (8.7%) |
| $1,000 to $1,499 | 153 (26.8%) | 113 (13.7%) |
| $1,500 to $1,999 | 13 (2.3%) | 19 (2.3%) |
| $2,000 to $2,499 | 0 (0.0%) | 0 (0.0%) |
| $2,500 to $2,999 | 0 (0.0%) | 0 (0.0%) |
| $3,000 or more | 0 (0.0%) | 0 (0.0%) |
| Total | 572 (100.0%) | 826 (100.0%) |
Physical Housing Characteristics in Mullins
Housing Structures in Mullins
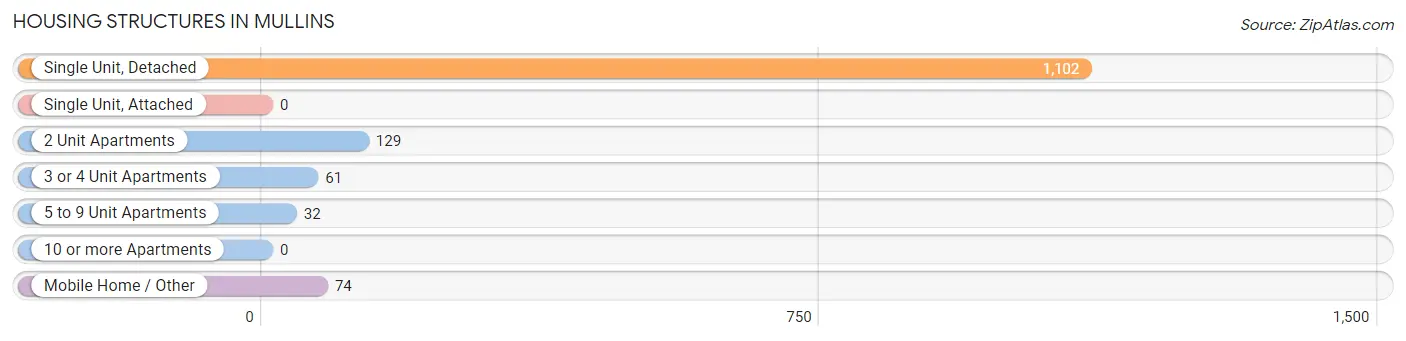
| Structure Type | # Housing Units | % Housing Units |
| Single Unit, Detached | 1,102 | 78.8% |
| Single Unit, Attached | 0 | 0.0% |
| 2 Unit Apartments | 129 | 9.2% |
| 3 or 4 Unit Apartments | 61 | 4.4% |
| 5 to 9 Unit Apartments | 32 | 2.3% |
| 10 or more Apartments | 0 | 0.0% |
| Mobile Home / Other | 74 | 5.3% |
| Total | 1,398 | 100.0% |
Housing Structures by Occupancy in Mullins
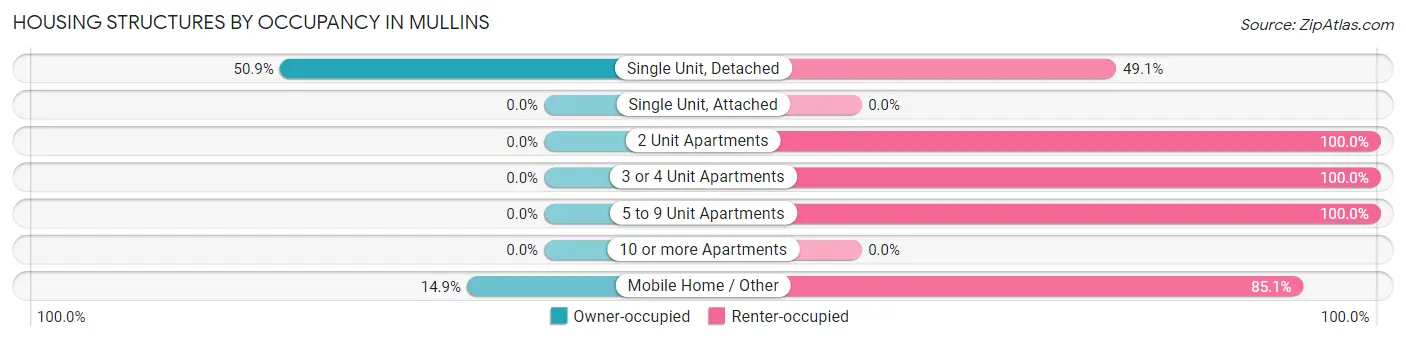
| Structure Type | Owner-occupied | Renter-occupied |
| Single Unit, Detached | 561 (50.9%) | 541 (49.1%) |
| Single Unit, Attached | 0 (0.0%) | 0 (0.0%) |
| 2 Unit Apartments | 0 (0.0%) | 129 (100.0%) |
| 3 or 4 Unit Apartments | 0 (0.0%) | 61 (100.0%) |
| 5 to 9 Unit Apartments | 0 (0.0%) | 32 (100.0%) |
| 10 or more Apartments | 0 (0.0%) | 0 (0.0%) |
| Mobile Home / Other | 11 (14.9%) | 63 (85.1%) |
| Total | 572 (40.9%) | 826 (59.1%) |
Housing Structures by Number of Rooms in Mullins
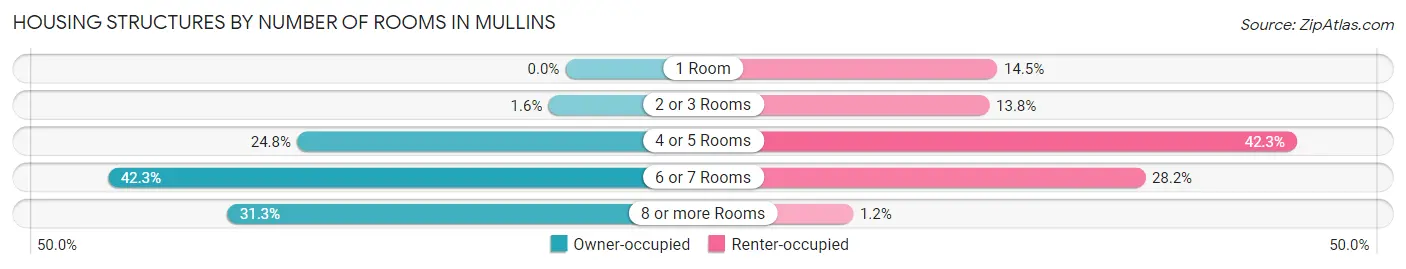
| Number of Rooms | Owner-occupied | Renter-occupied |
| 1 Room | 0 (0.0%) | 120 (14.5%) |
| 2 or 3 Rooms | 9 (1.6%) | 114 (13.8%) |
| 4 or 5 Rooms | 142 (24.8%) | 349 (42.2%) |
| 6 or 7 Rooms | 242 (42.3%) | 233 (28.2%) |
| 8 or more Rooms | 179 (31.3%) | 10 (1.2%) |
| Total | 572 (100.0%) | 826 (100.0%) |
Housing Structure by Heating Type in Mullins
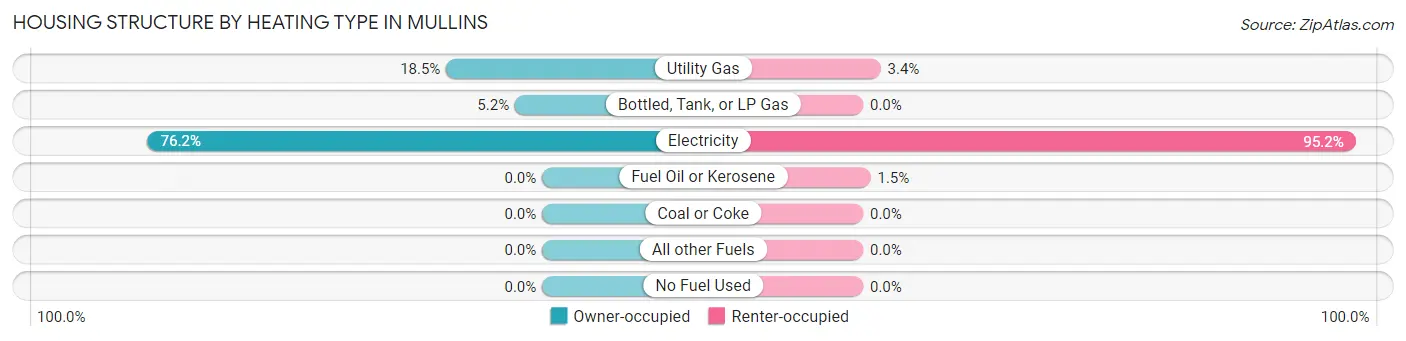
| Heating Type | Owner-occupied | Renter-occupied |
| Utility Gas | 106 (18.5%) | 28 (3.4%) |
| Bottled, Tank, or LP Gas | 30 (5.2%) | 0 (0.0%) |
| Electricity | 436 (76.2%) | 786 (95.2%) |
| Fuel Oil or Kerosene | 0 (0.0%) | 12 (1.5%) |
| Coal or Coke | 0 (0.0%) | 0 (0.0%) |
| All other Fuels | 0 (0.0%) | 0 (0.0%) |
| No Fuel Used | 0 (0.0%) | 0 (0.0%) |
| Total | 572 (100.0%) | 826 (100.0%) |
Household Vehicle Usage in Mullins
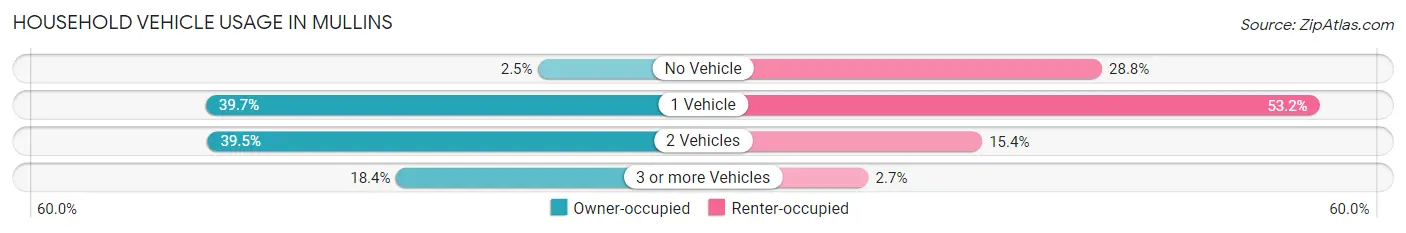
| Vehicles per Household | Owner-occupied | Renter-occupied |
| No Vehicle | 14 (2.5%) | 238 (28.8%) |
| 1 Vehicle | 227 (39.7%) | 439 (53.1%) |
| 2 Vehicles | 226 (39.5%) | 127 (15.4%) |
| 3 or more Vehicles | 105 (18.4%) | 22 (2.7%) |
| Total | 572 (100.0%) | 826 (100.0%) |
Real Estate & Mortgages in Mullins
Real Estate and Mortgage Overview in Mullins
| Characteristic | Without Mortgage | With Mortgage |
| Housing Units | 296 | 276 |
| Median Property Value | $100,000 | $87,100 |
| Median Household Income | $49,231 | $13 |
| Monthly Housing Costs | $383 | $0 |
| Real Estate Taxes | $581 | $0 |
Property Value by Mortgage Status in Mullins
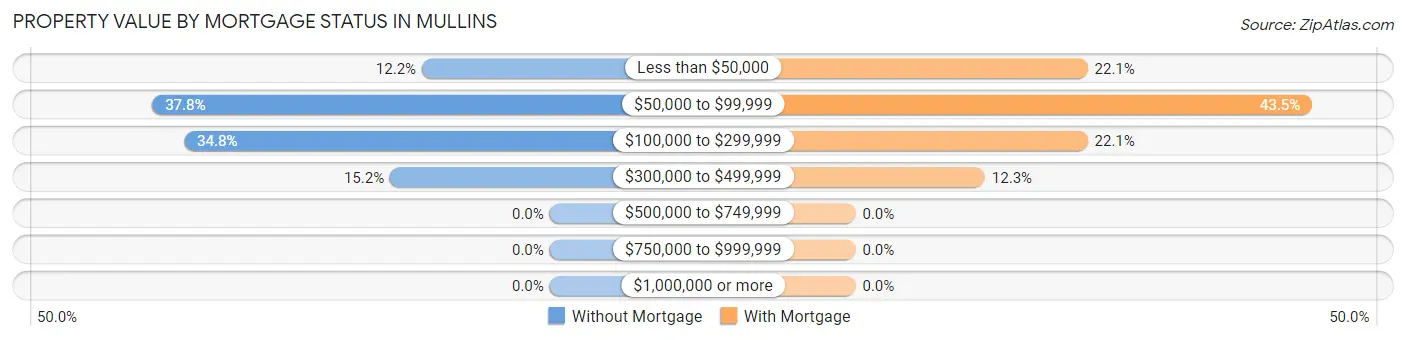
| Property Value | Without Mortgage | With Mortgage |
| Less than $50,000 | 36 (12.2%) | 61 (22.1%) |
| $50,000 to $99,999 | 112 (37.8%) | 120 (43.5%) |
| $100,000 to $299,999 | 103 (34.8%) | 61 (22.1%) |
| $300,000 to $499,999 | 45 (15.2%) | 34 (12.3%) |
| $500,000 to $749,999 | 0 (0.0%) | 0 (0.0%) |
| $750,000 to $999,999 | 0 (0.0%) | 0 (0.0%) |
| $1,000,000 or more | 0 (0.0%) | 0 (0.0%) |
| Total | 296 (100.0%) | 276 (100.0%) |
Household Income by Mortgage Status in Mullins
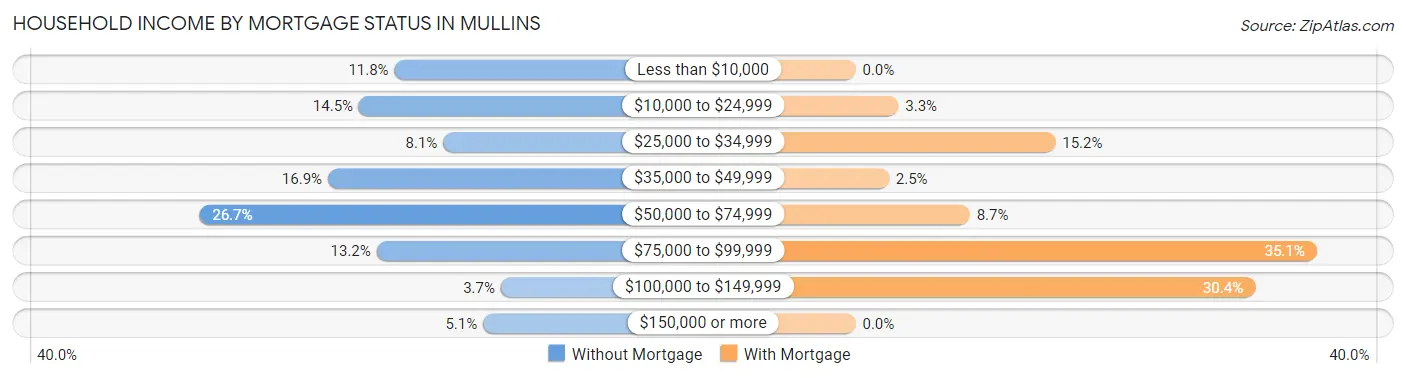
| Household Income | Without Mortgage | With Mortgage |
| Less than $10,000 | 35 (11.8%) | 0 (0.0%) |
| $10,000 to $24,999 | 43 (14.5%) | 9 (3.3%) |
| $25,000 to $34,999 | 24 (8.1%) | 42 (15.2%) |
| $35,000 to $49,999 | 50 (16.9%) | 7 (2.5%) |
| $50,000 to $74,999 | 79 (26.7%) | 24 (8.7%) |
| $75,000 to $99,999 | 39 (13.2%) | 97 (35.1%) |
| $100,000 to $149,999 | 11 (3.7%) | 84 (30.4%) |
| $150,000 or more | 15 (5.1%) | 0 (0.0%) |
| Total | 296 (100.0%) | 276 (100.0%) |
Property Value to Household Income Ratio in Mullins
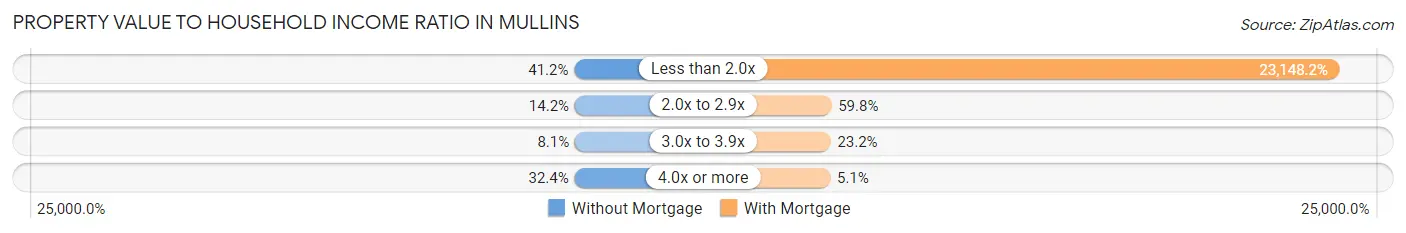
| Value-to-Income Ratio | Without Mortgage | With Mortgage |
| Less than 2.0x | 122 (41.2%) | 63,889 (23,148.2%) |
| 2.0x to 2.9x | 42 (14.2%) | 165 (59.8%) |
| 3.0x to 3.9x | 24 (8.1%) | 64 (23.2%) |
| 4.0x or more | 96 (32.4%) | 14 (5.1%) |
| Total | 296 (100.0%) | 276 (100.0%) |
Real Estate Taxes by Mortgage Status in Mullins
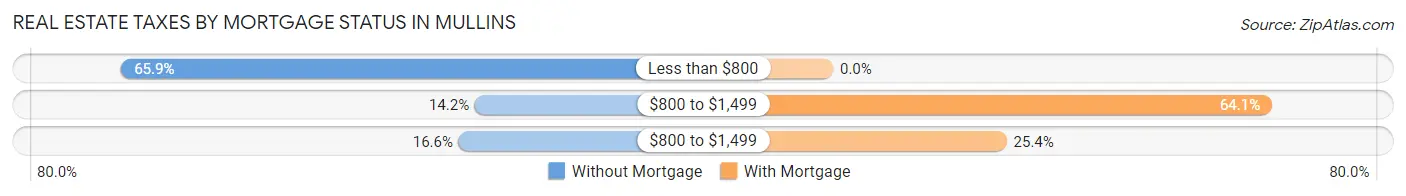
| Property Taxes | Without Mortgage | With Mortgage |
| Less than $800 | 195 (65.9%) | 0 (0.0%) |
| $800 to $1,499 | 42 (14.2%) | 177 (64.1%) |
| $800 to $1,499 | 49 (16.6%) | 70 (25.4%) |
| Total | 296 (100.0%) | 276 (100.0%) |
Health & Disability in Mullins
Health Insurance Coverage by Age in Mullins
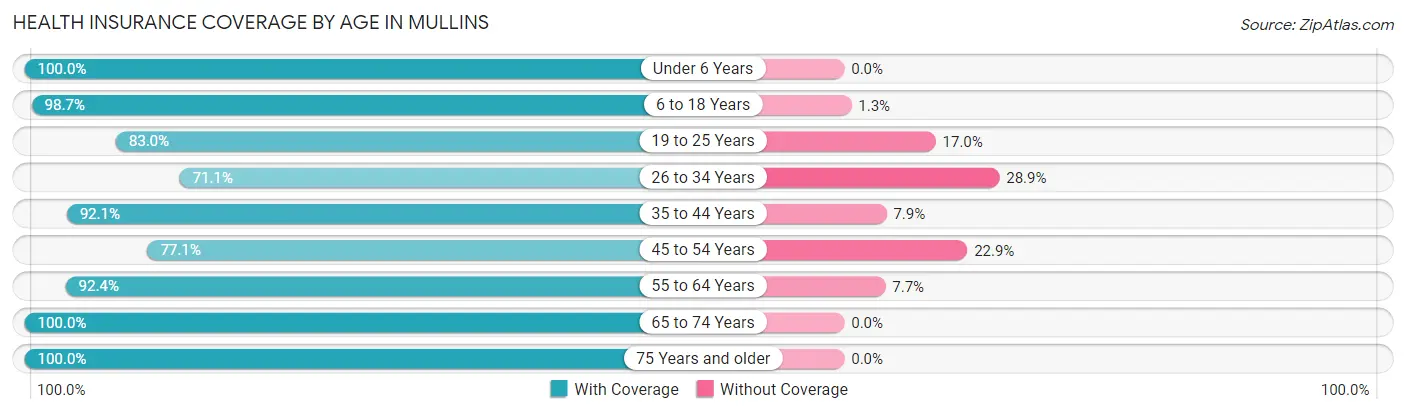
| Age Bracket | With Coverage | Without Coverage |
| Under 6 Years | 382 (100.0%) | 0 (0.0%) |
| 6 to 18 Years | 827 (98.7%) | 11 (1.3%) |
| 19 to 25 Years | 268 (83.0%) | 55 (17.0%) |
| 26 to 34 Years | 251 (71.1%) | 102 (28.9%) |
| 35 to 44 Years | 633 (92.1%) | 54 (7.9%) |
| 45 to 54 Years | 259 (77.1%) | 77 (22.9%) |
| 55 to 64 Years | 302 (92.3%) | 25 (7.6%) |
| 65 to 74 Years | 390 (100.0%) | 0 (0.0%) |
| 75 Years and older | 252 (100.0%) | 0 (0.0%) |
| Total | 3,564 (91.7%) | 324 (8.3%) |
Health Insurance Coverage by Citizenship Status in Mullins
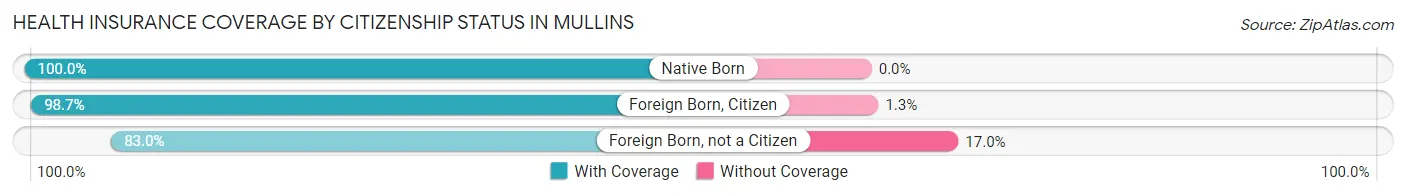
| Citizenship Status | With Coverage | Without Coverage |
| Native Born | 382 (100.0%) | 0 (0.0%) |
| Foreign Born, Citizen | 827 (98.7%) | 11 (1.3%) |
| Foreign Born, not a Citizen | 268 (83.0%) | 55 (17.0%) |
Health Insurance Coverage by Household Income in Mullins
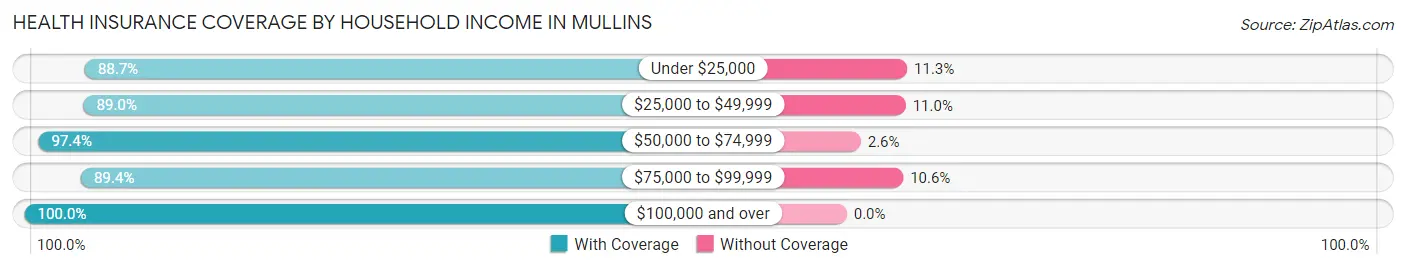
| Household Income | With Coverage | Without Coverage |
| Under $25,000 | 973 (88.7%) | 124 (11.3%) |
| $25,000 to $49,999 | 870 (89.0%) | 108 (11.0%) |
| $50,000 to $74,999 | 670 (97.4%) | 18 (2.6%) |
| $75,000 to $99,999 | 626 (89.4%) | 74 (10.6%) |
| $100,000 and over | 412 (100.0%) | 0 (0.0%) |
Public vs Private Health Insurance Coverage by Age in Mullins
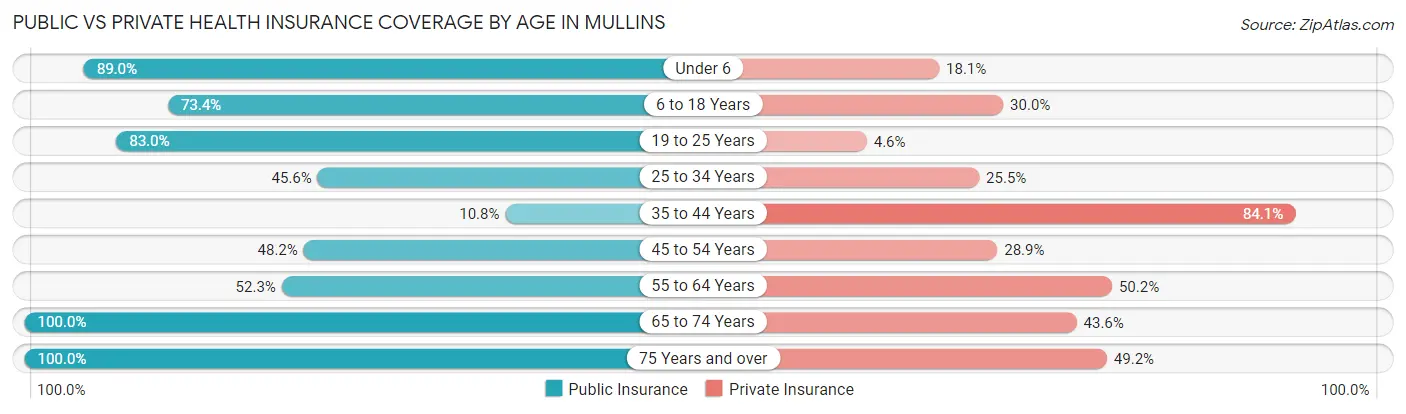
| Age Bracket | Public Insurance | Private Insurance |
| Under 6 | 340 (89.0%) | 69 (18.1%) |
| 6 to 18 Years | 615 (73.4%) | 251 (29.9%) |
| 19 to 25 Years | 268 (83.0%) | 15 (4.6%) |
| 25 to 34 Years | 161 (45.6%) | 90 (25.5%) |
| 35 to 44 Years | 74 (10.8%) | 578 (84.1%) |
| 45 to 54 Years | 162 (48.2%) | 97 (28.9%) |
| 55 to 64 Years | 171 (52.3%) | 164 (50.1%) |
| 65 to 74 Years | 390 (100.0%) | 170 (43.6%) |
| 75 Years and over | 252 (100.0%) | 124 (49.2%) |
| Total | 2,433 (62.6%) | 1,558 (40.1%) |
Disability Status by Sex by Age in Mullins
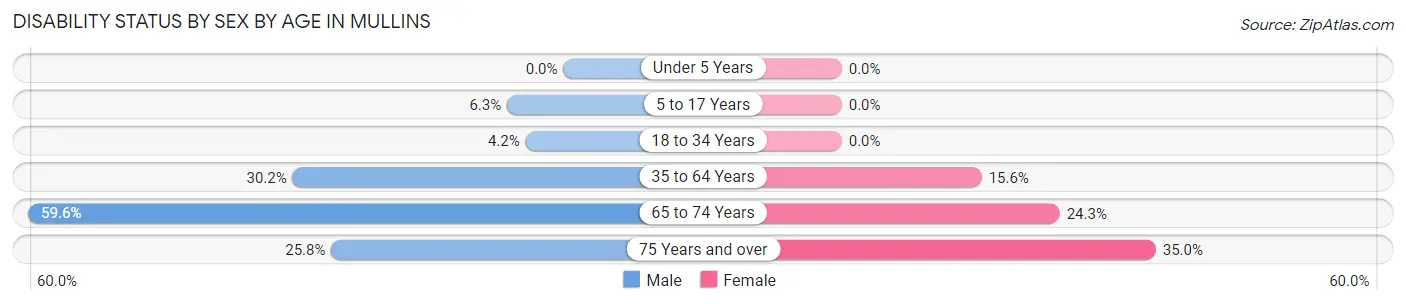
| Age Bracket | Male | Female |
| Under 5 Years | 0 (0.0%) | 0 (0.0%) |
| 5 to 17 Years | 20 (6.3%) | 0 (0.0%) |
| 18 to 34 Years | 13 (4.2%) | 0 (0.0%) |
| 35 to 64 Years | 171 (30.2%) | 122 (15.6%) |
| 65 to 74 Years | 90 (59.6%) | 58 (24.3%) |
| 75 Years and over | 23 (25.8%) | 57 (35.0%) |
Disability Class by Sex by Age in Mullins
Disability Class: Hearing Difficulty
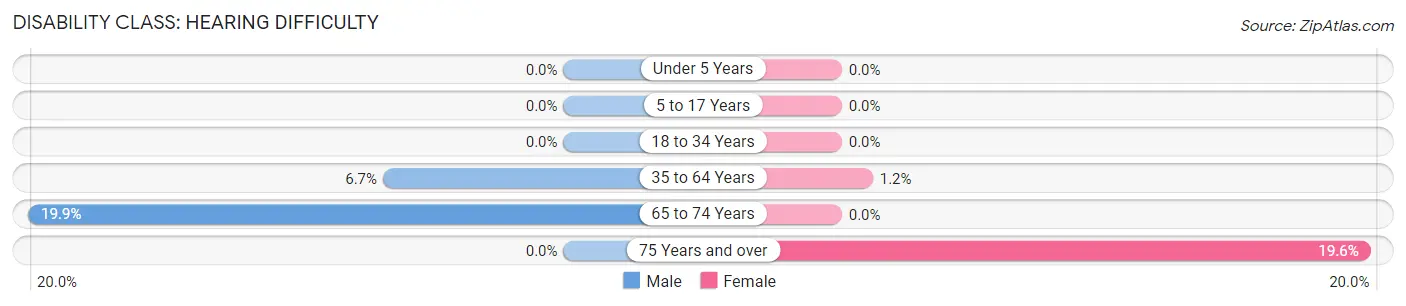
| Age Bracket | Male | Female |
| Under 5 Years | 0 (0.0%) | 0 (0.0%) |
| 5 to 17 Years | 0 (0.0%) | 0 (0.0%) |
| 18 to 34 Years | 0 (0.0%) | 0 (0.0%) |
| 35 to 64 Years | 38 (6.7%) | 9 (1.1%) |
| 65 to 74 Years | 30 (19.9%) | 0 (0.0%) |
| 75 Years and over | 0 (0.0%) | 32 (19.6%) |
Disability Class: Vision Difficulty
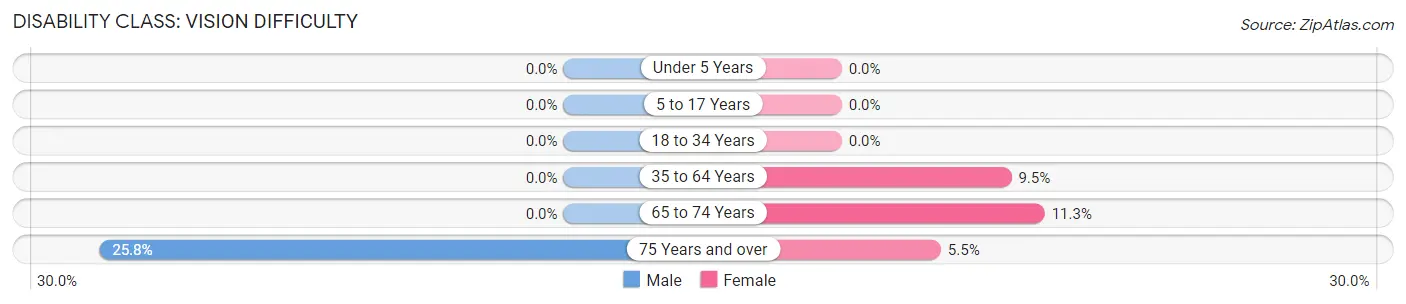
| Age Bracket | Male | Female |
| Under 5 Years | 0 (0.0%) | 0 (0.0%) |
| 5 to 17 Years | 0 (0.0%) | 0 (0.0%) |
| 18 to 34 Years | 0 (0.0%) | 0 (0.0%) |
| 35 to 64 Years | 0 (0.0%) | 74 (9.5%) |
| 65 to 74 Years | 0 (0.0%) | 27 (11.3%) |
| 75 Years and over | 23 (25.8%) | 9 (5.5%) |
Disability Class: Cognitive Difficulty
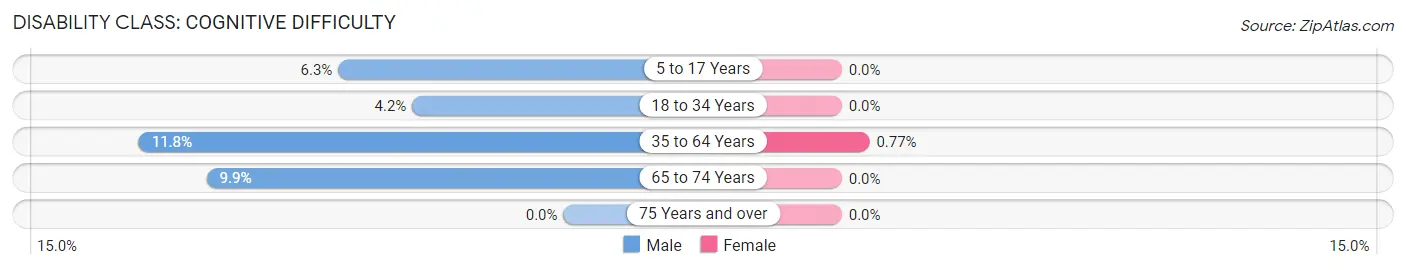
| Age Bracket | Male | Female |
| 5 to 17 Years | 20 (6.3%) | 0 (0.0%) |
| 18 to 34 Years | 13 (4.2%) | 0 (0.0%) |
| 35 to 64 Years | 67 (11.8%) | 6 (0.8%) |
| 65 to 74 Years | 15 (9.9%) | 0 (0.0%) |
| 75 Years and over | 0 (0.0%) | 0 (0.0%) |
Disability Class: Ambulatory Difficulty
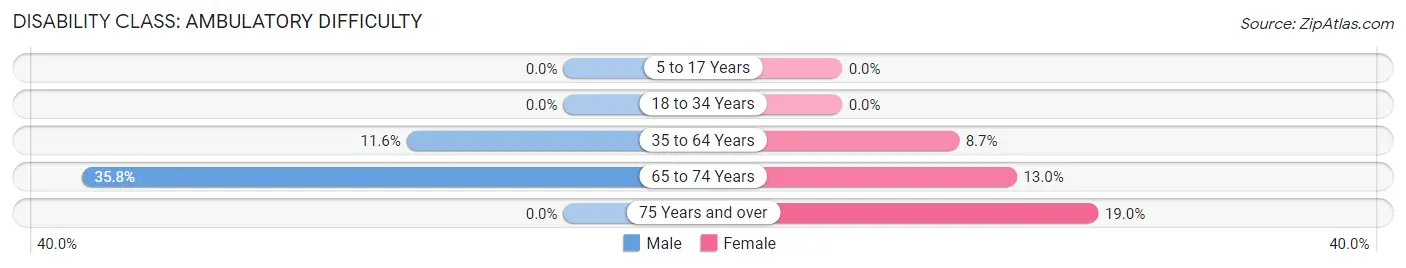
| Age Bracket | Male | Female |
| 5 to 17 Years | 0 (0.0%) | 0 (0.0%) |
| 18 to 34 Years | 0 (0.0%) | 0 (0.0%) |
| 35 to 64 Years | 66 (11.6%) | 68 (8.7%) |
| 65 to 74 Years | 54 (35.8%) | 31 (13.0%) |
| 75 Years and over | 0 (0.0%) | 31 (19.0%) |
Disability Class: Self-Care Difficulty
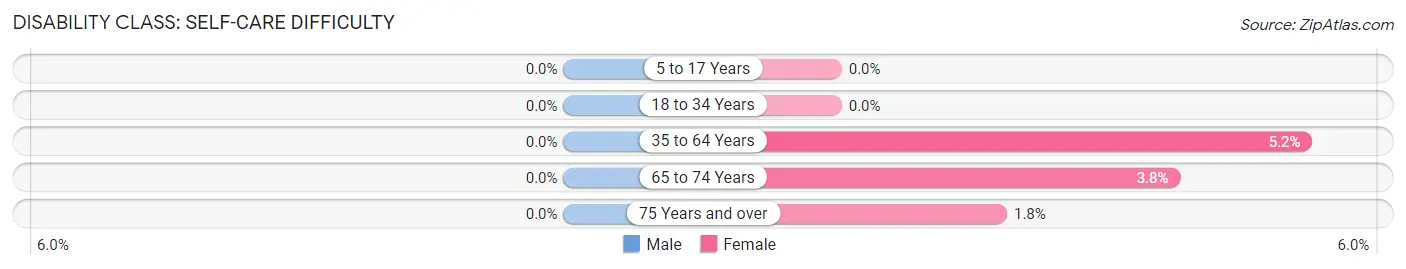
| Age Bracket | Male | Female |
| 5 to 17 Years | 0 (0.0%) | 0 (0.0%) |
| 18 to 34 Years | 0 (0.0%) | 0 (0.0%) |
| 35 to 64 Years | 0 (0.0%) | 41 (5.2%) |
| 65 to 74 Years | 0 (0.0%) | 9 (3.8%) |
| 75 Years and over | 0 (0.0%) | 3 (1.8%) |
Technology Access in Mullins
Computing Device Access in Mullins
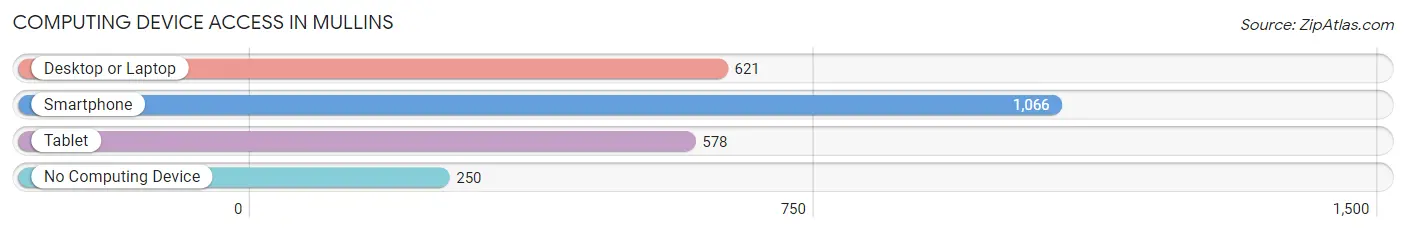
| Device Type | # Households | % Households |
| Desktop or Laptop | 621 | 44.4% |
| Smartphone | 1,066 | 76.2% |
| Tablet | 578 | 41.3% |
| No Computing Device | 250 | 17.9% |
| Total | 1,398 | 100.0% |
Internet Access in Mullins
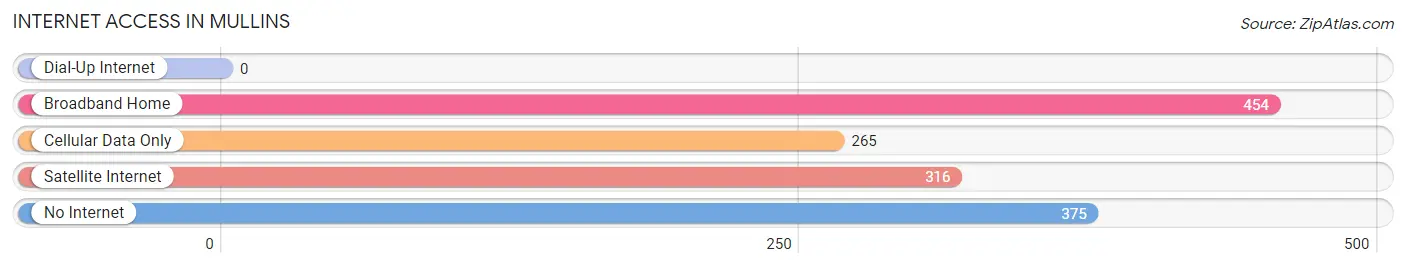
| Internet Type | # Households | % Households |
| Dial-Up Internet | 0 | 0.0% |
| Broadband Home | 454 | 32.5% |
| Cellular Data Only | 265 | 19.0% |
| Satellite Internet | 316 | 22.6% |
| No Internet | 375 | 26.8% |
| Total | 1,398 | 100.0% |
Mullins Summary
Mullins is a small town located in Marion County, South Carolina. It is situated in the northeastern part of the state, approximately halfway between Florence and Myrtle Beach. The town was founded in 1891 and named after the Mullins family, who were early settlers in the area. The population of Mullins was estimated to be 3,845 in 2019.
Geography
Mullins is located in the Pee Dee region of South Carolina, which is known for its flat terrain and sandy soil. The town is situated on the banks of the Little Pee Dee River, which flows through the area. The town is surrounded by several small towns and rural communities, including Nichols, Marion, and Latta. The nearest major city is Florence, which is located about 25 miles to the west.
Climate
Mullins has a humid subtropical climate, with hot, humid summers and mild winters. The average annual temperature is around 70°F, with temperatures reaching as high as 95°F in the summer and as low as 40°F in the winter. The area receives an average of 48 inches of precipitation per year, with most of it falling in the summer months.
Economy
Mullins is a small, rural town with a largely agricultural economy. The town is home to several farms, which produce a variety of crops, including cotton, soybeans, corn, and peanuts. The town is also home to several manufacturing companies, including a paper mill and a furniture factory. The town is also home to several retail stores, restaurants, and other businesses.
Demographics
Mullins is a predominantly white town, with a population that is approximately 85% white and 15% African American. The median household income is around $35,000, and the median home value is around $90,000. The town has a poverty rate of around 20%, which is higher than the state average.
Education
Mullins is served by the Marion County School District, which operates several elementary, middle, and high schools in the area. The town is also home to several private schools, including Mullins Christian Academy and Mullins Academy. The town is also home to several higher education institutions, including Francis Marion University and Coker College.
Conclusion
Mullins is a small town located in Marion County, South Carolina. It is situated in the northeastern part of the state, approximately halfway between Florence and Myrtle Beach. The town was founded in 1891 and named after the Mullins family, who were early settlers in the area. The population of Mullins was estimated to be 3,845 in 2019. The town has a humid subtropical climate, with hot, humid summers and mild winters. The economy of Mullins is largely agricultural, with several farms producing a variety of crops. The town is predominantly white, with a population that is approximately 85% white and 15% African American. The town is served by the Marion County School District, and is home to several higher education institutions.
Common Questions
What is Per Capita Income in Mullins?
Per Capita income in Mullins is $17,901.
What is the Median Family Income in Mullins?
Median Family Income in Mullins is $49,722.
What is the Median Household income in Mullins?
Median Household Income in Mullins is $38,304.
What is Income or Wage Gap in Mullins?
Income or Wage Gap in Mullins is 36.9%.
Women in Mullins earn 63.1 cents for every dollar earned by a man.
What is Inequality or Gini Index in Mullins?
Inequality or Gini Index in Mullins is 0.45.
What is the Total Population of Mullins?
Total Population of Mullins is 4,014.
What is the Total Male Population of Mullins?
Total Male Population of Mullins is 1,583.
What is the Total Female Population of Mullins?
Total Female Population of Mullins is 2,431.
What is the Ratio of Males per 100 Females in Mullins?
There are 65.12 Males per 100 Females in Mullins.
What is the Ratio of Females per 100 Males in Mullins?
There are 153.57 Females per 100 Males in Mullins.
What is the Median Population Age in Mullins?
Median Population Age in Mullins is 36.2 Years.
What is the Average Family Size in Mullins
Average Family Size in Mullins is 3.9 People.
What is the Average Household Size in Mullins
Average Household Size in Mullins is 2.8 People.
How Large is the Labor Force in Mullins?
There are 1,630 People in the Labor Forcein in Mullins.
What is the Percentage of People in the Labor Force in Mullins?
54.6% of People are in the Labor Force in Mullins.
What is the Unemployment Rate in Mullins?
Unemployment Rate in Mullins is 9.4%.