North Myrtle Beach, SC Map & Demographics
North Myrtle Beach Map
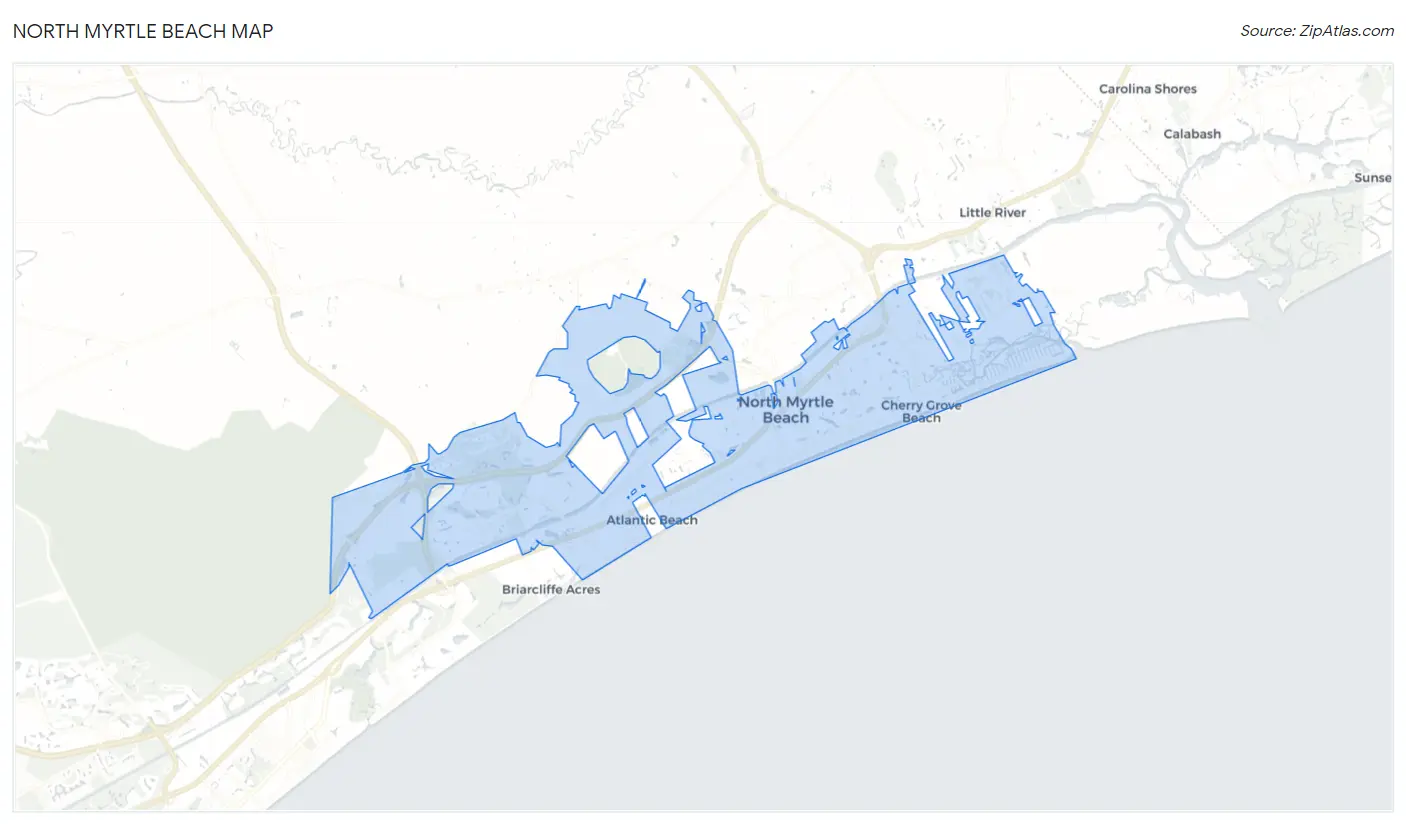
North Myrtle Beach Overview
$49,007
PER CAPITA INCOME
$89,418
AVG FAMILY INCOME
$69,792
AVG HOUSEHOLD INCOME
1.6%
WAGE / INCOME GAP [ % ]
98.4¢/ $1
WAGE / INCOME GAP [ $ ]
0.45
INEQUALITY / GINI INDEX
18,850
TOTAL POPULATION
9,391
MALE POPULATION
9,459
FEMALE POPULATION
99.28
MALES / 100 FEMALES
100.72
FEMALES / 100 MALES
60.2
MEDIAN AGE
2.6
AVG FAMILY SIZE
2.1
AVG HOUSEHOLD SIZE
8,423
LABOR FORCE [ PEOPLE ]
49.3%
PERCENT IN LABOR FORCE
6.4%
UNEMPLOYMENT RATE
North Myrtle Beach Zip Codes
North Myrtle Beach Area Codes
Income in North Myrtle Beach
Income Overview in North Myrtle Beach
Per Capita Income in North Myrtle Beach is $49,007, while median incomes of families and households are $89,418 and $69,792 respectively.
| Characteristic | Number | Measure |
| Per Capita Income | 18,850 | $49,007 |
| Median Family Income | 5,508 | $89,418 |
| Mean Family Income | 5,508 | $114,570 |
| Median Household Income | 8,943 | $69,792 |
| Mean Household Income | 8,943 | $99,938 |
| Income Deficit | 5,508 | $0 |
| Wage / Income Gap (%) | 18,850 | 1.57% |
| Wage / Income Gap ($) | 18,850 | 98.43¢ per $1 |
| Gini / Inequality Index | 18,850 | 0.45 |
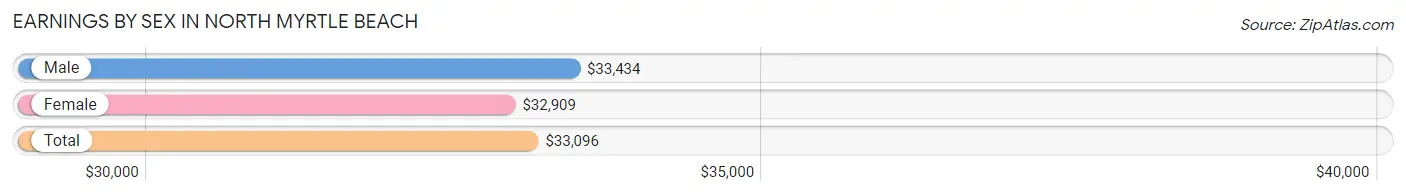
Earnings by Sex in North Myrtle Beach
Average Earnings in North Myrtle Beach are $33,096, $33,434 for men and $32,909 for women, a difference of 1.6%.
| Sex | Number | Average Earnings |
| Male | 4,544 (52.3%) | $33,434 |
| Female | 4,150 (47.7%) | $32,909 |
| Total | 8,694 (100.0%) | $33,096 |
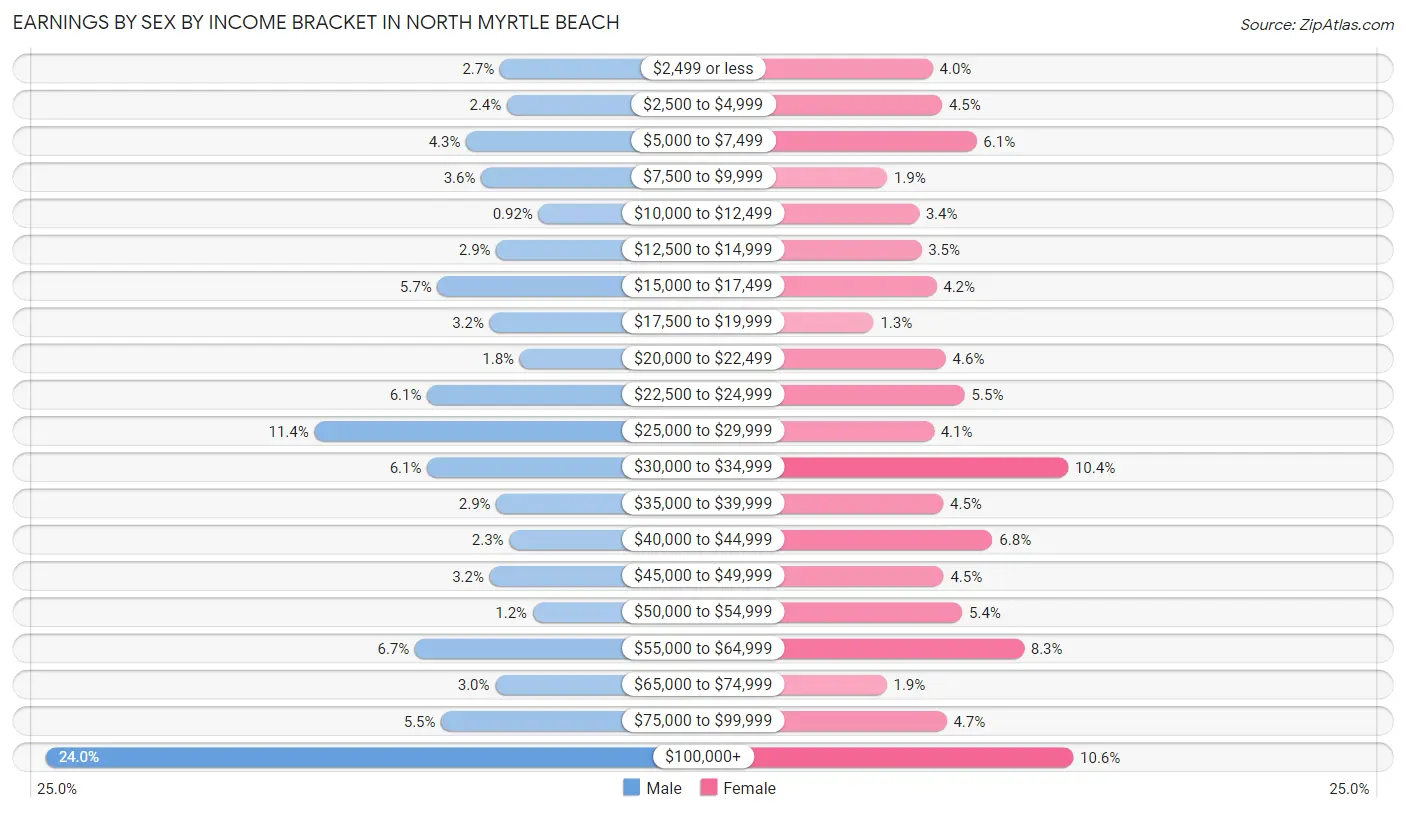
Earnings by Sex by Income Bracket in North Myrtle Beach
The most common earnings brackets in North Myrtle Beach are $100,000+ for men (1,091 | 24.0%) and $100,000+ for women (440 | 10.6%).
| Income | Male | Female |
| $2,499 or less | 124 (2.7%) | 167 (4.0%) |
| $2,500 to $4,999 | 109 (2.4%) | 185 (4.5%) |
| $5,000 to $7,499 | 196 (4.3%) | 252 (6.1%) |
| $7,500 to $9,999 | 164 (3.6%) | 78 (1.9%) |
| $10,000 to $12,499 | 42 (0.9%) | 140 (3.4%) |
| $12,500 to $14,999 | 132 (2.9%) | 145 (3.5%) |
| $15,000 to $17,499 | 257 (5.7%) | 174 (4.2%) |
| $17,500 to $19,999 | 146 (3.2%) | 52 (1.3%) |
| $20,000 to $22,499 | 82 (1.8%) | 192 (4.6%) |
| $22,500 to $24,999 | 279 (6.1%) | 229 (5.5%) |
| $25,000 to $29,999 | 519 (11.4%) | 169 (4.1%) |
| $30,000 to $34,999 | 279 (6.1%) | 430 (10.4%) |
| $35,000 to $39,999 | 132 (2.9%) | 187 (4.5%) |
| $40,000 to $44,999 | 104 (2.3%) | 283 (6.8%) |
| $45,000 to $49,999 | 146 (3.2%) | 188 (4.5%) |
| $50,000 to $54,999 | 54 (1.2%) | 224 (5.4%) |
| $55,000 to $64,999 | 305 (6.7%) | 344 (8.3%) |
| $65,000 to $74,999 | 134 (2.9%) | 77 (1.9%) |
| $75,000 to $99,999 | 249 (5.5%) | 194 (4.7%) |
| $100,000+ | 1,091 (24.0%) | 440 (10.6%) |
| Total | 4,544 (100.0%) | 4,150 (100.0%) |
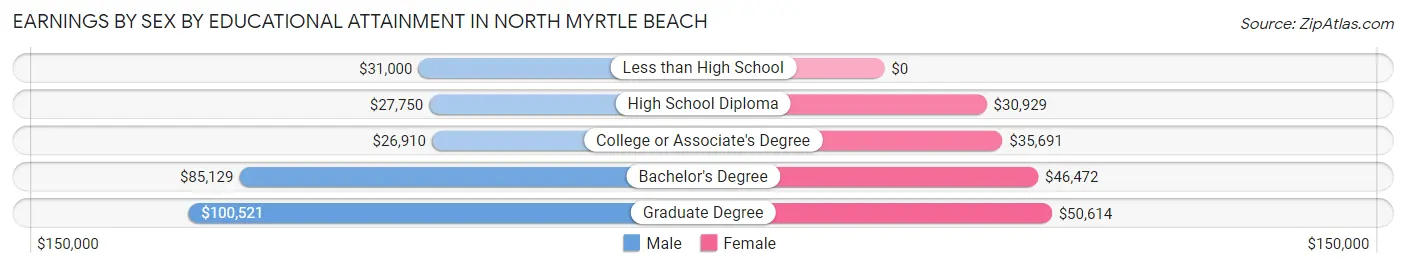
Earnings by Sex by Educational Attainment in North Myrtle Beach
Average earnings in North Myrtle Beach are $39,932 for men and $35,173 for women, a difference of 11.9%. Men with an educational attainment of graduate degree enjoy the highest average annual earnings of $100,521, while those with college or associate's degree education earn the least with $26,910. Women with an educational attainment of graduate degree earn the most with the average annual earnings of $50,614, while those with high school diploma education have the smallest earnings of $30,929.
| Educational Attainment | Male Income | Female Income |
| Less than High School | $31,000 | $0 |
| High School Diploma | $27,750 | $30,929 |
| College or Associate's Degree | $26,910 | $35,691 |
| Bachelor's Degree | $85,129 | $46,472 |
| Graduate Degree | $100,521 | $50,614 |
| Total | $39,932 | $35,173 |
Family Income in North Myrtle Beach
Family Income Brackets in North Myrtle Beach
According to the North Myrtle Beach family income data, there are 1,201 families falling into the $100,000 to $149,999 income range, which is the most common income bracket and makes up 21.8% of all families. Conversely, the $10,000 to $14,999 income bracket is the least frequent group with only 39 families (0.7%) belonging to this category.
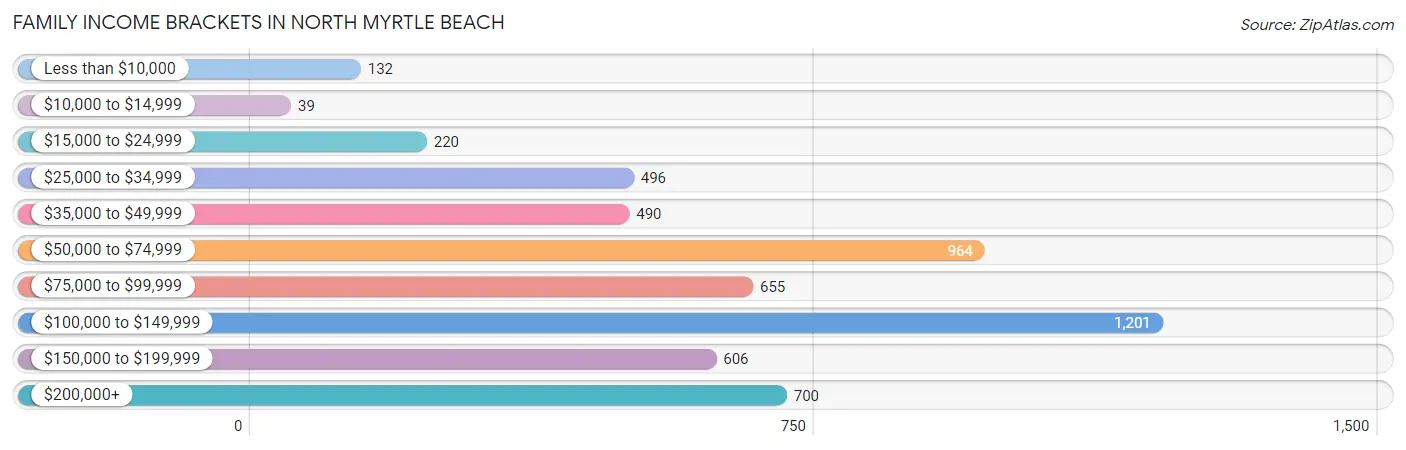
| Income Bracket | # Families | % Families |
| Less than $10,000 | 132 | 2.4% |
| $10,000 to $14,999 | 39 | 0.7% |
| $15,000 to $24,999 | 220 | 4.0% |
| $25,000 to $34,999 | 496 | 9.0% |
| $35,000 to $49,999 | 490 | 8.9% |
| $50,000 to $74,999 | 964 | 17.5% |
| $75,000 to $99,999 | 655 | 11.9% |
| $100,000 to $149,999 | 1,201 | 21.8% |
| $150,000 to $199,999 | 606 | 11.0% |
| $200,000+ | 700 | 12.7% |
Family Income by Famaliy Size in North Myrtle Beach
6-person families (86 | 1.6%) account for the highest median family income in North Myrtle Beach with $123,598 per family, while 2-person families (4,314 | 78.3%) have the highest median income of $43,276 per family member.
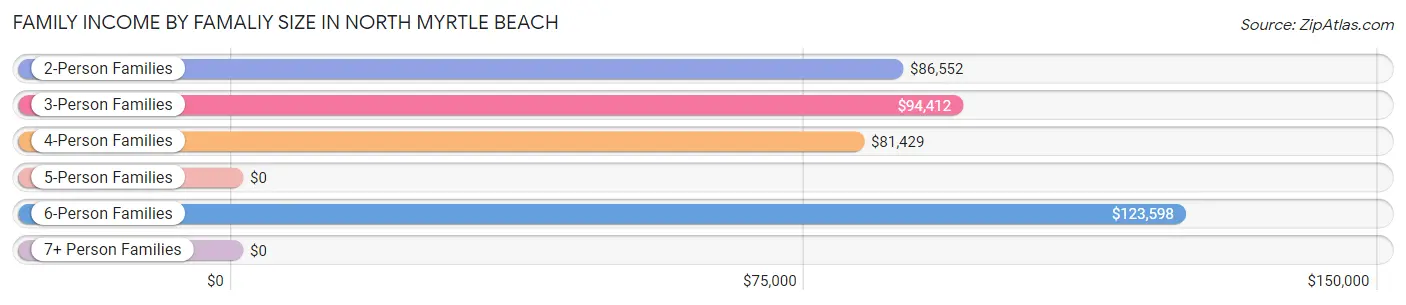
| Income Bracket | # Families | Median Income |
| 2-Person Families | 4,314 (78.3%) | $86,552 |
| 3-Person Families | 600 (10.9%) | $94,412 |
| 4-Person Families | 430 (7.8%) | $81,429 |
| 5-Person Families | 70 (1.3%) | $0 |
| 6-Person Families | 86 (1.6%) | $123,598 |
| 7+ Person Families | 8 (0.2%) | $0 |
| Total | 5,508 (100.0%) | $89,418 |
Family Income by Number of Earners in North Myrtle Beach
The median family income in North Myrtle Beach is $89,418, with families comprising 3+ earners (217) having the highest median family income of $124,604, while families with no earners (1,873) have the lowest median family income of $78,007, accounting for 3.9% and 34.0% of families, respectively.
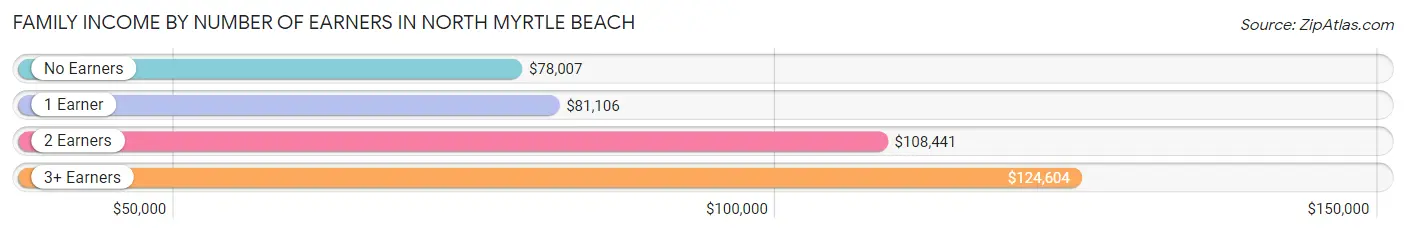
| Number of Earners | # Families | Median Income |
| No Earners | 1,873 (34.0%) | $78,007 |
| 1 Earner | 1,881 (34.2%) | $81,106 |
| 2 Earners | 1,537 (27.9%) | $108,441 |
| 3+ Earners | 217 (3.9%) | $124,604 |
| Total | 5,508 (100.0%) | $89,418 |
Household Income in North Myrtle Beach
Household Income Brackets in North Myrtle Beach
With 1,637 households falling in the category, the $50,000 to $74,999 income range is the most frequent in North Myrtle Beach, accounting for 18.3% of all households. In contrast, only 161 households (1.8%) fall into the $10,000 to $14,999 income bracket, making it the least populous group.
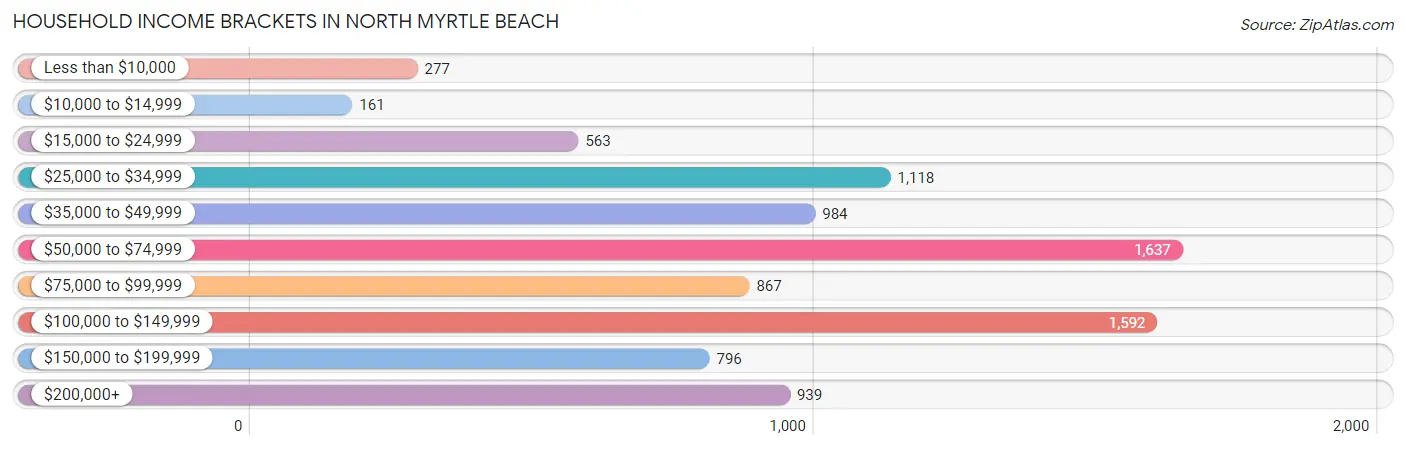
| Income Bracket | # Households | % Households |
| Less than $10,000 | 277 | 3.1% |
| $10,000 to $14,999 | 161 | 1.8% |
| $15,000 to $24,999 | 563 | 6.3% |
| $25,000 to $34,999 | 1,118 | 12.5% |
| $35,000 to $49,999 | 984 | 11.0% |
| $50,000 to $74,999 | 1,637 | 18.3% |
| $75,000 to $99,999 | 867 | 9.7% |
| $100,000 to $149,999 | 1,592 | 17.8% |
| $150,000 to $199,999 | 796 | 8.9% |
| $200,000+ | 939 | 10.5% |
Household Income by Householder Age in North Myrtle Beach
The median household income in North Myrtle Beach is $69,792, with the highest median household income of $79,088 found in the 25 to 44 years age bracket for the primary householder. A total of 1,131 households (12.7%) fall into this category. Meanwhile, the 15 to 24 years age bracket for the primary householder has the lowest median household income of $27,328, with 90 households (1.0%) in this group.
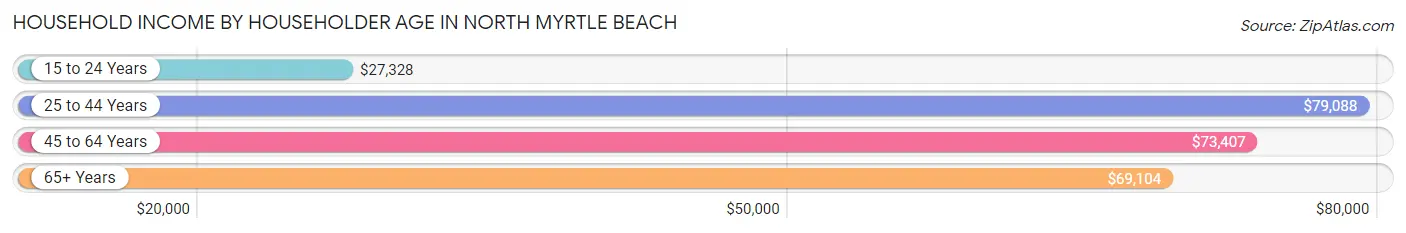
| Income Bracket | # Households | Median Income |
| 15 to 24 Years | 90 (1.0%) | $27,328 |
| 25 to 44 Years | 1,131 (12.7%) | $79,088 |
| 45 to 64 Years | 3,333 (37.3%) | $73,407 |
| 65+ Years | 4,389 (49.1%) | $69,104 |
| Total | 8,943 (100.0%) | $69,792 |
Poverty in North Myrtle Beach
Income Below Poverty by Sex and Age in North Myrtle Beach
With 6.7% poverty level for males and 7.2% for females among the residents of North Myrtle Beach, 15 year old males and 18 to 24 year old females are the most vulnerable to poverty, with 36 males (56.2%) and 149 females (50.5%) in their respective age groups living below the poverty level.
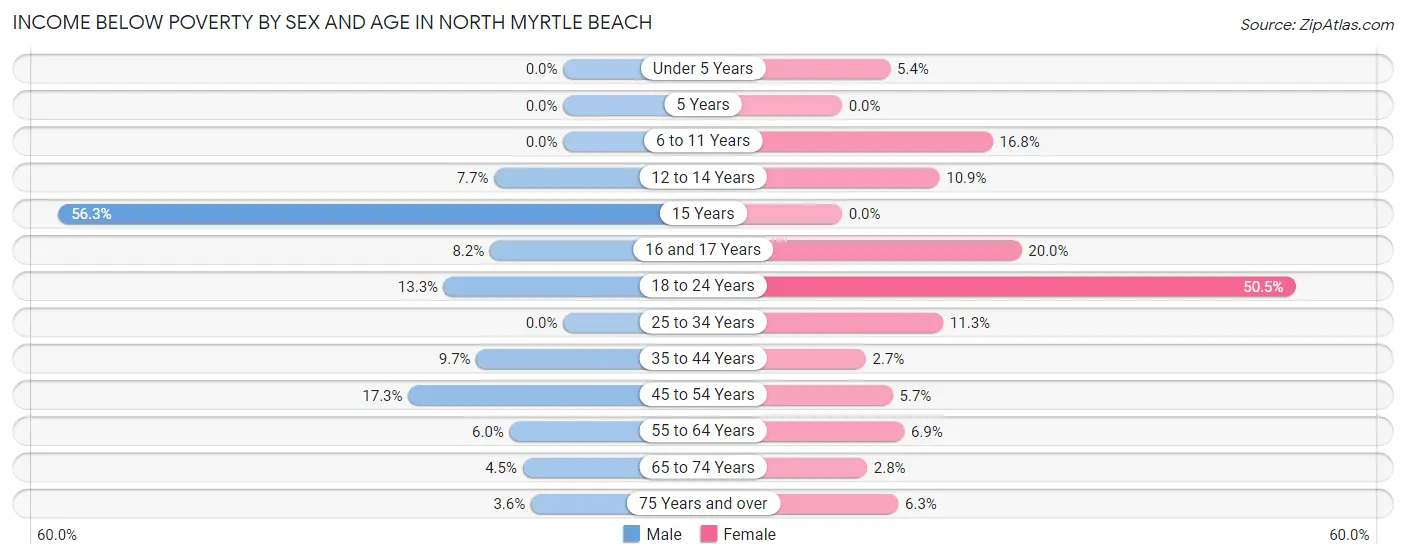
| Age Bracket | Male | Female |
| Under 5 Years | 0 (0.0%) | 17 (5.4%) |
| 5 Years | 0 (0.0%) | 0 (0.0%) |
| 6 to 11 Years | 0 (0.0%) | 45 (16.8%) |
| 12 to 14 Years | 8 (7.7%) | 24 (10.9%) |
| 15 Years | 36 (56.2%) | 0 (0.0%) |
| 16 and 17 Years | 8 (8.2%) | 9 (20.0%) |
| 18 to 24 Years | 58 (13.3%) | 149 (50.5%) |
| 25 to 34 Years | 0 (0.0%) | 50 (11.3%) |
| 35 to 44 Years | 70 (9.7%) | 23 (2.6%) |
| 45 to 54 Years | 188 (17.3%) | 66 (5.7%) |
| 55 to 64 Years | 109 (6.0%) | 143 (6.9%) |
| 65 to 74 Years | 111 (4.5%) | 60 (2.8%) |
| 75 Years and over | 41 (3.6%) | 96 (6.3%) |
| Total | 629 (6.7%) | 682 (7.2%) |
Income Above Poverty by Sex and Age in North Myrtle Beach
According to the poverty statistics in North Myrtle Beach, males aged under 5 years and females aged 5 years are the age groups that are most secure financially, with 100.0% of males and 100.0% of females in these age groups living above the poverty line.
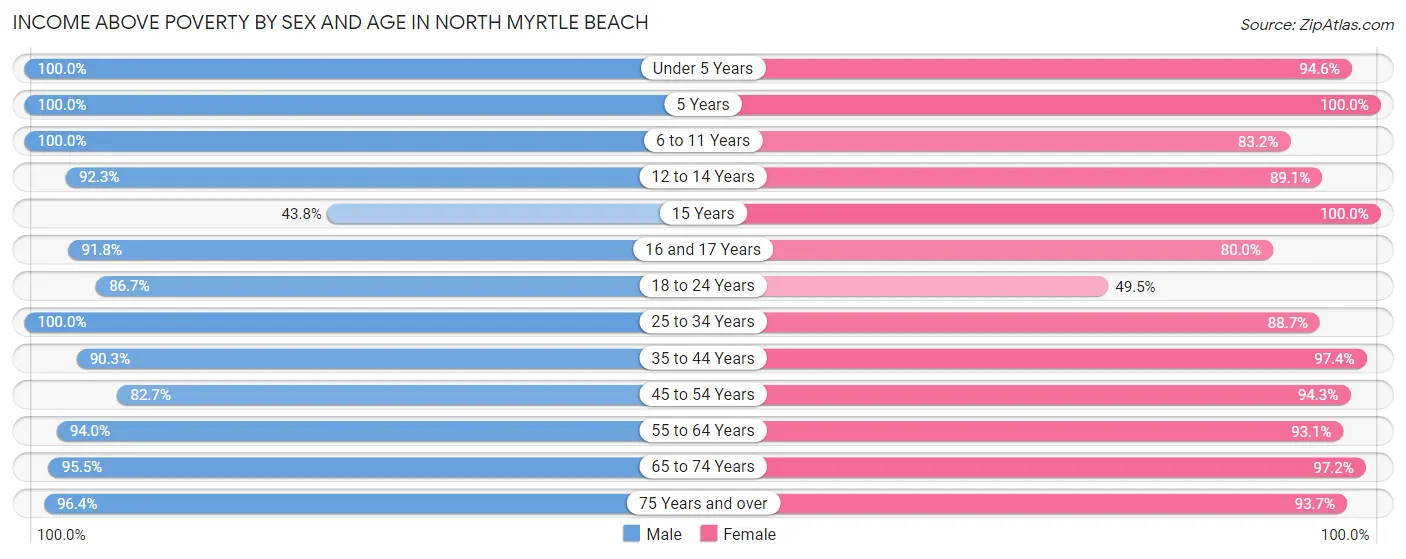
| Age Bracket | Male | Female |
| Under 5 Years | 371 (100.0%) | 299 (94.6%) |
| 5 Years | 26 (100.0%) | 35 (100.0%) |
| 6 to 11 Years | 312 (100.0%) | 223 (83.2%) |
| 12 to 14 Years | 96 (92.3%) | 197 (89.1%) |
| 15 Years | 28 (43.8%) | 19 (100.0%) |
| 16 and 17 Years | 90 (91.8%) | 36 (80.0%) |
| 18 to 24 Years | 378 (86.7%) | 146 (49.5%) |
| 25 to 34 Years | 748 (100.0%) | 394 (88.7%) |
| 35 to 44 Years | 653 (90.3%) | 845 (97.4%) |
| 45 to 54 Years | 901 (82.7%) | 1,101 (94.3%) |
| 55 to 64 Years | 1,714 (94.0%) | 1,923 (93.1%) |
| 65 to 74 Years | 2,344 (95.5%) | 2,093 (97.2%) |
| 75 Years and over | 1,098 (96.4%) | 1,436 (93.7%) |
| Total | 8,759 (93.3%) | 8,747 (92.8%) |
Income Below Poverty Among Married-Couple Families in North Myrtle Beach
The poverty statistics for married-couple families in North Myrtle Beach show that 4.2% or 189 of the total 4,459 families live below the poverty line. Families with 1 or 2 children have the highest poverty rate of 11.7%, comprising of 61 families. On the other hand, families with 3 or 4 children have the lowest poverty rate of 0.0%, which includes 0 families.
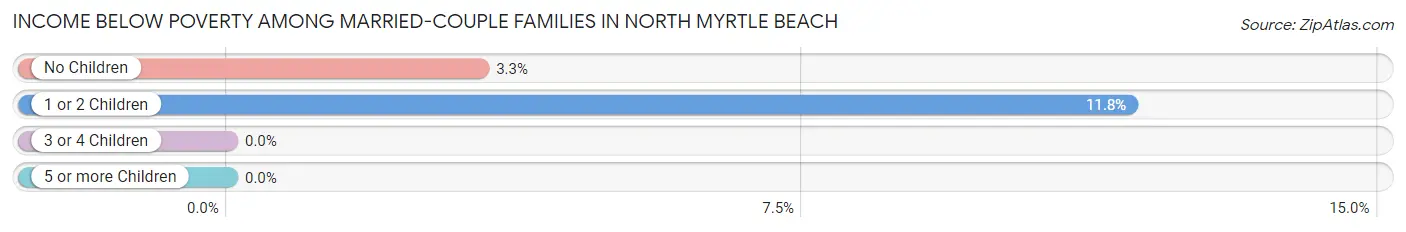
| Children | Above Poverty | Below Poverty |
| No Children | 3,779 (96.7%) | 128 (3.3%) |
| 1 or 2 Children | 458 (88.2%) | 61 (11.7%) |
| 3 or 4 Children | 33 (100.0%) | 0 (0.0%) |
| 5 or more Children | 0 (0.0%) | 0 (0.0%) |
| Total | 4,270 (95.8%) | 189 (4.2%) |
Income Below Poverty Among Single-Parent Households in North Myrtle Beach
According to the poverty data in North Myrtle Beach, 25.8% or 42 single-father households and 7.9% or 70 single-mother households are living below the poverty line. Among single-father households, those with no children have the highest poverty rate, with 42 households (36.5%) experiencing poverty. Likewise, among single-mother households, those with 1 or 2 children have the highest poverty rate, with 48 households (16.3%) falling below the poverty line.
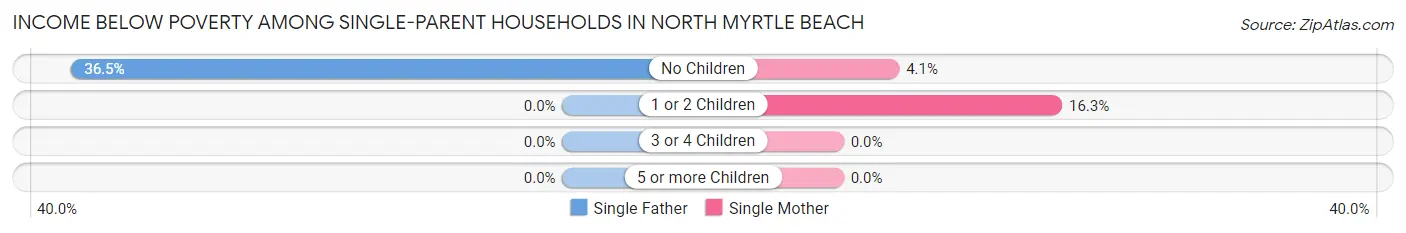
| Children | Single Father | Single Mother |
| No Children | 42 (36.5%) | 22 (4.1%) |
| 1 or 2 Children | 0 (0.0%) | 48 (16.3%) |
| 3 or 4 Children | 0 (0.0%) | 0 (0.0%) |
| 5 or more Children | 0 (0.0%) | 0 (0.0%) |
| Total | 42 (25.8%) | 70 (7.9%) |
Income Below Poverty Among Married-Couple vs Single-Parent Households in North Myrtle Beach
The poverty data for North Myrtle Beach shows that 189 of the married-couple family households (4.2%) and 112 of the single-parent households (10.7%) are living below the poverty level. Within the married-couple family households, those with 1 or 2 children have the highest poverty rate, with 61 households (11.7%) falling below the poverty line. Among the single-parent households, those with 1 or 2 children have the highest poverty rate, with 48 household (14.0%) living below poverty.
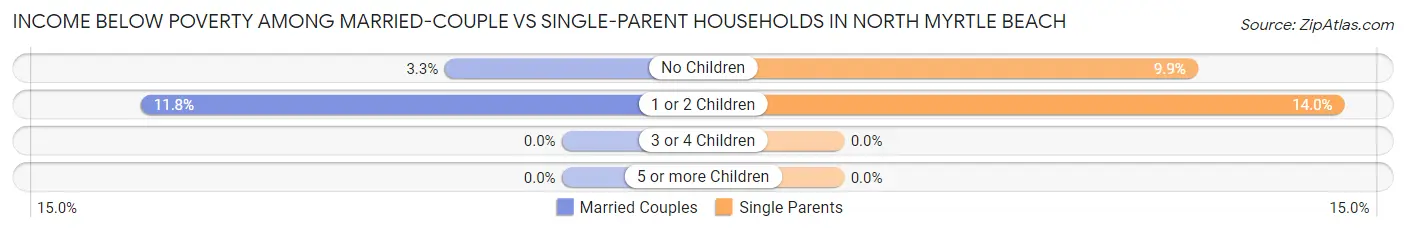
| Children | Married-Couple Families | Single-Parent Households |
| No Children | 128 (3.3%) | 64 (9.9%) |
| 1 or 2 Children | 61 (11.7%) | 48 (14.0%) |
| 3 or 4 Children | 0 (0.0%) | 0 (0.0%) |
| 5 or more Children | 0 (0.0%) | 0 (0.0%) |
| Total | 189 (4.2%) | 112 (10.7%) |
Race in North Myrtle Beach
The most populous races in North Myrtle Beach are White / Caucasian (17,204 | 91.3%), Hispanic or Latino (1,299 | 6.9%), and Two or more Races (858 | 4.5%).
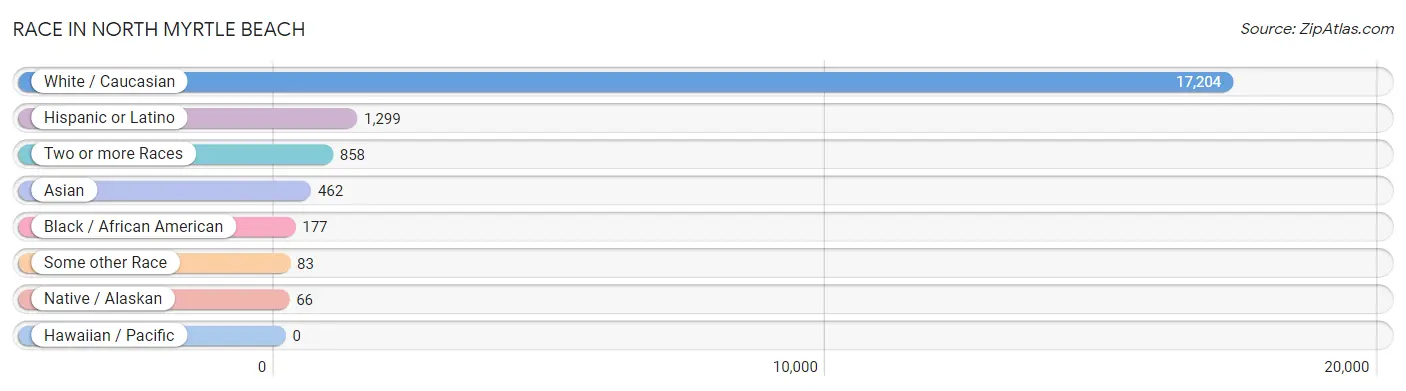
| Race | # Population | % Population |
| Asian | 462 | 2.5% |
| Black / African American | 177 | 0.9% |
| Hawaiian / Pacific | 0 | 0.0% |
| Hispanic or Latino | 1,299 | 6.9% |
| Native / Alaskan | 66 | 0.4% |
| White / Caucasian | 17,204 | 91.3% |
| Two or more Races | 858 | 4.5% |
| Some other Race | 83 | 0.4% |
| Total | 18,850 | 100.0% |
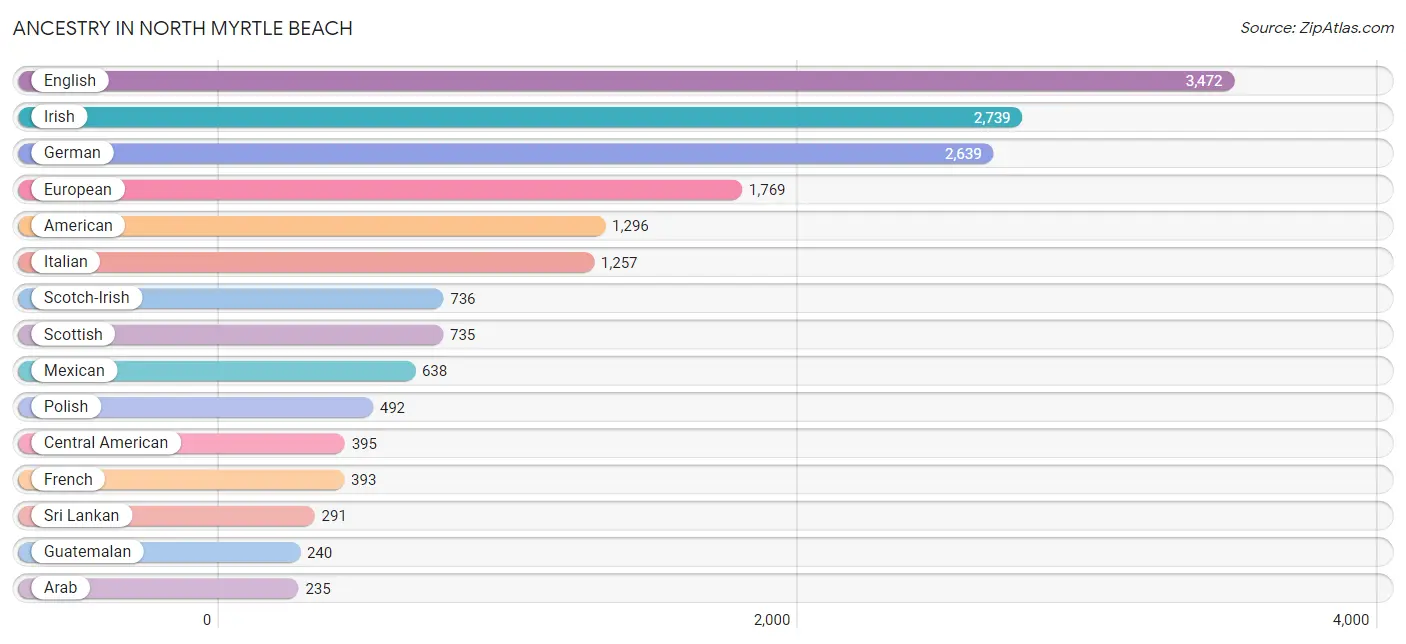
Ancestry in North Myrtle Beach
The most populous ancestries reported in North Myrtle Beach are English (3,472 | 18.4%), Irish (2,739 | 14.5%), German (2,639 | 14.0%), European (1,769 | 9.4%), and American (1,296 | 6.9%), together accounting for 63.2% of all North Myrtle Beach residents.
| Ancestry | # Population | % Population |
| African | 41 | 0.2% |
| Alsatian | 12 | 0.1% |
| American | 1,296 | 6.9% |
| Arab | 235 | 1.3% |
| Armenian | 10 | 0.1% |
| Australian | 11 | 0.1% |
| Austrian | 35 | 0.2% |
| Belgian | 8 | 0.0% |
| Bhutanese | 2 | 0.0% |
| British | 149 | 0.8% |
| Canadian | 52 | 0.3% |
| Central American | 395 | 2.1% |
| Central American Indian | 6 | 0.0% |
| Cherokee | 36 | 0.2% |
| Colombian | 19 | 0.1% |
| Croatian | 51 | 0.3% |
| Cuban | 52 | 0.3% |
| Czech | 10 | 0.1% |
| Dominican | 13 | 0.1% |
| Dutch | 186 | 1.0% |
| Eastern European | 21 | 0.1% |
| English | 3,472 | 18.4% |
| European | 1,769 | 9.4% |
| Finnish | 13 | 0.1% |
| French | 393 | 2.1% |
| French Canadian | 38 | 0.2% |
| German | 2,639 | 14.0% |
| Greek | 147 | 0.8% |
| Guatemalan | 240 | 1.3% |
| Honduran | 122 | 0.6% |
| Hungarian | 113 | 0.6% |
| Indian (Asian) | 119 | 0.6% |
| Iranian | 13 | 0.1% |
| Irish | 2,739 | 14.5% |
| Iroquois | 34 | 0.2% |
| Israeli | 14 | 0.1% |
| Italian | 1,257 | 6.7% |
| Kiowa | 11 | 0.1% |
| Lebanese | 61 | 0.3% |
| Lithuanian | 42 | 0.2% |
| Lumbee | 37 | 0.2% |
| Mexican | 638 | 3.4% |
| Mexican American Indian | 6 | 0.0% |
| Northern European | 7 | 0.0% |
| Norwegian | 104 | 0.5% |
| Pakistani | 19 | 0.1% |
| Palestinian | 8 | 0.0% |
| Panamanian | 12 | 0.1% |
| Polish | 492 | 2.6% |
| Portuguese | 75 | 0.4% |
| Puerto Rican | 23 | 0.1% |
| Russian | 176 | 0.9% |
| Salvadoran | 21 | 0.1% |
| Scandinavian | 98 | 0.5% |
| Scotch-Irish | 736 | 3.9% |
| Scottish | 735 | 3.9% |
| Slavic | 36 | 0.2% |
| Slovak | 64 | 0.3% |
| Slovene | 5 | 0.0% |
| South African | 24 | 0.1% |
| South American | 19 | 0.1% |
| Spaniard | 15 | 0.1% |
| Spanish | 28 | 0.2% |
| Sri Lankan | 291 | 1.5% |
| Subsaharan African | 65 | 0.3% |
| Swedish | 102 | 0.5% |
| Swiss | 9 | 0.1% |
| Syrian | 159 | 0.8% |
| Thai | 171 | 0.9% |
| Ukrainian | 61 | 0.3% |
| Welsh | 217 | 1.1% | View All 71 Rows |
Immigrants in North Myrtle Beach
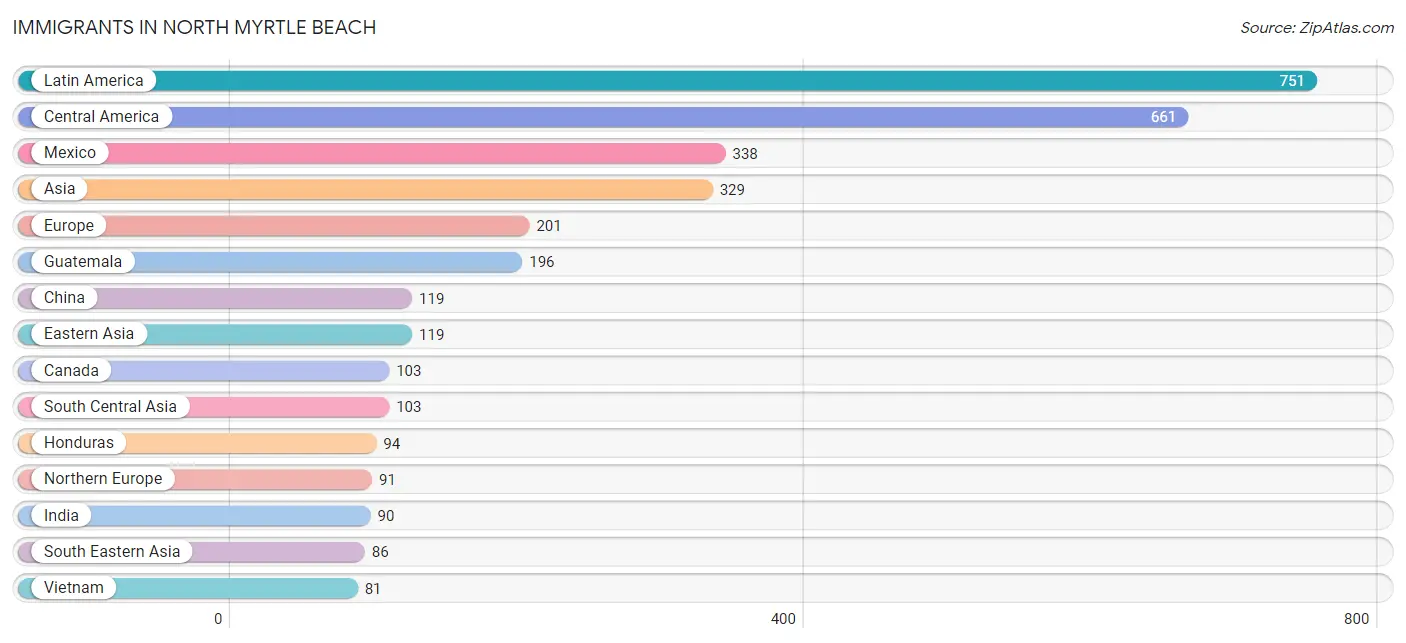
The most numerous immigrant groups reported in North Myrtle Beach came from Latin America (751 | 4.0%), Central America (661 | 3.5%), Mexico (338 | 1.8%), Asia (329 | 1.8%), and Europe (201 | 1.1%), together accounting for 12.1% of all North Myrtle Beach residents.
| Immigration Origin | # Population | % Population |
| Africa | 75 | 0.4% |
| Asia | 329 | 1.8% |
| Brazil | 30 | 0.2% |
| Canada | 103 | 0.5% |
| Caribbean | 41 | 0.2% |
| Central America | 661 | 3.5% |
| China | 119 | 0.6% |
| Colombia | 19 | 0.1% |
| Cuba | 28 | 0.2% |
| Dominican Republic | 13 | 0.1% |
| Eastern Africa | 7 | 0.0% |
| Eastern Asia | 119 | 0.6% |
| Eastern Europe | 27 | 0.1% |
| El Salvador | 21 | 0.1% |
| England | 20 | 0.1% |
| Europe | 201 | 1.1% |
| France | 8 | 0.0% |
| Germany | 27 | 0.1% |
| Guatemala | 196 | 1.0% |
| Honduras | 94 | 0.5% |
| India | 90 | 0.5% |
| Iran | 13 | 0.1% |
| Iraq | 7 | 0.0% |
| Israel | 14 | 0.1% |
| Latin America | 751 | 4.0% |
| Lithuania | 4 | 0.0% |
| Mexico | 338 | 1.8% |
| Netherlands | 13 | 0.1% |
| Northern Europe | 91 | 0.5% |
| Panama | 12 | 0.1% |
| Portugal | 26 | 0.1% |
| Russia | 7 | 0.0% |
| South Africa | 68 | 0.4% |
| South America | 49 | 0.3% |
| South Central Asia | 103 | 0.5% |
| South Eastern Asia | 86 | 0.5% |
| Southern Europe | 35 | 0.2% |
| Spain | 9 | 0.1% |
| Thailand | 5 | 0.0% |
| Ukraine | 16 | 0.1% |
| Vietnam | 81 | 0.4% |
| Western Asia | 21 | 0.1% |
| Western Europe | 48 | 0.3% | View All 43 Rows |
Sex and Age in North Myrtle Beach
Sex and Age in North Myrtle Beach
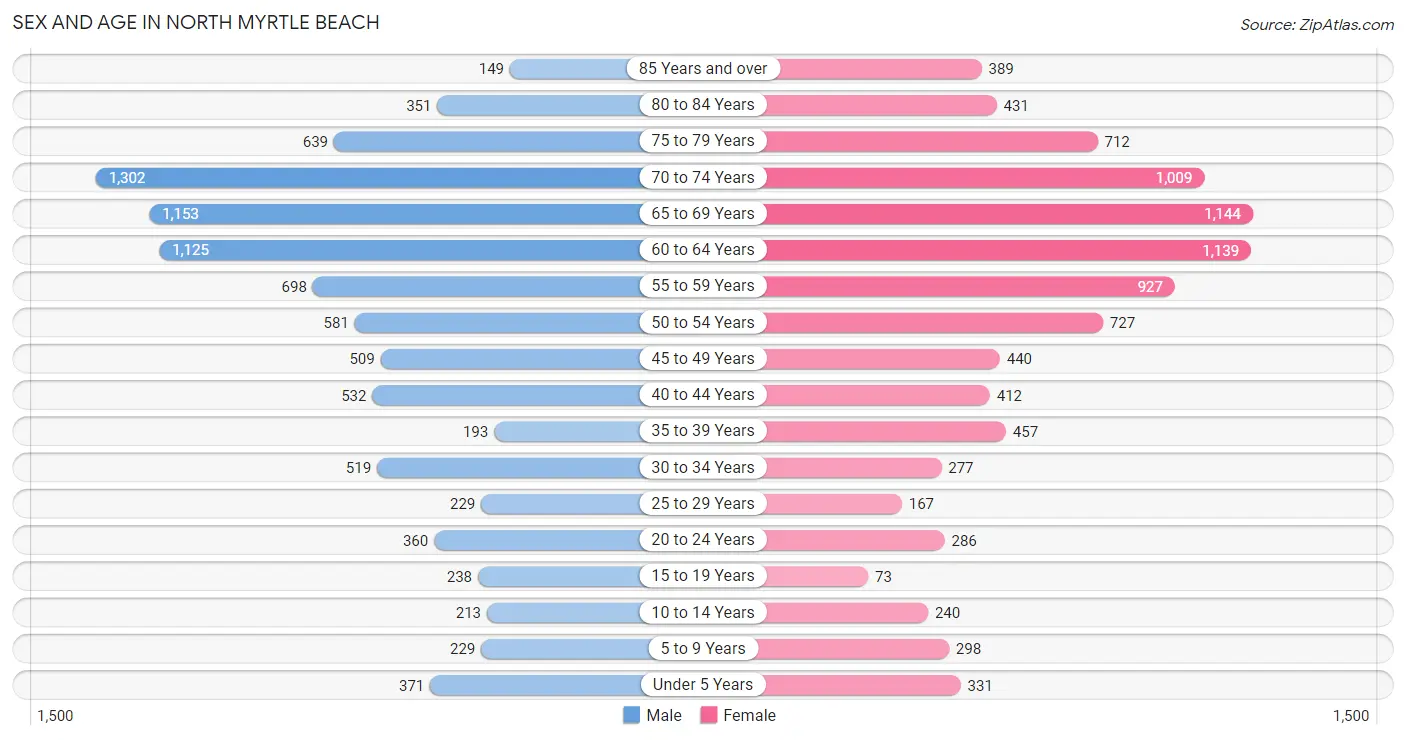
The most populous age groups in North Myrtle Beach are 70 to 74 Years (1,302 | 13.9%) for men and 65 to 69 Years (1,144 | 12.1%) for women.
| Age Bracket | Male | Female |
| Under 5 Years | 371 (4.0%) | 331 (3.5%) |
| 5 to 9 Years | 229 (2.4%) | 298 (3.2%) |
| 10 to 14 Years | 213 (2.3%) | 240 (2.5%) |
| 15 to 19 Years | 238 (2.5%) | 73 (0.8%) |
| 20 to 24 Years | 360 (3.8%) | 286 (3.0%) |
| 25 to 29 Years | 229 (2.4%) | 167 (1.8%) |
| 30 to 34 Years | 519 (5.5%) | 277 (2.9%) |
| 35 to 39 Years | 193 (2.1%) | 457 (4.8%) |
| 40 to 44 Years | 532 (5.7%) | 412 (4.4%) |
| 45 to 49 Years | 509 (5.4%) | 440 (4.6%) |
| 50 to 54 Years | 581 (6.2%) | 727 (7.7%) |
| 55 to 59 Years | 698 (7.4%) | 927 (9.8%) |
| 60 to 64 Years | 1,125 (12.0%) | 1,139 (12.0%) |
| 65 to 69 Years | 1,153 (12.3%) | 1,144 (12.1%) |
| 70 to 74 Years | 1,302 (13.9%) | 1,009 (10.7%) |
| 75 to 79 Years | 639 (6.8%) | 712 (7.5%) |
| 80 to 84 Years | 351 (3.7%) | 431 (4.6%) |
| 85 Years and over | 149 (1.6%) | 389 (4.1%) |
| Total | 9,391 (100.0%) | 9,459 (100.0%) |
Families and Households in North Myrtle Beach
Median Family Size in North Myrtle Beach
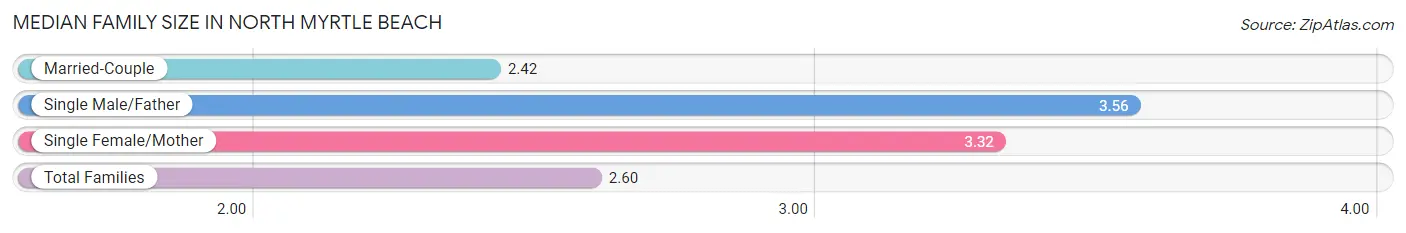
The median family size in North Myrtle Beach is 2.60 persons per family, with single male/father families (163 | 3.0%) accounting for the largest median family size of 3.56 persons per family. On the other hand, married-couple families (4,459 | 80.9%) represent the smallest median family size with 2.42 persons per family.
| Family Type | # Families | Family Size |
| Married-Couple | 4,459 (80.9%) | 2.42 |
| Single Male/Father | 163 (3.0%) | 3.56 |
| Single Female/Mother | 886 (16.1%) | 3.32 |
| Total Families | 5,508 (100.0%) | 2.60 |
Median Household Size in North Myrtle Beach
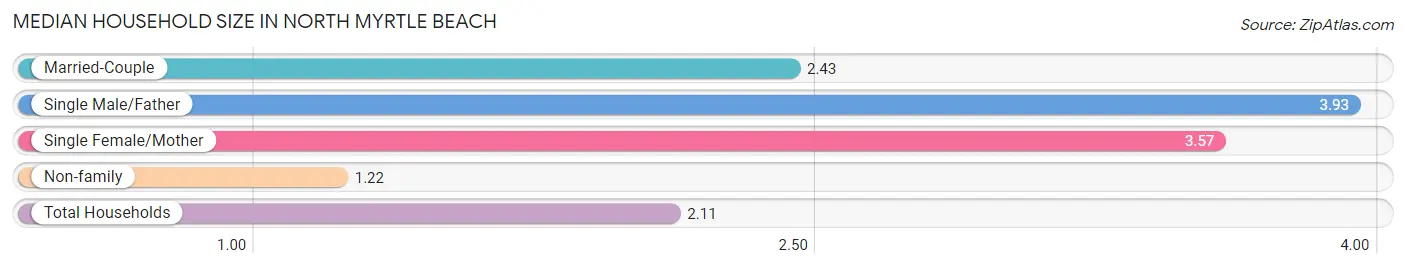
The median household size in North Myrtle Beach is 2.11 persons per household, with single male/father households (163 | 1.8%) accounting for the largest median household size of 3.93 persons per household. non-family households (3,435 | 38.4%) represent the smallest median household size with 1.22 persons per household.
| Household Type | # Households | Household Size |
| Married-Couple | 4,459 (49.9%) | 2.43 |
| Single Male/Father | 163 (1.8%) | 3.93 |
| Single Female/Mother | 886 (9.9%) | 3.57 |
| Non-family | 3,435 (38.4%) | 1.22 |
| Total Households | 8,943 (100.0%) | 2.11 |
Household Size by Marriage Status in North Myrtle Beach
Out of a total of 8,943 households in North Myrtle Beach, 5,508 (61.6%) are family households, while 3,435 (38.4%) are nonfamily households. The most numerous type of family households are 2-person households, comprising 4,130, and the most common type of nonfamily households are 1-person households, comprising 2,865.
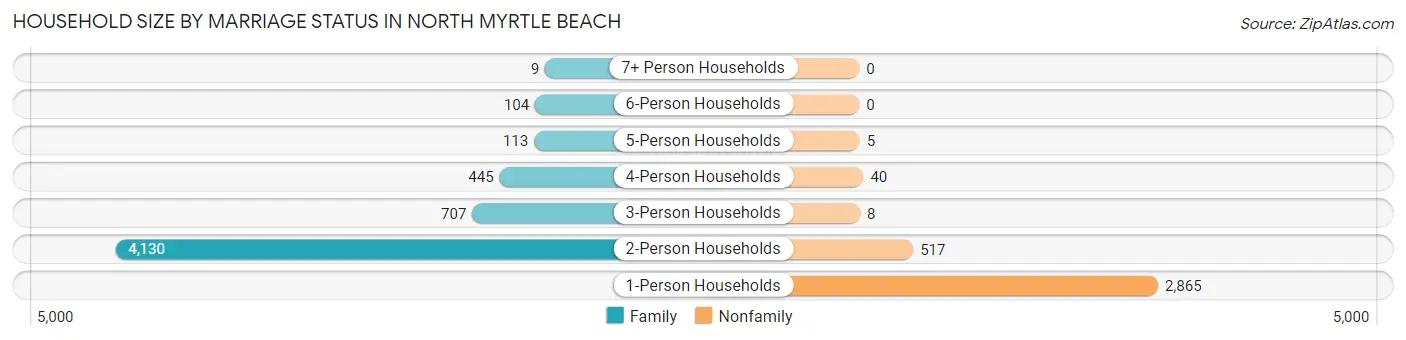
| Household Size | Family Households | Nonfamily Households |
| 1-Person Households | - | 2,865 (32.0%) |
| 2-Person Households | 4,130 (46.2%) | 517 (5.8%) |
| 3-Person Households | 707 (7.9%) | 8 (0.1%) |
| 4-Person Households | 445 (5.0%) | 40 (0.4%) |
| 5-Person Households | 113 (1.3%) | 5 (0.1%) |
| 6-Person Households | 104 (1.2%) | 0 (0.0%) |
| 7+ Person Households | 9 (0.1%) | 0 (0.0%) |
| Total | 5,508 (61.6%) | 3,435 (38.4%) |
Female Fertility in North Myrtle Beach
Fertility by Age in North Myrtle Beach
Average fertility rate in North Myrtle Beach is 23.0 births per 1,000 women. Women in the age bracket of 20 to 34 years have the highest fertility rate with 47.0 births per 1,000 women. Women in the age bracket of 20 to 34 years acount for 65.4% of all women with births.
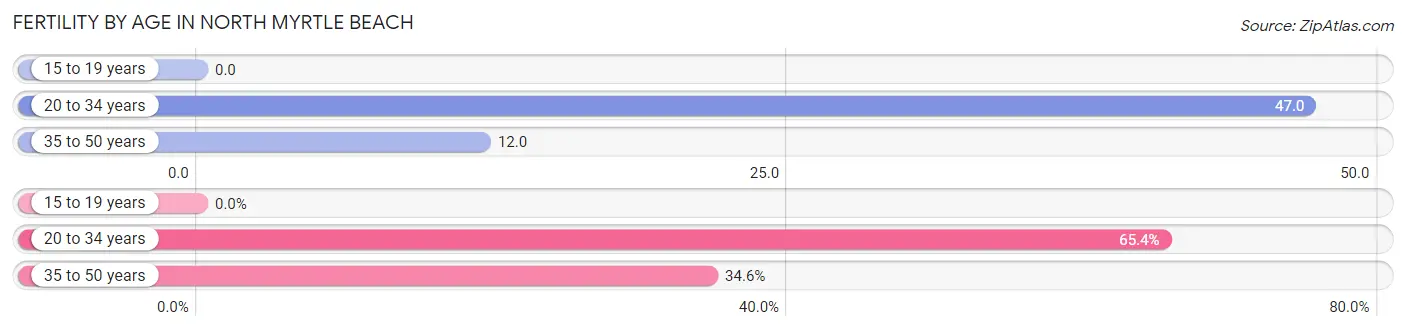
| Age Bracket | Women with Births | Births / 1,000 Women |
| 15 to 19 years | 0 (0.0%) | 0.0 |
| 20 to 34 years | 34 (65.4%) | 47.0 |
| 35 to 50 years | 18 (34.6%) | 12.0 |
| Total | 52 (100.0%) | 23.0 |
Fertility by Age by Marriage Status in North Myrtle Beach
88.5% of women with births (52) in North Myrtle Beach are married. The highest percentage of unmarried women with births falls into 20 to 34 years age bracket with 17.6% of them unmarried at the time of birth, while the lowest percentage of unmarried women with births belong to 35 to 50 years age bracket with 0.0% of them unmarried.
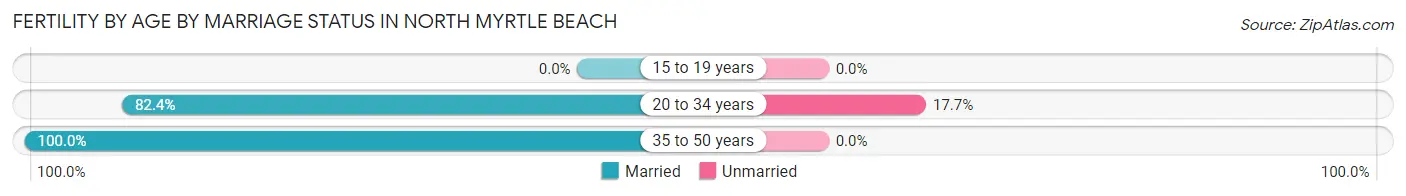
| Age Bracket | Married | Unmarried |
| 15 to 19 years | 0 (0.0%) | 0 (0.0%) |
| 20 to 34 years | 28 (82.4%) | 6 (17.6%) |
| 35 to 50 years | 18 (100.0%) | 0 (0.0%) |
| Total | 46 (88.5%) | 6 (11.5%) |
Fertility by Education in North Myrtle Beach
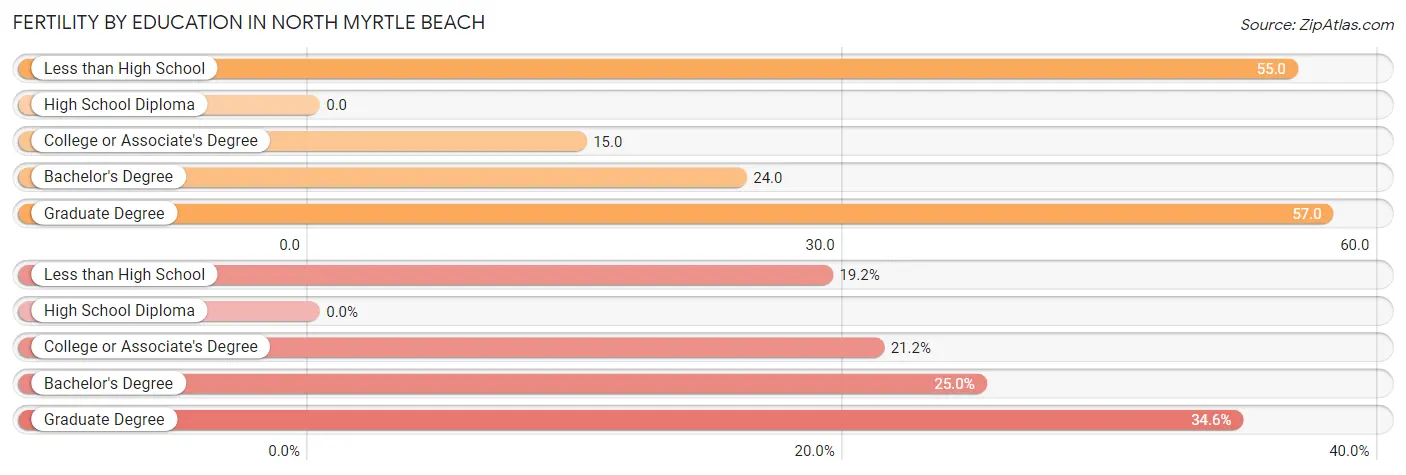
| Educational Attainment | Women with Births | Births / 1,000 Women |
| Less than High School | 10 (19.2%) | 55.0 |
| High School Diploma | 0 (0.0%) | 0.0 |
| College or Associate's Degree | 11 (21.1%) | 15.0 |
| Bachelor's Degree | 13 (25.0%) | 24.0 |
| Graduate Degree | 18 (34.6%) | 57.0 |
| Total | 52 (100.0%) | 23.0 |
Fertility by Education by Marriage Status in North Myrtle Beach
11.5% of women with births in North Myrtle Beach are unmarried. Women with the educational attainment of less than high school are most likely to be married with 100.0% of them married at childbirth, while women with the educational attainment of college or associate's degree are least likely to be married with 54.5% of them unmarried at childbirth.
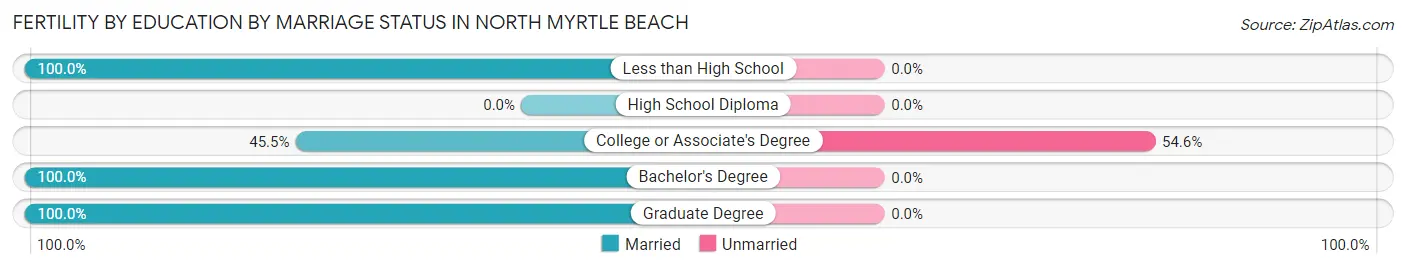
| Educational Attainment | Married | Unmarried |
| Less than High School | 10 (100.0%) | 0 (0.0%) |
| High School Diploma | 0 (0.0%) | 0 (0.0%) |
| College or Associate's Degree | 5 (45.5%) | 6 (54.5%) |
| Bachelor's Degree | 13 (100.0%) | 0 (0.0%) |
| Graduate Degree | 18 (100.0%) | 0 (0.0%) |
| Total | 46 (88.5%) | 6 (11.5%) |
Employment Characteristics in North Myrtle Beach
Employment by Class of Employer in North Myrtle Beach
Among the 7,715 employed individuals in North Myrtle Beach, private company employees (5,151 | 66.8%), self-employed (not incorporated) (921 | 11.9%), and self-employed (incorporated) (597 | 7.7%) make up the most common classes of employment.
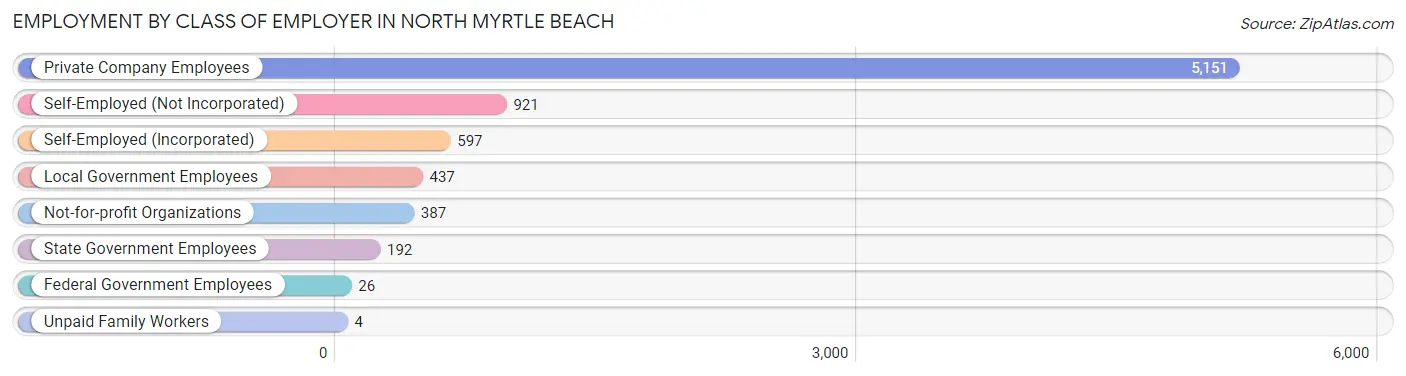
| Employer Class | # Employees | % Employees |
| Private Company Employees | 5,151 | 66.8% |
| Self-Employed (Incorporated) | 597 | 7.7% |
| Self-Employed (Not Incorporated) | 921 | 11.9% |
| Not-for-profit Organizations | 387 | 5.0% |
| Local Government Employees | 437 | 5.7% |
| State Government Employees | 192 | 2.5% |
| Federal Government Employees | 26 | 0.3% |
| Unpaid Family Workers | 4 | 0.1% |
| Total | 7,715 | 100.0% |
Employment Status by Age in North Myrtle Beach
According to the labor force statistics for North Myrtle Beach, out of the total population over 16 years of age (17,085), 49.3% or 8,423 individuals are in the labor force, with 6.4% or 539 of them unemployed. The age group with the highest labor force participation rate is 35 to 44 years, with 89.1% or 1,420 individuals in the labor force. Within the labor force, the 16 to 19 years age range has the highest percentage of unemployed individuals, with 13.0% or 20 of them being unemployed.
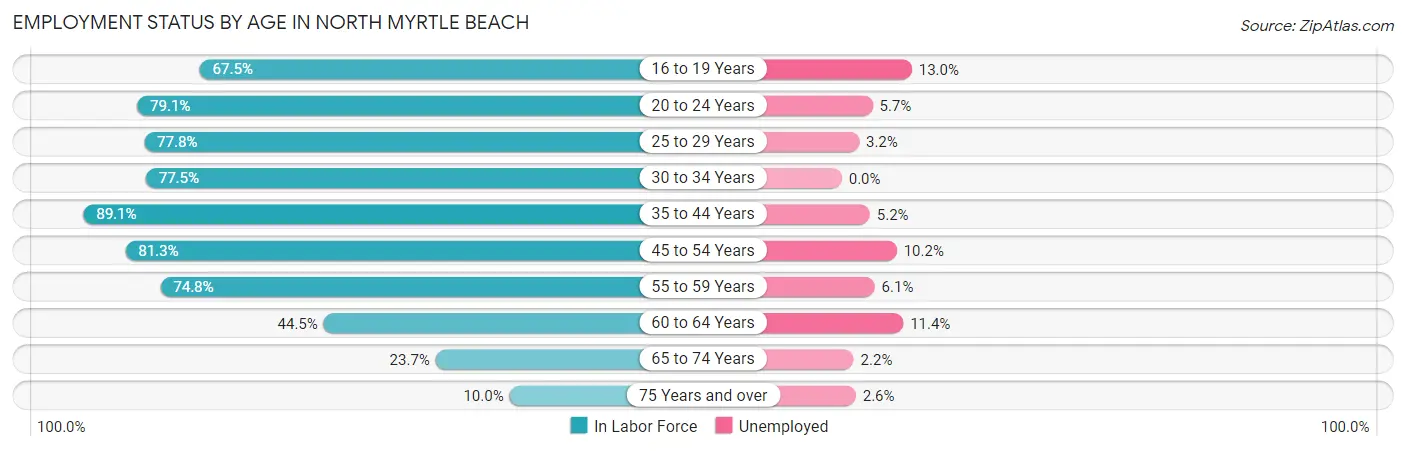
| Age Bracket | In Labor Force | Unemployed |
| 16 to 19 Years | 154 (67.5%) | 20 (13.0%) |
| 20 to 24 Years | 511 (79.1%) | 29 (5.7%) |
| 25 to 29 Years | 308 (77.8%) | 10 (3.2%) |
| 30 to 34 Years | 617 (77.5%) | 0 (0.0%) |
| 35 to 44 Years | 1,420 (89.1%) | 74 (5.2%) |
| 45 to 54 Years | 1,835 (81.3%) | 187 (10.2%) |
| 55 to 59 Years | 1,216 (74.8%) | 74 (6.1%) |
| 60 to 64 Years | 1,007 (44.5%) | 115 (11.4%) |
| 65 to 74 Years | 1,092 (23.7%) | 24 (2.2%) |
| 75 Years and over | 267 (10.0%) | 7 (2.6%) |
| Total | 8,423 (49.3%) | 539 (6.4%) |
Employment Status by Educational Attainment in North Myrtle Beach
According to labor force statistics for North Myrtle Beach, 71.7% of individuals (6,404) out of the total population between 25 and 64 years of age (8,932) are in the labor force, with 7.2% or 461 of them being unemployed. The group with the highest labor force participation rate are those with the educational attainment of college / associate degree, with 72.8% or 1,941 individuals in the labor force. Within the labor force, individuals with less than high school education have the highest percentage of unemployment, with 10.0% or 44 of them being unemployed.
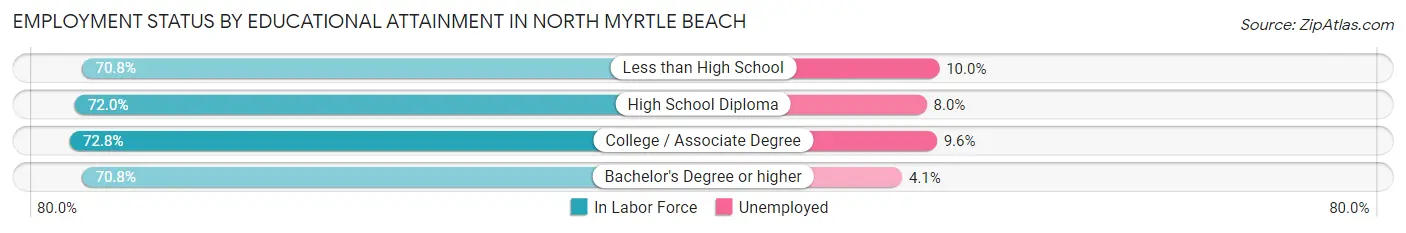
| Educational Attainment | In Labor Force | Unemployed |
| Less than High School | 439 (70.8%) | 62 (10.0%) |
| High School Diploma | 1,630 (72.0%) | 181 (8.0%) |
| College / Associate Degree | 1,941 (72.8%) | 256 (9.6%) |
| Bachelor's Degree or higher | 2,394 (70.8%) | 139 (4.1%) |
| Total | 6,404 (71.7%) | 643 (7.2%) |
Employment Occupations by Sex in North Myrtle Beach
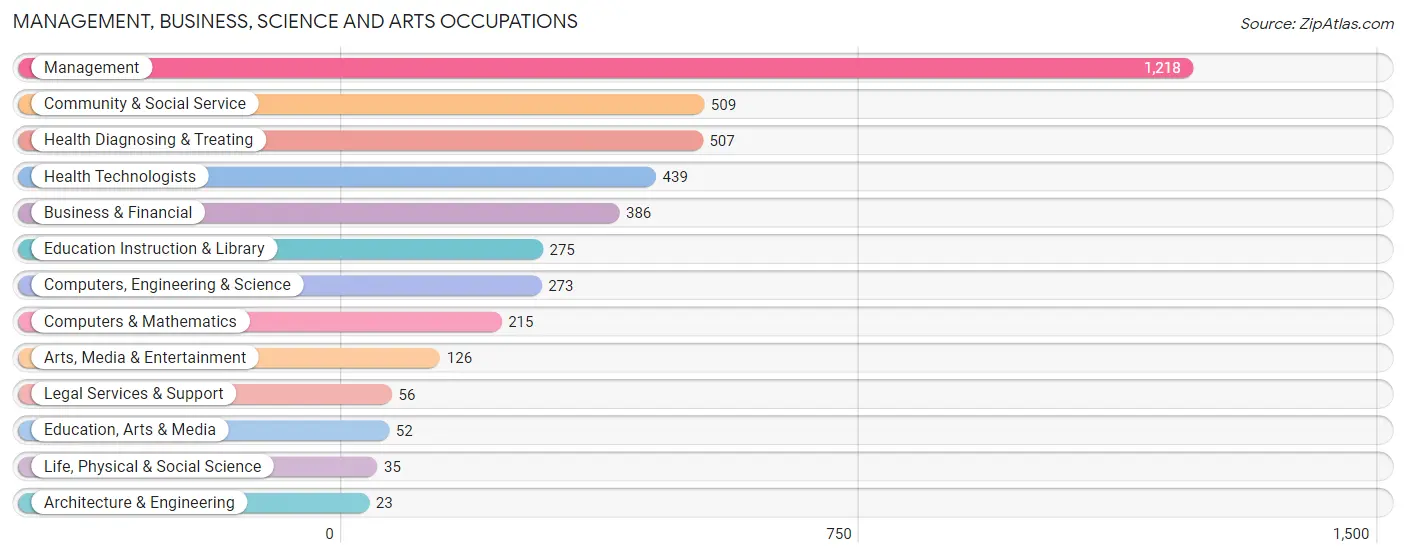
Management, Business, Science and Arts Occupations
The most common Management, Business, Science and Arts occupations in North Myrtle Beach are Management (1,218 | 15.4%), Community & Social Service (509 | 6.5%), Health Diagnosing & Treating (507 | 6.4%), Health Technologists (439 | 5.6%), and Business & Financial (386 | 4.9%).
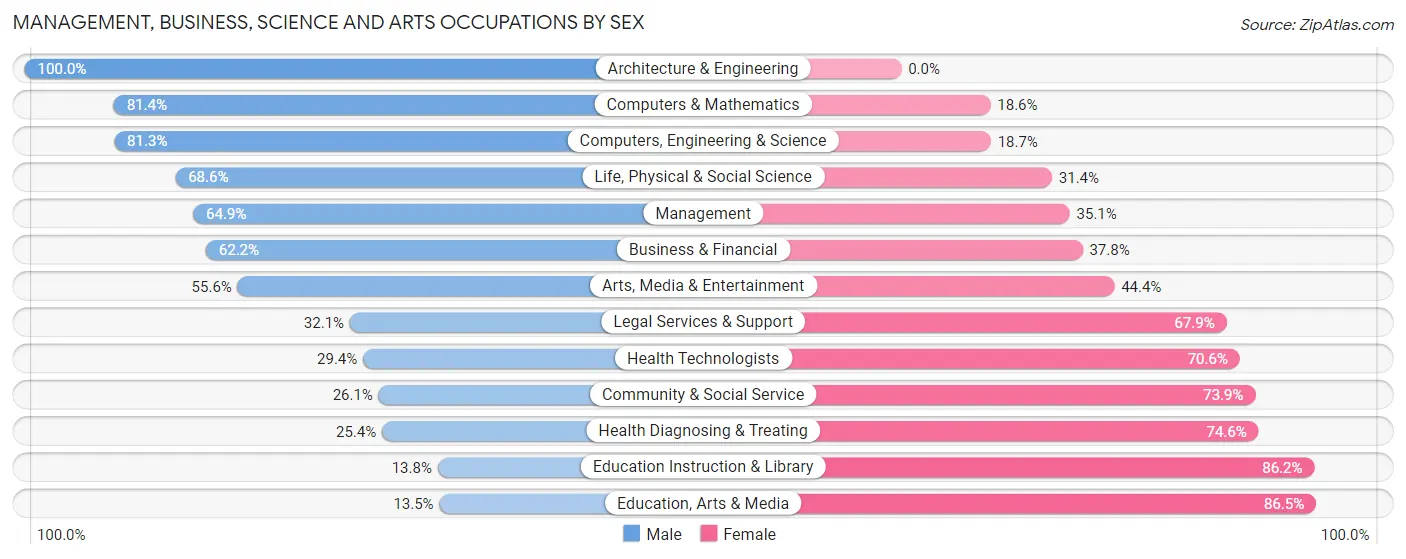
Management, Business, Science and Arts Occupations by Sex
Within the Management, Business, Science and Arts occupations in North Myrtle Beach, the most male-oriented occupations are Architecture & Engineering (100.0%), Computers & Mathematics (81.4%), and Computers, Engineering & Science (81.3%), while the most female-oriented occupations are Education, Arts & Media (86.5%), Education Instruction & Library (86.2%), and Health Diagnosing & Treating (74.6%).
| Occupation | Male | Female |
| Management | 790 (64.9%) | 428 (35.1%) |
| Business & Financial | 240 (62.2%) | 146 (37.8%) |
| Computers, Engineering & Science | 222 (81.3%) | 51 (18.7%) |
| Computers & Mathematics | 175 (81.4%) | 40 (18.6%) |
| Architecture & Engineering | 23 (100.0%) | 0 (0.0%) |
| Life, Physical & Social Science | 24 (68.6%) | 11 (31.4%) |
| Community & Social Service | 133 (26.1%) | 376 (73.9%) |
| Education, Arts & Media | 7 (13.5%) | 45 (86.5%) |
| Legal Services & Support | 18 (32.1%) | 38 (67.9%) |
| Education Instruction & Library | 38 (13.8%) | 237 (86.2%) |
| Arts, Media & Entertainment | 70 (55.6%) | 56 (44.4%) |
| Health Diagnosing & Treating | 129 (25.4%) | 378 (74.6%) |
| Health Technologists | 129 (29.4%) | 310 (70.6%) |
| Total (Category) | 1,514 (52.3%) | 1,379 (47.7%) |
| Total (Overall) | 4,242 (53.8%) | 3,647 (46.2%) |
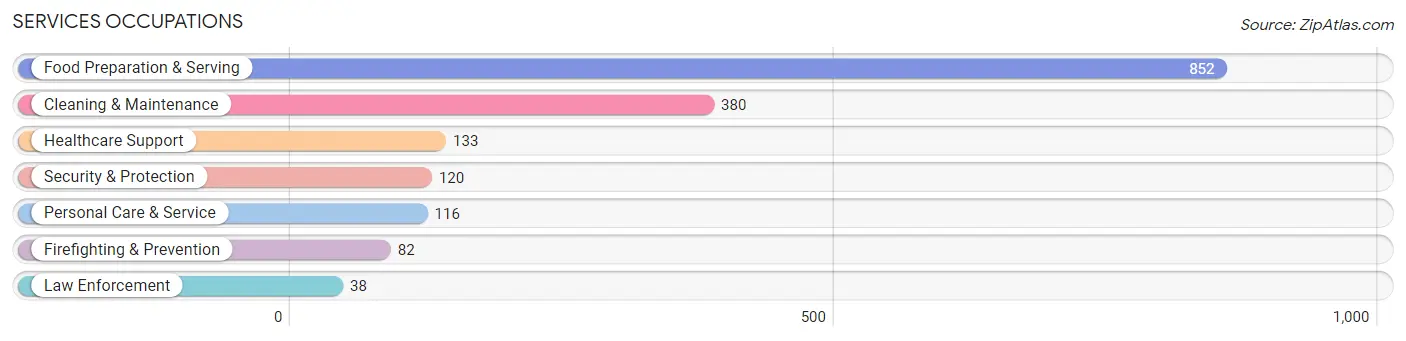
Services Occupations
The most common Services occupations in North Myrtle Beach are Food Preparation & Serving (852 | 10.8%), Cleaning & Maintenance (380 | 4.8%), Healthcare Support (133 | 1.7%), Security & Protection (120 | 1.5%), and Personal Care & Service (116 | 1.5%).
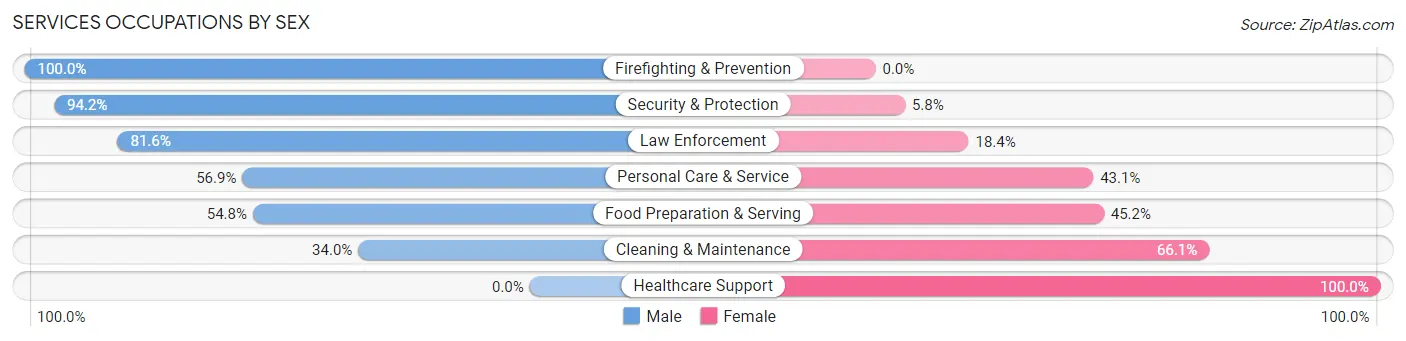
Services Occupations by Sex
Within the Services occupations in North Myrtle Beach, the most male-oriented occupations are Firefighting & Prevention (100.0%), Security & Protection (94.2%), and Law Enforcement (81.6%), while the most female-oriented occupations are Healthcare Support (100.0%), Cleaning & Maintenance (66.0%), and Food Preparation & Serving (45.2%).
| Occupation | Male | Female |
| Healthcare Support | 0 (0.0%) | 133 (100.0%) |
| Security & Protection | 113 (94.2%) | 7 (5.8%) |
| Firefighting & Prevention | 82 (100.0%) | 0 (0.0%) |
| Law Enforcement | 31 (81.6%) | 7 (18.4%) |
| Food Preparation & Serving | 467 (54.8%) | 385 (45.2%) |
| Cleaning & Maintenance | 129 (34.0%) | 251 (66.0%) |
| Personal Care & Service | 66 (56.9%) | 50 (43.1%) |
| Total (Category) | 775 (48.4%) | 826 (51.6%) |
| Total (Overall) | 4,242 (53.8%) | 3,647 (46.2%) |
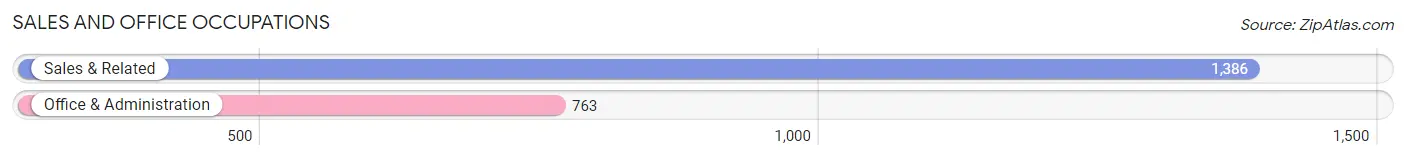
Sales and Office Occupations
The most common Sales and Office occupations in North Myrtle Beach are Sales & Related (1,386 | 17.6%), and Office & Administration (763 | 9.7%).
Sales and Office Occupations by Sex
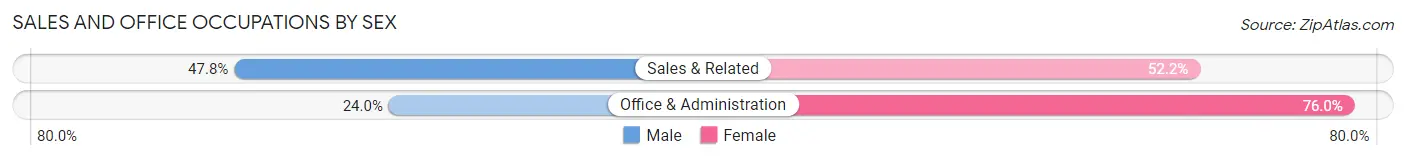
| Occupation | Male | Female |
| Sales & Related | 662 (47.8%) | 724 (52.2%) |
| Office & Administration | 183 (24.0%) | 580 (76.0%) |
| Total (Category) | 845 (39.3%) | 1,304 (60.7%) |
| Total (Overall) | 4,242 (53.8%) | 3,647 (46.2%) |
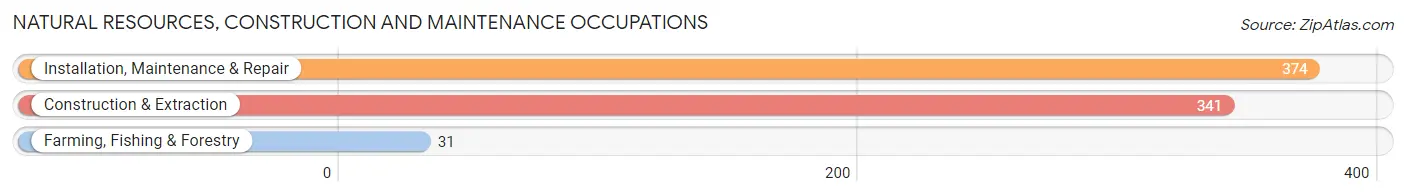
Natural Resources, Construction and Maintenance Occupations
The most common Natural Resources, Construction and Maintenance occupations in North Myrtle Beach are Installation, Maintenance & Repair (374 | 4.7%), Construction & Extraction (341 | 4.3%), and Farming, Fishing & Forestry (31 | 0.4%).
Natural Resources, Construction and Maintenance Occupations by Sex
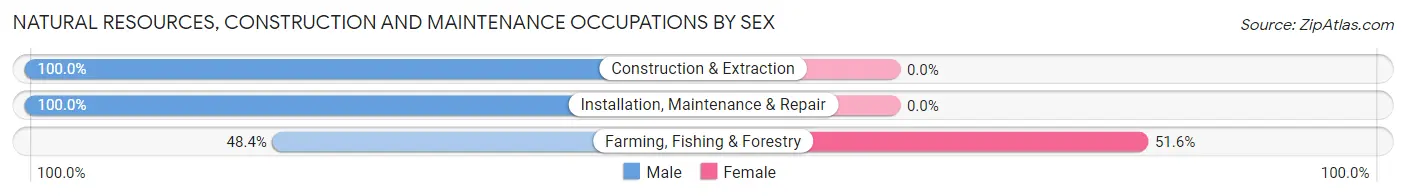
| Occupation | Male | Female |
| Farming, Fishing & Forestry | 15 (48.4%) | 16 (51.6%) |
| Construction & Extraction | 341 (100.0%) | 0 (0.0%) |
| Installation, Maintenance & Repair | 374 (100.0%) | 0 (0.0%) |
| Total (Category) | 730 (97.9%) | 16 (2.1%) |
| Total (Overall) | 4,242 (53.8%) | 3,647 (46.2%) |
Production, Transportation and Moving Occupations
The most common Production, Transportation and Moving occupations in North Myrtle Beach are Transportation (226 | 2.9%), Production (160 | 2.0%), and Material Moving (114 | 1.5%).
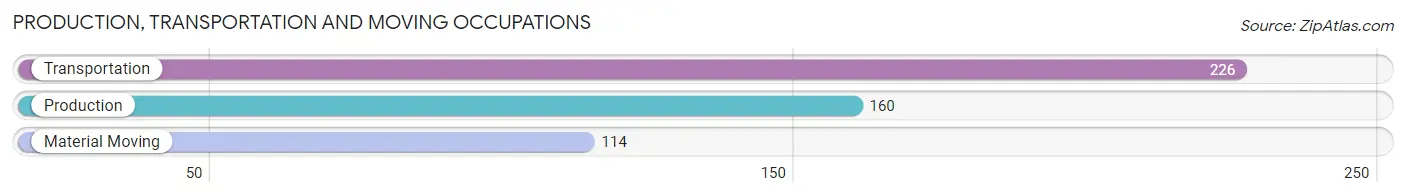
Production, Transportation and Moving Occupations by Sex
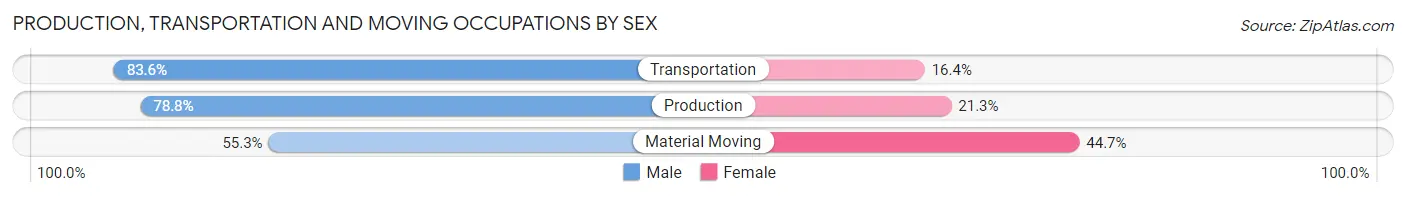
| Occupation | Male | Female |
| Production | 126 (78.7%) | 34 (21.2%) |
| Transportation | 189 (83.6%) | 37 (16.4%) |
| Material Moving | 63 (55.3%) | 51 (44.7%) |
| Total (Category) | 378 (75.6%) | 122 (24.4%) |
| Total (Overall) | 4,242 (53.8%) | 3,647 (46.2%) |
Employment Industries by Sex in North Myrtle Beach
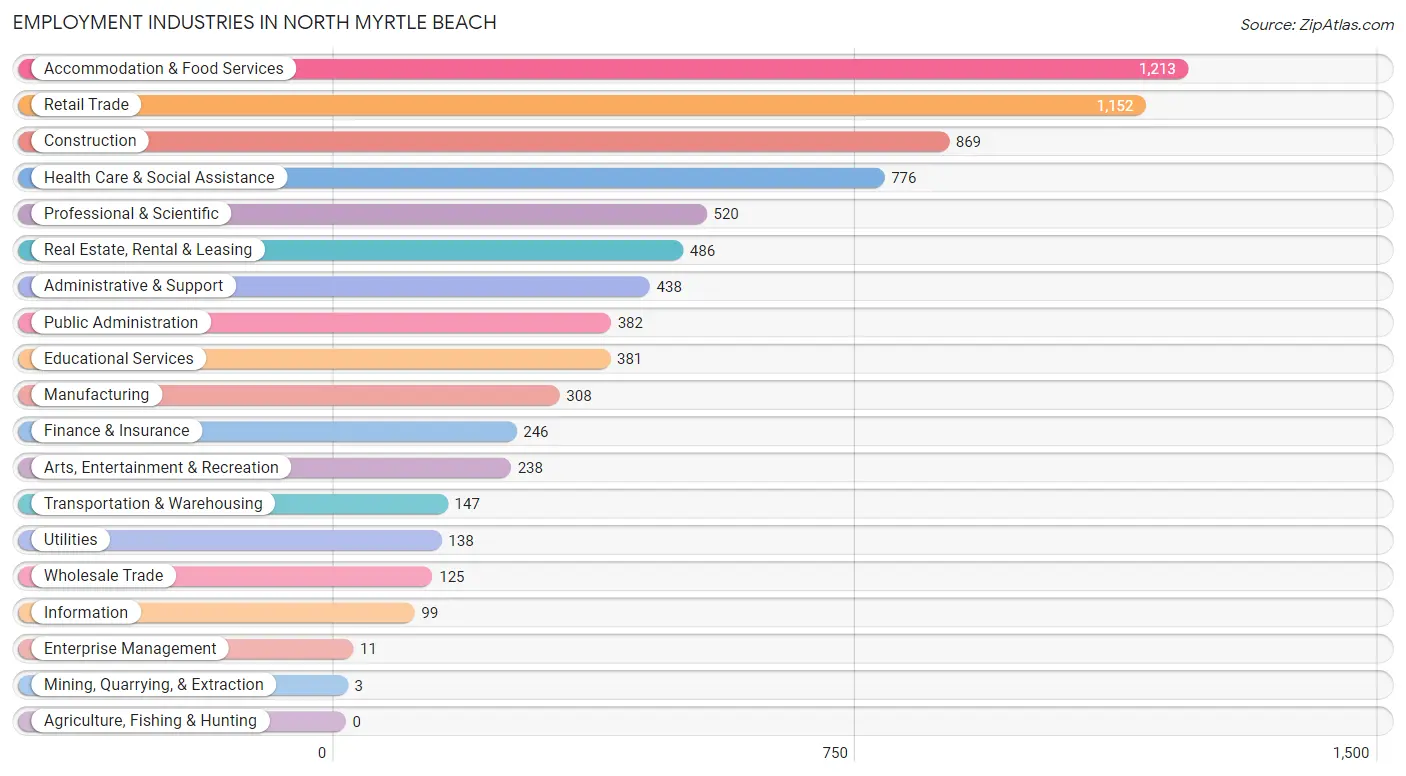
Employment Industries in North Myrtle Beach
The major employment industries in North Myrtle Beach include Accommodation & Food Services (1,213 | 15.4%), Retail Trade (1,152 | 14.6%), Construction (869 | 11.0%), Health Care & Social Assistance (776 | 9.8%), and Professional & Scientific (520 | 6.6%).
Employment Industries by Sex in North Myrtle Beach
The North Myrtle Beach industries that see more men than women are Mining, Quarrying, & Extraction (100.0%), Utilities (96.4%), and Transportation & Warehousing (94.6%), whereas the industries that tend to have a higher number of women are Enterprise Management (100.0%), Educational Services (85.0%), and Health Care & Social Assistance (72.6%).
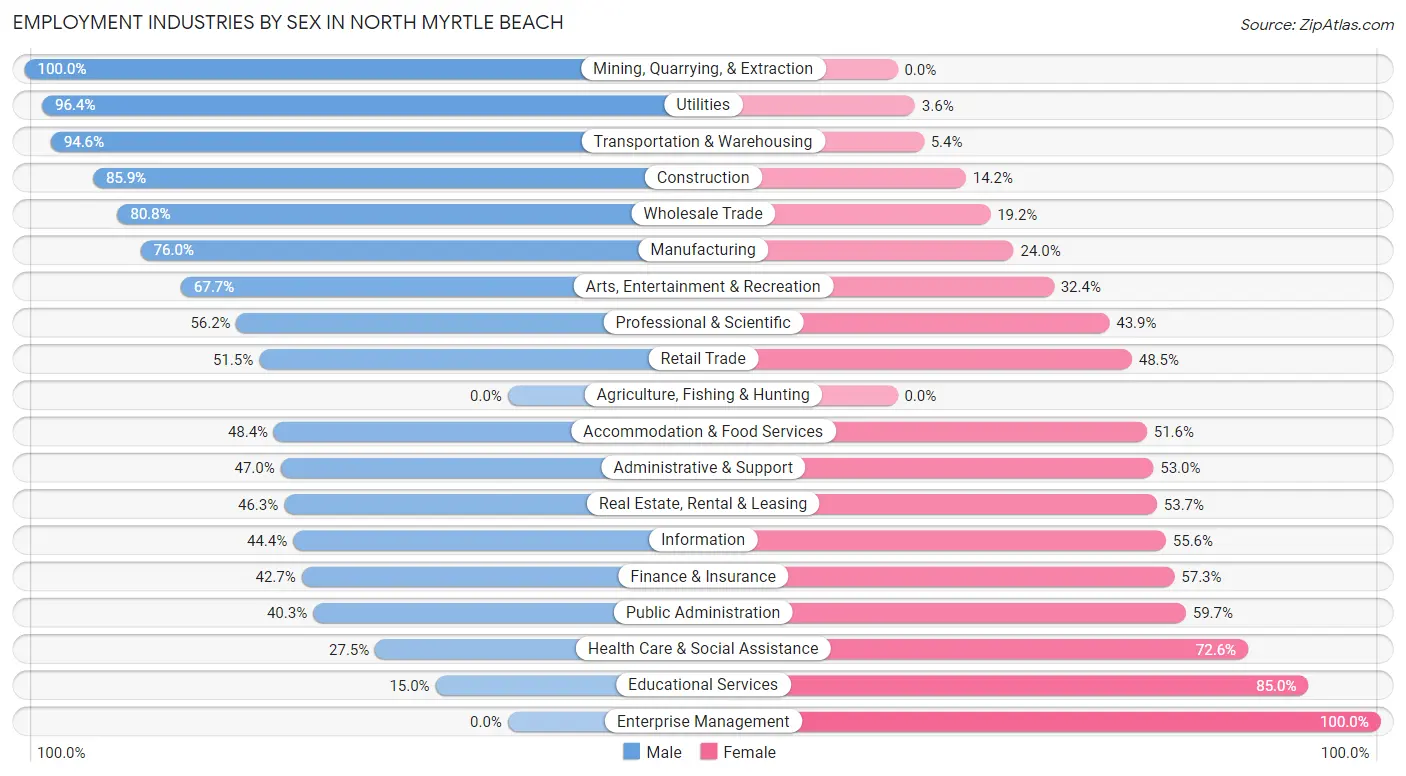
| Industry | Male | Female |
| Agriculture, Fishing & Hunting | 0 (0.0%) | 0 (0.0%) |
| Mining, Quarrying, & Extraction | 3 (100.0%) | 0 (0.0%) |
| Construction | 746 (85.9%) | 123 (14.1%) |
| Manufacturing | 234 (76.0%) | 74 (24.0%) |
| Wholesale Trade | 101 (80.8%) | 24 (19.2%) |
| Retail Trade | 593 (51.5%) | 559 (48.5%) |
| Transportation & Warehousing | 139 (94.6%) | 8 (5.4%) |
| Utilities | 133 (96.4%) | 5 (3.6%) |
| Information | 44 (44.4%) | 55 (55.6%) |
| Finance & Insurance | 105 (42.7%) | 141 (57.3%) |
| Real Estate, Rental & Leasing | 225 (46.3%) | 261 (53.7%) |
| Professional & Scientific | 292 (56.1%) | 228 (43.9%) |
| Enterprise Management | 0 (0.0%) | 11 (100.0%) |
| Administrative & Support | 206 (47.0%) | 232 (53.0%) |
| Educational Services | 57 (15.0%) | 324 (85.0%) |
| Health Care & Social Assistance | 213 (27.5%) | 563 (72.6%) |
| Arts, Entertainment & Recreation | 161 (67.6%) | 77 (32.4%) |
| Accommodation & Food Services | 587 (48.4%) | 626 (51.6%) |
| Public Administration | 154 (40.3%) | 228 (59.7%) |
| Total | 4,242 (53.8%) | 3,647 (46.2%) |
Education in North Myrtle Beach
School Enrollment in North Myrtle Beach
The most common levels of schooling among the 1,748 students in North Myrtle Beach are elementary school (413 | 23.6%), middle school (386 | 22.1%), and high school (376 | 21.5%).
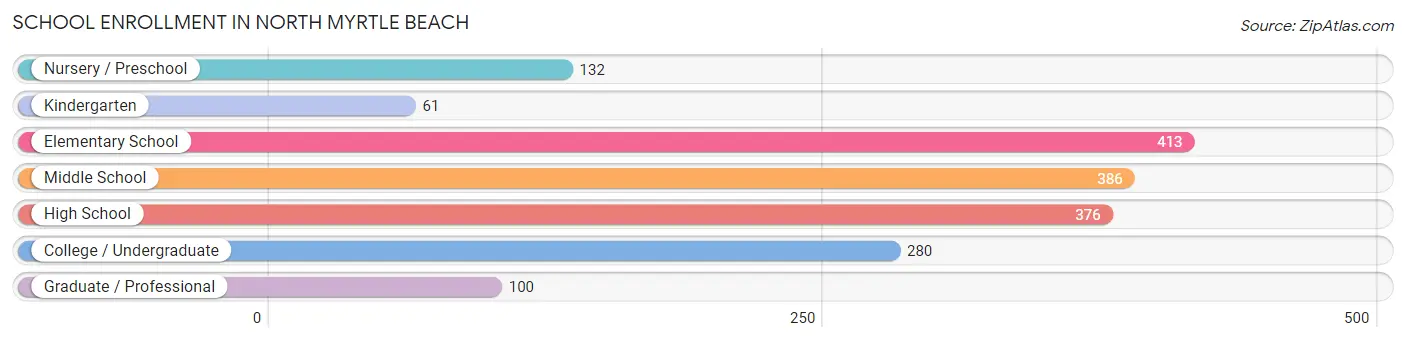
| School Level | # Students | % Students |
| Nursery / Preschool | 132 | 7.5% |
| Kindergarten | 61 | 3.5% |
| Elementary School | 413 | 23.6% |
| Middle School | 386 | 22.1% |
| High School | 376 | 21.5% |
| College / Undergraduate | 280 | 16.0% |
| Graduate / Professional | 100 | 5.7% |
| Total | 1,748 | 100.0% |
School Enrollment by Age by Funding Source in North Myrtle Beach
Out of a total of 1,748 students who are enrolled in schools in North Myrtle Beach, 185 (10.6%) attend a private institution, while the remaining 1,563 (89.4%) are enrolled in public schools. The age group of 3 to 4 year olds has the highest likelihood of being enrolled in private schools, with 19 (18.3% in the age bracket) enrolled. Conversely, the age group of 25 to 34 year olds has the lowest likelihood of being enrolled in a private school, with 39 (100.0% in the age bracket) attending a public institution.
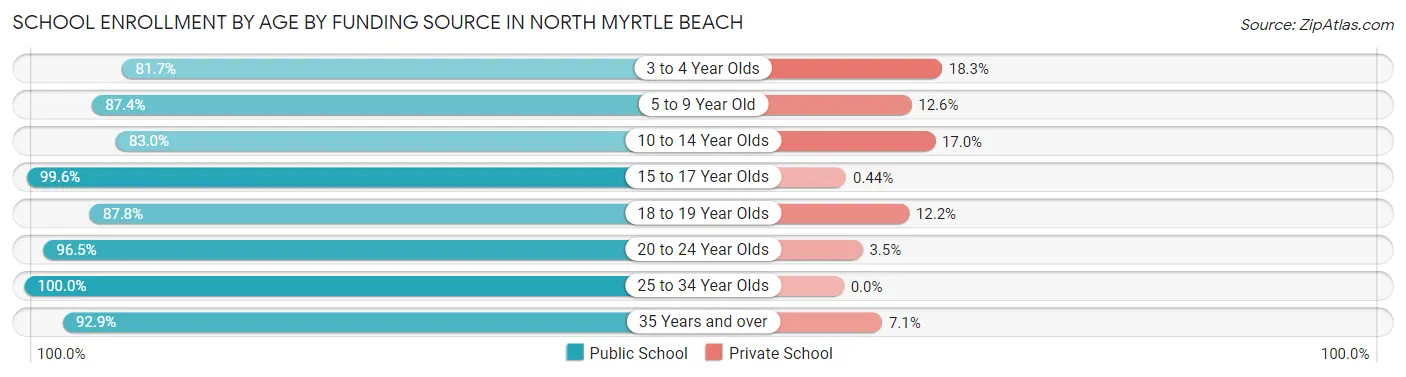
| Age Bracket | Public School | Private School |
| 3 to 4 Year Olds | 85 (81.7%) | 19 (18.3%) |
| 5 to 9 Year Old | 423 (87.4%) | 61 (12.6%) |
| 10 to 14 Year Olds | 376 (83.0%) | 77 (17.0%) |
| 15 to 17 Year Olds | 225 (99.6%) | 1 (0.4%) |
| 18 to 19 Year Olds | 65 (87.8%) | 9 (12.2%) |
| 20 to 24 Year Olds | 193 (96.5%) | 7 (3.5%) |
| 25 to 34 Year Olds | 39 (100.0%) | 0 (0.0%) |
| 35 Years and over | 156 (92.9%) | 12 (7.1%) |
| Total | 1,563 (89.4%) | 185 (10.6%) |
Educational Attainment by Field of Study in North Myrtle Beach
Business (1,749 | 26.2%), education (1,226 | 18.3%), arts & humanities (444 | 6.6%), science & technology (424 | 6.3%), and bio, nature & agricultural (380 | 5.7%) are the most common fields of study among 6,686 individuals in North Myrtle Beach who have obtained a bachelor's degree or higher.
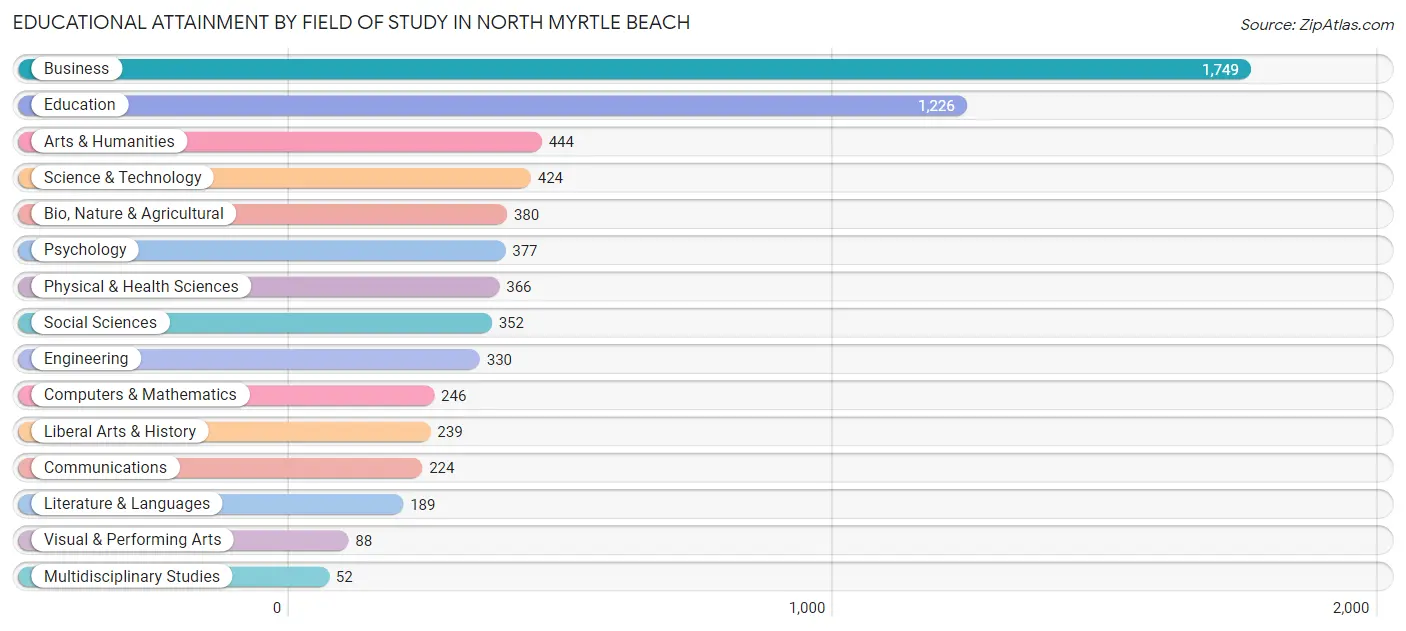
| Field of Study | # Graduates | % Graduates |
| Computers & Mathematics | 246 | 3.7% |
| Bio, Nature & Agricultural | 380 | 5.7% |
| Physical & Health Sciences | 366 | 5.5% |
| Psychology | 377 | 5.6% |
| Social Sciences | 352 | 5.3% |
| Engineering | 330 | 4.9% |
| Multidisciplinary Studies | 52 | 0.8% |
| Science & Technology | 424 | 6.3% |
| Business | 1,749 | 26.2% |
| Education | 1,226 | 18.3% |
| Literature & Languages | 189 | 2.8% |
| Liberal Arts & History | 239 | 3.6% |
| Visual & Performing Arts | 88 | 1.3% |
| Communications | 224 | 3.4% |
| Arts & Humanities | 444 | 6.6% |
| Total | 6,686 | 100.0% |
Transportation & Commute in North Myrtle Beach
Vehicle Availability by Sex in North Myrtle Beach
The most prevalent vehicle ownership categories in North Myrtle Beach are males with 2 vehicles (2,015, accounting for 48.6%) and females with 2 vehicles (1,784, making up 56.4%).
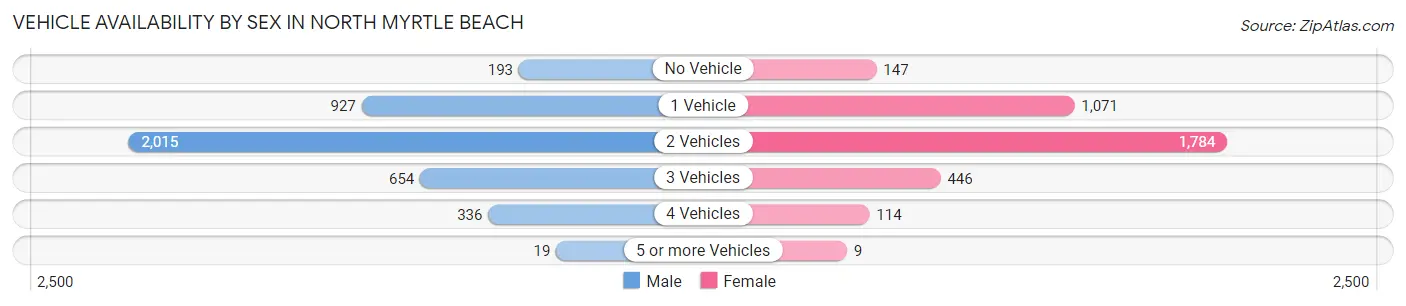
| Vehicles Available | Male | Female |
| No Vehicle | 193 (4.7%) | 147 (4.1%) |
| 1 Vehicle | 927 (22.4%) | 1,071 (30.0%) |
| 2 Vehicles | 2,015 (48.6%) | 1,784 (50.0%) |
| 3 Vehicles | 654 (15.8%) | 446 (12.5%) |
| 4 Vehicles | 336 (8.1%) | 114 (3.2%) |
| 5 or more Vehicles | 19 (0.5%) | 9 (0.3%) |
| Total | 4,144 (100.0%) | 3,571 (100.0%) |
Commute Time in North Myrtle Beach
The most frequently occuring commute durations in North Myrtle Beach are 15 to 19 minutes (1,412 commuters, 21.1%), 20 to 24 minutes (1,240 commuters, 18.6%), and 10 to 14 minutes (1,199 commuters, 17.9%).
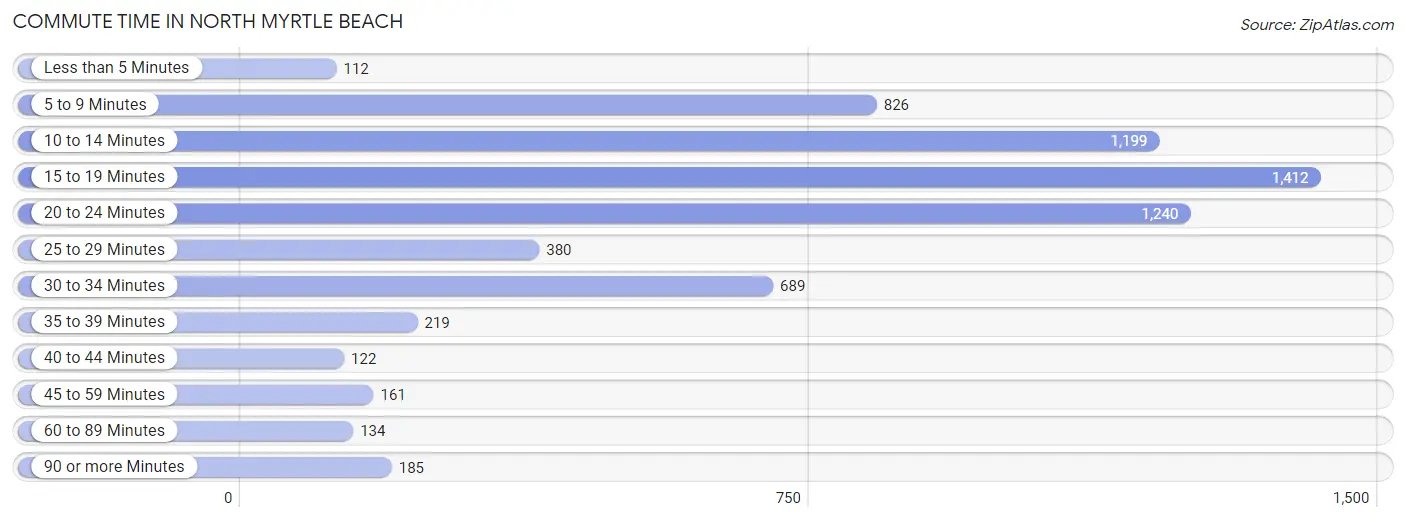
| Commute Time | # Commuters | % Commuters |
| Less than 5 Minutes | 112 | 1.7% |
| 5 to 9 Minutes | 826 | 12.4% |
| 10 to 14 Minutes | 1,199 | 17.9% |
| 15 to 19 Minutes | 1,412 | 21.1% |
| 20 to 24 Minutes | 1,240 | 18.6% |
| 25 to 29 Minutes | 380 | 5.7% |
| 30 to 34 Minutes | 689 | 10.3% |
| 35 to 39 Minutes | 219 | 3.3% |
| 40 to 44 Minutes | 122 | 1.8% |
| 45 to 59 Minutes | 161 | 2.4% |
| 60 to 89 Minutes | 134 | 2.0% |
| 90 or more Minutes | 185 | 2.8% |
Commute Time by Sex in North Myrtle Beach
The most common commute times in North Myrtle Beach are 15 to 19 minutes (839 commuters, 23.4%) for males and 15 to 19 minutes (573 commuters, 18.6%) for females.
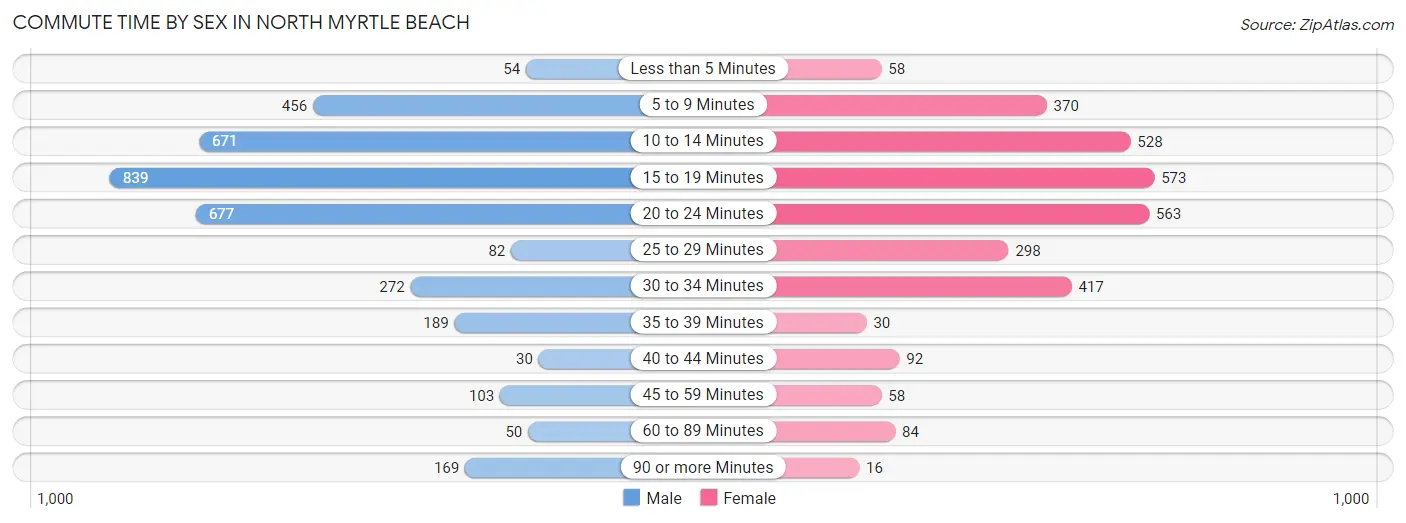
| Commute Time | Male | Female |
| Less than 5 Minutes | 54 (1.5%) | 58 (1.9%) |
| 5 to 9 Minutes | 456 (12.7%) | 370 (12.0%) |
| 10 to 14 Minutes | 671 (18.7%) | 528 (17.1%) |
| 15 to 19 Minutes | 839 (23.4%) | 573 (18.6%) |
| 20 to 24 Minutes | 677 (18.9%) | 563 (18.2%) |
| 25 to 29 Minutes | 82 (2.3%) | 298 (9.7%) |
| 30 to 34 Minutes | 272 (7.6%) | 417 (13.5%) |
| 35 to 39 Minutes | 189 (5.3%) | 30 (1.0%) |
| 40 to 44 Minutes | 30 (0.8%) | 92 (3.0%) |
| 45 to 59 Minutes | 103 (2.9%) | 58 (1.9%) |
| 60 to 89 Minutes | 50 (1.4%) | 84 (2.7%) |
| 90 or more Minutes | 169 (4.7%) | 16 (0.5%) |
Time of Departure to Work by Sex in North Myrtle Beach
The most frequent times of departure to work in North Myrtle Beach are 8:00 AM to 8:29 AM (880, 24.5%) for males and 8:00 AM to 8:29 AM (742, 24.0%) for females.
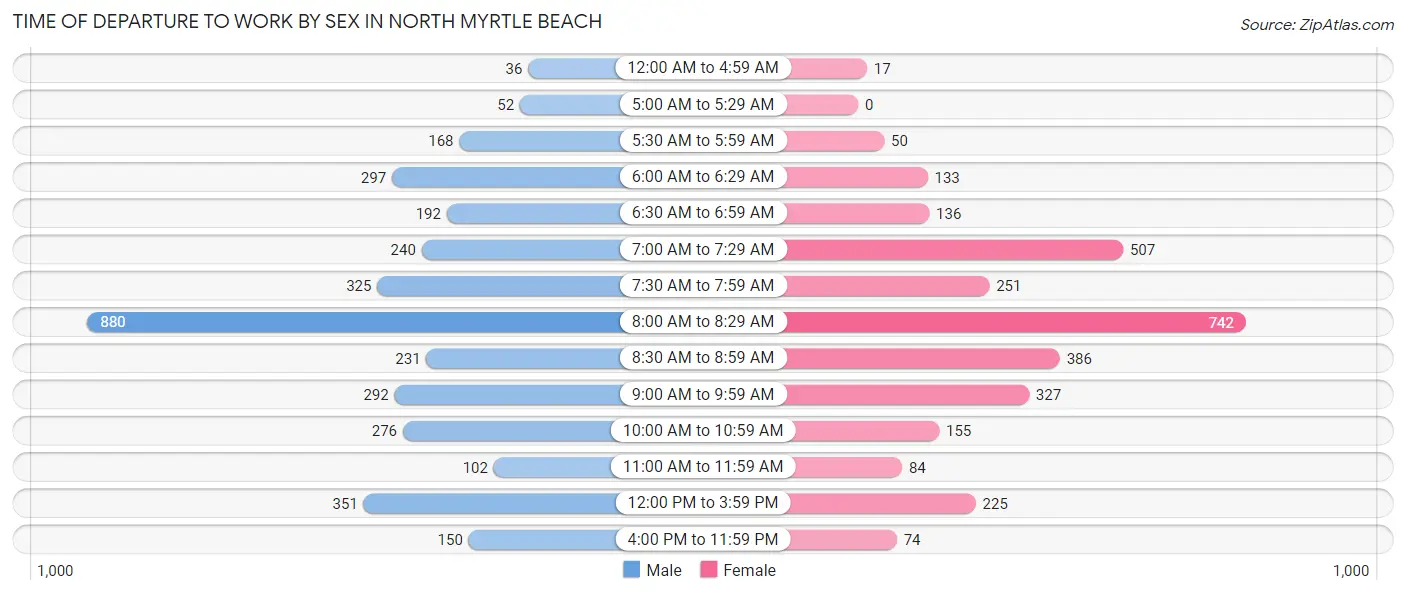
| Time of Departure | Male | Female |
| 12:00 AM to 4:59 AM | 36 (1.0%) | 17 (0.5%) |
| 5:00 AM to 5:29 AM | 52 (1.5%) | 0 (0.0%) |
| 5:30 AM to 5:59 AM | 168 (4.7%) | 50 (1.6%) |
| 6:00 AM to 6:29 AM | 297 (8.3%) | 133 (4.3%) |
| 6:30 AM to 6:59 AM | 192 (5.3%) | 136 (4.4%) |
| 7:00 AM to 7:29 AM | 240 (6.7%) | 507 (16.4%) |
| 7:30 AM to 7:59 AM | 325 (9.0%) | 251 (8.1%) |
| 8:00 AM to 8:29 AM | 880 (24.5%) | 742 (24.0%) |
| 8:30 AM to 8:59 AM | 231 (6.4%) | 386 (12.5%) |
| 9:00 AM to 9:59 AM | 292 (8.1%) | 327 (10.6%) |
| 10:00 AM to 10:59 AM | 276 (7.7%) | 155 (5.0%) |
| 11:00 AM to 11:59 AM | 102 (2.8%) | 84 (2.7%) |
| 12:00 PM to 3:59 PM | 351 (9.8%) | 225 (7.3%) |
| 4:00 PM to 11:59 PM | 150 (4.2%) | 74 (2.4%) |
| Total | 3,592 (100.0%) | 3,087 (100.0%) |
Housing Occupancy in North Myrtle Beach
Occupancy by Ownership in North Myrtle Beach
Of the total 8,943 dwellings in North Myrtle Beach, owner-occupied units account for 7,510 (84.0%), while renter-occupied units make up 1,433 (16.0%).
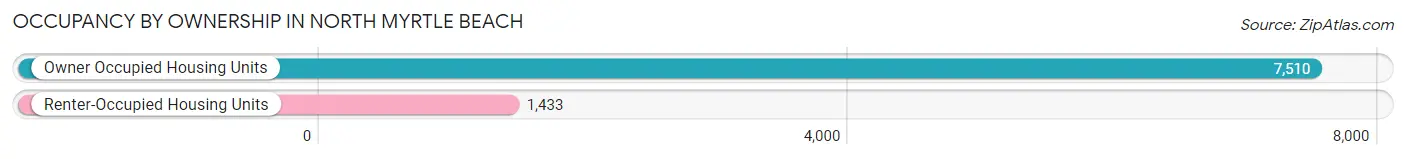
| Occupancy | # Housing Units | % Housing Units |
| Owner Occupied Housing Units | 7,510 | 84.0% |
| Renter-Occupied Housing Units | 1,433 | 16.0% |
| Total Occupied Housing Units | 8,943 | 100.0% |
Occupancy by Household Size in North Myrtle Beach
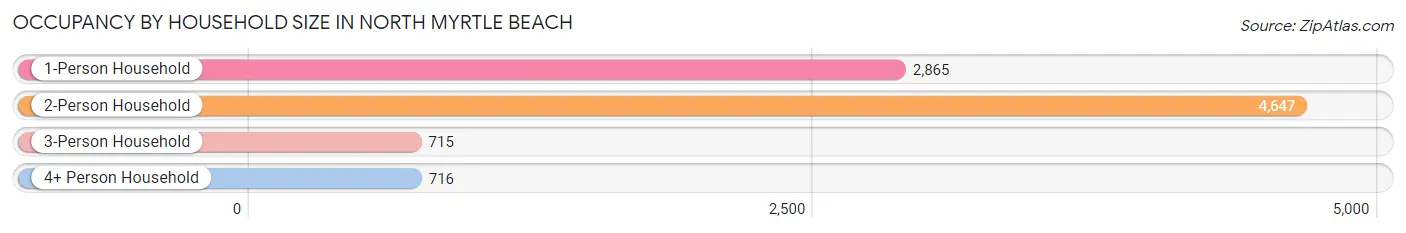
| Household Size | # Housing Units | % Housing Units |
| 1-Person Household | 2,865 | 32.0% |
| 2-Person Household | 4,647 | 52.0% |
| 3-Person Household | 715 | 8.0% |
| 4+ Person Household | 716 | 8.0% |
| Total Housing Units | 8,943 | 100.0% |
Occupancy by Ownership by Household Size in North Myrtle Beach
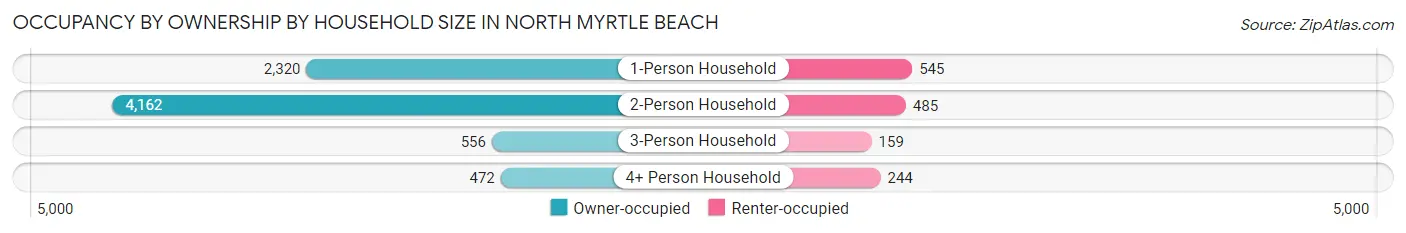
| Household Size | Owner-occupied | Renter-occupied |
| 1-Person Household | 2,320 (81.0%) | 545 (19.0%) |
| 2-Person Household | 4,162 (89.6%) | 485 (10.4%) |
| 3-Person Household | 556 (77.8%) | 159 (22.2%) |
| 4+ Person Household | 472 (65.9%) | 244 (34.1%) |
| Total Housing Units | 7,510 (84.0%) | 1,433 (16.0%) |
Occupancy by Educational Attainment in North Myrtle Beach
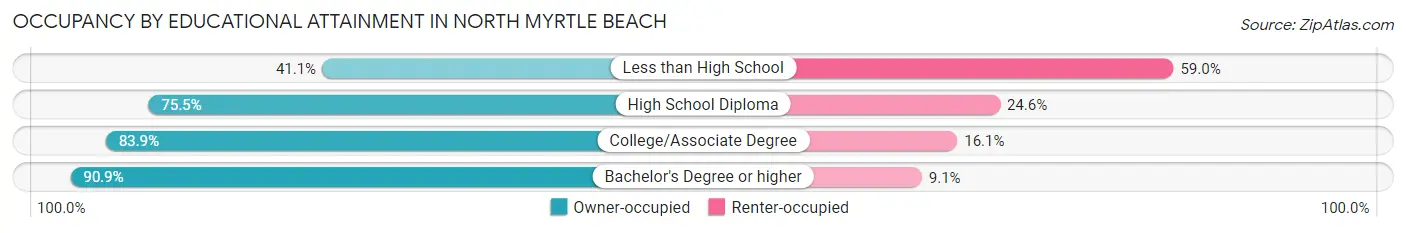
| Household Size | Owner-occupied | Renter-occupied |
| Less than High School | 117 (41.0%) | 168 (59.0%) |
| High School Diploma | 1,432 (75.4%) | 466 (24.5%) |
| College/Associate Degree | 2,226 (83.9%) | 427 (16.1%) |
| Bachelor's Degree or higher | 3,735 (90.9%) | 372 (9.1%) |
Occupancy by Age of Householder in North Myrtle Beach
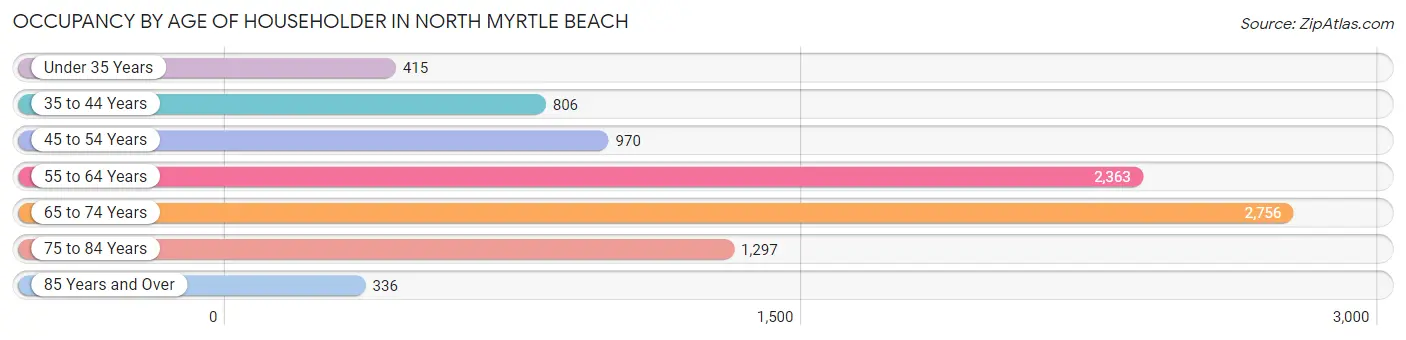
| Age Bracket | # Households | % Households |
| Under 35 Years | 415 | 4.6% |
| 35 to 44 Years | 806 | 9.0% |
| 45 to 54 Years | 970 | 10.8% |
| 55 to 64 Years | 2,363 | 26.4% |
| 65 to 74 Years | 2,756 | 30.8% |
| 75 to 84 Years | 1,297 | 14.5% |
| 85 Years and Over | 336 | 3.8% |
| Total | 8,943 | 100.0% |
Housing Finances in North Myrtle Beach
Median Income by Occupancy in North Myrtle Beach
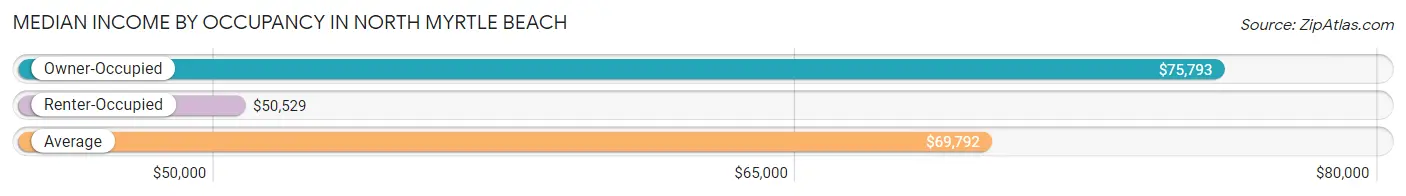
| Occupancy Type | # Households | Median Income |
| Owner-Occupied | 7,510 (84.0%) | $75,793 |
| Renter-Occupied | 1,433 (16.0%) | $50,529 |
| Average | 8,943 (100.0%) | $69,792 |
Occupancy by Householder Income Bracket in North Myrtle Beach
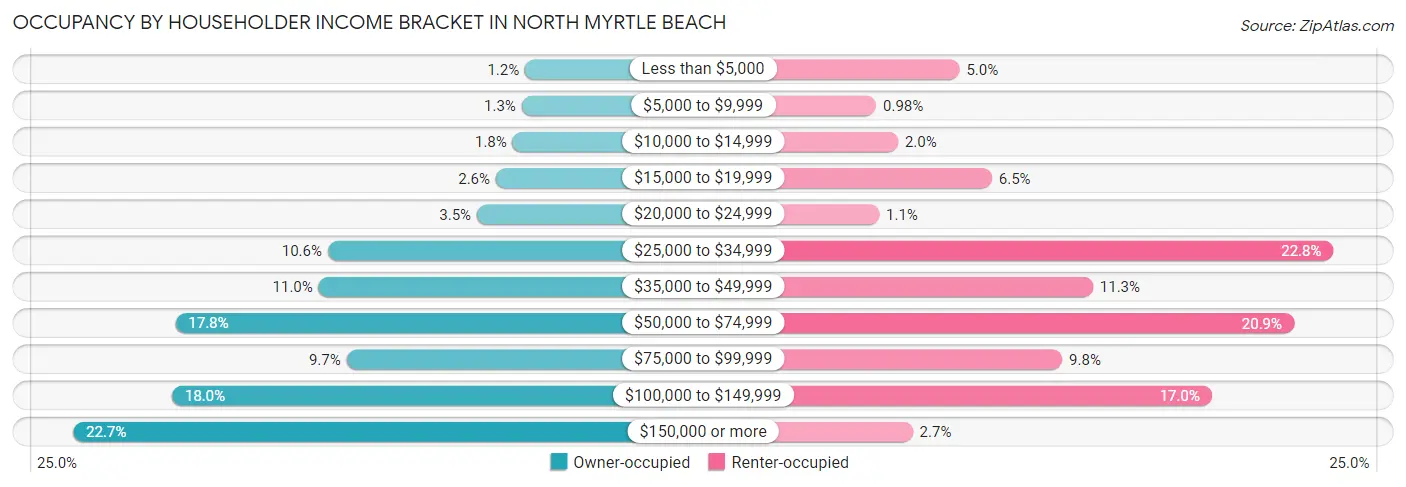
| Income Bracket | Owner-occupied | Renter-occupied |
| Less than $5,000 | 88 (1.2%) | 71 (5.0%) |
| $5,000 to $9,999 | 100 (1.3%) | 14 (1.0%) |
| $10,000 to $14,999 | 132 (1.8%) | 29 (2.0%) |
| $15,000 to $19,999 | 192 (2.6%) | 93 (6.5%) |
| $20,000 to $24,999 | 260 (3.5%) | 16 (1.1%) |
| $25,000 to $34,999 | 793 (10.6%) | 326 (22.8%) |
| $35,000 to $49,999 | 826 (11.0%) | 162 (11.3%) |
| $50,000 to $74,999 | 1,338 (17.8%) | 299 (20.9%) |
| $75,000 to $99,999 | 726 (9.7%) | 141 (9.8%) |
| $100,000 to $149,999 | 1,351 (18.0%) | 243 (17.0%) |
| $150,000 or more | 1,704 (22.7%) | 39 (2.7%) |
| Total | 7,510 (100.0%) | 1,433 (100.0%) |
Monthly Housing Cost Tiers in North Myrtle Beach
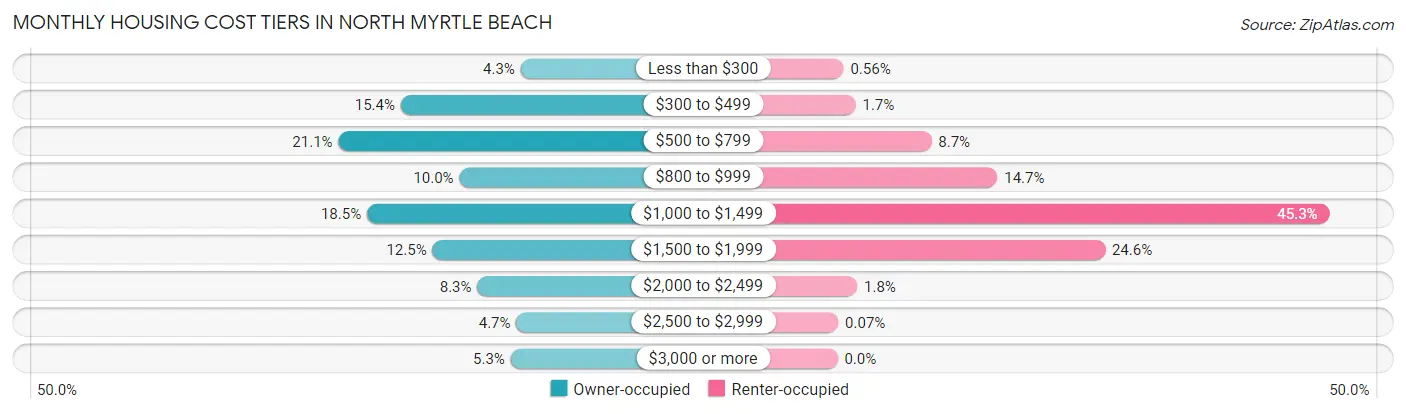
| Monthly Cost | Owner-occupied | Renter-occupied |
| Less than $300 | 325 (4.3%) | 8 (0.6%) |
| $300 to $499 | 1,154 (15.4%) | 24 (1.7%) |
| $500 to $799 | 1,585 (21.1%) | 124 (8.6%) |
| $800 to $999 | 749 (10.0%) | 211 (14.7%) |
| $1,000 to $1,499 | 1,388 (18.5%) | 649 (45.3%) |
| $1,500 to $1,999 | 935 (12.4%) | 353 (24.6%) |
| $2,000 to $2,499 | 625 (8.3%) | 26 (1.8%) |
| $2,500 to $2,999 | 355 (4.7%) | 1 (0.1%) |
| $3,000 or more | 394 (5.2%) | 0 (0.0%) |
| Total | 7,510 (100.0%) | 1,433 (100.0%) |
Physical Housing Characteristics in North Myrtle Beach
Housing Structures in North Myrtle Beach
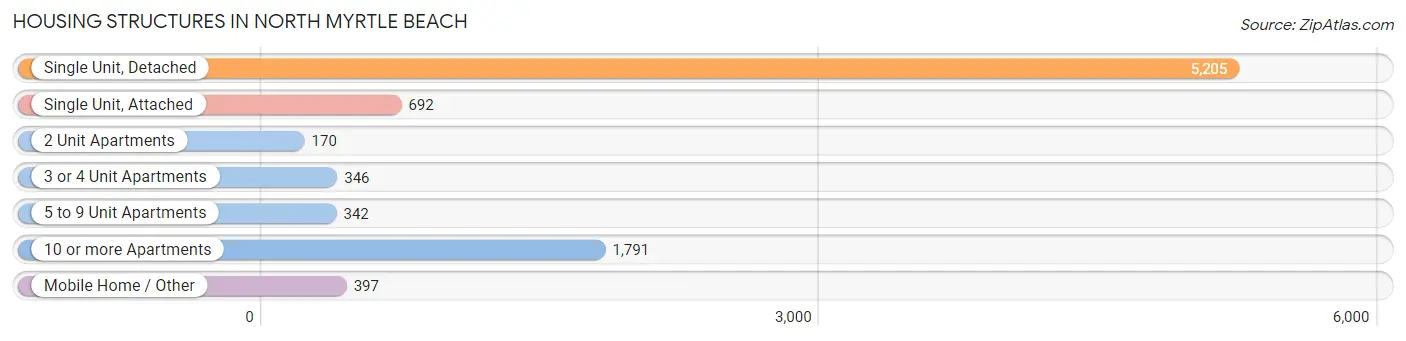
| Structure Type | # Housing Units | % Housing Units |
| Single Unit, Detached | 5,205 | 58.2% |
| Single Unit, Attached | 692 | 7.7% |
| 2 Unit Apartments | 170 | 1.9% |
| 3 or 4 Unit Apartments | 346 | 3.9% |
| 5 to 9 Unit Apartments | 342 | 3.8% |
| 10 or more Apartments | 1,791 | 20.0% |
| Mobile Home / Other | 397 | 4.4% |
| Total | 8,943 | 100.0% |
Housing Structures by Occupancy in North Myrtle Beach
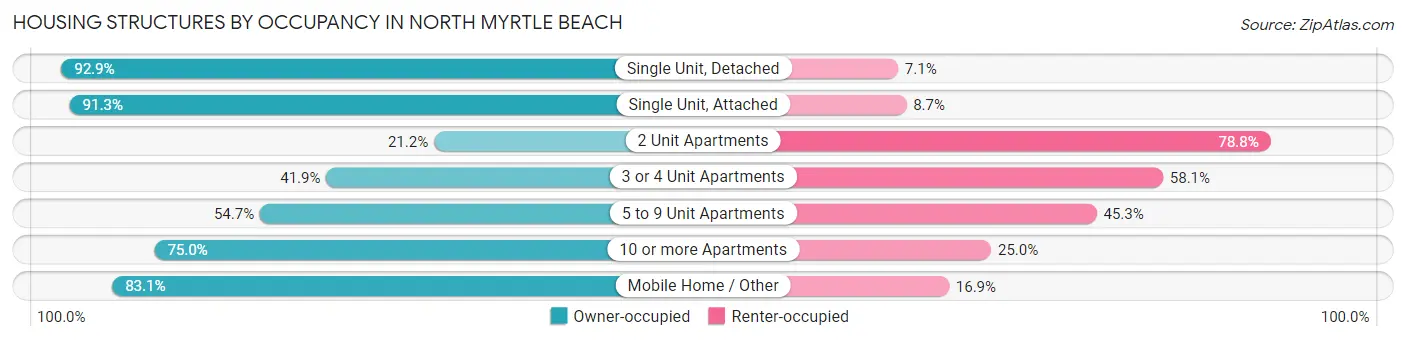
| Structure Type | Owner-occupied | Renter-occupied |
| Single Unit, Detached | 4,837 (92.9%) | 368 (7.1%) |
| Single Unit, Attached | 632 (91.3%) | 60 (8.7%) |
| 2 Unit Apartments | 36 (21.2%) | 134 (78.8%) |
| 3 or 4 Unit Apartments | 145 (41.9%) | 201 (58.1%) |
| 5 to 9 Unit Apartments | 187 (54.7%) | 155 (45.3%) |
| 10 or more Apartments | 1,343 (75.0%) | 448 (25.0%) |
| Mobile Home / Other | 330 (83.1%) | 67 (16.9%) |
| Total | 7,510 (84.0%) | 1,433 (16.0%) |
Housing Structures by Number of Rooms in North Myrtle Beach
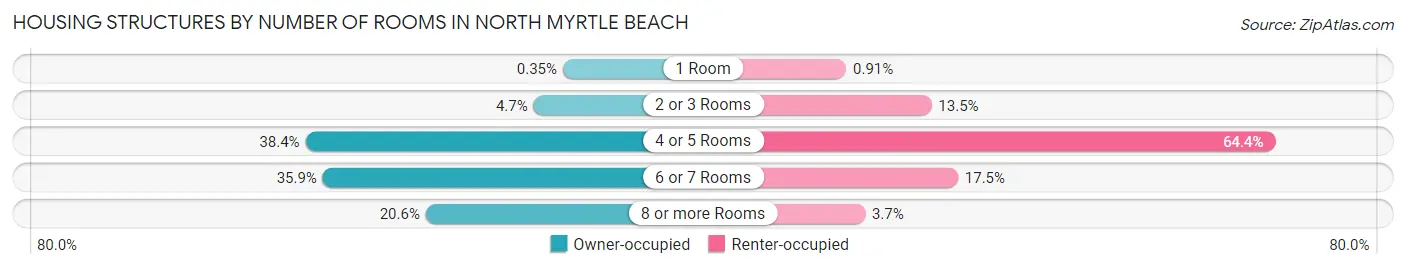
| Number of Rooms | Owner-occupied | Renter-occupied |
| 1 Room | 26 (0.4%) | 13 (0.9%) |
| 2 or 3 Rooms | 352 (4.7%) | 194 (13.5%) |
| 4 or 5 Rooms | 2,887 (38.4%) | 923 (64.4%) |
| 6 or 7 Rooms | 2,695 (35.9%) | 250 (17.4%) |
| 8 or more Rooms | 1,550 (20.6%) | 53 (3.7%) |
| Total | 7,510 (100.0%) | 1,433 (100.0%) |
Housing Structure by Heating Type in North Myrtle Beach
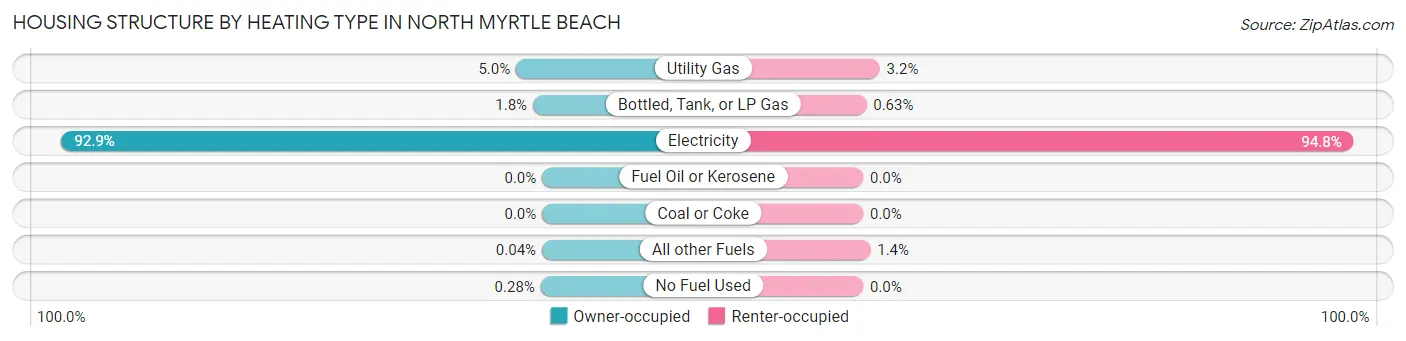
| Heating Type | Owner-occupied | Renter-occupied |
| Utility Gas | 378 (5.0%) | 46 (3.2%) |
| Bottled, Tank, or LP Gas | 133 (1.8%) | 9 (0.6%) |
| Electricity | 6,975 (92.9%) | 1,358 (94.8%) |
| Fuel Oil or Kerosene | 0 (0.0%) | 0 (0.0%) |
| Coal or Coke | 0 (0.0%) | 0 (0.0%) |
| All other Fuels | 3 (0.0%) | 20 (1.4%) |
| No Fuel Used | 21 (0.3%) | 0 (0.0%) |
| Total | 7,510 (100.0%) | 1,433 (100.0%) |
Household Vehicle Usage in North Myrtle Beach
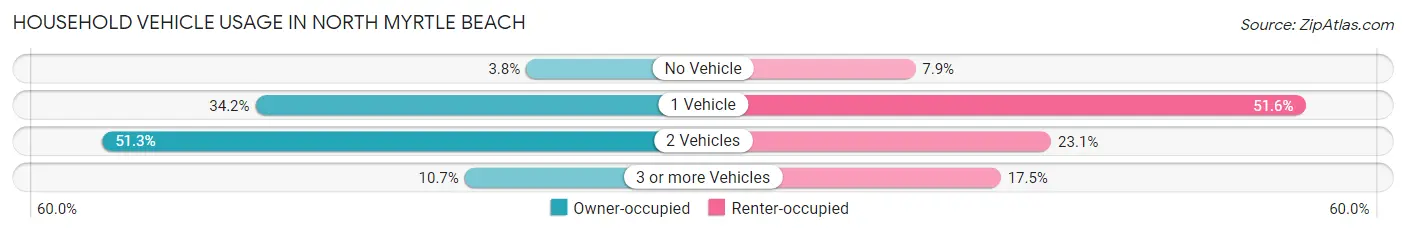
| Vehicles per Household | Owner-occupied | Renter-occupied |
| No Vehicle | 288 (3.8%) | 113 (7.9%) |
| 1 Vehicle | 2,565 (34.2%) | 739 (51.6%) |
| 2 Vehicles | 3,853 (51.3%) | 331 (23.1%) |
| 3 or more Vehicles | 804 (10.7%) | 250 (17.4%) |
| Total | 7,510 (100.0%) | 1,433 (100.0%) |
Real Estate & Mortgages in North Myrtle Beach
Real Estate and Mortgage Overview in North Myrtle Beach
| Characteristic | Without Mortgage | With Mortgage |
| Housing Units | 3,715 | 3,795 |
| Median Property Value | $327,100 | $348,800 |
| Median Household Income | $63,887 | $1,168 |
| Monthly Housing Costs | $555 | $394 |
| Real Estate Taxes | $1,219 | $84 |
Property Value by Mortgage Status in North Myrtle Beach
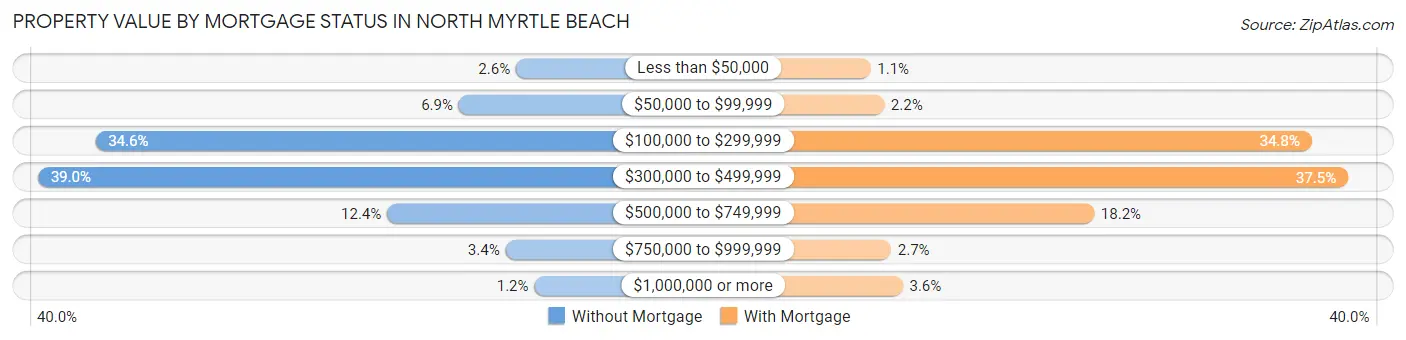
| Property Value | Without Mortgage | With Mortgage |
| Less than $50,000 | 95 (2.6%) | 43 (1.1%) |
| $50,000 to $99,999 | 257 (6.9%) | 82 (2.2%) |
| $100,000 to $299,999 | 1,286 (34.6%) | 1,319 (34.8%) |
| $300,000 to $499,999 | 1,449 (39.0%) | 1,424 (37.5%) |
| $500,000 to $749,999 | 460 (12.4%) | 689 (18.2%) |
| $750,000 to $999,999 | 125 (3.4%) | 102 (2.7%) |
| $1,000,000 or more | 43 (1.2%) | 136 (3.6%) |
| Total | 3,715 (100.0%) | 3,795 (100.0%) |
Household Income by Mortgage Status in North Myrtle Beach
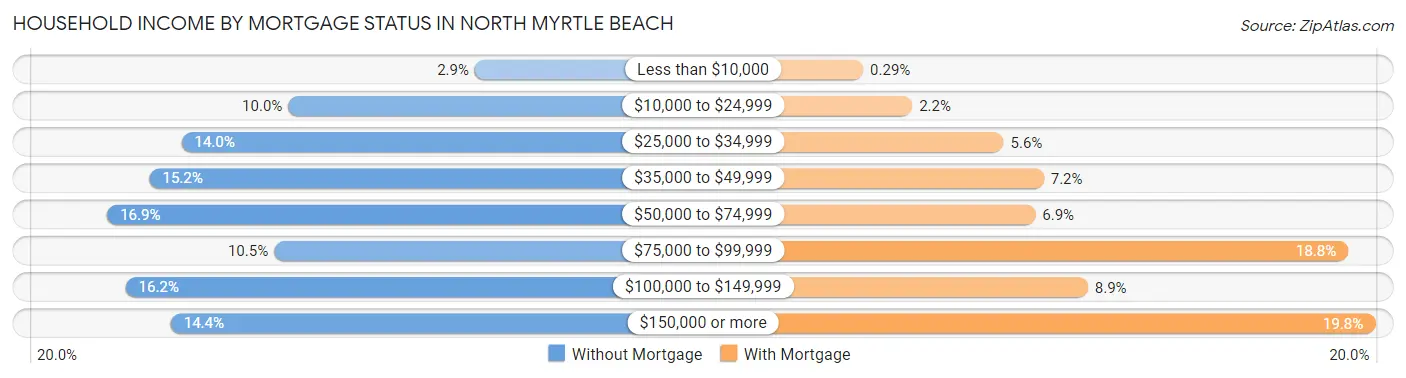
| Household Income | Without Mortgage | With Mortgage |
| Less than $10,000 | 106 (2.9%) | 11 (0.3%) |
| $10,000 to $24,999 | 370 (10.0%) | 82 (2.2%) |
| $25,000 to $34,999 | 521 (14.0%) | 214 (5.6%) |
| $35,000 to $49,999 | 566 (15.2%) | 272 (7.2%) |
| $50,000 to $74,999 | 626 (16.9%) | 260 (6.9%) |
| $75,000 to $99,999 | 390 (10.5%) | 712 (18.8%) |
| $100,000 to $149,999 | 600 (16.2%) | 336 (8.8%) |
| $150,000 or more | 536 (14.4%) | 751 (19.8%) |
| Total | 3,715 (100.0%) | 3,795 (100.0%) |
Property Value to Household Income Ratio in North Myrtle Beach
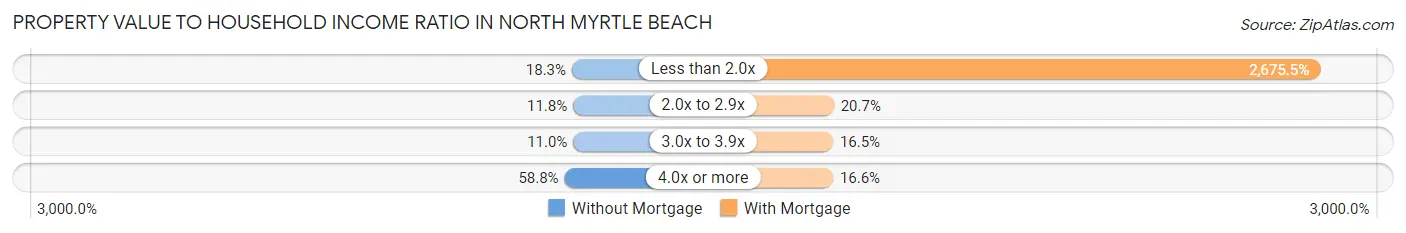
| Value-to-Income Ratio | Without Mortgage | With Mortgage |
| Less than 2.0x | 678 (18.2%) | 101,536 (2,675.5%) |
| 2.0x to 2.9x | 438 (11.8%) | 785 (20.7%) |
| 3.0x to 3.9x | 409 (11.0%) | 627 (16.5%) |
| 4.0x or more | 2,183 (58.8%) | 628 (16.6%) |
| Total | 3,715 (100.0%) | 3,795 (100.0%) |
Real Estate Taxes by Mortgage Status in North Myrtle Beach
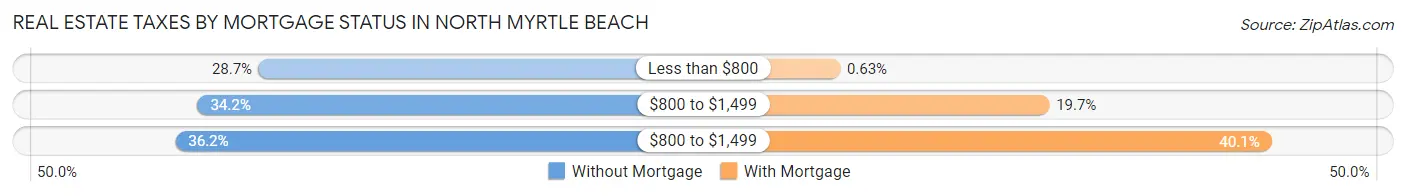
| Property Taxes | Without Mortgage | With Mortgage |
| Less than $800 | 1,066 (28.7%) | 24 (0.6%) |
| $800 to $1,499 | 1,271 (34.2%) | 749 (19.7%) |
| $800 to $1,499 | 1,346 (36.2%) | 1,520 (40.1%) |
| Total | 3,715 (100.0%) | 3,795 (100.0%) |
Health & Disability in North Myrtle Beach
Health Insurance Coverage by Age in North Myrtle Beach
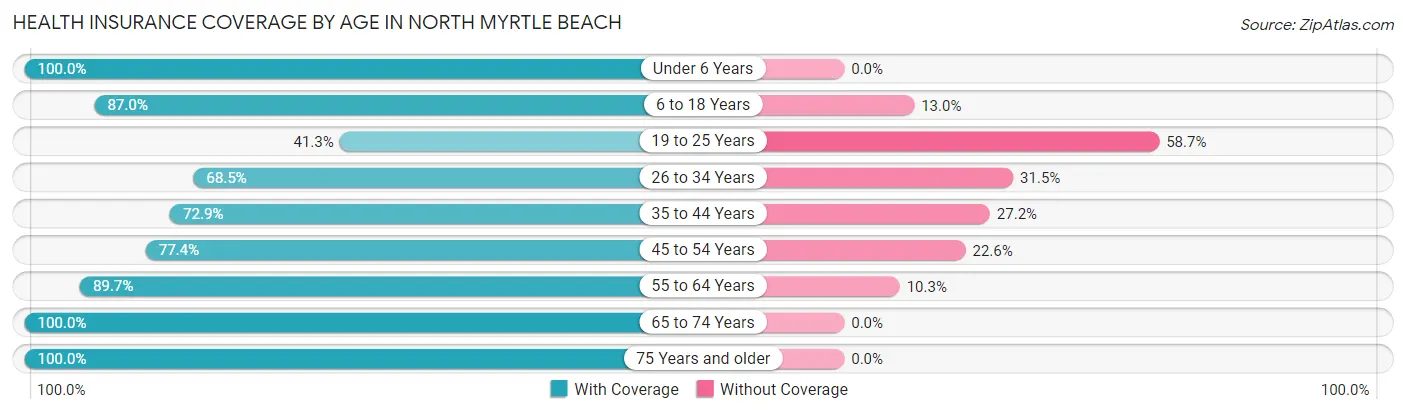
| Age Bracket | With Coverage | Without Coverage |
| Under 6 Years | 763 (100.0%) | 0 (0.0%) |
| 6 to 18 Years | 1,060 (87.0%) | 159 (13.0%) |
| 19 to 25 Years | 286 (41.3%) | 407 (58.7%) |
| 26 to 34 Years | 792 (68.5%) | 364 (31.5%) |
| 35 to 44 Years | 1,159 (72.9%) | 432 (27.2%) |
| 45 to 54 Years | 1,746 (77.4%) | 510 (22.6%) |
| 55 to 64 Years | 3,487 (89.7%) | 402 (10.3%) |
| 65 to 74 Years | 4,608 (100.0%) | 0 (0.0%) |
| 75 Years and older | 2,671 (100.0%) | 0 (0.0%) |
| Total | 16,572 (87.9%) | 2,274 (12.1%) |
Health Insurance Coverage by Citizenship Status in North Myrtle Beach
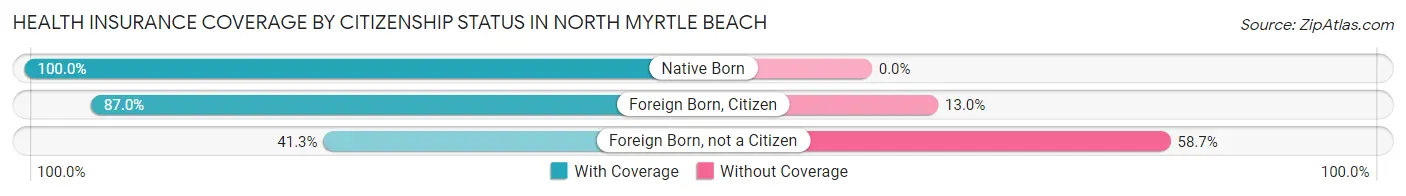
| Citizenship Status | With Coverage | Without Coverage |
| Native Born | 763 (100.0%) | 0 (0.0%) |
| Foreign Born, Citizen | 1,060 (87.0%) | 159 (13.0%) |
| Foreign Born, not a Citizen | 286 (41.3%) | 407 (58.7%) |
Health Insurance Coverage by Household Income in North Myrtle Beach
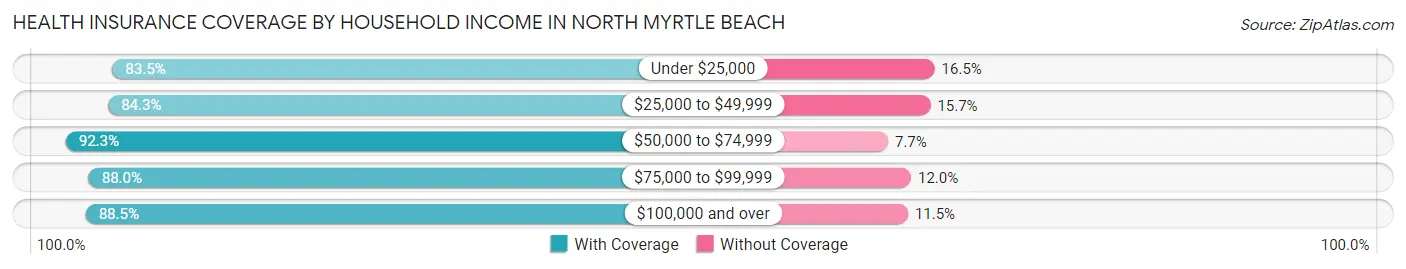
| Household Income | With Coverage | Without Coverage |
| Under $25,000 | 1,294 (83.5%) | 255 (16.5%) |
| $25,000 to $49,999 | 3,207 (84.3%) | 596 (15.7%) |
| $50,000 to $74,999 | 3,320 (92.3%) | 278 (7.7%) |
| $75,000 to $99,999 | 1,651 (88.0%) | 226 (12.0%) |
| $100,000 and over | 7,100 (88.5%) | 919 (11.5%) |
Public vs Private Health Insurance Coverage by Age in North Myrtle Beach
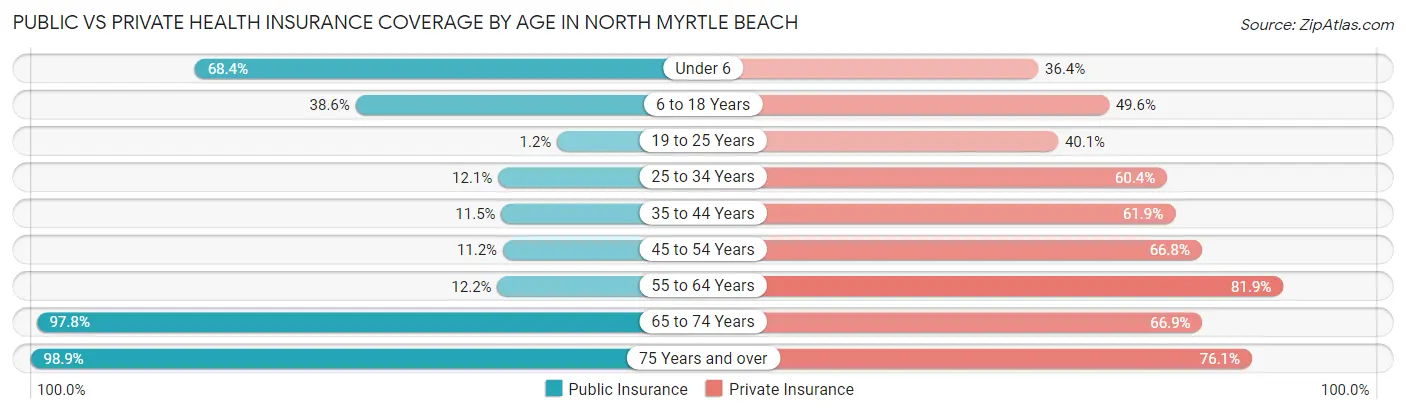
| Age Bracket | Public Insurance | Private Insurance |
| Under 6 | 522 (68.4%) | 278 (36.4%) |
| 6 to 18 Years | 470 (38.6%) | 604 (49.5%) |
| 19 to 25 Years | 8 (1.1%) | 278 (40.1%) |
| 25 to 34 Years | 140 (12.1%) | 698 (60.4%) |
| 35 to 44 Years | 183 (11.5%) | 984 (61.9%) |
| 45 to 54 Years | 253 (11.2%) | 1,507 (66.8%) |
| 55 to 64 Years | 476 (12.2%) | 3,186 (81.9%) |
| 65 to 74 Years | 4,506 (97.8%) | 3,084 (66.9%) |
| 75 Years and over | 2,642 (98.9%) | 2,033 (76.1%) |
| Total | 9,200 (48.8%) | 12,652 (67.1%) |
Disability Status by Sex by Age in North Myrtle Beach
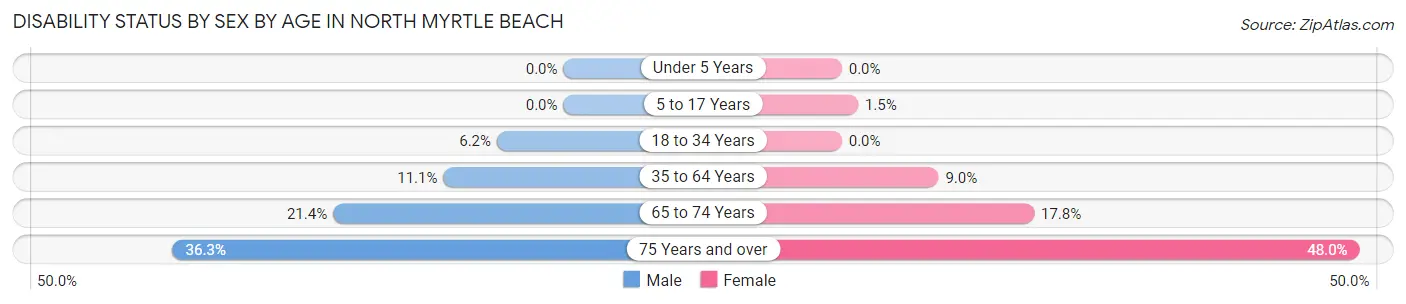
| Age Bracket | Male | Female |
| Under 5 Years | 0 (0.0%) | 0 (0.0%) |
| 5 to 17 Years | 0 (0.0%) | 9 (1.5%) |
| 18 to 34 Years | 73 (6.2%) | 0 (0.0%) |
| 35 to 64 Years | 405 (11.1%) | 368 (9.0%) |
| 65 to 74 Years | 525 (21.4%) | 384 (17.8%) |
| 75 Years and over | 413 (36.3%) | 736 (48.0%) |
Disability Class by Sex by Age in North Myrtle Beach
Disability Class: Hearing Difficulty
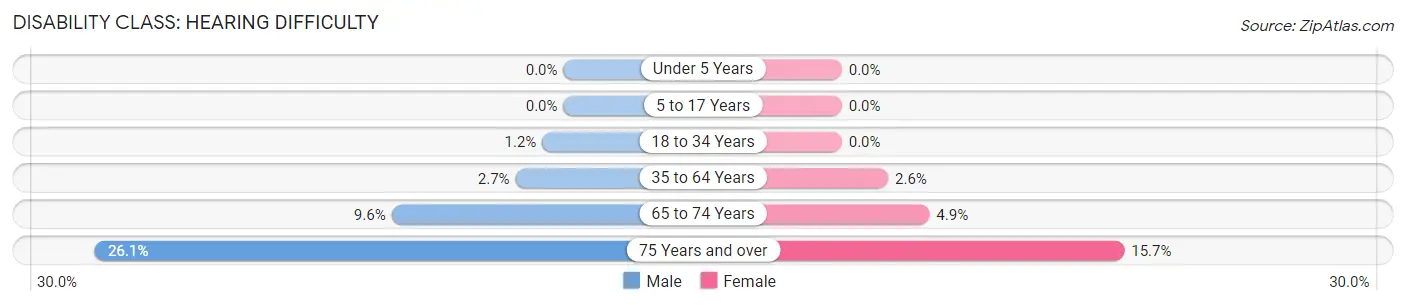
| Age Bracket | Male | Female |
| Under 5 Years | 0 (0.0%) | 0 (0.0%) |
| 5 to 17 Years | 0 (0.0%) | 0 (0.0%) |
| 18 to 34 Years | 14 (1.2%) | 0 (0.0%) |
| 35 to 64 Years | 97 (2.7%) | 106 (2.6%) |
| 65 to 74 Years | 235 (9.6%) | 105 (4.9%) |
| 75 Years and over | 297 (26.1%) | 241 (15.7%) |
Disability Class: Vision Difficulty
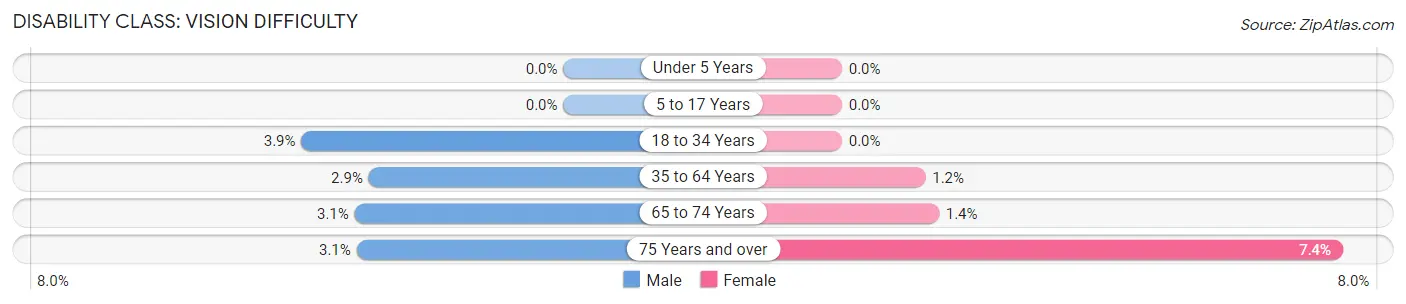
| Age Bracket | Male | Female |
| Under 5 Years | 0 (0.0%) | 0 (0.0%) |
| 5 to 17 Years | 0 (0.0%) | 0 (0.0%) |
| 18 to 34 Years | 46 (3.9%) | 0 (0.0%) |
| 35 to 64 Years | 105 (2.9%) | 51 (1.2%) |
| 65 to 74 Years | 76 (3.1%) | 31 (1.4%) |
| 75 Years and over | 35 (3.1%) | 114 (7.4%) |
Disability Class: Cognitive Difficulty
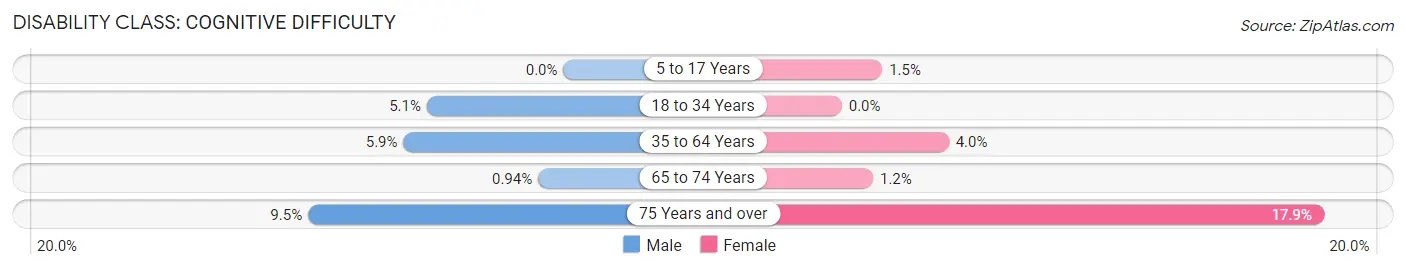
| Age Bracket | Male | Female |
| 5 to 17 Years | 0 (0.0%) | 9 (1.5%) |
| 18 to 34 Years | 60 (5.1%) | 0 (0.0%) |
| 35 to 64 Years | 216 (5.9%) | 163 (4.0%) |
| 65 to 74 Years | 23 (0.9%) | 25 (1.2%) |
| 75 Years and over | 108 (9.5%) | 274 (17.9%) |
Disability Class: Ambulatory Difficulty
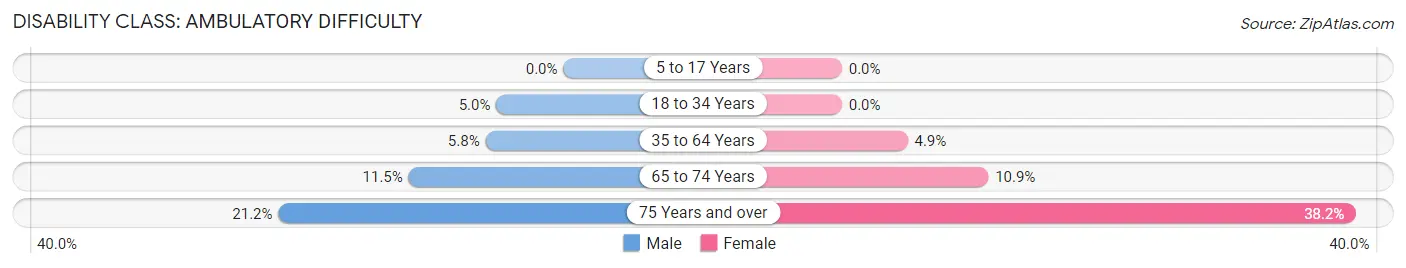
| Age Bracket | Male | Female |
| 5 to 17 Years | 0 (0.0%) | 0 (0.0%) |
| 18 to 34 Years | 59 (5.0%) | 0 (0.0%) |
| 35 to 64 Years | 210 (5.8%) | 200 (4.9%) |
| 65 to 74 Years | 282 (11.5%) | 234 (10.9%) |
| 75 Years and over | 241 (21.2%) | 585 (38.2%) |
Disability Class: Self-Care Difficulty
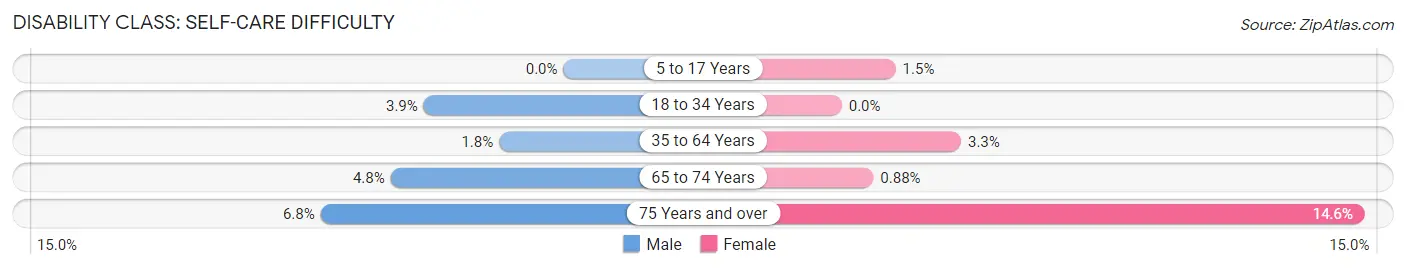
| Age Bracket | Male | Female |
| 5 to 17 Years | 0 (0.0%) | 9 (1.5%) |
| 18 to 34 Years | 46 (3.9%) | 0 (0.0%) |
| 35 to 64 Years | 65 (1.8%) | 136 (3.3%) |
| 65 to 74 Years | 118 (4.8%) | 19 (0.9%) |
| 75 Years and over | 77 (6.8%) | 223 (14.6%) |
Technology Access in North Myrtle Beach
Computing Device Access in North Myrtle Beach
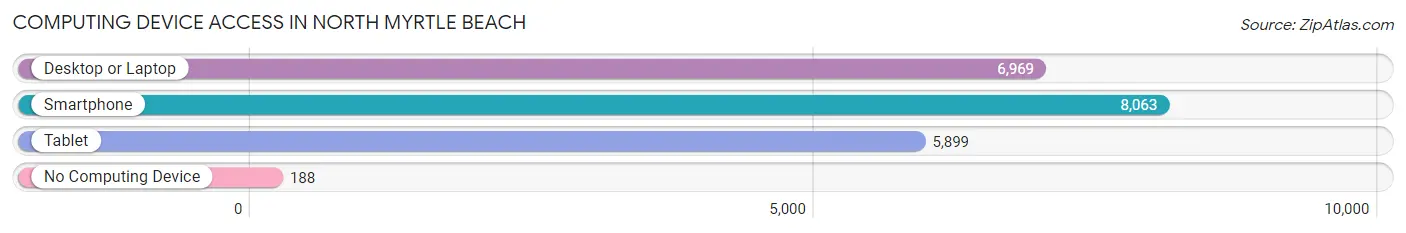
| Device Type | # Households | % Households |
| Desktop or Laptop | 6,969 | 77.9% |
| Smartphone | 8,063 | 90.2% |
| Tablet | 5,899 | 66.0% |
| No Computing Device | 188 | 2.1% |
| Total | 8,943 | 100.0% |
Internet Access in North Myrtle Beach
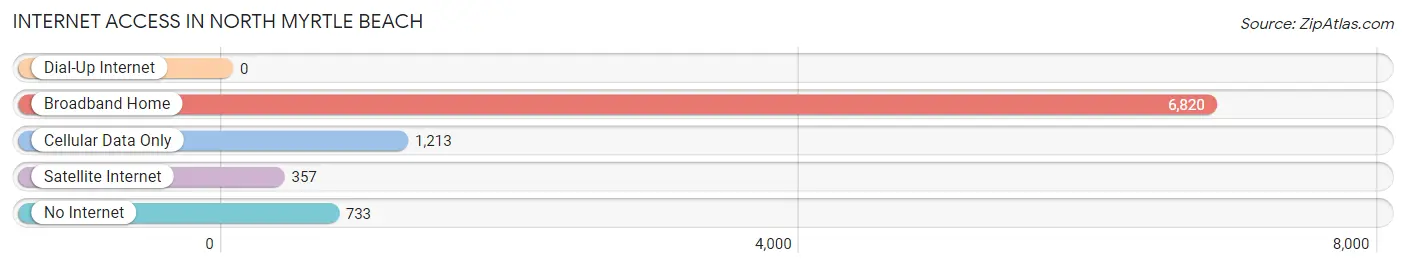
| Internet Type | # Households | % Households |
| Dial-Up Internet | 0 | 0.0% |
| Broadband Home | 6,820 | 76.3% |
| Cellular Data Only | 1,213 | 13.6% |
| Satellite Internet | 357 | 4.0% |
| No Internet | 733 | 8.2% |
| Total | 8,943 | 100.0% |
North Myrtle Beach Summary
History
North Myrtle Beach is a city located in Horry County, South Carolina. It is part of the Myrtle Beach metropolitan area and is located along the Grand Strand, a 60-mile stretch of beachfront along the Atlantic Ocean. The city was founded in 1968 when four beach towns, Cherry Grove, Ocean Drive, Crescent Beach, and Windy Hill, merged to form North Myrtle Beach. The city has grown significantly since then, and is now a popular tourist destination.
Geography
North Myrtle Beach is located in the northeastern corner of South Carolina, along the Atlantic Ocean. It is bordered by the city of Myrtle Beach to the south, and the city of Little River to the north. The city is situated on a barrier island, and is separated from the mainland by the Intracoastal Waterway. The city has a total area of 16.3 square miles, of which 15.7 square miles is land and 0.6 square miles is water.
Economy
North Myrtle Beach is a popular tourist destination, and the city’s economy is largely driven by tourism. The city is home to numerous hotels, resorts, restaurants, and other attractions. The city also has a thriving retail sector, with numerous shops and stores located along the Grand Strand. Additionally, the city is home to several manufacturing and distribution companies, as well as a number of corporate offices.
Demographics
As of the 2010 census, North Myrtle Beach had a population of 13,752. The racial makeup of the city was 87.3% White, 8.2% African American, 0.4% Native American, 0.9% Asian, 0.1% Pacific Islander, 1.2% from other races, and 1.9% from two or more races. Hispanic or Latino of any race were 3.2% of the population. The median household income was $41,945, and the median family income was $50,945. The per capita income was $25,945. About 8.3% of families and 11.2% of the population were below the poverty line.
Common Questions
What is Per Capita Income in North Myrtle Beach?
Per Capita income in North Myrtle Beach is $49,007.
What is the Median Family Income in North Myrtle Beach?
Median Family Income in North Myrtle Beach is $89,418.
What is the Median Household income in North Myrtle Beach?
Median Household Income in North Myrtle Beach is $69,792.
What is Income or Wage Gap in North Myrtle Beach?
Income or Wage Gap in North Myrtle Beach is 1.6%.
Women in North Myrtle Beach earn 98.4 cents for every dollar earned by a man.
What is Inequality or Gini Index in North Myrtle Beach?
Inequality or Gini Index in North Myrtle Beach is 0.45.
What is the Total Population of North Myrtle Beach?
Total Population of North Myrtle Beach is 18,850.
What is the Total Male Population of North Myrtle Beach?
Total Male Population of North Myrtle Beach is 9,391.
What is the Total Female Population of North Myrtle Beach?
Total Female Population of North Myrtle Beach is 9,459.
What is the Ratio of Males per 100 Females in North Myrtle Beach?
There are 99.28 Males per 100 Females in North Myrtle Beach.
What is the Ratio of Females per 100 Males in North Myrtle Beach?
There are 100.72 Females per 100 Males in North Myrtle Beach.
What is the Median Population Age in North Myrtle Beach?
Median Population Age in North Myrtle Beach is 60.2 Years.
What is the Average Family Size in North Myrtle Beach
Average Family Size in North Myrtle Beach is 2.6 People.
What is the Average Household Size in North Myrtle Beach
Average Household Size in North Myrtle Beach is 2.1 People.
How Large is the Labor Force in North Myrtle Beach?
There are 8,423 People in the Labor Forcein in North Myrtle Beach.
What is the Percentage of People in the Labor Force in North Myrtle Beach?
49.3% of People are in the Labor Force in North Myrtle Beach.
What is the Unemployment Rate in North Myrtle Beach?
Unemployment Rate in North Myrtle Beach is 6.4%.