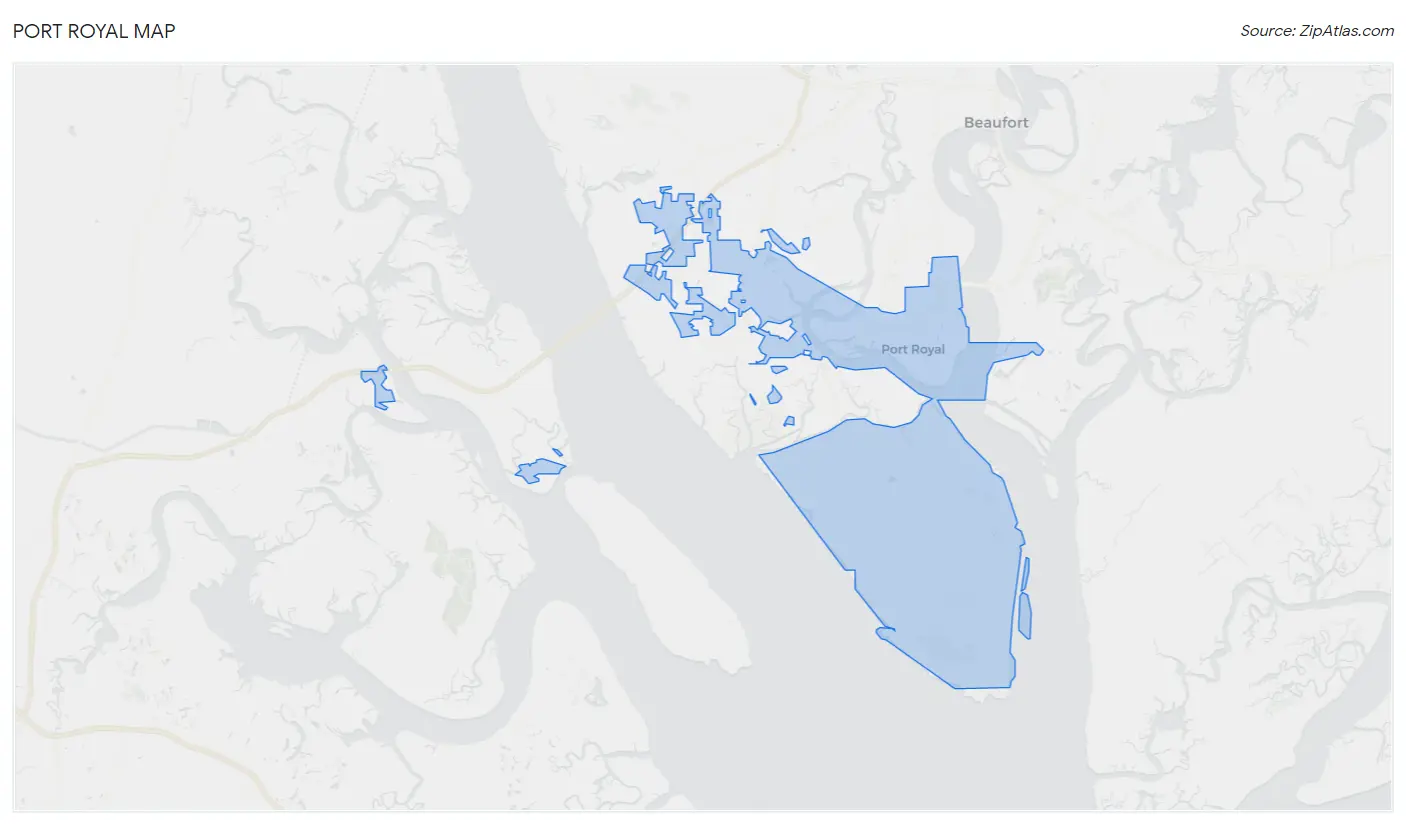
Port Royal, SC Map & Demographics
Port Royal Map
Port Royal Overview
$31,381
PER CAPITA INCOME
$69,143
AVG FAMILY INCOME
$68,909
AVG HOUSEHOLD INCOME
2.9%
WAGE / INCOME GAP [ % ]
97.1¢/ $1
WAGE / INCOME GAP [ $ ]
$17,572
FAMILY INCOME DEFICIT
0.37
INEQUALITY / GINI INDEX
14,573
TOTAL POPULATION
8,482
MALE POPULATION
6,091
FEMALE POPULATION
139.25
MALES / 100 FEMALES
71.81
FEMALES / 100 MALES
26.6
MEDIAN AGE
3.2
AVG FAMILY SIZE
2.5
AVG HOUSEHOLD SIZE
8,883
LABOR FORCE [ PEOPLE ]
71.1%
PERCENT IN LABOR FORCE
1.6%
UNEMPLOYMENT RATE
Port Royal Zip Codes
Port Royal Area Codes
Income in Port Royal
Income Overview in Port Royal
Per Capita Income in Port Royal is $31,381, while median incomes of families and households are $69,143 and $68,909 respectively.
| Characteristic | Number | Measure |
| Per Capita Income | 14,573 | $31,381 |
| Median Family Income | 3,011 | $69,143 |
| Mean Family Income | 3,011 | $83,121 |
| Median Household Income | 4,705 | $68,909 |
| Mean Household Income | 4,705 | $81,431 |
| Income Deficit | 3,011 | $17,572 |
| Wage / Income Gap (%) | 14,573 | 2.86% |
| Wage / Income Gap ($) | 14,573 | 97.14¢ per $1 |
| Gini / Inequality Index | 14,573 | 0.37 |
Earnings by Sex in Port Royal
Average Earnings in Port Royal are $26,643, $26,774 for men and $26,007 for women, a difference of 2.9%.
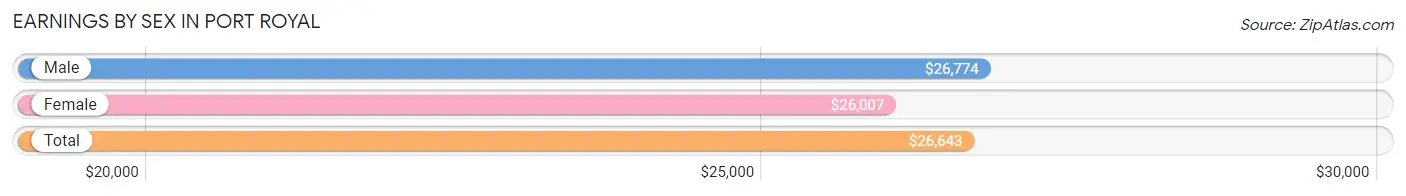
| Sex | Number | Average Earnings |
| Male | 6,125 (66.3%) | $26,774 |
| Female | 3,113 (33.7%) | $26,007 |
| Total | 9,238 (100.0%) | $26,643 |
Earnings by Sex by Income Bracket in Port Royal
The most common earnings brackets in Port Royal are $25,000 to $29,999 for men (809 | 13.2%) and $15,000 to $17,499 for women (501 | 16.1%).
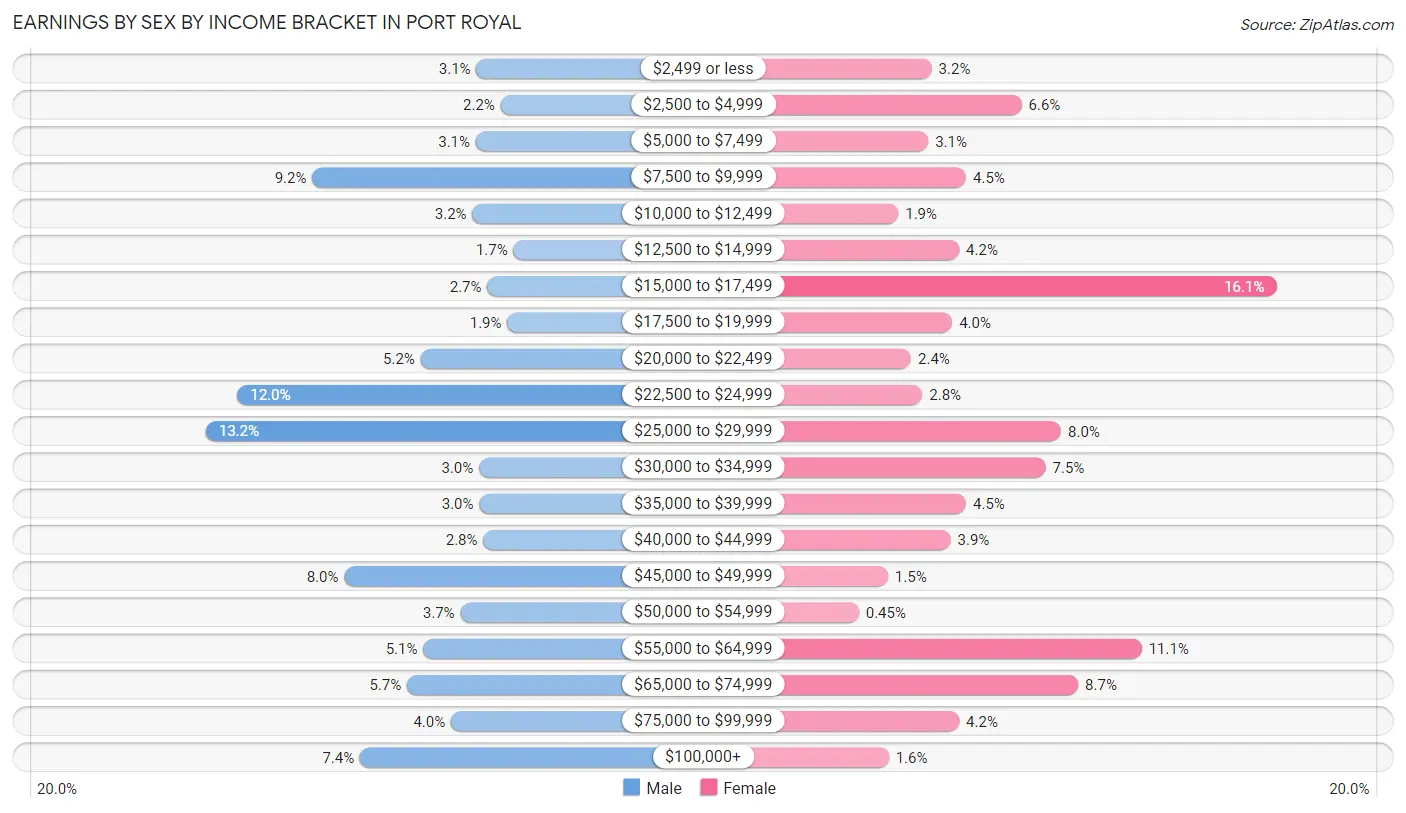
| Income | Male | Female |
| $2,499 or less | 188 (3.1%) | 99 (3.2%) |
| $2,500 to $4,999 | 132 (2.2%) | 204 (6.6%) |
| $5,000 to $7,499 | 189 (3.1%) | 95 (3.0%) |
| $7,500 to $9,999 | 565 (9.2%) | 139 (4.5%) |
| $10,000 to $12,499 | 197 (3.2%) | 60 (1.9%) |
| $12,500 to $14,999 | 103 (1.7%) | 131 (4.2%) |
| $15,000 to $17,499 | 163 (2.7%) | 501 (16.1%) |
| $17,500 to $19,999 | 117 (1.9%) | 123 (4.0%) |
| $20,000 to $22,499 | 316 (5.2%) | 75 (2.4%) |
| $22,500 to $24,999 | 737 (12.0%) | 88 (2.8%) |
| $25,000 to $29,999 | 809 (13.2%) | 250 (8.0%) |
| $30,000 to $34,999 | 182 (3.0%) | 232 (7.4%) |
| $35,000 to $39,999 | 181 (3.0%) | 139 (4.5%) |
| $40,000 to $44,999 | 172 (2.8%) | 121 (3.9%) |
| $45,000 to $49,999 | 491 (8.0%) | 48 (1.5%) |
| $50,000 to $54,999 | 225 (3.7%) | 14 (0.4%) |
| $55,000 to $64,999 | 310 (5.1%) | 344 (11.1%) |
| $65,000 to $74,999 | 347 (5.7%) | 270 (8.7%) |
| $75,000 to $99,999 | 246 (4.0%) | 131 (4.2%) |
| $100,000+ | 455 (7.4%) | 49 (1.6%) |
| Total | 6,125 (100.0%) | 3,113 (100.0%) |
Earnings by Sex by Educational Attainment in Port Royal
Average earnings in Port Royal are $52,587 for men and $33,337 for women, a difference of 36.6%. Men with an educational attainment of graduate degree enjoy the highest average annual earnings of $108,416, while those with less than high school education earn the least with $36,346. Women with an educational attainment of bachelor's degree earn the most with the average annual earnings of $55,186, while those with college or associate's degree education have the smallest earnings of $28,438.
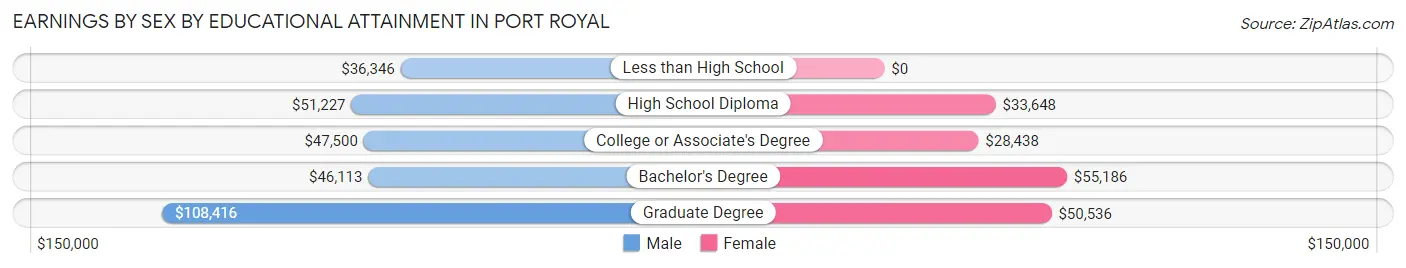
| Educational Attainment | Male Income | Female Income |
| Less than High School | $36,346 | $0 |
| High School Diploma | $51,227 | $33,648 |
| College or Associate's Degree | $47,500 | $28,438 |
| Bachelor's Degree | $46,113 | $55,186 |
| Graduate Degree | $108,416 | $50,536 |
| Total | $52,587 | $33,337 |
Family Income in Port Royal
Family Income Brackets in Port Royal
According to the Port Royal family income data, there are 837 families falling into the $50,000 to $74,999 income range, which is the most common income bracket and makes up 27.8% of all families.
| Income Bracket | # Families | % Families |
| Less than $10,000 | 90 | 3.0% |
| $10,000 to $14,999 | 0 | 0.0% |
| $15,000 to $24,999 | 154 | 5.1% |
| $25,000 to $34,999 | 193 | 6.4% |
| $35,000 to $49,999 | 385 | 12.8% |
| $50,000 to $74,999 | 837 | 27.8% |
| $75,000 to $99,999 | 581 | 19.3% |
| $100,000 to $149,999 | 431 | 14.3% |
| $150,000 to $199,999 | 232 | 7.7% |
| $200,000+ | 111 | 3.7% |
Family Income by Famaliy Size in Port Royal
2-person families (1,561 | 51.8%) account for the highest median family income in Port Royal with $72,454 per family, while 2-person families (1,561 | 51.8%) have the highest median income of $36,227 per family member.
| Income Bracket | # Families | Median Income |
| 2-Person Families | 1,561 (51.8%) | $72,454 |
| 3-Person Families | 818 (27.2%) | $69,231 |
| 4-Person Families | 312 (10.4%) | $0 |
| 5-Person Families | 208 (6.9%) | $50,417 |
| 6-Person Families | 77 (2.6%) | $61,696 |
| 7+ Person Families | 35 (1.2%) | $51,295 |
| Total | 3,011 (100.0%) | $69,143 |
Family Income by Number of Earners in Port Royal
The median family income in Port Royal is $69,143, with families comprising 3+ earners (75) having the highest median family income of $135,417, while families with 1 earner (1,063) have the lowest median family income of $50,018, accounting for 2.5% and 35.3% of families, respectively.
| Number of Earners | # Families | Median Income |
| No Earners | 346 (11.5%) | $57,456 |
| 1 Earner | 1,063 (35.3%) | $50,018 |
| 2 Earners | 1,527 (50.7%) | $92,778 |
| 3+ Earners | 75 (2.5%) | $135,417 |
| Total | 3,011 (100.0%) | $69,143 |
Household Income in Port Royal
Household Income Brackets in Port Royal
With 1,106 households falling in the category, the $50,000 to $74,999 income range is the most frequent in Port Royal, accounting for 23.5% of all households. In contrast, only 99 households (2.1%) fall into the $10,000 to $14,999 income bracket, making it the least populous group.
| Income Bracket | # Households | % Households |
| Less than $10,000 | 165 | 3.5% |
| $10,000 to $14,999 | 99 | 2.1% |
| $15,000 to $24,999 | 296 | 6.3% |
| $25,000 to $34,999 | 301 | 6.4% |
| $35,000 to $49,999 | 673 | 14.3% |
| $50,000 to $74,999 | 1,106 | 23.5% |
| $75,000 to $99,999 | 715 | 15.2% |
| $100,000 to $149,999 | 861 | 18.3% |
| $150,000 to $199,999 | 301 | 6.4% |
| $200,000+ | 188 | 4.0% |
Household Income by Householder Age in Port Royal
The median household income in Port Royal is $68,909, with the highest median household income of $101,750 found in the 45 to 64 years age bracket for the primary householder. A total of 1,239 households (26.3%) fall into this category. Meanwhile, the 15 to 24 years age bracket for the primary householder has the lowest median household income of $52,234, with 518 households (11.0%) in this group.
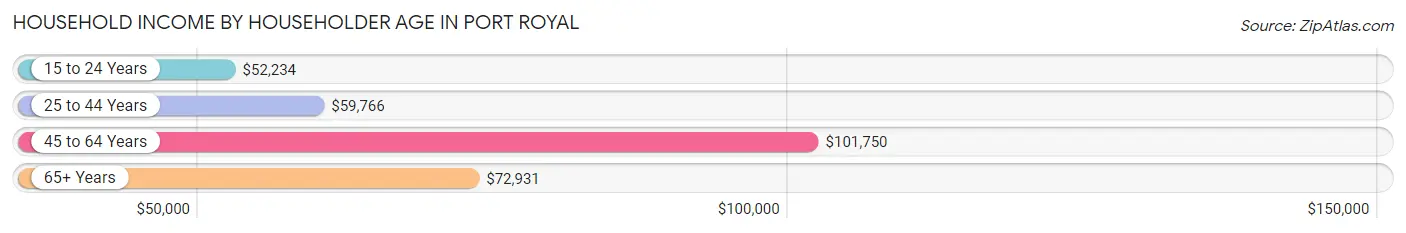
| Income Bracket | # Households | Median Income |
| 15 to 24 Years | 518 (11.0%) | $52,234 |
| 25 to 44 Years | 1,902 (40.4%) | $59,766 |
| 45 to 64 Years | 1,239 (26.3%) | $101,750 |
| 65+ Years | 1,046 (22.2%) | $72,931 |
| Total | 4,705 (100.0%) | $68,909 |
Poverty in Port Royal
Income Below Poverty by Sex and Age in Port Royal
With 7.1% poverty level for males and 11.1% for females among the residents of Port Royal, 12 to 14 year old males and 15 year old females are the most vulnerable to poverty, with 48 males (51.6%) and 15 females (68.2%) in their respective age groups living below the poverty level.
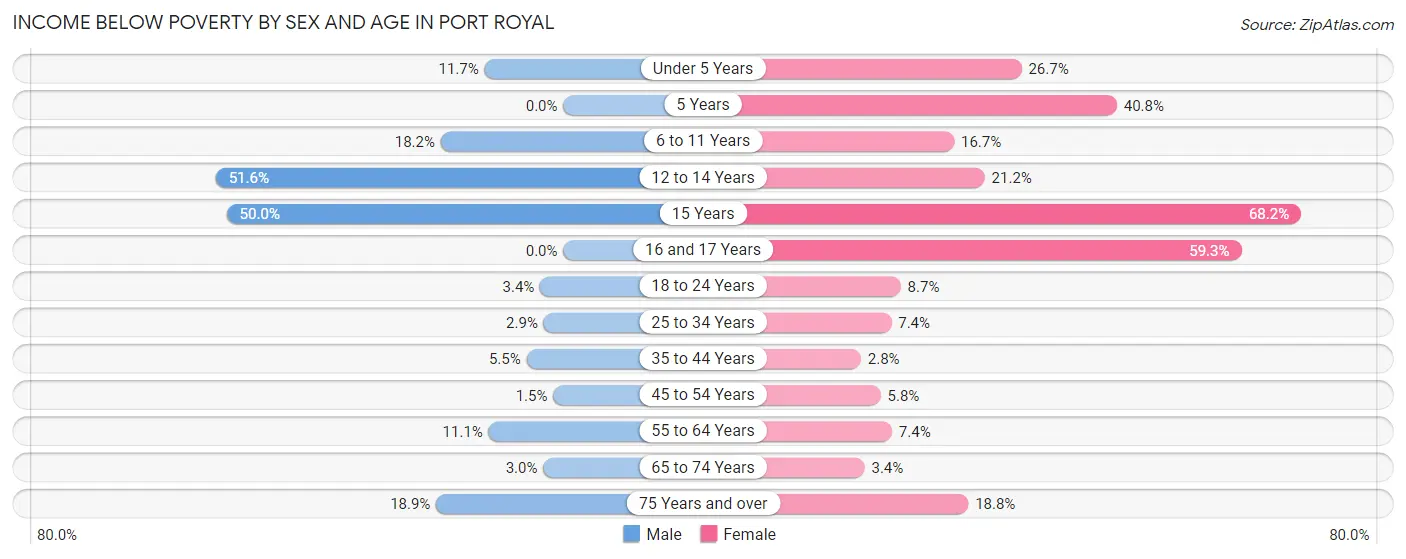
| Age Bracket | Male | Female |
| Under 5 Years | 60 (11.7%) | 99 (26.7%) |
| 5 Years | 0 (0.0%) | 69 (40.8%) |
| 6 to 11 Years | 75 (18.2%) | 40 (16.7%) |
| 12 to 14 Years | 48 (51.6%) | 42 (21.2%) |
| 15 Years | 14 (50.0%) | 15 (68.2%) |
| 16 and 17 Years | 0 (0.0%) | 35 (59.3%) |
| 18 to 24 Years | 34 (3.4%) | 78 (8.7%) |
| 25 to 34 Years | 36 (2.9%) | 79 (7.3%) |
| 35 to 44 Years | 37 (5.5%) | 15 (2.8%) |
| 45 to 54 Years | 8 (1.5%) | 38 (5.8%) |
| 55 to 64 Years | 65 (11.1%) | 39 (7.4%) |
| 65 to 74 Years | 17 (3.0%) | 18 (3.4%) |
| 75 Years and over | 37 (18.9%) | 49 (18.8%) |
| Total | 431 (7.1%) | 616 (11.1%) |
Income Above Poverty by Sex and Age in Port Royal
According to the poverty statistics in Port Royal, males aged 5 years and females aged 35 to 44 years are the age groups that are most secure financially, with 100.0% of males and 97.2% of females in these age groups living above the poverty line.
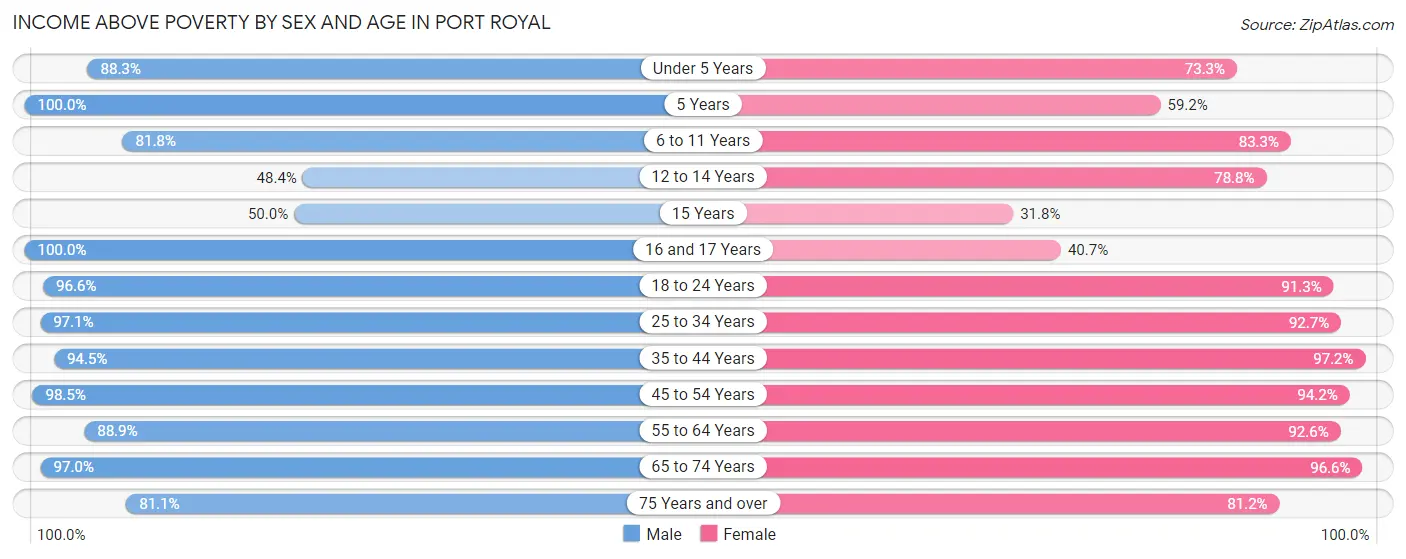
| Age Bracket | Male | Female |
| Under 5 Years | 453 (88.3%) | 272 (73.3%) |
| 5 Years | 18 (100.0%) | 100 (59.2%) |
| 6 to 11 Years | 337 (81.8%) | 200 (83.3%) |
| 12 to 14 Years | 45 (48.4%) | 156 (78.8%) |
| 15 Years | 14 (50.0%) | 7 (31.8%) |
| 16 and 17 Years | 226 (100.0%) | 24 (40.7%) |
| 18 to 24 Years | 953 (96.6%) | 814 (91.3%) |
| 25 to 34 Years | 1,200 (97.1%) | 996 (92.6%) |
| 35 to 44 Years | 641 (94.5%) | 515 (97.2%) |
| 45 to 54 Years | 530 (98.5%) | 622 (94.2%) |
| 55 to 64 Years | 521 (88.9%) | 485 (92.6%) |
| 65 to 74 Years | 553 (97.0%) | 515 (96.6%) |
| 75 Years and over | 159 (81.1%) | 212 (81.2%) |
| Total | 5,650 (92.9%) | 4,918 (88.9%) |
Income Below Poverty Among Married-Couple Families in Port Royal
The poverty statistics for married-couple families in Port Royal show that 1.7% or 41 of the total 2,407 families live below the poverty line. Families with 3 or 4 children have the highest poverty rate of 11.4%, comprising of 20 families. On the other hand, families with 5 or more children have the lowest poverty rate of 0.0%, which includes 0 families.
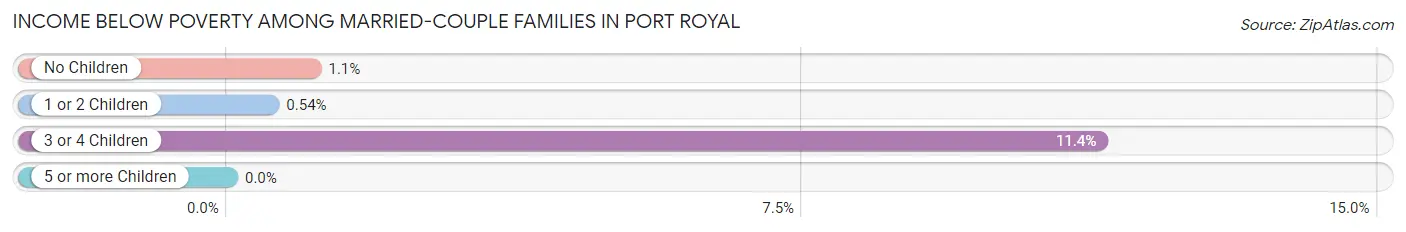
| Children | Above Poverty | Below Poverty |
| No Children | 1,626 (98.9%) | 18 (1.1%) |
| 1 or 2 Children | 552 (99.5%) | 3 (0.5%) |
| 3 or 4 Children | 156 (88.6%) | 20 (11.4%) |
| 5 or more Children | 32 (100.0%) | 0 (0.0%) |
| Total | 2,366 (98.3%) | 41 (1.7%) |
Income Below Poverty Among Single-Parent Households in Port Royal
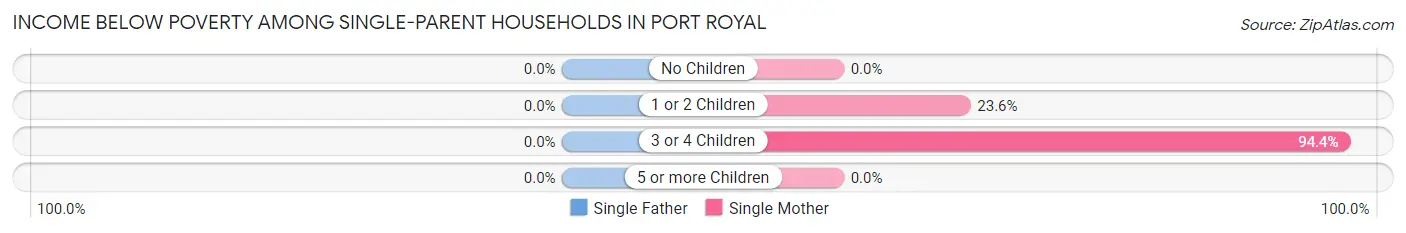
| Children | Single Father | Single Mother |
| No Children | 0 (0.0%) | 0 (0.0%) |
| 1 or 2 Children | 0 (0.0%) | 59 (23.6%) |
| 3 or 4 Children | 0 (0.0%) | 67 (94.4%) |
| 5 or more Children | 0 (0.0%) | 0 (0.0%) |
| Total | 0 (0.0%) | 126 (25.5%) |
Income Below Poverty Among Married-Couple vs Single-Parent Households in Port Royal
The poverty data for Port Royal shows that 41 of the married-couple family households (1.7%) and 126 of the single-parent households (20.9%) are living below the poverty level. Within the married-couple family households, those with 3 or 4 children have the highest poverty rate, with 20 households (11.4%) falling below the poverty line. Among the single-parent households, those with 3 or 4 children have the highest poverty rate, with 67 household (81.7%) living below poverty.
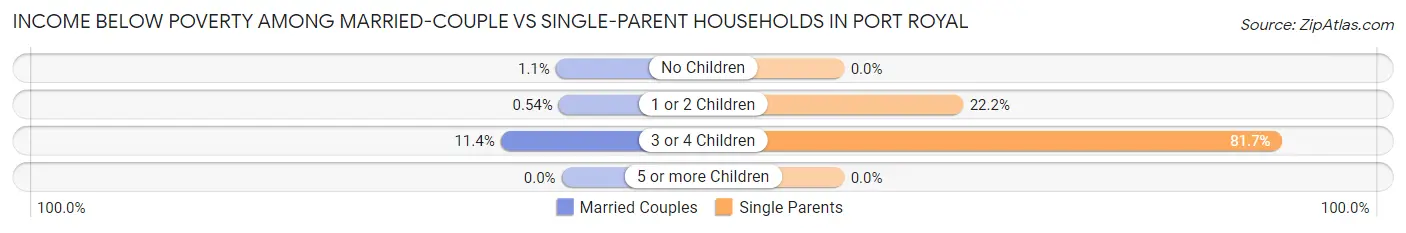
| Children | Married-Couple Families | Single-Parent Households |
| No Children | 18 (1.1%) | 0 (0.0%) |
| 1 or 2 Children | 3 (0.5%) | 59 (22.2%) |
| 3 or 4 Children | 20 (11.4%) | 67 (81.7%) |
| 5 or more Children | 0 (0.0%) | 0 (0.0%) |
| Total | 41 (1.7%) | 126 (20.9%) |
Race in Port Royal
The most populous races in Port Royal are White / Caucasian (9,376 | 64.3%), Black / African American (2,775 | 19.0%), and Hispanic or Latino (2,421 | 16.6%).
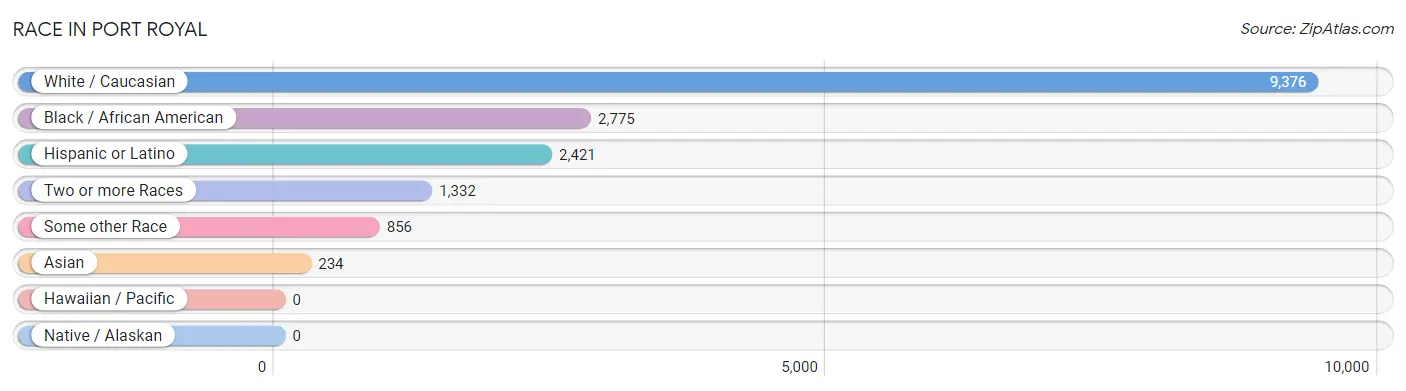
| Race | # Population | % Population |
| Asian | 234 | 1.6% |
| Black / African American | 2,775 | 19.0% |
| Hawaiian / Pacific | 0 | 0.0% |
| Hispanic or Latino | 2,421 | 16.6% |
| Native / Alaskan | 0 | 0.0% |
| White / Caucasian | 9,376 | 64.3% |
| Two or more Races | 1,332 | 9.1% |
| Some other Race | 856 | 5.9% |
| Total | 14,573 | 100.0% |
Ancestry in Port Royal
The most populous ancestries reported in Port Royal are Irish (1,850 | 12.7%), English (1,672 | 11.5%), Mexican (1,660 | 11.4%), Italian (1,321 | 9.1%), and German (1,197 | 8.2%), together accounting for 52.8% of all Port Royal residents.
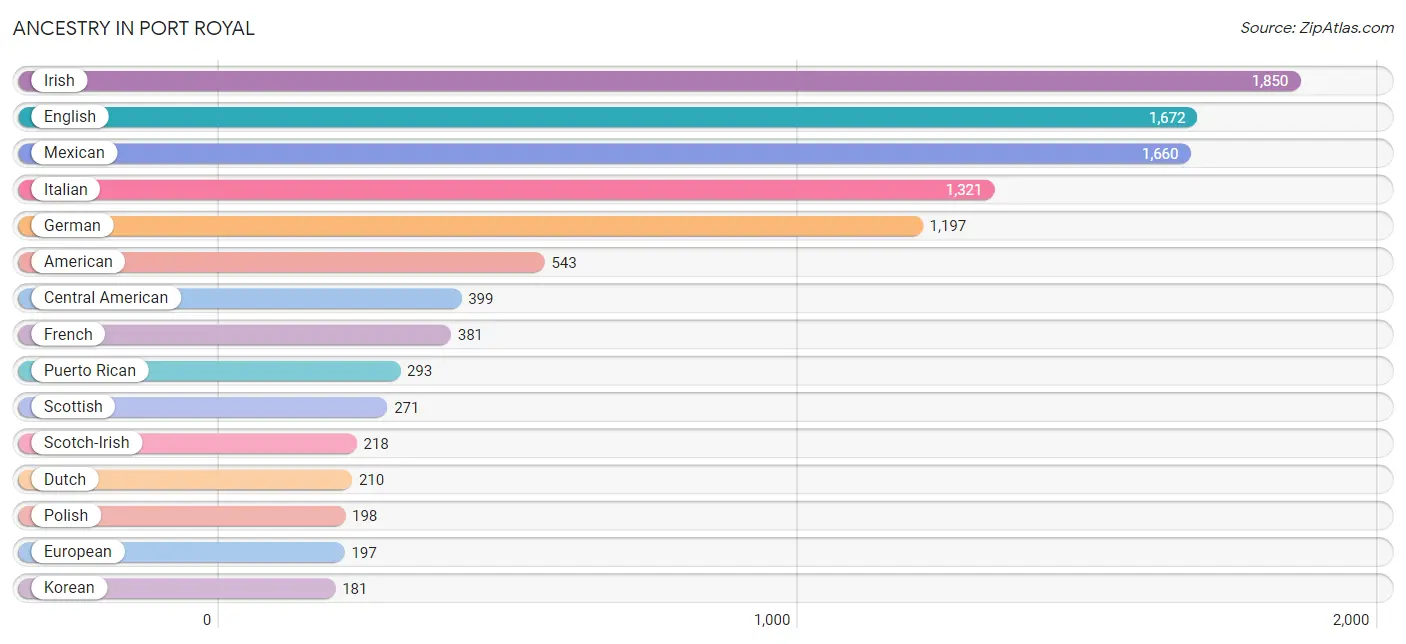
| Ancestry | # Population | % Population |
| African | 102 | 0.7% |
| American | 543 | 3.7% |
| Arab | 43 | 0.3% |
| Armenian | 63 | 0.4% |
| Bahamian | 55 | 0.4% |
| Bangladeshi | 15 | 0.1% |
| Belgian | 23 | 0.2% |
| Bhutanese | 157 | 1.1% |
| Bolivian | 10 | 0.1% |
| British | 12 | 0.1% |
| Burmese | 103 | 0.7% |
| Canadian | 13 | 0.1% |
| Central American | 399 | 2.7% |
| Cherokee | 41 | 0.3% |
| Choctaw | 30 | 0.2% |
| Colombian | 7 | 0.1% |
| Costa Rican | 56 | 0.4% |
| Cuban | 11 | 0.1% |
| Danish | 29 | 0.2% |
| Dominican | 12 | 0.1% |
| Dutch | 210 | 1.4% |
| Eastern European | 39 | 0.3% |
| English | 1,672 | 11.5% |
| European | 197 | 1.3% |
| French | 381 | 2.6% |
| French Canadian | 51 | 0.4% |
| German | 1,197 | 8.2% |
| Ghanaian | 14 | 0.1% |
| Greek | 69 | 0.5% |
| Guamanian / Chamorro | 16 | 0.1% |
| Guatemalan | 149 | 1.0% |
| Haitian | 55 | 0.4% |
| Honduran | 165 | 1.1% |
| Hungarian | 13 | 0.1% |
| Icelander | 9 | 0.1% |
| Irish | 1,850 | 12.7% |
| Italian | 1,321 | 9.1% |
| Jamaican | 122 | 0.8% |
| Korean | 181 | 1.2% |
| Lebanese | 36 | 0.3% |
| Lithuanian | 18 | 0.1% |
| Mexican | 1,660 | 11.4% |
| Nicaraguan | 25 | 0.2% |
| Northern European | 55 | 0.4% |
| Norwegian | 80 | 0.5% |
| Panamanian | 4 | 0.0% |
| Peruvian | 16 | 0.1% |
| Polish | 198 | 1.4% |
| Portuguese | 92 | 0.6% |
| Puerto Rican | 293 | 2.0% |
| Russian | 111 | 0.8% |
| Scandinavian | 70 | 0.5% |
| Scotch-Irish | 218 | 1.5% |
| Scottish | 271 | 1.9% |
| Slovak | 16 | 0.1% |
| South American | 33 | 0.2% |
| Spaniard | 3 | 0.0% |
| Spanish | 10 | 0.1% |
| Sri Lankan | 26 | 0.2% |
| Subsaharan African | 124 | 0.9% |
| Swedish | 105 | 0.7% |
| Swiss | 27 | 0.2% |
| Thai | 7 | 0.1% |
| Trinidadian and Tobagonian | 30 | 0.2% |
| Welsh | 125 | 0.9% |
| West Indian | 130 | 0.9% |
| Yugoslavian | 16 | 0.1% | View All 67 Rows |
Immigrants in Port Royal
The most numerous immigrant groups reported in Port Royal came from Latin America (457 | 3.1%), Central America (405 | 2.8%), Mexico (287 | 2.0%), Asia (69 | 0.5%), and Honduras (58 | 0.4%), together accounting for 8.8% of all Port Royal residents.
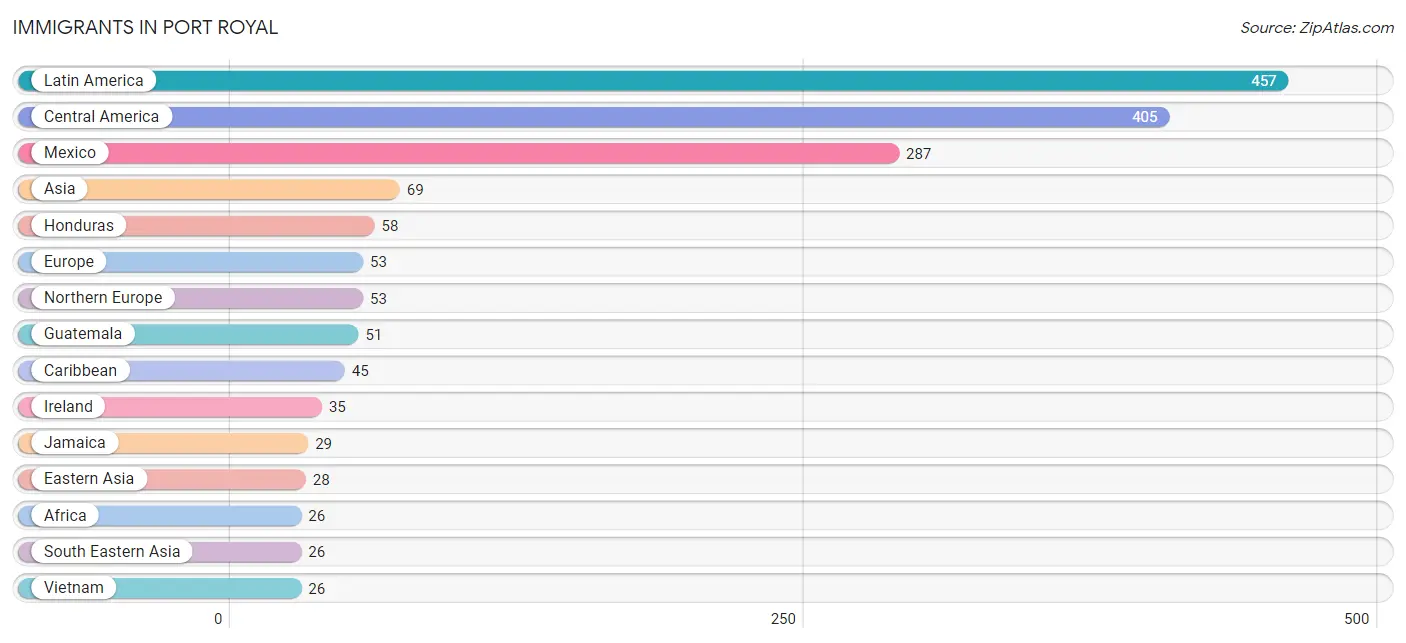
| Immigration Origin | # Population | % Population |
| Africa | 26 | 0.2% |
| Asia | 69 | 0.5% |
| Australia | 3 | 0.0% |
| Cameroon | 8 | 0.1% |
| Caribbean | 45 | 0.3% |
| Central America | 405 | 2.8% |
| Colombia | 7 | 0.1% |
| Cuba | 11 | 0.1% |
| Dominican Republic | 5 | 0.0% |
| Eastern Asia | 28 | 0.2% |
| Europe | 53 | 0.4% |
| Ghana | 18 | 0.1% |
| Guatemala | 51 | 0.4% |
| Honduras | 58 | 0.4% |
| Ireland | 35 | 0.2% |
| Jamaica | 29 | 0.2% |
| Japan | 21 | 0.1% |
| Korea | 7 | 0.1% |
| Latin America | 457 | 3.1% |
| Mexico | 287 | 2.0% |
| Middle Africa | 8 | 0.1% |
| Nepal | 8 | 0.1% |
| Nicaragua | 9 | 0.1% |
| Northern Europe | 53 | 0.4% |
| Oceania | 3 | 0.0% |
| Saudi Arabia | 7 | 0.1% |
| Scotland | 18 | 0.1% |
| South America | 7 | 0.1% |
| South Central Asia | 8 | 0.1% |
| South Eastern Asia | 26 | 0.2% |
| Vietnam | 26 | 0.2% |
| Western Africa | 18 | 0.1% |
| Western Asia | 7 | 0.1% | View All 33 Rows |
Sex and Age in Port Royal
Sex and Age in Port Royal
The most populous age groups in Port Royal are 20 to 24 Years (2,061 | 24.3%) for men and 20 to 24 Years (915 | 15.0%) for women.
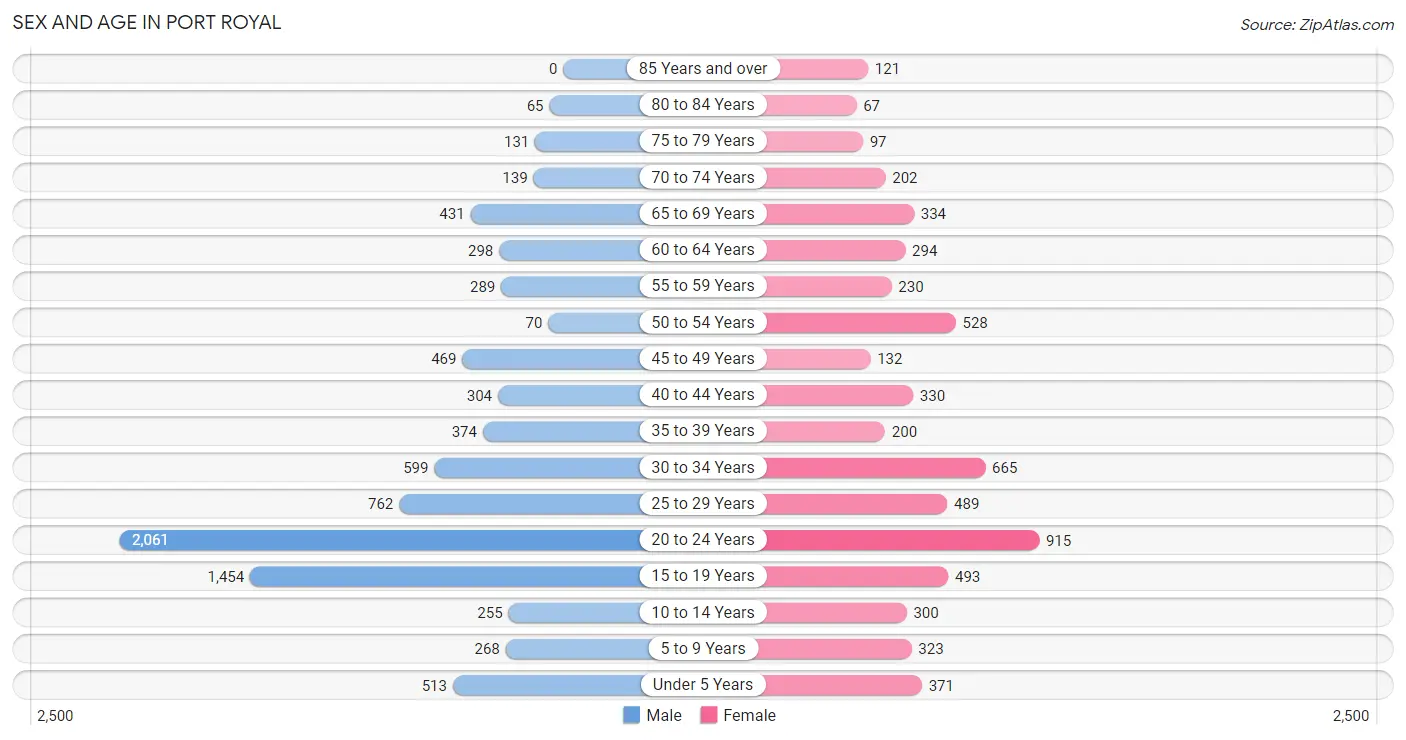
| Age Bracket | Male | Female |
| Under 5 Years | 513 (6.0%) | 371 (6.1%) |
| 5 to 9 Years | 268 (3.2%) | 323 (5.3%) |
| 10 to 14 Years | 255 (3.0%) | 300 (4.9%) |
| 15 to 19 Years | 1,454 (17.1%) | 493 (8.1%) |
| 20 to 24 Years | 2,061 (24.3%) | 915 (15.0%) |
| 25 to 29 Years | 762 (9.0%) | 489 (8.0%) |
| 30 to 34 Years | 599 (7.1%) | 665 (10.9%) |
| 35 to 39 Years | 374 (4.4%) | 200 (3.3%) |
| 40 to 44 Years | 304 (3.6%) | 330 (5.4%) |
| 45 to 49 Years | 469 (5.5%) | 132 (2.2%) |
| 50 to 54 Years | 70 (0.8%) | 528 (8.7%) |
| 55 to 59 Years | 289 (3.4%) | 230 (3.8%) |
| 60 to 64 Years | 298 (3.5%) | 294 (4.8%) |
| 65 to 69 Years | 431 (5.1%) | 334 (5.5%) |
| 70 to 74 Years | 139 (1.6%) | 202 (3.3%) |
| 75 to 79 Years | 131 (1.5%) | 97 (1.6%) |
| 80 to 84 Years | 65 (0.8%) | 67 (1.1%) |
| 85 Years and over | 0 (0.0%) | 121 (2.0%) |
| Total | 8,482 (100.0%) | 6,091 (100.0%) |
Families and Households in Port Royal
Median Family Size in Port Royal
The median family size in Port Royal is 3.19 persons per family, with single female/mother families (494 | 16.4%) accounting for the largest median family size of 3.61 persons per family. On the other hand, single male/father families (110 | 3.6%) represent the smallest median family size with 2.53 persons per family.
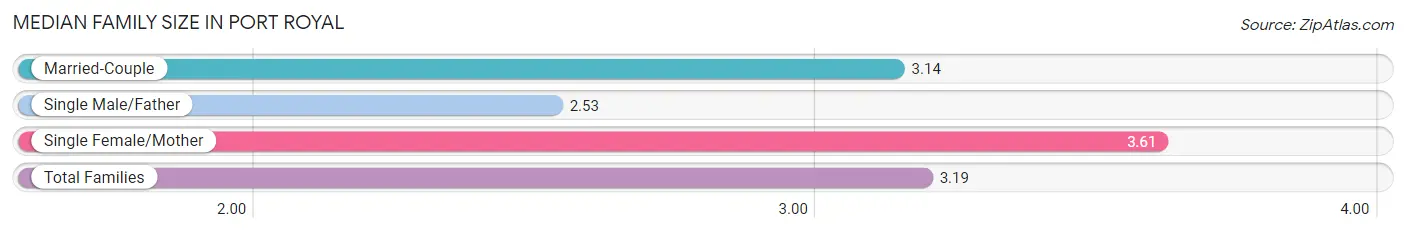
| Family Type | # Families | Family Size |
| Married-Couple | 2,407 (79.9%) | 3.14 |
| Single Male/Father | 110 (3.6%) | 2.53 |
| Single Female/Mother | 494 (16.4%) | 3.61 |
| Total Families | 3,011 (100.0%) | 3.19 |
Median Household Size in Port Royal
The median household size in Port Royal is 2.47 persons per household, with single female/mother households (494 | 10.5%) accounting for the largest median household size of 3.78 persons per household. non-family households (1,694 | 36.0%) represent the smallest median household size with 1.11 persons per household.
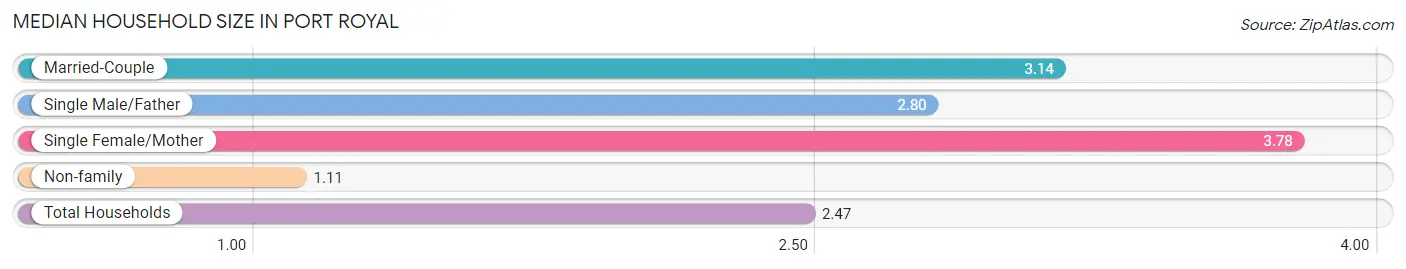
| Household Type | # Households | Household Size |
| Married-Couple | 2,407 (51.2%) | 3.14 |
| Single Male/Father | 110 (2.3%) | 2.80 |
| Single Female/Mother | 494 (10.5%) | 3.78 |
| Non-family | 1,694 (36.0%) | 1.11 |
| Total Households | 4,705 (100.0%) | 2.47 |
Household Size by Marriage Status in Port Royal
Out of a total of 4,705 households in Port Royal, 3,011 (64.0%) are family households, while 1,694 (36.0%) are nonfamily households. The most numerous type of family households are 2-person households, comprising 1,490, and the most common type of nonfamily households are 1-person households, comprising 1,547.
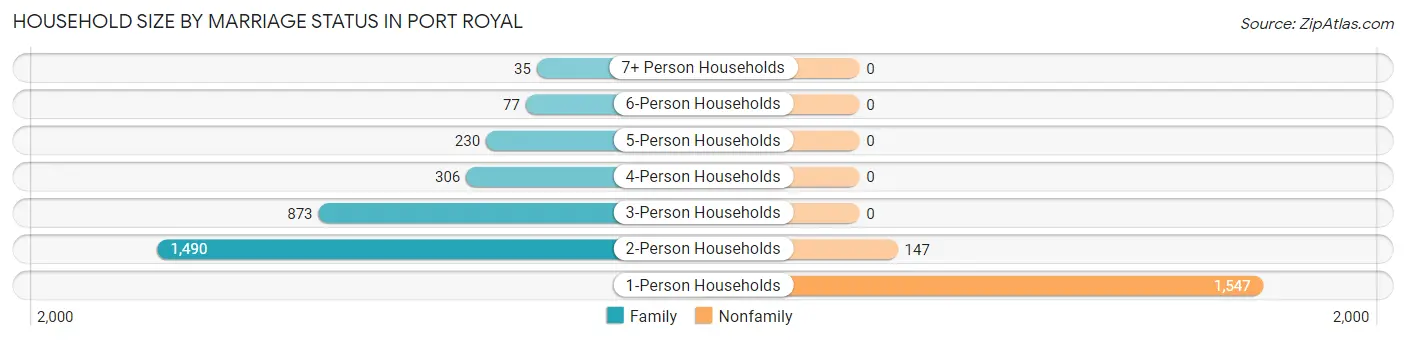
| Household Size | Family Households | Nonfamily Households |
| 1-Person Households | - | 1,547 (32.9%) |
| 2-Person Households | 1,490 (31.7%) | 147 (3.1%) |
| 3-Person Households | 873 (18.5%) | 0 (0.0%) |
| 4-Person Households | 306 (6.5%) | 0 (0.0%) |
| 5-Person Households | 230 (4.9%) | 0 (0.0%) |
| 6-Person Households | 77 (1.6%) | 0 (0.0%) |
| 7+ Person Households | 35 (0.7%) | 0 (0.0%) |
| Total | 3,011 (64.0%) | 1,694 (36.0%) |
Female Fertility in Port Royal
Fertility by Age in Port Royal
Average fertility rate in Port Royal is 52.0 births per 1,000 women. Women in the age bracket of 20 to 34 years have the highest fertility rate with 65.0 births per 1,000 women. Women in the age bracket of 20 to 34 years acount for 75.8% of all women with births.
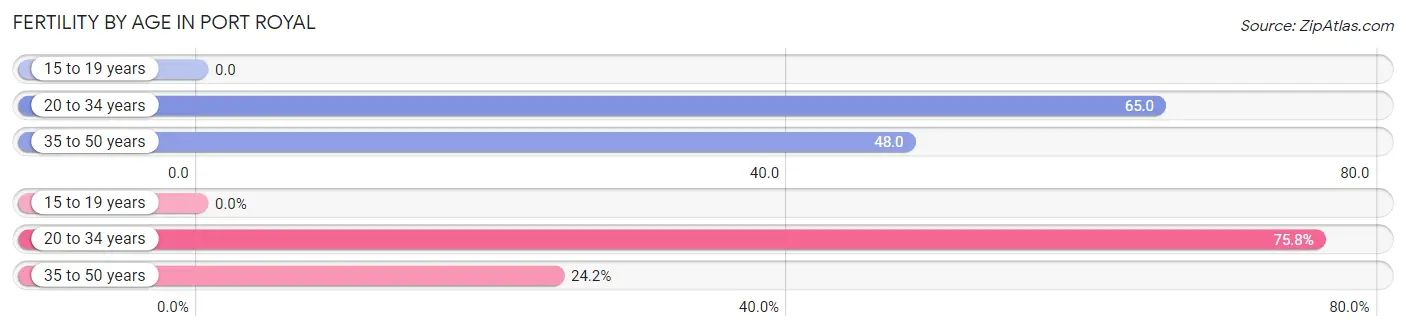
| Age Bracket | Women with Births | Births / 1,000 Women |
| 15 to 19 years | 0 (0.0%) | 0.0 |
| 20 to 34 years | 135 (75.8%) | 65.0 |
| 35 to 50 years | 43 (24.2%) | 48.0 |
| Total | 178 (100.0%) | 52.0 |
Fertility by Age by Marriage Status in Port Royal
77.5% of women with births (178) in Port Royal are married. The highest percentage of unmarried women with births falls into 35 to 50 years age bracket with 34.9% of them unmarried at the time of birth, while the lowest percentage of unmarried women with births belong to 20 to 34 years age bracket with 18.5% of them unmarried.
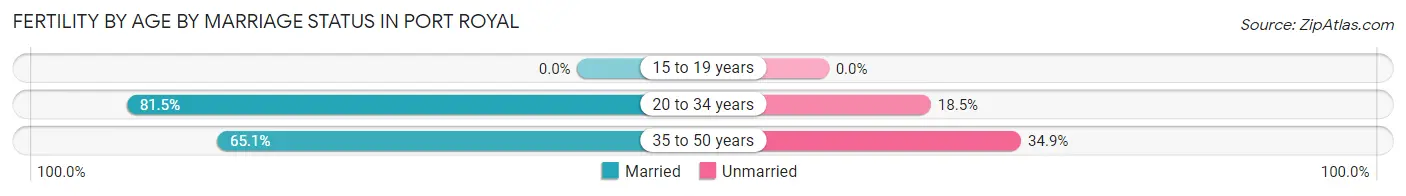
| Age Bracket | Married | Unmarried |
| 15 to 19 years | 0 (0.0%) | 0 (0.0%) |
| 20 to 34 years | 110 (81.5%) | 25 (18.5%) |
| 35 to 50 years | 28 (65.1%) | 15 (34.9%) |
| Total | 138 (77.5%) | 40 (22.5%) |
Fertility by Education in Port Royal
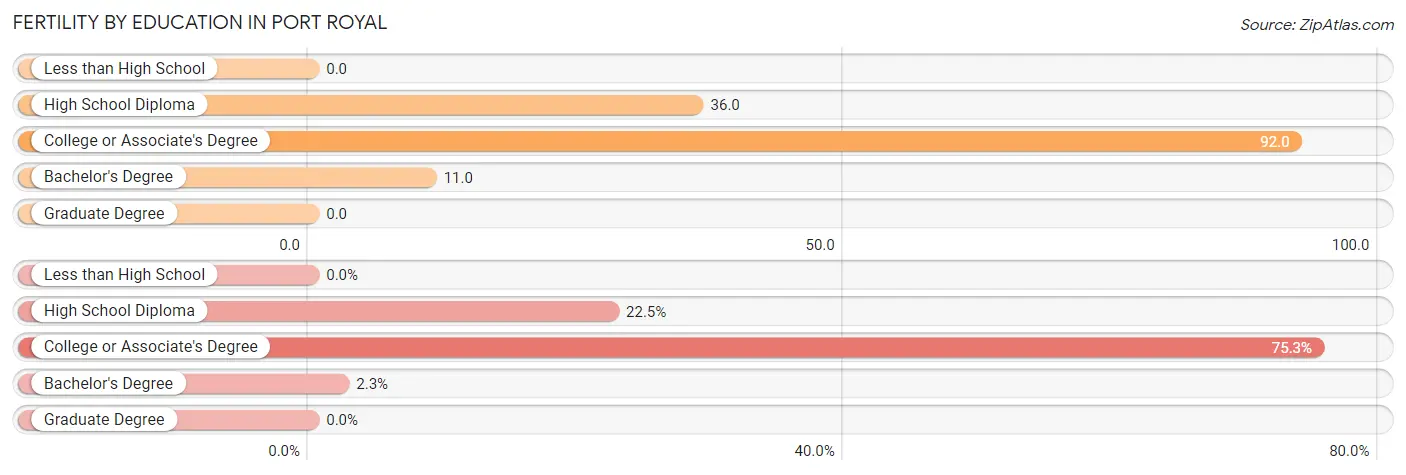
| Educational Attainment | Women with Births | Births / 1,000 Women |
| Less than High School | 0 (0.0%) | 0.0 |
| High School Diploma | 40 (22.5%) | 36.0 |
| College or Associate's Degree | 134 (75.3%) | 92.0 |
| Bachelor's Degree | 4 (2.2%) | 11.0 |
| Graduate Degree | 0 (0.0%) | 0.0 |
| Total | 178 (100.0%) | 52.0 |
Fertility by Education by Marriage Status in Port Royal
22.5% of women with births in Port Royal are unmarried. Women with the educational attainment of bachelor's degree are most likely to be married with 100.0% of them married at childbirth, while women with the educational attainment of high school diploma are least likely to be married with 65.0% of them unmarried at childbirth.
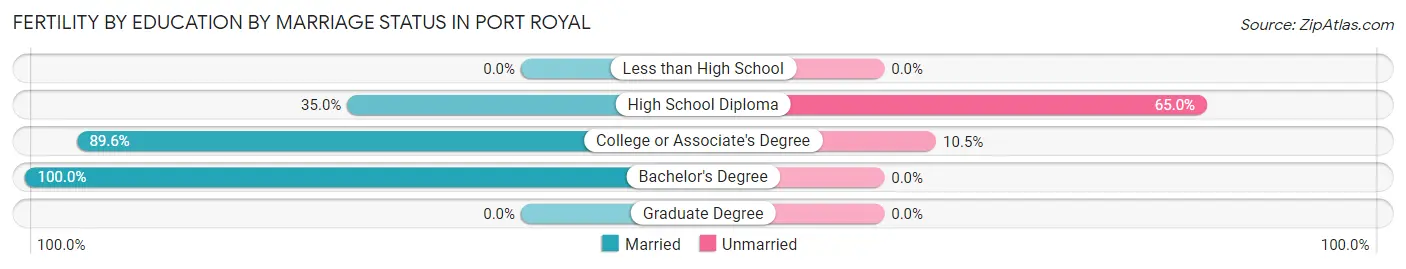
| Educational Attainment | Married | Unmarried |
| Less than High School | 0 (0.0%) | 0 (0.0%) |
| High School Diploma | 14 (35.0%) | 26 (65.0%) |
| College or Associate's Degree | 120 (89.5%) | 14 (10.4%) |
| Bachelor's Degree | 4 (100.0%) | 0 (0.0%) |
| Graduate Degree | 0 (0.0%) | 0 (0.0%) |
| Total | 138 (77.5%) | 40 (22.5%) |
Employment Characteristics in Port Royal
Employment by Class of Employer in Port Royal
Among the 8,669 employed individuals in Port Royal, federal government employees (3,617 | 41.7%), private company employees (3,447 | 39.8%), and not-for-profit organizations (498 | 5.7%) make up the most common classes of employment.
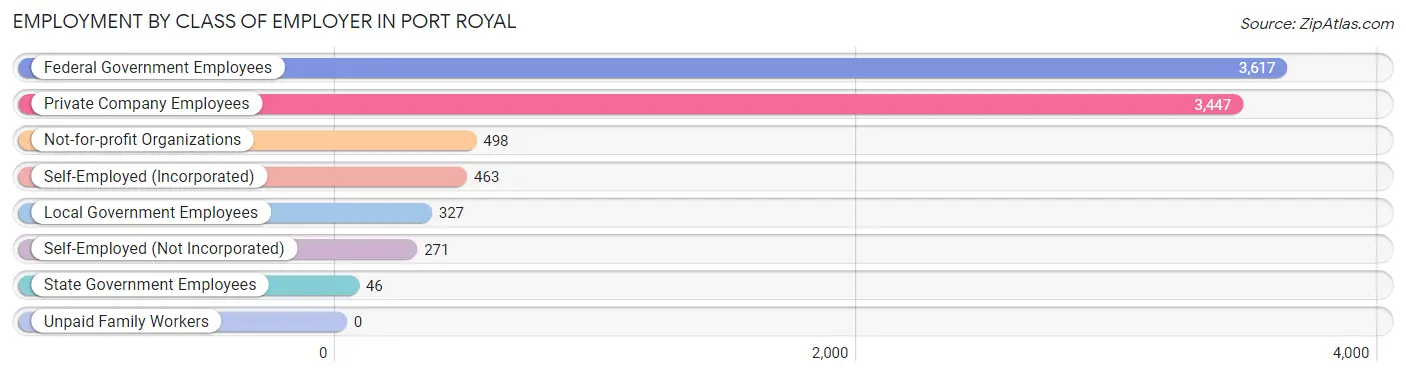
| Employer Class | # Employees | % Employees |
| Private Company Employees | 3,447 | 39.8% |
| Self-Employed (Incorporated) | 463 | 5.3% |
| Self-Employed (Not Incorporated) | 271 | 3.1% |
| Not-for-profit Organizations | 498 | 5.7% |
| Local Government Employees | 327 | 3.8% |
| State Government Employees | 46 | 0.5% |
| Federal Government Employees | 3,617 | 41.7% |
| Unpaid Family Workers | 0 | 0.0% |
| Total | 8,669 | 100.0% |
Employment Status by Age in Port Royal
According to the labor force statistics for Port Royal, out of the total population over 16 years of age (12,493), 71.1% or 8,883 individuals are in the labor force, with 1.6% or 142 of them unemployed. The age group with the highest labor force participation rate is 35 to 44 years, with 87.8% or 1,061 individuals in the labor force. Within the labor force, the 20 to 24 years age range has the highest percentage of unemployed individuals, with 9.8% or 249 of them being unemployed.
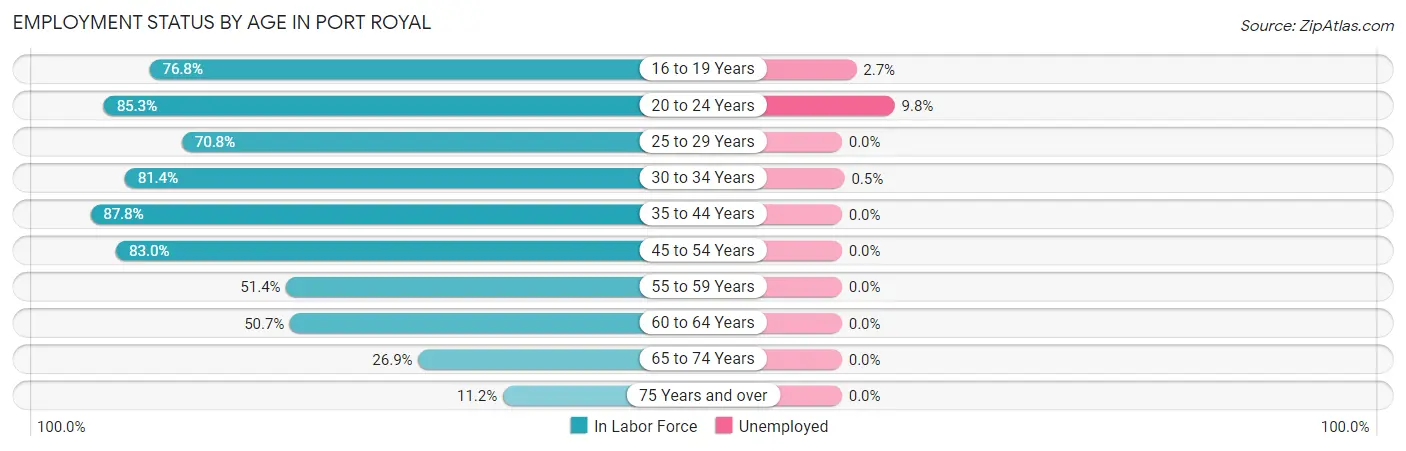
| Age Bracket | In Labor Force | Unemployed |
| 16 to 19 Years | 1,457 (76.8%) | 39 (2.7%) |
| 20 to 24 Years | 2,539 (85.3%) | 249 (9.8%) |
| 25 to 29 Years | 886 (70.8%) | 0 (0.0%) |
| 30 to 34 Years | 1,029 (81.4%) | 5 (0.5%) |
| 35 to 44 Years | 1,061 (87.8%) | 0 (0.0%) |
| 45 to 54 Years | 995 (83.0%) | 0 (0.0%) |
| 55 to 59 Years | 267 (51.4%) | 0 (0.0%) |
| 60 to 64 Years | 300 (50.7%) | 0 (0.0%) |
| 65 to 74 Years | 298 (26.9%) | 0 (0.0%) |
| 75 Years and over | 54 (11.2%) | 0 (0.0%) |
| Total | 8,883 (71.1%) | 142 (1.6%) |
Employment Status by Educational Attainment in Port Royal
According to labor force statistics for Port Royal, 75.2% of individuals (4,537) out of the total population between 25 and 64 years of age (6,033) are in the labor force, with 0.1% or 5 of them being unemployed. The group with the highest labor force participation rate are those with the educational attainment of bachelor's degree or higher, with 86.3% or 1,591 individuals in the labor force. Within the labor force, individuals with bachelor's degree or higher education have the highest percentage of unemployment, with 0.3% or 5 of them being unemployed.
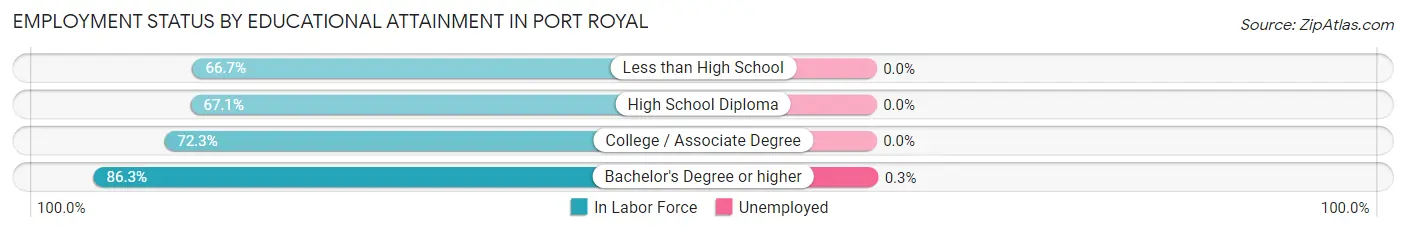
| Educational Attainment | In Labor Force | Unemployed |
| Less than High School | 198 (66.7%) | 0 (0.0%) |
| High School Diploma | 854 (67.1%) | 0 (0.0%) |
| College / Associate Degree | 1,895 (72.3%) | 0 (0.0%) |
| Bachelor's Degree or higher | 1,591 (86.3%) | 6 (0.3%) |
| Total | 4,537 (75.2%) | 6 (0.1%) |
Employment Occupations by Sex in Port Royal
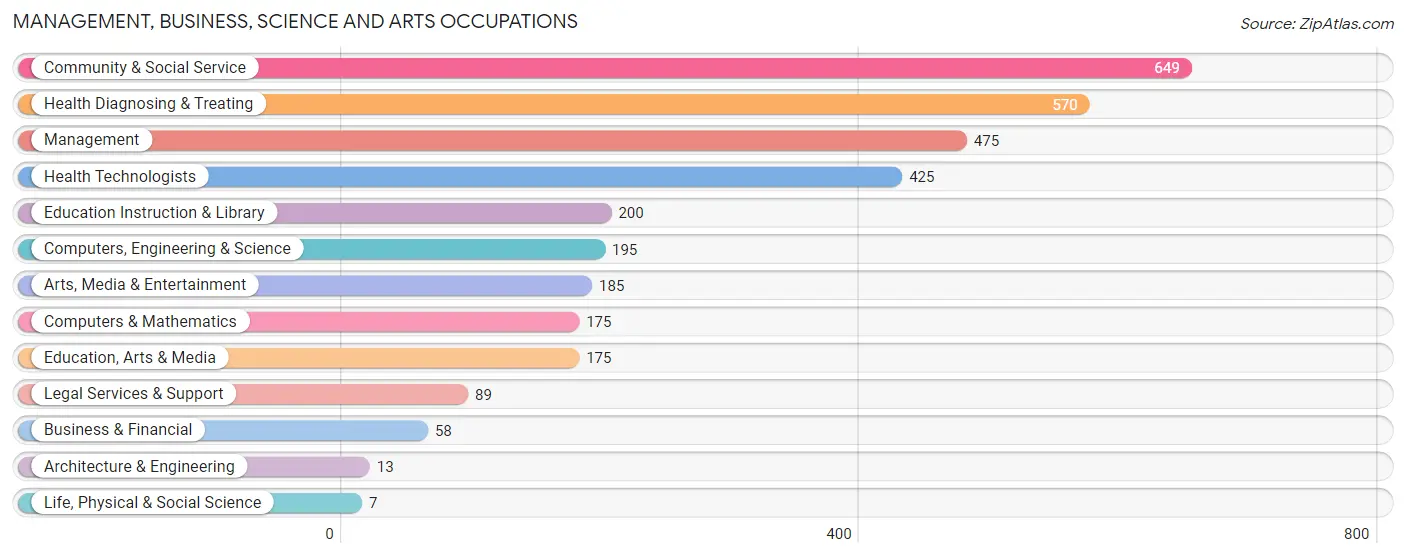
Management, Business, Science and Arts Occupations
The most common Management, Business, Science and Arts occupations in Port Royal are Community & Social Service (649 | 12.1%), Health Diagnosing & Treating (570 | 10.6%), Management (475 | 8.8%), Health Technologists (425 | 7.9%), and Education Instruction & Library (200 | 3.7%).
Management, Business, Science and Arts Occupations by Sex
Within the Management, Business, Science and Arts occupations in Port Royal, the most male-oriented occupations are Life, Physical & Social Science (100.0%), Arts, Media & Entertainment (76.8%), and Health Technologists (69.9%), while the most female-oriented occupations are Architecture & Engineering (100.0%), Computers & Mathematics (93.1%), and Education Instruction & Library (91.5%).
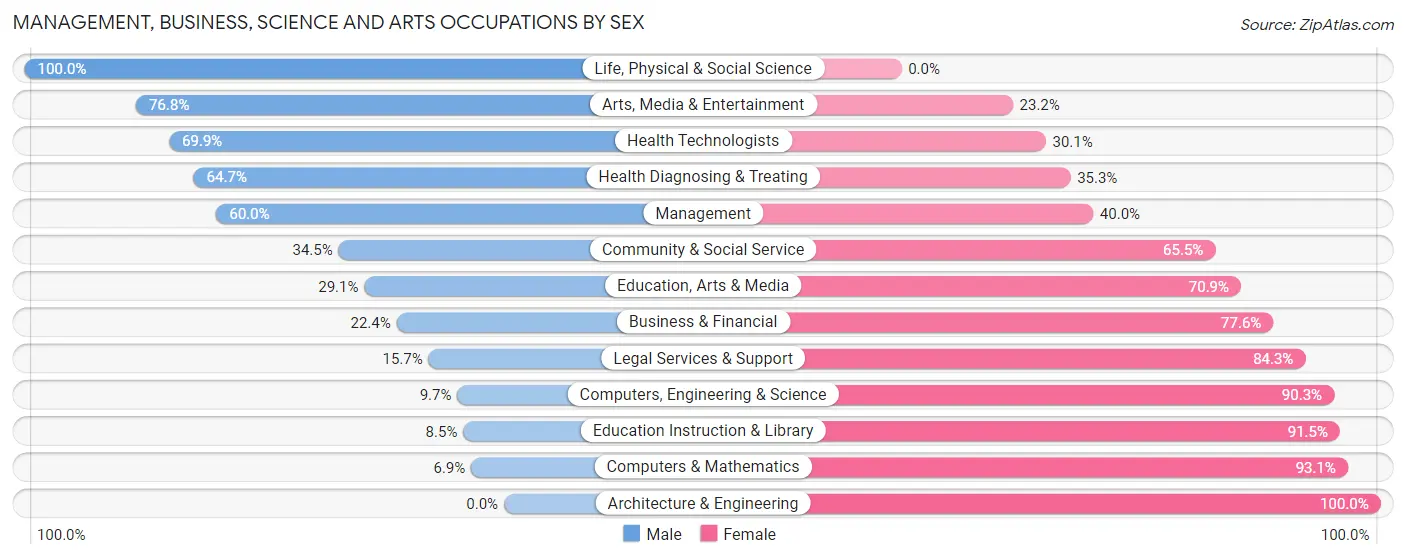
| Occupation | Male | Female |
| Management | 285 (60.0%) | 190 (40.0%) |
| Business & Financial | 13 (22.4%) | 45 (77.6%) |
| Computers, Engineering & Science | 19 (9.7%) | 176 (90.3%) |
| Computers & Mathematics | 12 (6.9%) | 163 (93.1%) |
| Architecture & Engineering | 0 (0.0%) | 13 (100.0%) |
| Life, Physical & Social Science | 7 (100.0%) | 0 (0.0%) |
| Community & Social Service | 224 (34.5%) | 425 (65.5%) |
| Education, Arts & Media | 51 (29.1%) | 124 (70.9%) |
| Legal Services & Support | 14 (15.7%) | 75 (84.3%) |
| Education Instruction & Library | 17 (8.5%) | 183 (91.5%) |
| Arts, Media & Entertainment | 142 (76.8%) | 43 (23.2%) |
| Health Diagnosing & Treating | 369 (64.7%) | 201 (35.3%) |
| Health Technologists | 297 (69.9%) | 128 (30.1%) |
| Total (Category) | 910 (46.7%) | 1,037 (53.3%) |
| Total (Overall) | 2,912 (54.2%) | 2,459 (45.8%) |
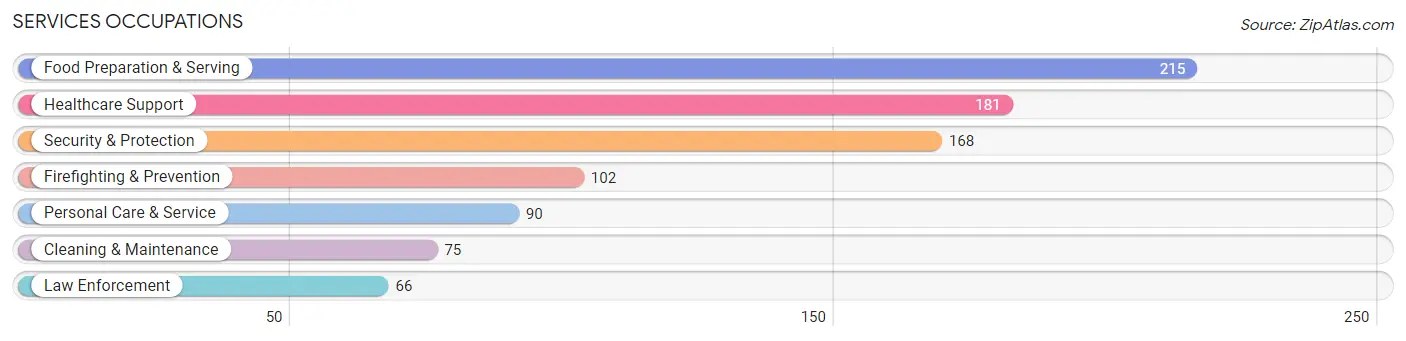
Services Occupations
The most common Services occupations in Port Royal are Food Preparation & Serving (215 | 4.0%), Healthcare Support (181 | 3.4%), Security & Protection (168 | 3.1%), Firefighting & Prevention (102 | 1.9%), and Personal Care & Service (90 | 1.7%).
Services Occupations by Sex
Within the Services occupations in Port Royal, the most male-oriented occupations are Firefighting & Prevention (95.1%), Cleaning & Maintenance (93.3%), and Security & Protection (92.3%), while the most female-oriented occupations are Personal Care & Service (78.9%), Healthcare Support (66.8%), and Food Preparation & Serving (38.6%).
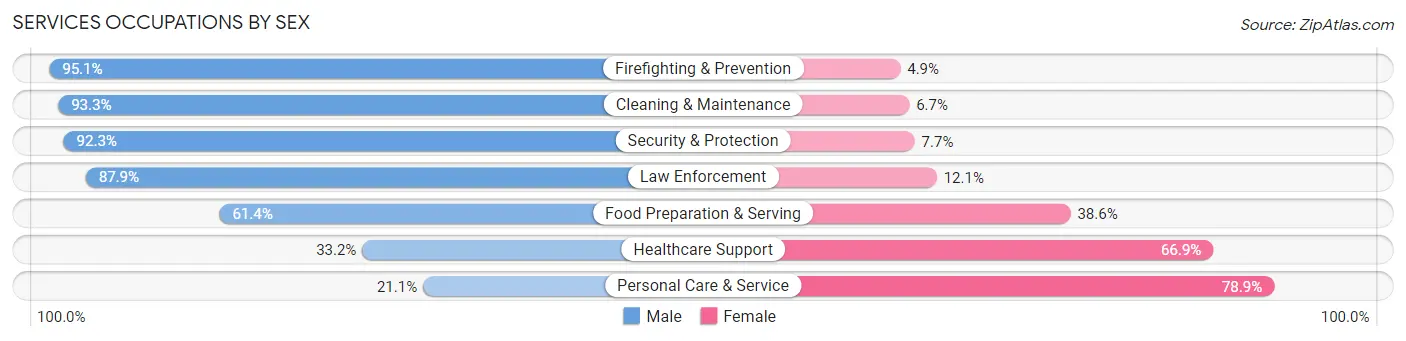
| Occupation | Male | Female |
| Healthcare Support | 60 (33.2%) | 121 (66.8%) |
| Security & Protection | 155 (92.3%) | 13 (7.7%) |
| Firefighting & Prevention | 97 (95.1%) | 5 (4.9%) |
| Law Enforcement | 58 (87.9%) | 8 (12.1%) |
| Food Preparation & Serving | 132 (61.4%) | 83 (38.6%) |
| Cleaning & Maintenance | 70 (93.3%) | 5 (6.7%) |
| Personal Care & Service | 19 (21.1%) | 71 (78.9%) |
| Total (Category) | 436 (59.8%) | 293 (40.2%) |
| Total (Overall) | 2,912 (54.2%) | 2,459 (45.8%) |
Sales and Office Occupations
The most common Sales and Office occupations in Port Royal are Sales & Related (1,217 | 22.7%), and Office & Administration (496 | 9.2%).

Sales and Office Occupations by Sex
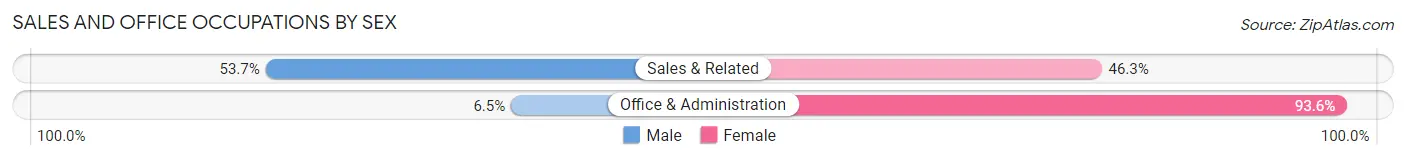
| Occupation | Male | Female |
| Sales & Related | 653 (53.7%) | 564 (46.3%) |
| Office & Administration | 32 (6.5%) | 464 (93.5%) |
| Total (Category) | 685 (40.0%) | 1,028 (60.0%) |
| Total (Overall) | 2,912 (54.2%) | 2,459 (45.8%) |
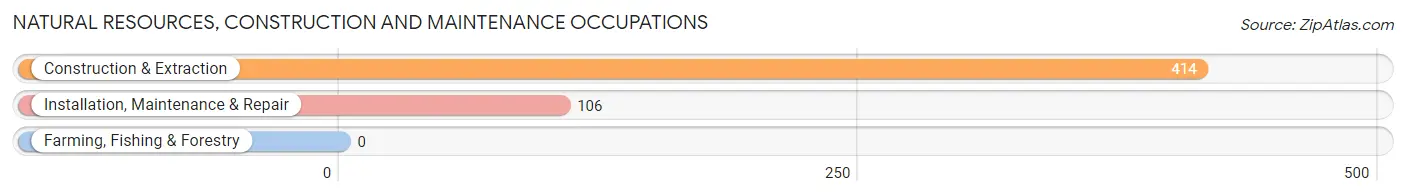
Natural Resources, Construction and Maintenance Occupations
The most common Natural Resources, Construction and Maintenance occupations in Port Royal are Construction & Extraction (414 | 7.7%), and Installation, Maintenance & Repair (106 | 2.0%).
Natural Resources, Construction and Maintenance Occupations by Sex
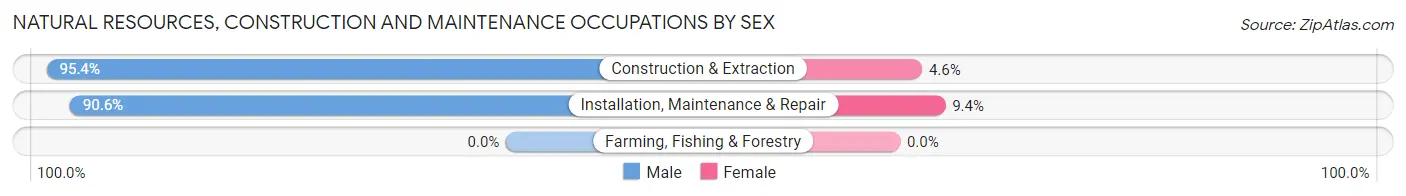
| Occupation | Male | Female |
| Farming, Fishing & Forestry | 0 (0.0%) | 0 (0.0%) |
| Construction & Extraction | 395 (95.4%) | 19 (4.6%) |
| Installation, Maintenance & Repair | 96 (90.6%) | 10 (9.4%) |
| Total (Category) | 491 (94.4%) | 29 (5.6%) |
| Total (Overall) | 2,912 (54.2%) | 2,459 (45.8%) |
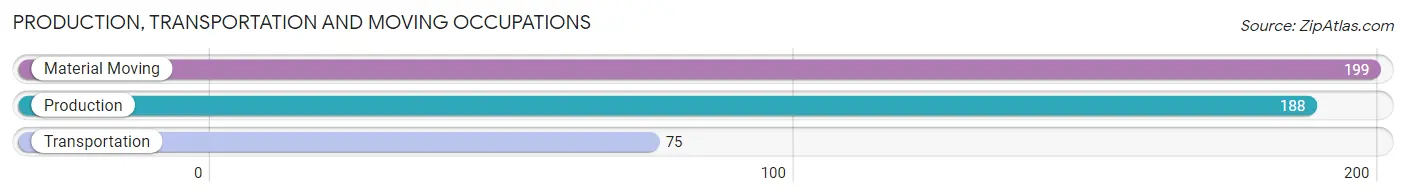
Production, Transportation and Moving Occupations
The most common Production, Transportation and Moving occupations in Port Royal are Material Moving (199 | 3.7%), Production (188 | 3.5%), and Transportation (75 | 1.4%).
Production, Transportation and Moving Occupations by Sex
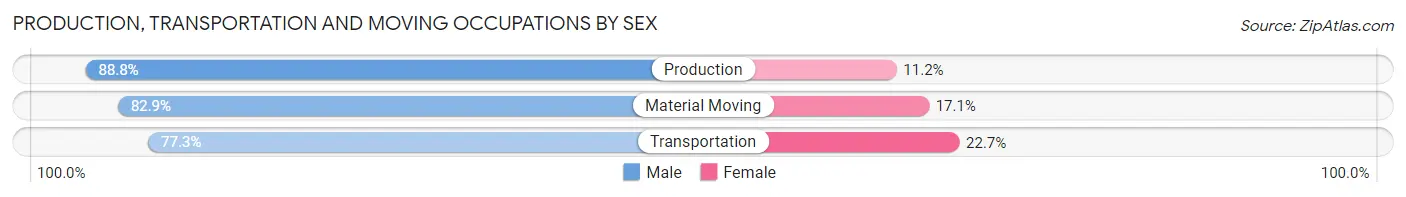
| Occupation | Male | Female |
| Production | 167 (88.8%) | 21 (11.2%) |
| Transportation | 58 (77.3%) | 17 (22.7%) |
| Material Moving | 165 (82.9%) | 34 (17.1%) |
| Total (Category) | 390 (84.4%) | 72 (15.6%) |
| Total (Overall) | 2,912 (54.2%) | 2,459 (45.8%) |
Employment Industries by Sex in Port Royal
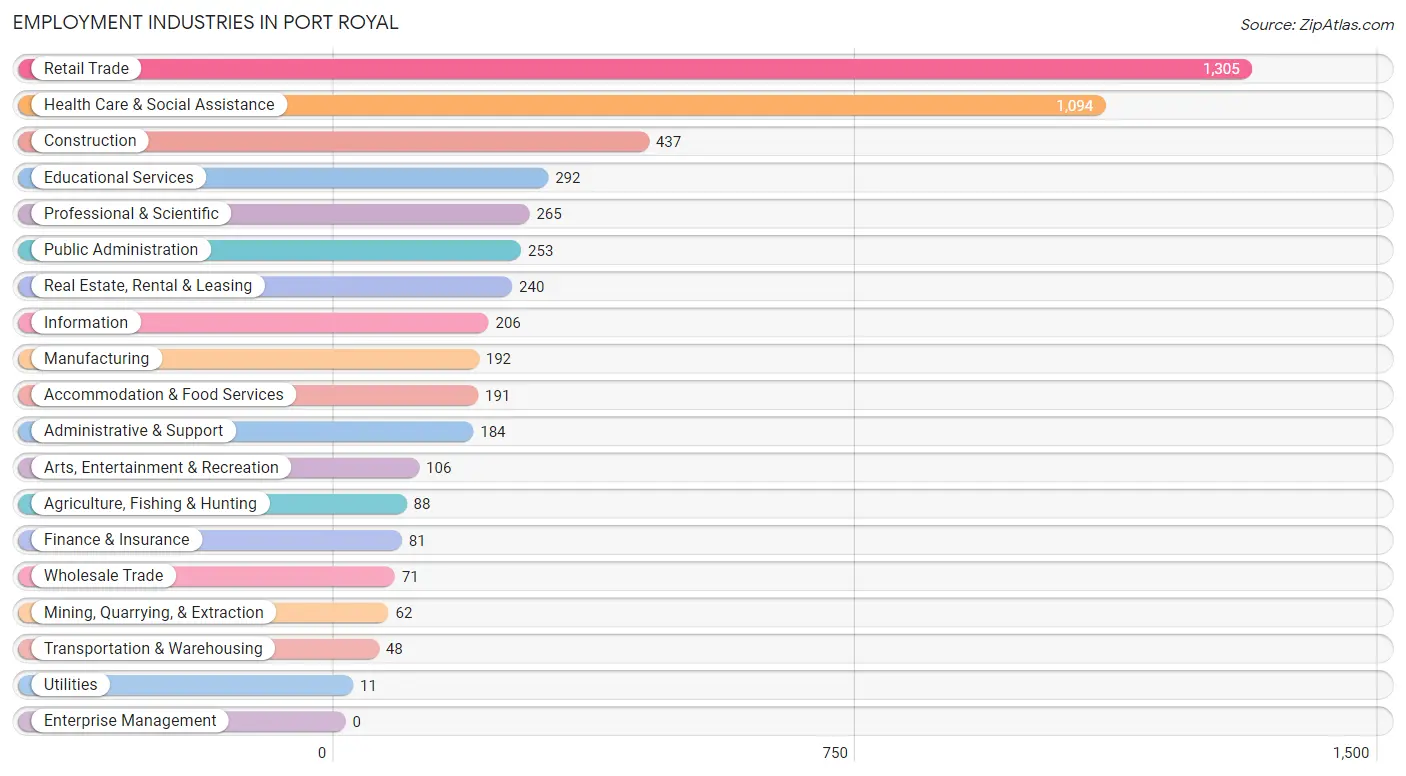
Employment Industries in Port Royal
The major employment industries in Port Royal include Retail Trade (1,305 | 24.3%), Health Care & Social Assistance (1,094 | 20.4%), Construction (437 | 8.1%), Educational Services (292 | 5.4%), and Professional & Scientific (265 | 4.9%).
Employment Industries by Sex in Port Royal
The Port Royal industries that see more men than women are Mining, Quarrying, & Extraction (100.0%), Utilities (100.0%), and Construction (92.0%), whereas the industries that tend to have a higher number of women are Agriculture, Fishing & Hunting (100.0%), Information (100.0%), and Finance & Insurance (100.0%).
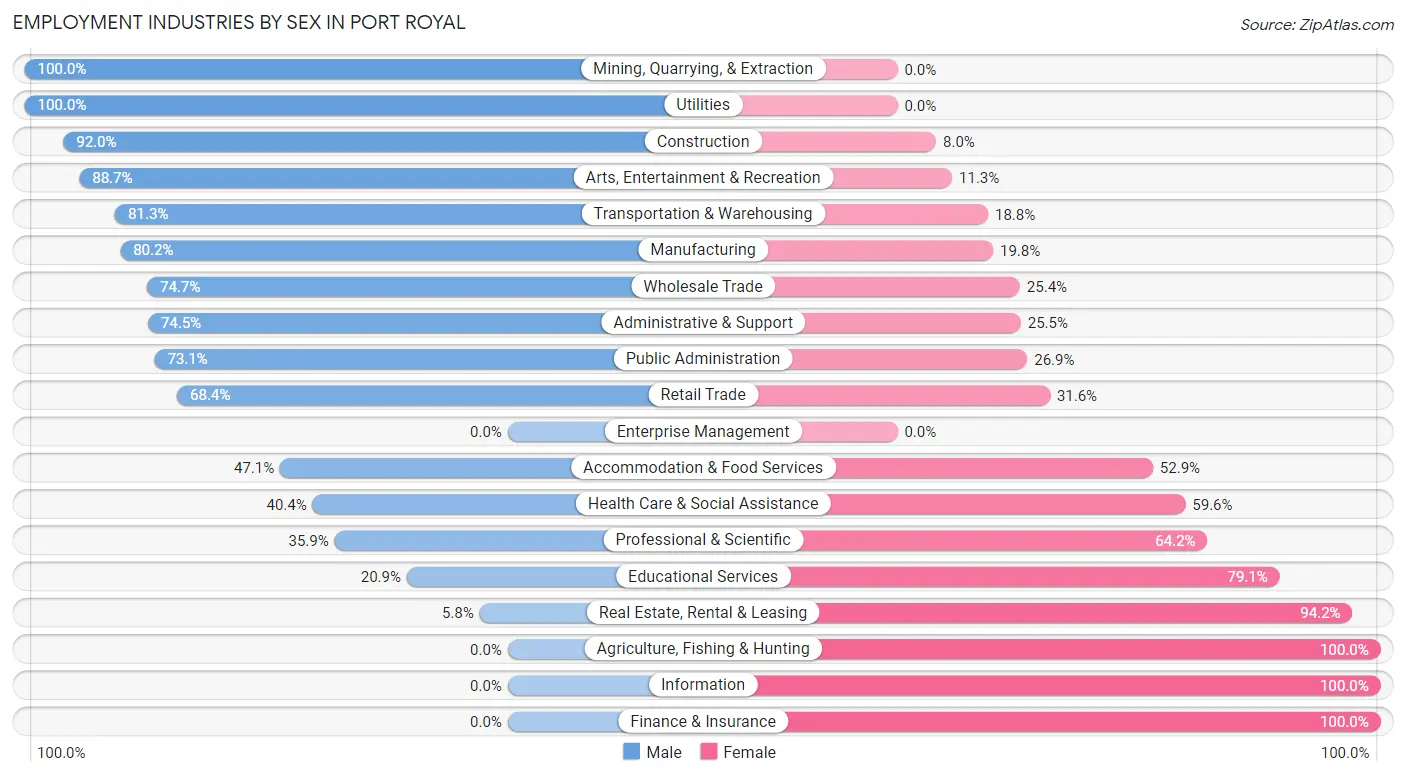
| Industry | Male | Female |
| Agriculture, Fishing & Hunting | 0 (0.0%) | 88 (100.0%) |
| Mining, Quarrying, & Extraction | 62 (100.0%) | 0 (0.0%) |
| Construction | 402 (92.0%) | 35 (8.0%) |
| Manufacturing | 154 (80.2%) | 38 (19.8%) |
| Wholesale Trade | 53 (74.7%) | 18 (25.4%) |
| Retail Trade | 893 (68.4%) | 412 (31.6%) |
| Transportation & Warehousing | 39 (81.2%) | 9 (18.8%) |
| Utilities | 11 (100.0%) | 0 (0.0%) |
| Information | 0 (0.0%) | 206 (100.0%) |
| Finance & Insurance | 0 (0.0%) | 81 (100.0%) |
| Real Estate, Rental & Leasing | 14 (5.8%) | 226 (94.2%) |
| Professional & Scientific | 95 (35.8%) | 170 (64.1%) |
| Enterprise Management | 0 (0.0%) | 0 (0.0%) |
| Administrative & Support | 137 (74.5%) | 47 (25.5%) |
| Educational Services | 61 (20.9%) | 231 (79.1%) |
| Health Care & Social Assistance | 442 (40.4%) | 652 (59.6%) |
| Arts, Entertainment & Recreation | 94 (88.7%) | 12 (11.3%) |
| Accommodation & Food Services | 90 (47.1%) | 101 (52.9%) |
| Public Administration | 185 (73.1%) | 68 (26.9%) |
| Total | 2,912 (54.2%) | 2,459 (45.8%) |
Education in Port Royal
School Enrollment in Port Royal
The most common levels of schooling among the 2,474 students in Port Royal are college / undergraduate (915 | 37.0%), high school (499 | 20.2%), and elementary school (400 | 16.2%).
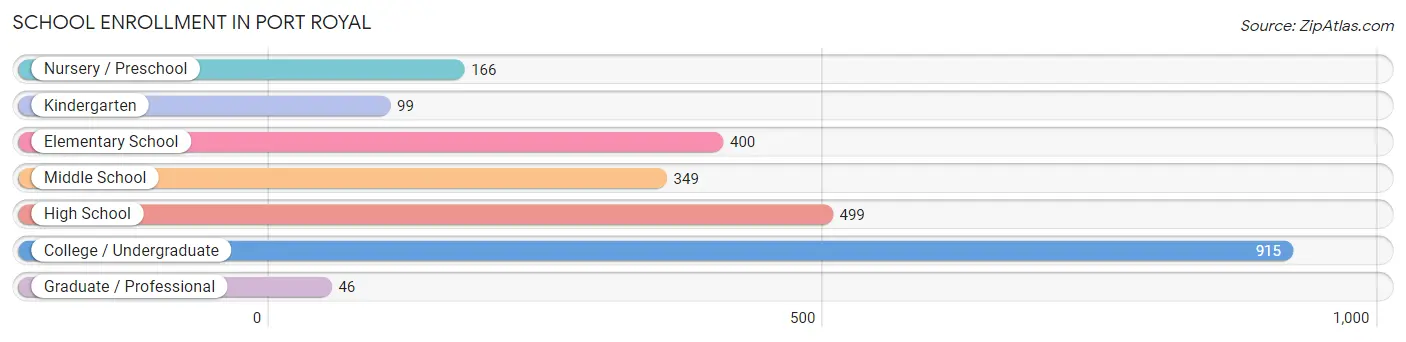
| School Level | # Students | % Students |
| Nursery / Preschool | 166 | 6.7% |
| Kindergarten | 99 | 4.0% |
| Elementary School | 400 | 16.2% |
| Middle School | 349 | 14.1% |
| High School | 499 | 20.2% |
| College / Undergraduate | 915 | 37.0% |
| Graduate / Professional | 46 | 1.9% |
| Total | 2,474 | 100.0% |
School Enrollment by Age by Funding Source in Port Royal
Out of a total of 2,474 students who are enrolled in schools in Port Royal, 156 (6.3%) attend a private institution, while the remaining 2,318 (93.7%) are enrolled in public schools. The age group of 35 years and over has the highest likelihood of being enrolled in private schools, with 22 (26.2% in the age bracket) enrolled. Conversely, the age group of 18 to 19 year olds has the lowest likelihood of being enrolled in a private school, with 639 (100.0% in the age bracket) attending a public institution.
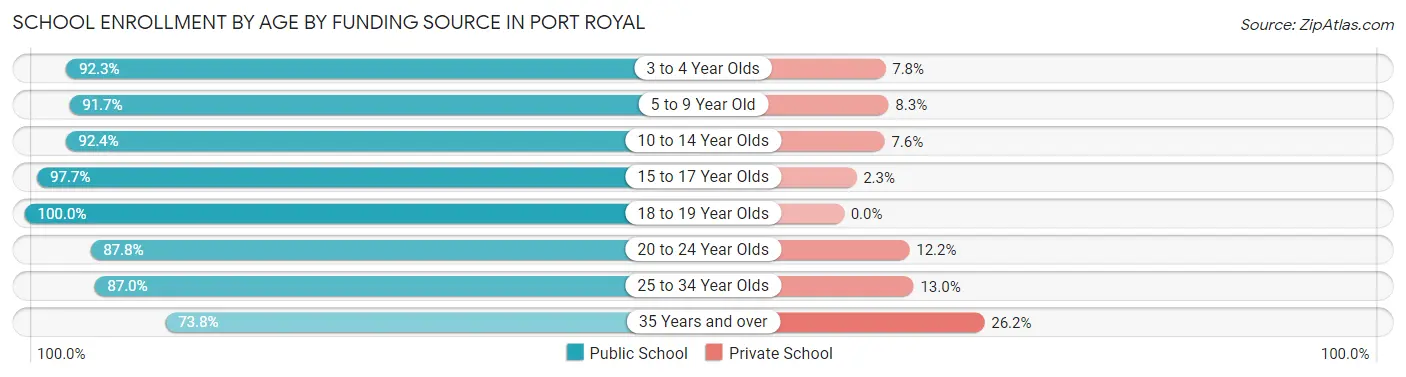
| Age Bracket | Public School | Private School |
| 3 to 4 Year Olds | 119 (92.2%) | 10 (7.7%) |
| 5 to 9 Year Old | 473 (91.7%) | 43 (8.3%) |
| 10 to 14 Year Olds | 401 (92.4%) | 33 (7.6%) |
| 15 to 17 Year Olds | 335 (97.7%) | 8 (2.3%) |
| 18 to 19 Year Olds | 639 (100.0%) | 0 (0.0%) |
| 20 to 24 Year Olds | 201 (87.8%) | 28 (12.2%) |
| 25 to 34 Year Olds | 87 (87.0%) | 13 (13.0%) |
| 35 Years and over | 62 (73.8%) | 22 (26.2%) |
| Total | 2,318 (93.7%) | 156 (6.3%) |
Educational Attainment by Field of Study in Port Royal
Arts & humanities (647 | 21.9%), business (444 | 15.0%), education (370 | 12.5%), literature & languages (297 | 10.0%), and social sciences (265 | 9.0%) are the most common fields of study among 2,957 individuals in Port Royal who have obtained a bachelor's degree or higher.
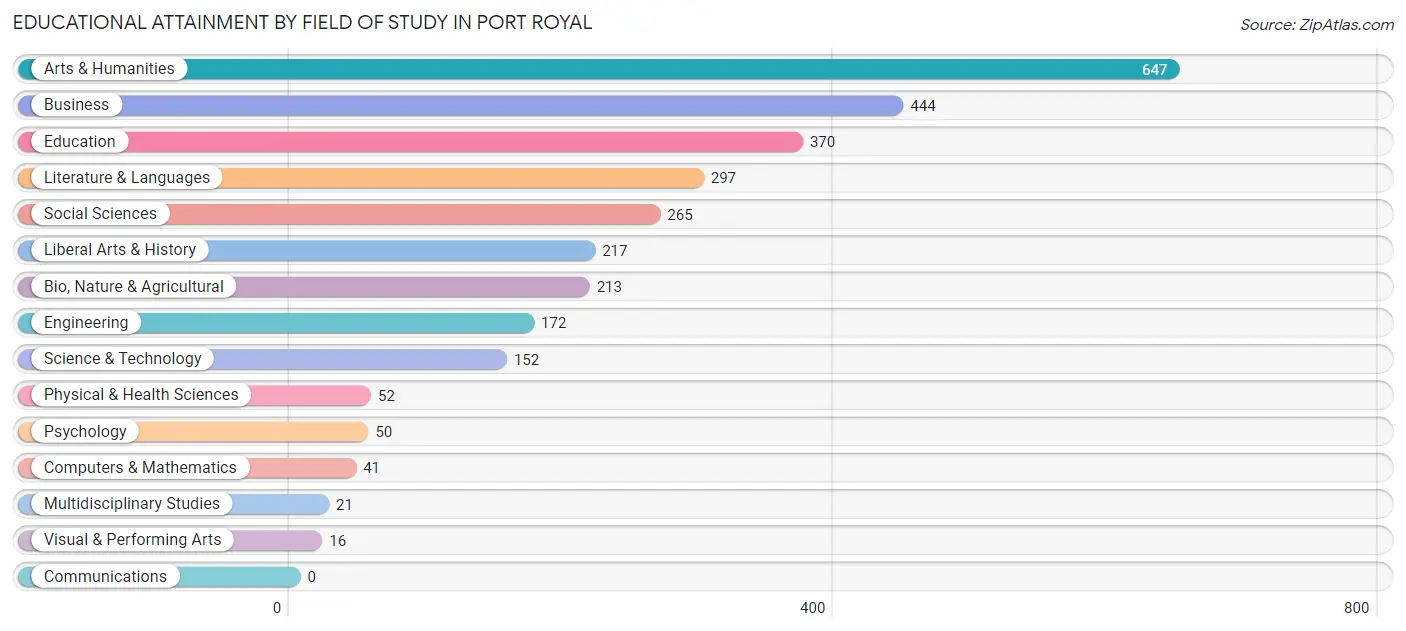
| Field of Study | # Graduates | % Graduates |
| Computers & Mathematics | 41 | 1.4% |
| Bio, Nature & Agricultural | 213 | 7.2% |
| Physical & Health Sciences | 52 | 1.8% |
| Psychology | 50 | 1.7% |
| Social Sciences | 265 | 9.0% |
| Engineering | 172 | 5.8% |
| Multidisciplinary Studies | 21 | 0.7% |
| Science & Technology | 152 | 5.1% |
| Business | 444 | 15.0% |
| Education | 370 | 12.5% |
| Literature & Languages | 297 | 10.0% |
| Liberal Arts & History | 217 | 7.3% |
| Visual & Performing Arts | 16 | 0.5% |
| Communications | 0 | 0.0% |
| Arts & Humanities | 647 | 21.9% |
| Total | 2,957 | 100.0% |
Transportation & Commute in Port Royal
Vehicle Availability by Sex in Port Royal
The most prevalent vehicle ownership categories in Port Royal are males with 2 vehicles (1,975, accounting for 53.7%) and females with 2 vehicles (1,208, making up 86.1%).
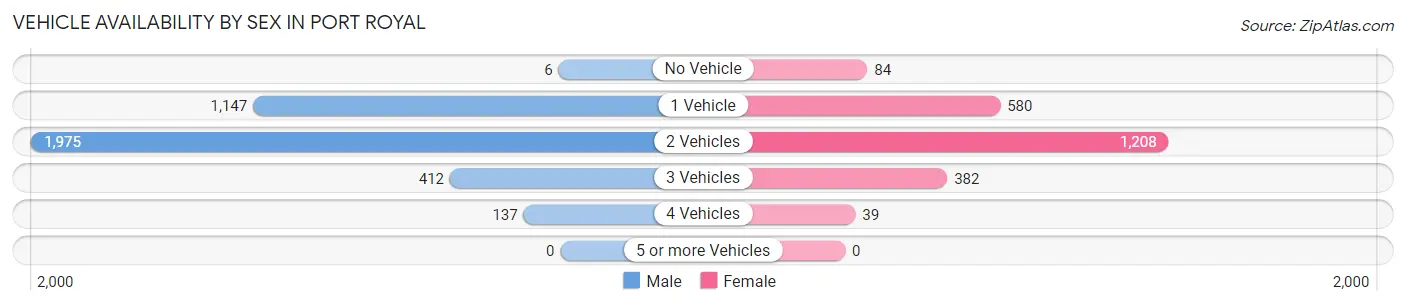
| Vehicles Available | Male | Female |
| No Vehicle | 6 (0.2%) | 84 (3.7%) |
| 1 Vehicle | 1,147 (31.2%) | 580 (25.3%) |
| 2 Vehicles | 1,975 (53.7%) | 1,208 (52.7%) |
| 3 Vehicles | 412 (11.2%) | 382 (16.7%) |
| 4 Vehicles | 137 (3.7%) | 39 (1.7%) |
| 5 or more Vehicles | 0 (0.0%) | 0 (0.0%) |
| Total | 3,677 (100.0%) | 2,293 (100.0%) |
Commute Time in Port Royal
The most frequently occuring commute durations in Port Royal are less than 5 minutes (1,723 commuters, 22.2%), 5 to 9 minutes (1,667 commuters, 21.5%), and 15 to 19 minutes (1,445 commuters, 18.6%).
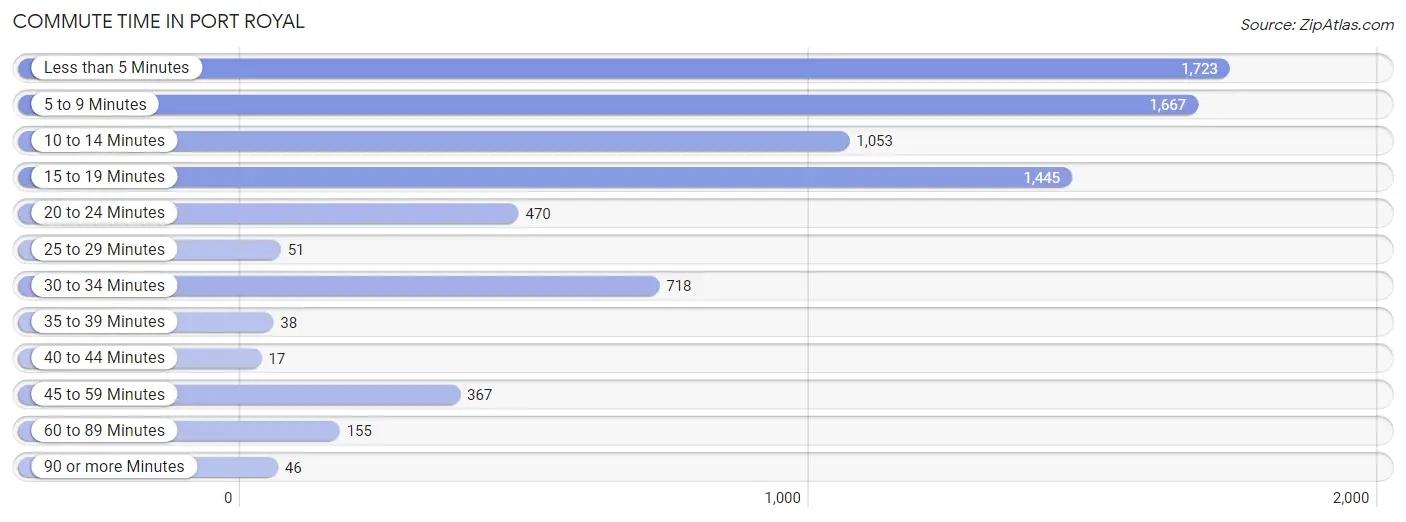
| Commute Time | # Commuters | % Commuters |
| Less than 5 Minutes | 1,723 | 22.2% |
| 5 to 9 Minutes | 1,667 | 21.5% |
| 10 to 14 Minutes | 1,053 | 13.6% |
| 15 to 19 Minutes | 1,445 | 18.6% |
| 20 to 24 Minutes | 470 | 6.1% |
| 25 to 29 Minutes | 51 | 0.7% |
| 30 to 34 Minutes | 718 | 9.3% |
| 35 to 39 Minutes | 38 | 0.5% |
| 40 to 44 Minutes | 17 | 0.2% |
| 45 to 59 Minutes | 367 | 4.7% |
| 60 to 89 Minutes | 155 | 2.0% |
| 90 or more Minutes | 46 | 0.6% |
Commute Time by Sex in Port Royal
The most common commute times in Port Royal are less than 5 minutes (1,210 commuters, 22.5%) for males and less than 5 minutes (513 commuters, 21.7%) for females.
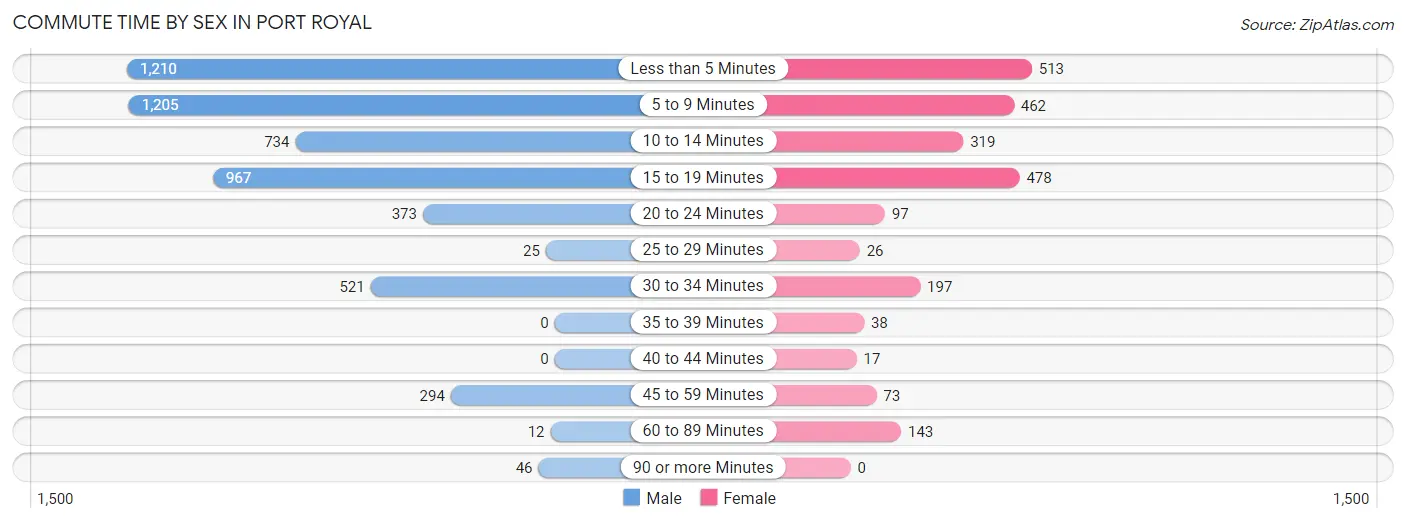
| Commute Time | Male | Female |
| Less than 5 Minutes | 1,210 (22.5%) | 513 (21.7%) |
| 5 to 9 Minutes | 1,205 (22.4%) | 462 (19.6%) |
| 10 to 14 Minutes | 734 (13.6%) | 319 (13.5%) |
| 15 to 19 Minutes | 967 (17.9%) | 478 (20.2%) |
| 20 to 24 Minutes | 373 (6.9%) | 97 (4.1%) |
| 25 to 29 Minutes | 25 (0.5%) | 26 (1.1%) |
| 30 to 34 Minutes | 521 (9.7%) | 197 (8.3%) |
| 35 to 39 Minutes | 0 (0.0%) | 38 (1.6%) |
| 40 to 44 Minutes | 0 (0.0%) | 17 (0.7%) |
| 45 to 59 Minutes | 294 (5.5%) | 73 (3.1%) |
| 60 to 89 Minutes | 12 (0.2%) | 143 (6.0%) |
| 90 or more Minutes | 46 (0.9%) | 0 (0.0%) |
Time of Departure to Work by Sex in Port Royal
The most frequent times of departure to work in Port Royal are 6:30 AM to 6:59 AM (989, 18.4%) for males and 7:30 AM to 7:59 AM (344, 14.6%) for females.
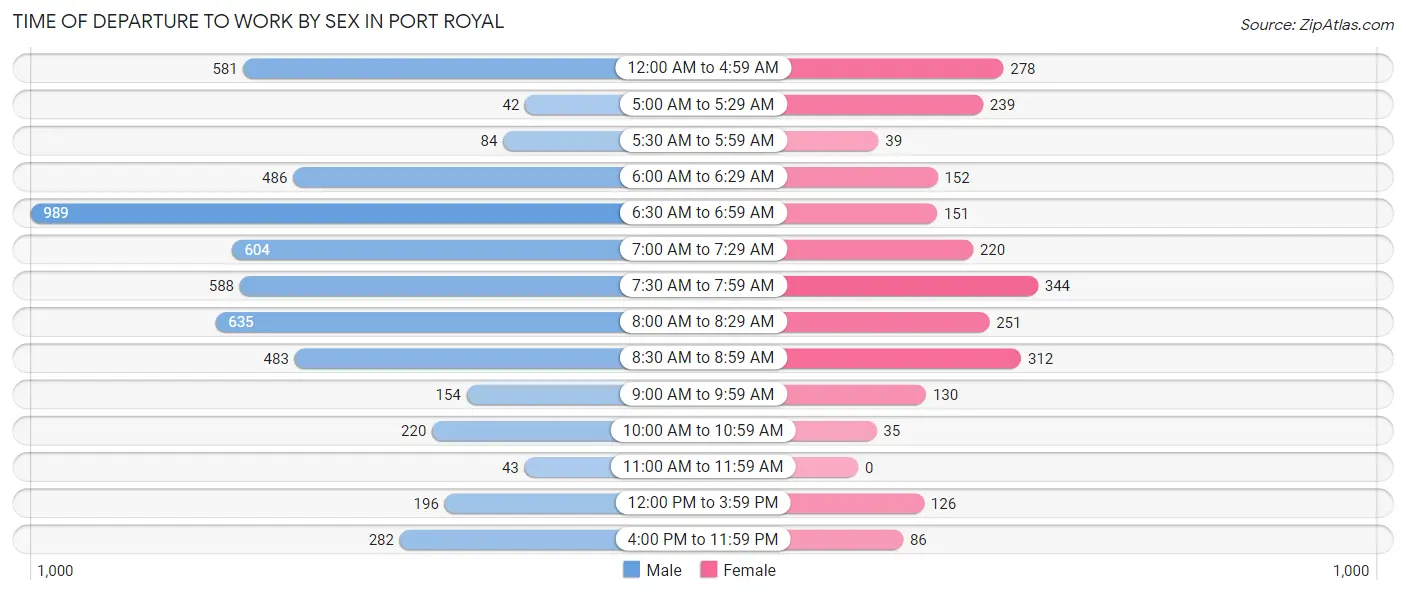
| Time of Departure | Male | Female |
| 12:00 AM to 4:59 AM | 581 (10.8%) | 278 (11.8%) |
| 5:00 AM to 5:29 AM | 42 (0.8%) | 239 (10.1%) |
| 5:30 AM to 5:59 AM | 84 (1.6%) | 39 (1.7%) |
| 6:00 AM to 6:29 AM | 486 (9.0%) | 152 (6.4%) |
| 6:30 AM to 6:59 AM | 989 (18.4%) | 151 (6.4%) |
| 7:00 AM to 7:29 AM | 604 (11.2%) | 220 (9.3%) |
| 7:30 AM to 7:59 AM | 588 (10.9%) | 344 (14.6%) |
| 8:00 AM to 8:29 AM | 635 (11.8%) | 251 (10.6%) |
| 8:30 AM to 8:59 AM | 483 (9.0%) | 312 (13.2%) |
| 9:00 AM to 9:59 AM | 154 (2.9%) | 130 (5.5%) |
| 10:00 AM to 10:59 AM | 220 (4.1%) | 35 (1.5%) |
| 11:00 AM to 11:59 AM | 43 (0.8%) | 0 (0.0%) |
| 12:00 PM to 3:59 PM | 196 (3.6%) | 126 (5.3%) |
| 4:00 PM to 11:59 PM | 282 (5.2%) | 86 (3.6%) |
| Total | 5,387 (100.0%) | 2,363 (100.0%) |
Housing Occupancy in Port Royal
Occupancy by Ownership in Port Royal
Of the total 4,705 dwellings in Port Royal, owner-occupied units account for 1,724 (36.6%), while renter-occupied units make up 2,981 (63.4%).
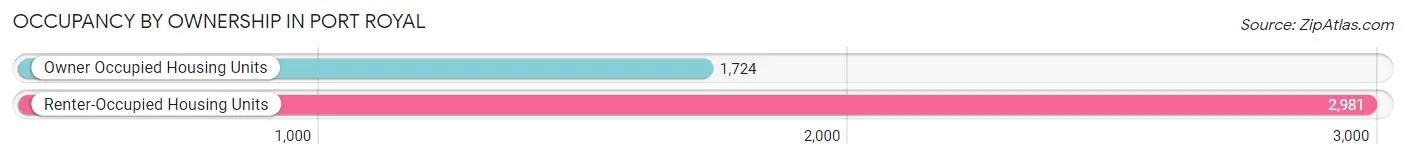
| Occupancy | # Housing Units | % Housing Units |
| Owner Occupied Housing Units | 1,724 | 36.6% |
| Renter-Occupied Housing Units | 2,981 | 63.4% |
| Total Occupied Housing Units | 4,705 | 100.0% |
Occupancy by Household Size in Port Royal
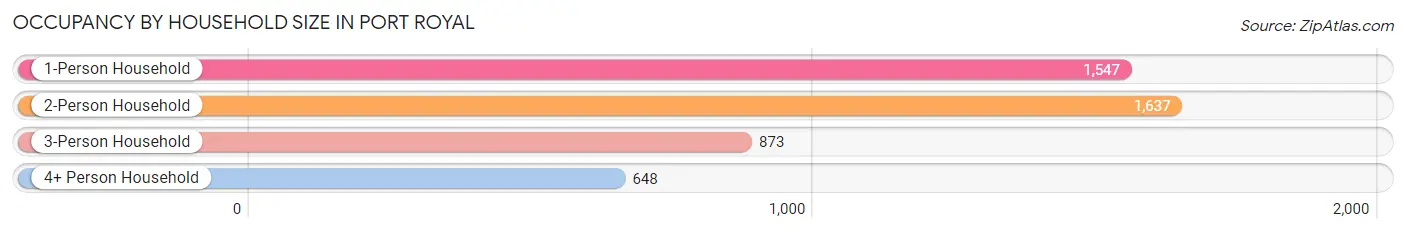
| Household Size | # Housing Units | % Housing Units |
| 1-Person Household | 1,547 | 32.9% |
| 2-Person Household | 1,637 | 34.8% |
| 3-Person Household | 873 | 18.5% |
| 4+ Person Household | 648 | 13.8% |
| Total Housing Units | 4,705 | 100.0% |
Occupancy by Ownership by Household Size in Port Royal
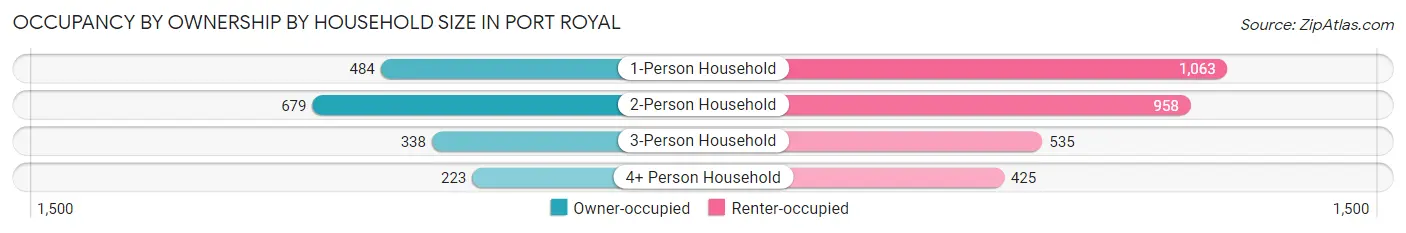
| Household Size | Owner-occupied | Renter-occupied |
| 1-Person Household | 484 (31.3%) | 1,063 (68.7%) |
| 2-Person Household | 679 (41.5%) | 958 (58.5%) |
| 3-Person Household | 338 (38.7%) | 535 (61.3%) |
| 4+ Person Household | 223 (34.4%) | 425 (65.6%) |
| Total Housing Units | 1,724 (36.6%) | 2,981 (63.4%) |
Occupancy by Educational Attainment in Port Royal
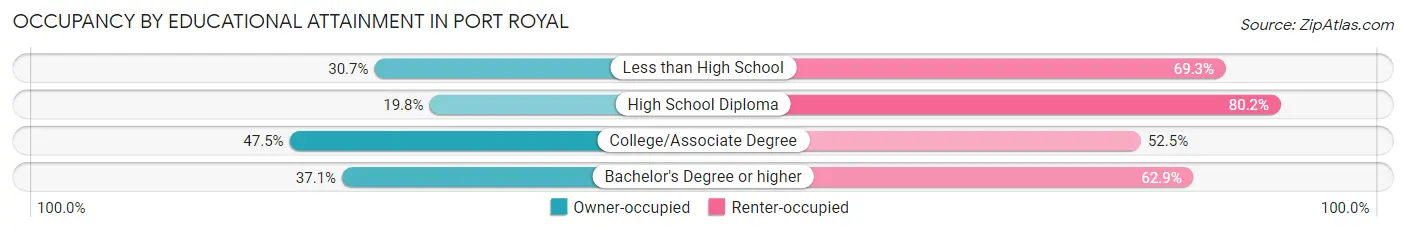
| Household Size | Owner-occupied | Renter-occupied |
| Less than High School | 92 (30.7%) | 208 (69.3%) |
| High School Diploma | 190 (19.8%) | 771 (80.2%) |
| College/Associate Degree | 751 (47.5%) | 830 (52.5%) |
| Bachelor's Degree or higher | 691 (37.1%) | 1,172 (62.9%) |
Occupancy by Age of Householder in Port Royal
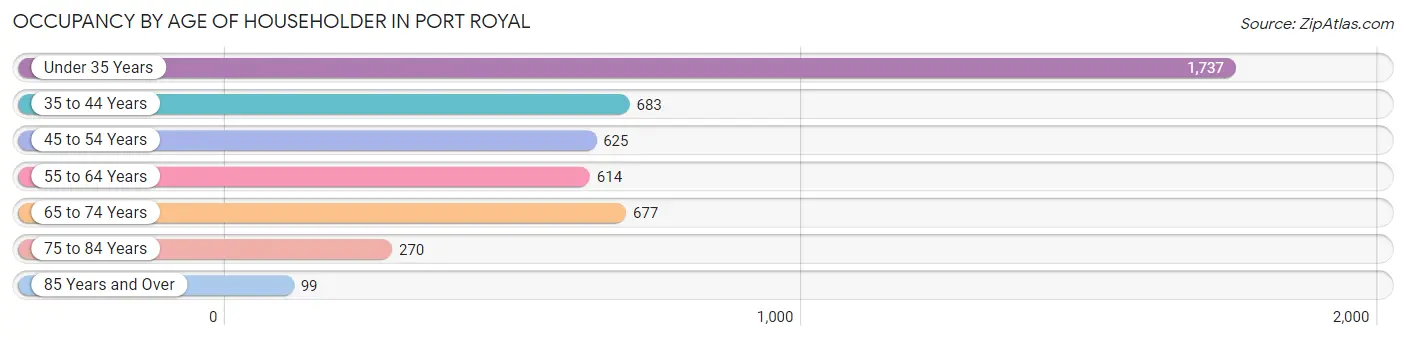
| Age Bracket | # Households | % Households |
| Under 35 Years | 1,737 | 36.9% |
| 35 to 44 Years | 683 | 14.5% |
| 45 to 54 Years | 625 | 13.3% |
| 55 to 64 Years | 614 | 13.1% |
| 65 to 74 Years | 677 | 14.4% |
| 75 to 84 Years | 270 | 5.7% |
| 85 Years and Over | 99 | 2.1% |
| Total | 4,705 | 100.0% |
Housing Finances in Port Royal
Median Income by Occupancy in Port Royal
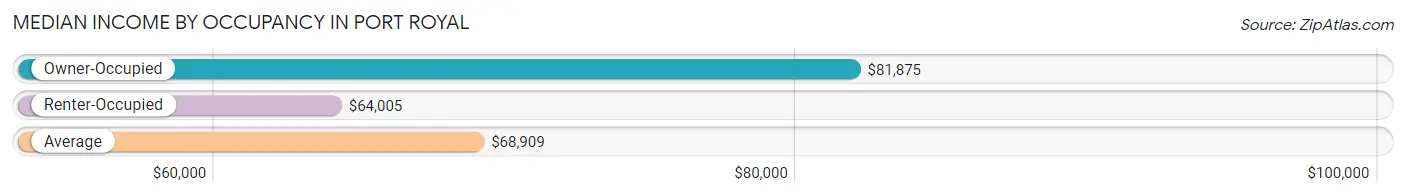
| Occupancy Type | # Households | Median Income |
| Owner-Occupied | 1,724 (36.6%) | $81,875 |
| Renter-Occupied | 2,981 (63.4%) | $64,005 |
| Average | 4,705 (100.0%) | $68,909 |
Occupancy by Householder Income Bracket in Port Royal
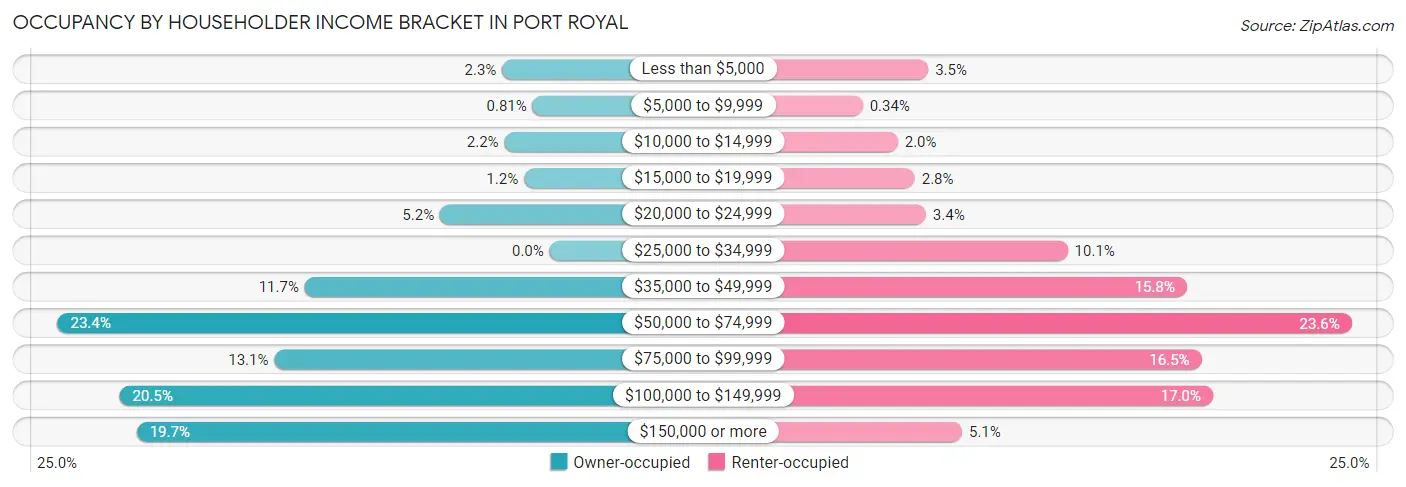
| Income Bracket | Owner-occupied | Renter-occupied |
| Less than $5,000 | 39 (2.3%) | 103 (3.5%) |
| $5,000 to $9,999 | 14 (0.8%) | 10 (0.3%) |
| $10,000 to $14,999 | 37 (2.1%) | 60 (2.0%) |
| $15,000 to $19,999 | 21 (1.2%) | 84 (2.8%) |
| $20,000 to $24,999 | 90 (5.2%) | 100 (3.4%) |
| $25,000 to $34,999 | 0 (0.0%) | 301 (10.1%) |
| $35,000 to $49,999 | 201 (11.7%) | 470 (15.8%) |
| $50,000 to $74,999 | 404 (23.4%) | 704 (23.6%) |
| $75,000 to $99,999 | 226 (13.1%) | 491 (16.5%) |
| $100,000 to $149,999 | 353 (20.5%) | 507 (17.0%) |
| $150,000 or more | 339 (19.7%) | 151 (5.1%) |
| Total | 1,724 (100.0%) | 2,981 (100.0%) |
Monthly Housing Cost Tiers in Port Royal
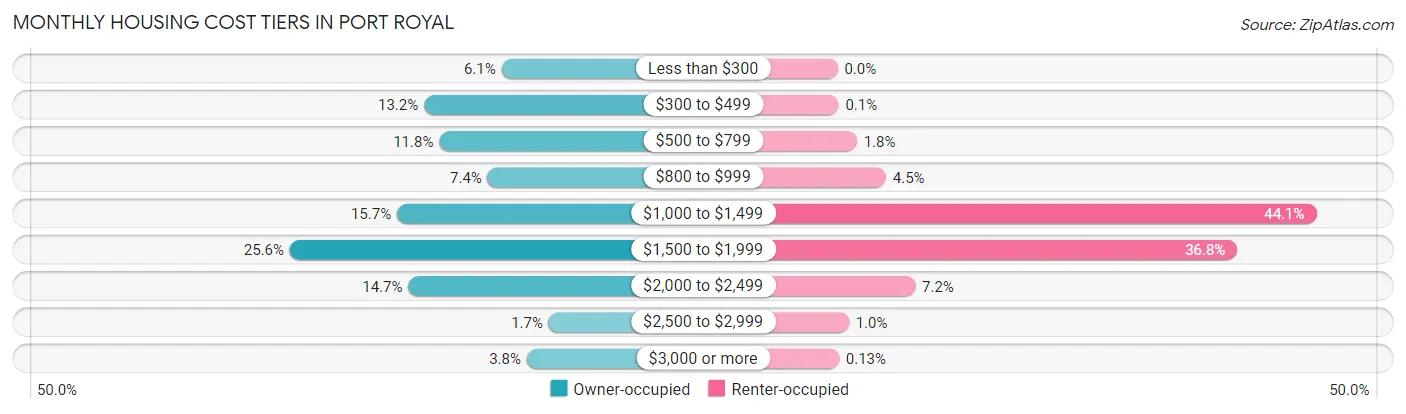
| Monthly Cost | Owner-occupied | Renter-occupied |
| Less than $300 | 105 (6.1%) | 0 (0.0%) |
| $300 to $499 | 228 (13.2%) | 3 (0.1%) |
| $500 to $799 | 204 (11.8%) | 53 (1.8%) |
| $800 to $999 | 127 (7.4%) | 133 (4.5%) |
| $1,000 to $1,499 | 271 (15.7%) | 1,314 (44.1%) |
| $1,500 to $1,999 | 441 (25.6%) | 1,097 (36.8%) |
| $2,000 to $2,499 | 253 (14.7%) | 213 (7.1%) |
| $2,500 to $2,999 | 30 (1.7%) | 31 (1.0%) |
| $3,000 or more | 65 (3.8%) | 4 (0.1%) |
| Total | 1,724 (100.0%) | 2,981 (100.0%) |
Physical Housing Characteristics in Port Royal
Housing Structures in Port Royal
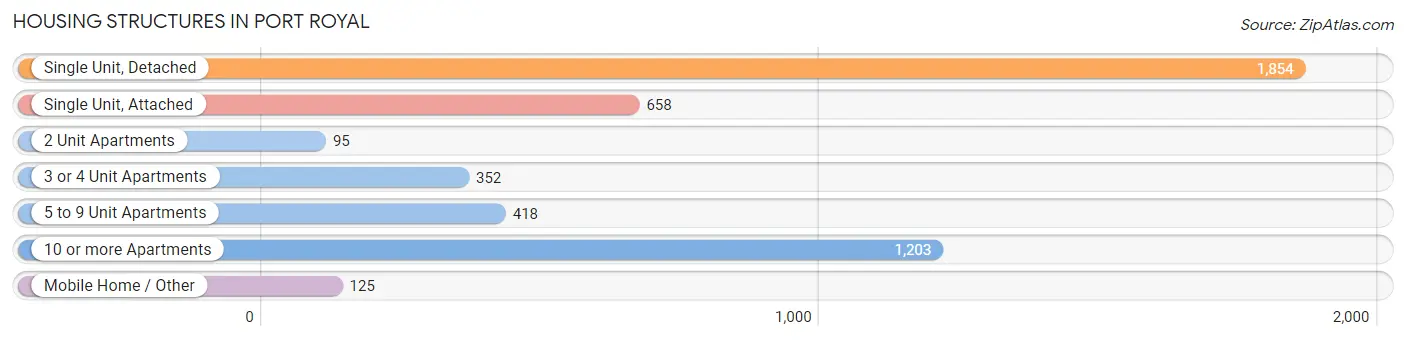
| Structure Type | # Housing Units | % Housing Units |
| Single Unit, Detached | 1,854 | 39.4% |
| Single Unit, Attached | 658 | 14.0% |
| 2 Unit Apartments | 95 | 2.0% |
| 3 or 4 Unit Apartments | 352 | 7.5% |
| 5 to 9 Unit Apartments | 418 | 8.9% |
| 10 or more Apartments | 1,203 | 25.6% |
| Mobile Home / Other | 125 | 2.7% |
| Total | 4,705 | 100.0% |
Housing Structures by Occupancy in Port Royal
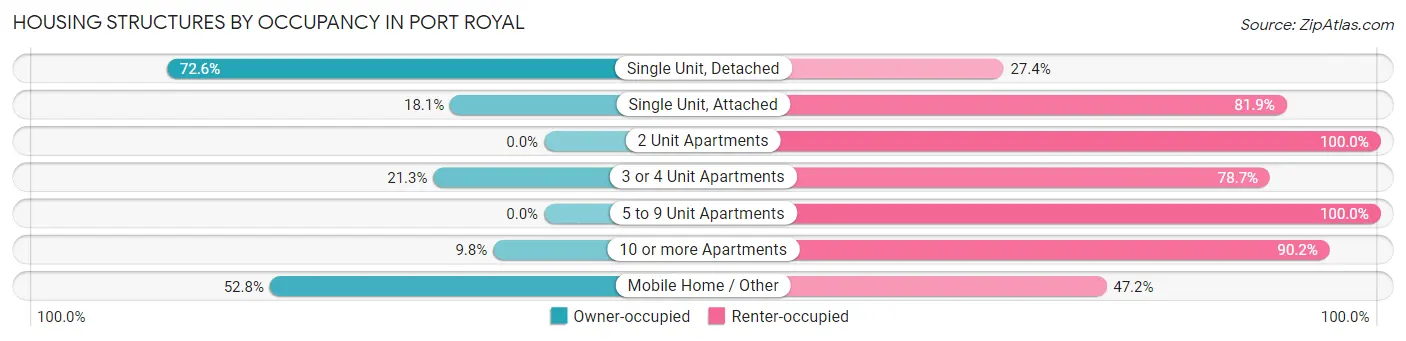
| Structure Type | Owner-occupied | Renter-occupied |
| Single Unit, Detached | 1,346 (72.6%) | 508 (27.4%) |
| Single Unit, Attached | 119 (18.1%) | 539 (81.9%) |
| 2 Unit Apartments | 0 (0.0%) | 95 (100.0%) |
| 3 or 4 Unit Apartments | 75 (21.3%) | 277 (78.7%) |
| 5 to 9 Unit Apartments | 0 (0.0%) | 418 (100.0%) |
| 10 or more Apartments | 118 (9.8%) | 1,085 (90.2%) |
| Mobile Home / Other | 66 (52.8%) | 59 (47.2%) |
| Total | 1,724 (36.6%) | 2,981 (63.4%) |
Housing Structures by Number of Rooms in Port Royal
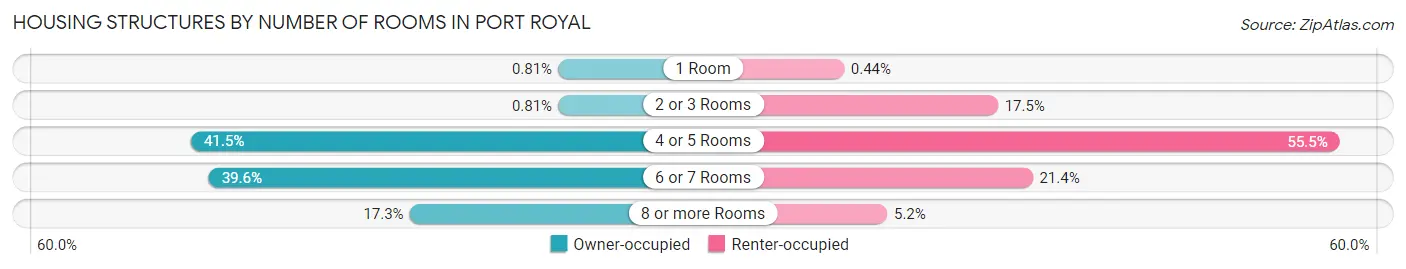
| Number of Rooms | Owner-occupied | Renter-occupied |
| 1 Room | 14 (0.8%) | 13 (0.4%) |
| 2 or 3 Rooms | 14 (0.8%) | 522 (17.5%) |
| 4 or 5 Rooms | 716 (41.5%) | 1,653 (55.4%) |
| 6 or 7 Rooms | 682 (39.6%) | 637 (21.4%) |
| 8 or more Rooms | 298 (17.3%) | 156 (5.2%) |
| Total | 1,724 (100.0%) | 2,981 (100.0%) |
Housing Structure by Heating Type in Port Royal
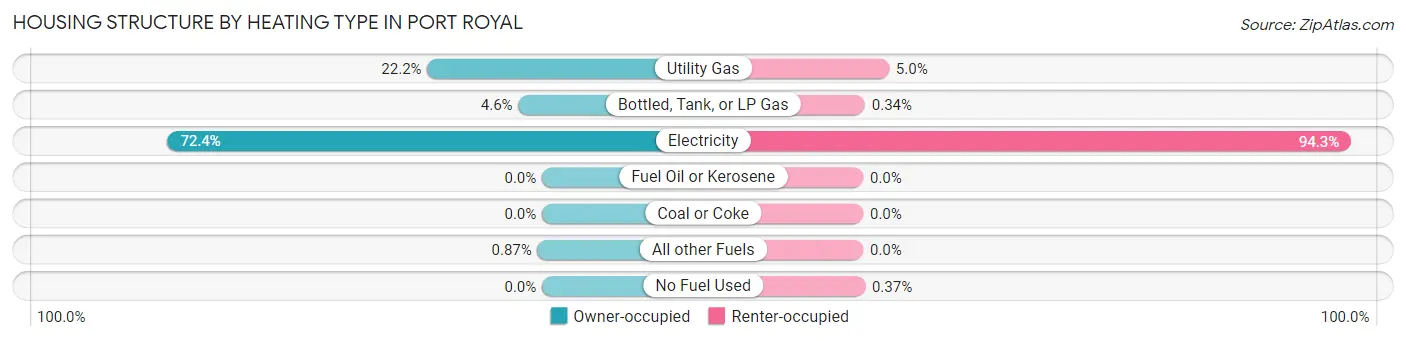
| Heating Type | Owner-occupied | Renter-occupied |
| Utility Gas | 382 (22.2%) | 149 (5.0%) |
| Bottled, Tank, or LP Gas | 79 (4.6%) | 10 (0.3%) |
| Electricity | 1,248 (72.4%) | 2,811 (94.3%) |
| Fuel Oil or Kerosene | 0 (0.0%) | 0 (0.0%) |
| Coal or Coke | 0 (0.0%) | 0 (0.0%) |
| All other Fuels | 15 (0.9%) | 0 (0.0%) |
| No Fuel Used | 0 (0.0%) | 11 (0.4%) |
| Total | 1,724 (100.0%) | 2,981 (100.0%) |
Household Vehicle Usage in Port Royal
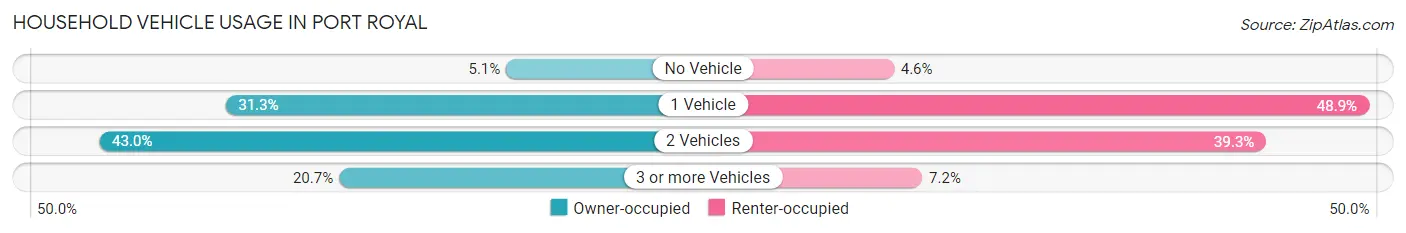
| Vehicles per Household | Owner-occupied | Renter-occupied |
| No Vehicle | 87 (5.1%) | 136 (4.6%) |
| 1 Vehicle | 539 (31.3%) | 1,458 (48.9%) |
| 2 Vehicles | 742 (43.0%) | 1,172 (39.3%) |
| 3 or more Vehicles | 356 (20.6%) | 215 (7.2%) |
| Total | 1,724 (100.0%) | 2,981 (100.0%) |
Real Estate & Mortgages in Port Royal
Real Estate and Mortgage Overview in Port Royal
| Characteristic | Without Mortgage | With Mortgage |
| Housing Units | 611 | 1,113 |
| Median Property Value | $232,000 | $311,000 |
| Median Household Income | $82,649 | $251 |
| Monthly Housing Costs | $483 | $65 |
| Real Estate Taxes | $1,619 | $12 |
Property Value by Mortgage Status in Port Royal
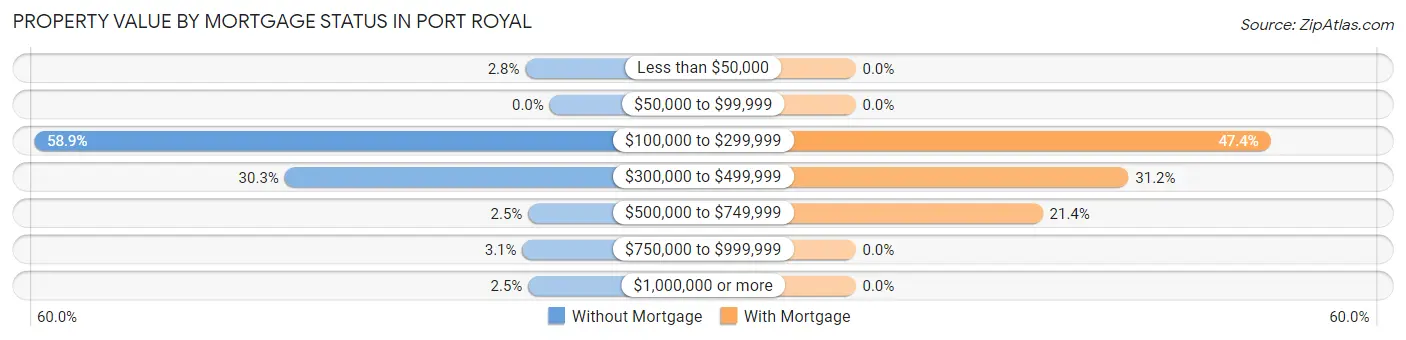
| Property Value | Without Mortgage | With Mortgage |
| Less than $50,000 | 17 (2.8%) | 0 (0.0%) |
| $50,000 to $99,999 | 0 (0.0%) | 0 (0.0%) |
| $100,000 to $299,999 | 360 (58.9%) | 528 (47.4%) |
| $300,000 to $499,999 | 185 (30.3%) | 347 (31.2%) |
| $500,000 to $749,999 | 15 (2.5%) | 238 (21.4%) |
| $750,000 to $999,999 | 19 (3.1%) | 0 (0.0%) |
| $1,000,000 or more | 15 (2.5%) | 0 (0.0%) |
| Total | 611 (100.0%) | 1,113 (100.0%) |
Household Income by Mortgage Status in Port Royal
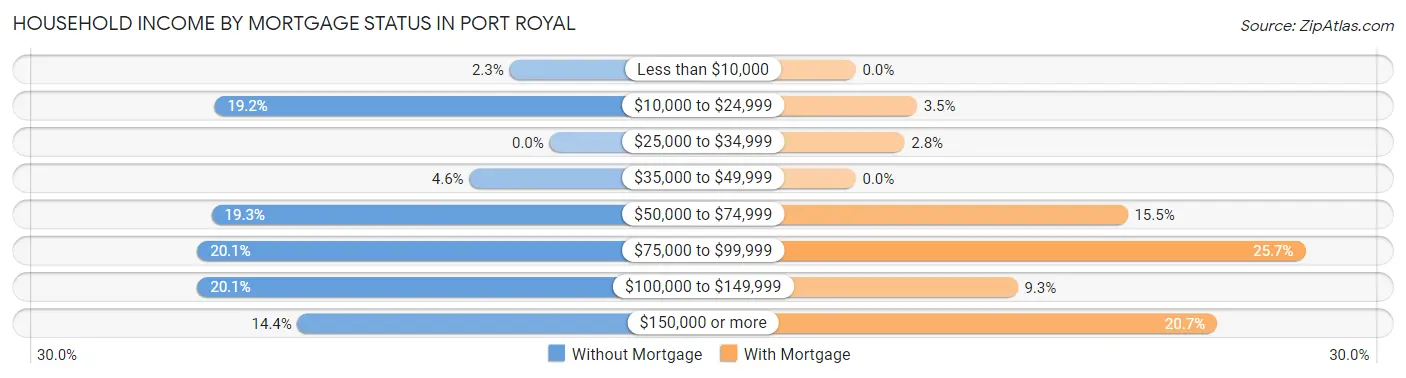
| Household Income | Without Mortgage | With Mortgage |
| Less than $10,000 | 14 (2.3%) | 0 (0.0%) |
| $10,000 to $24,999 | 117 (19.2%) | 39 (3.5%) |
| $25,000 to $34,999 | 0 (0.0%) | 31 (2.8%) |
| $35,000 to $49,999 | 28 (4.6%) | 0 (0.0%) |
| $50,000 to $74,999 | 118 (19.3%) | 173 (15.5%) |
| $75,000 to $99,999 | 123 (20.1%) | 286 (25.7%) |
| $100,000 to $149,999 | 123 (20.1%) | 103 (9.2%) |
| $150,000 or more | 88 (14.4%) | 230 (20.7%) |
| Total | 611 (100.0%) | 1,113 (100.0%) |
Property Value to Household Income Ratio in Port Royal
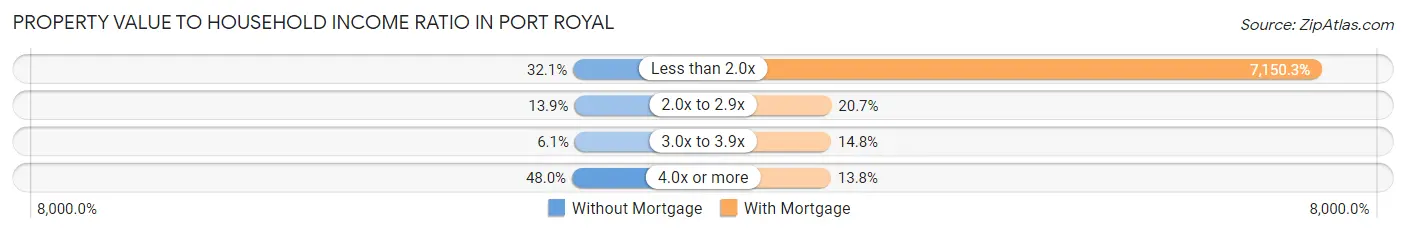
| Value-to-Income Ratio | Without Mortgage | With Mortgage |
| Less than 2.0x | 196 (32.1%) | 79,583 (7,150.3%) |
| 2.0x to 2.9x | 85 (13.9%) | 230 (20.7%) |
| 3.0x to 3.9x | 37 (6.1%) | 165 (14.8%) |
| 4.0x or more | 293 (47.9%) | 153 (13.8%) |
| Total | 611 (100.0%) | 1,113 (100.0%) |
Real Estate Taxes by Mortgage Status in Port Royal
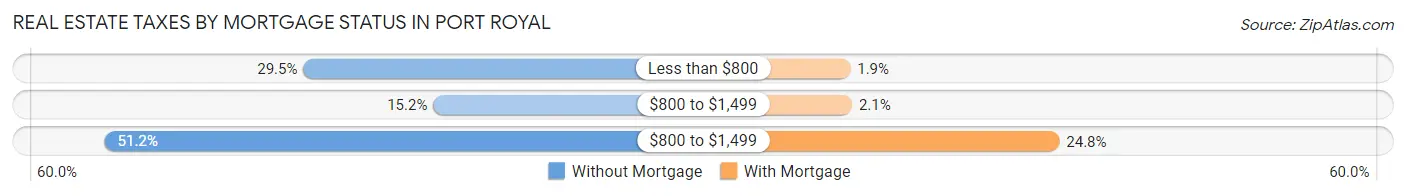
| Property Taxes | Without Mortgage | With Mortgage |
| Less than $800 | 180 (29.5%) | 21 (1.9%) |
| $800 to $1,499 | 93 (15.2%) | 23 (2.1%) |
| $800 to $1,499 | 313 (51.2%) | 276 (24.8%) |
| Total | 611 (100.0%) | 1,113 (100.0%) |
Health & Disability in Port Royal
Health Insurance Coverage by Age in Port Royal
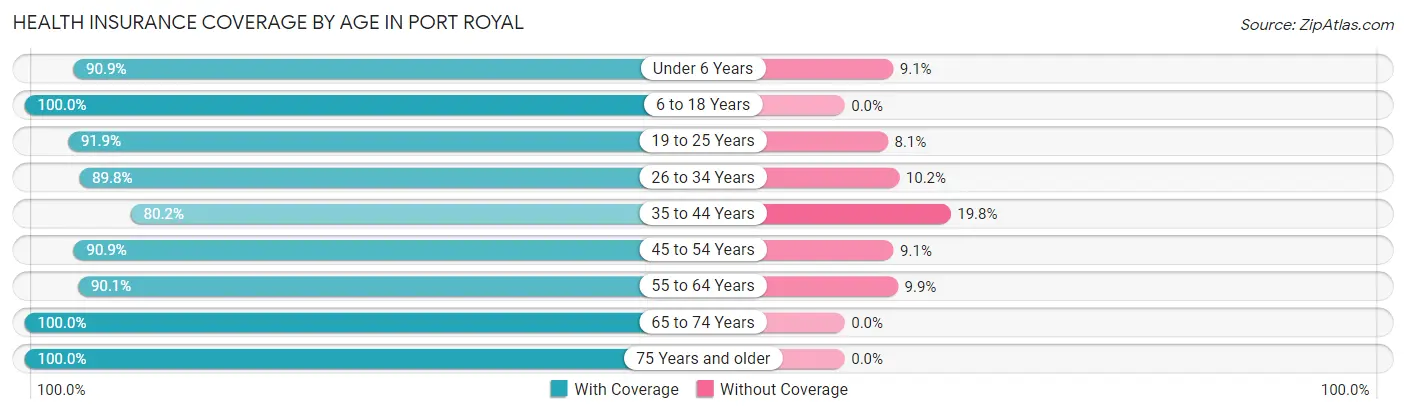
| Age Bracket | With Coverage | Without Coverage |
| Under 6 Years | 974 (90.9%) | 97 (9.1%) |
| 6 to 18 Years | 1,426 (100.0%) | 0 (0.0%) |
| 19 to 25 Years | 1,437 (91.9%) | 126 (8.1%) |
| 26 to 34 Years | 1,608 (89.8%) | 182 (10.2%) |
| 35 to 44 Years | 832 (80.2%) | 205 (19.8%) |
| 45 to 54 Years | 1,077 (90.9%) | 108 (9.1%) |
| 55 to 64 Years | 988 (90.1%) | 109 (9.9%) |
| 65 to 74 Years | 1,103 (100.0%) | 0 (0.0%) |
| 75 Years and older | 457 (100.0%) | 0 (0.0%) |
| Total | 9,902 (92.3%) | 827 (7.7%) |
Health Insurance Coverage by Citizenship Status in Port Royal
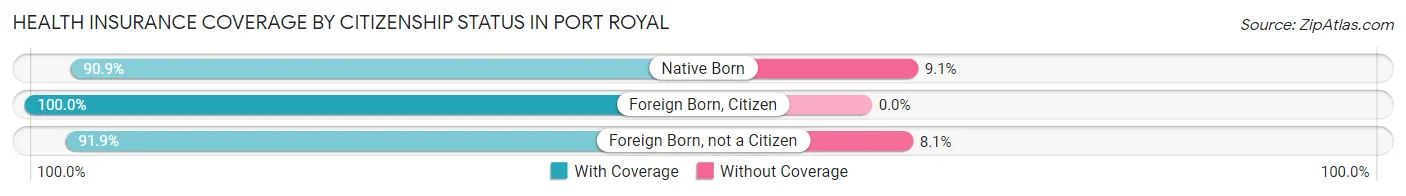
| Citizenship Status | With Coverage | Without Coverage |
| Native Born | 974 (90.9%) | 97 (9.1%) |
| Foreign Born, Citizen | 1,426 (100.0%) | 0 (0.0%) |
| Foreign Born, not a Citizen | 1,437 (91.9%) | 126 (8.1%) |
Health Insurance Coverage by Household Income in Port Royal
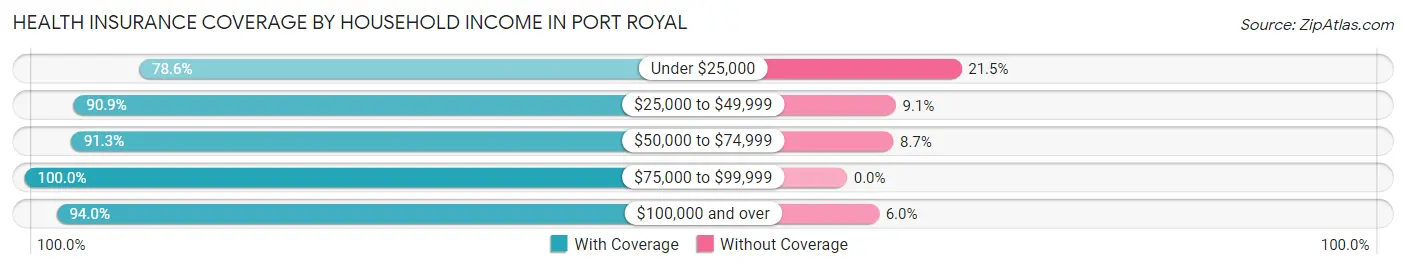
| Household Income | With Coverage | Without Coverage |
| Under $25,000 | 912 (78.5%) | 249 (21.4%) |
| $25,000 to $49,999 | 1,670 (90.9%) | 168 (9.1%) |
| $50,000 to $74,999 | 2,405 (91.3%) | 228 (8.7%) |
| $75,000 to $99,999 | 2,022 (100.0%) | 0 (0.0%) |
| $100,000 and over | 2,864 (94.0%) | 182 (6.0%) |
Public vs Private Health Insurance Coverage by Age in Port Royal
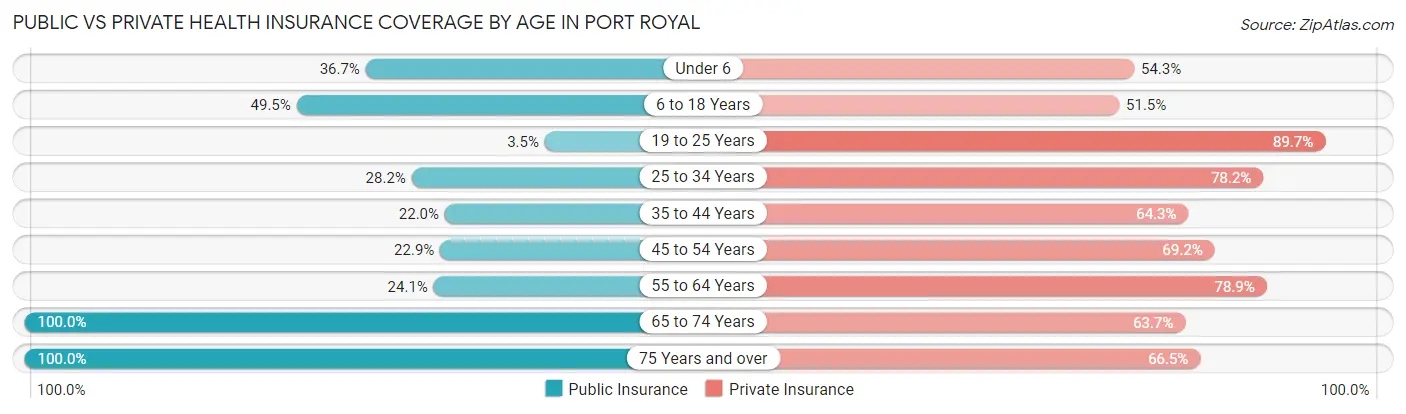
| Age Bracket | Public Insurance | Private Insurance |
| Under 6 | 393 (36.7%) | 581 (54.2%) |
| 6 to 18 Years | 706 (49.5%) | 734 (51.5%) |
| 19 to 25 Years | 54 (3.5%) | 1,402 (89.7%) |
| 25 to 34 Years | 504 (28.2%) | 1,400 (78.2%) |
| 35 to 44 Years | 228 (22.0%) | 667 (64.3%) |
| 45 to 54 Years | 271 (22.9%) | 820 (69.2%) |
| 55 to 64 Years | 264 (24.1%) | 865 (78.8%) |
| 65 to 74 Years | 1,103 (100.0%) | 703 (63.7%) |
| 75 Years and over | 457 (100.0%) | 304 (66.5%) |
| Total | 3,980 (37.1%) | 7,476 (69.7%) |
Disability Status by Sex by Age in Port Royal
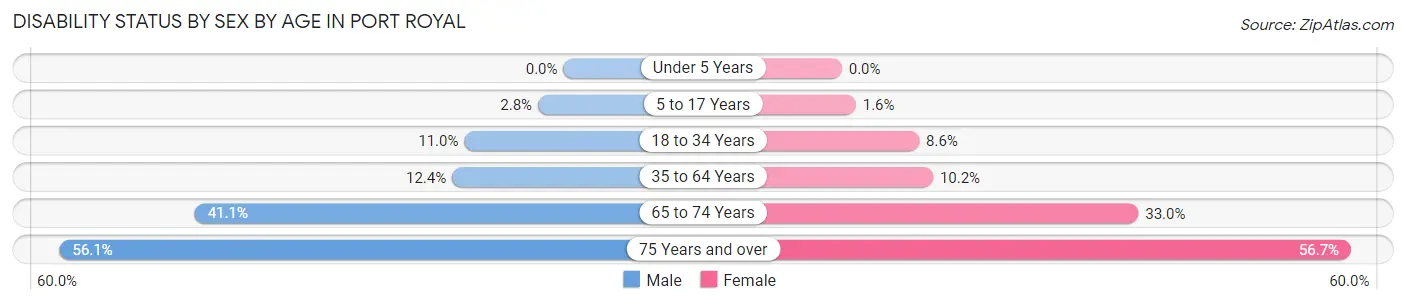
| Age Bracket | Male | Female |
| Under 5 Years | 0 (0.0%) | 0 (0.0%) |
| 5 to 17 Years | 22 (2.8%) | 11 (1.6%) |
| 18 to 34 Years | 173 (11.0%) | 165 (8.6%) |
| 35 to 64 Years | 199 (12.4%) | 174 (10.2%) |
| 65 to 74 Years | 234 (41.0%) | 176 (33.0%) |
| 75 Years and over | 110 (56.1%) | 148 (56.7%) |
Disability Class by Sex by Age in Port Royal
Disability Class: Hearing Difficulty
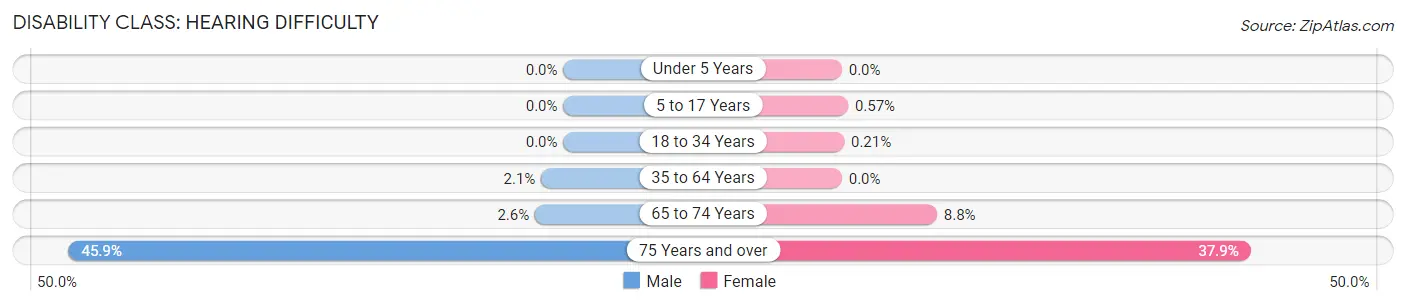
| Age Bracket | Male | Female |
| Under 5 Years | 0 (0.0%) | 0 (0.0%) |
| 5 to 17 Years | 0 (0.0%) | 4 (0.6%) |
| 18 to 34 Years | 0 (0.0%) | 4 (0.2%) |
| 35 to 64 Years | 33 (2.1%) | 0 (0.0%) |
| 65 to 74 Years | 15 (2.6%) | 47 (8.8%) |
| 75 Years and over | 90 (45.9%) | 99 (37.9%) |
Disability Class: Vision Difficulty
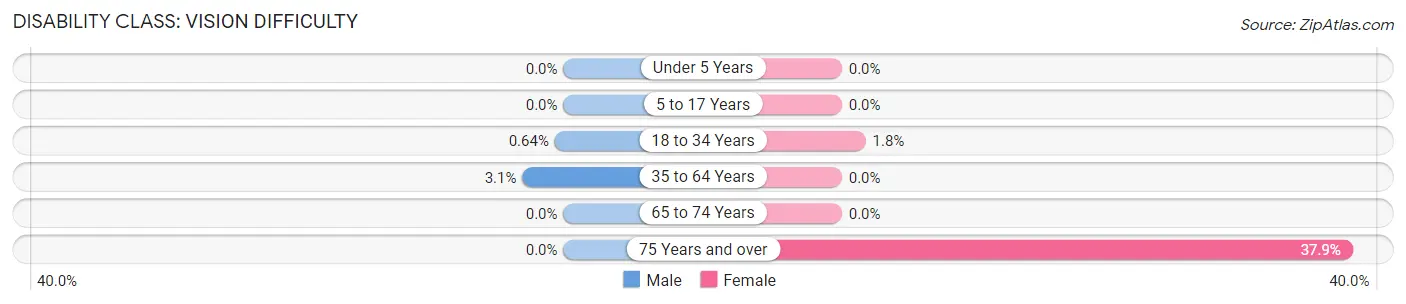
| Age Bracket | Male | Female |
| Under 5 Years | 0 (0.0%) | 0 (0.0%) |
| 5 to 17 Years | 0 (0.0%) | 0 (0.0%) |
| 18 to 34 Years | 10 (0.6%) | 34 (1.8%) |
| 35 to 64 Years | 49 (3.0%) | 0 (0.0%) |
| 65 to 74 Years | 0 (0.0%) | 0 (0.0%) |
| 75 Years and over | 0 (0.0%) | 99 (37.9%) |
Disability Class: Cognitive Difficulty
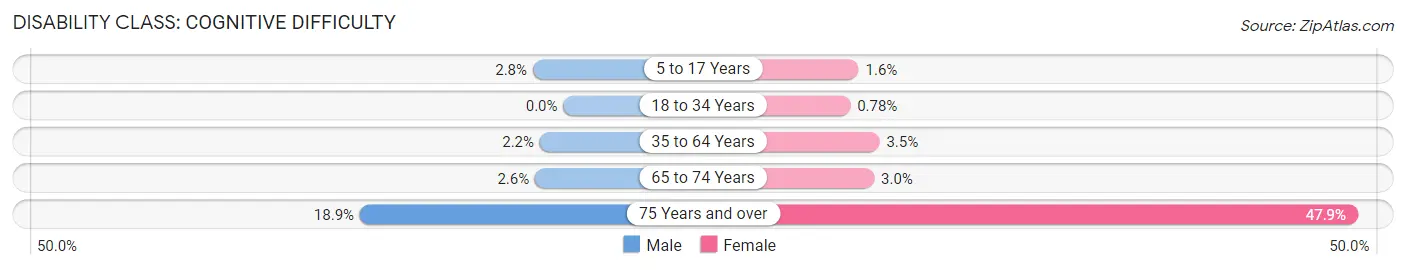
| Age Bracket | Male | Female |
| 5 to 17 Years | 22 (2.8%) | 11 (1.6%) |
| 18 to 34 Years | 0 (0.0%) | 15 (0.8%) |
| 35 to 64 Years | 35 (2.2%) | 60 (3.5%) |
| 65 to 74 Years | 15 (2.6%) | 16 (3.0%) |
| 75 Years and over | 37 (18.9%) | 125 (47.9%) |
Disability Class: Ambulatory Difficulty
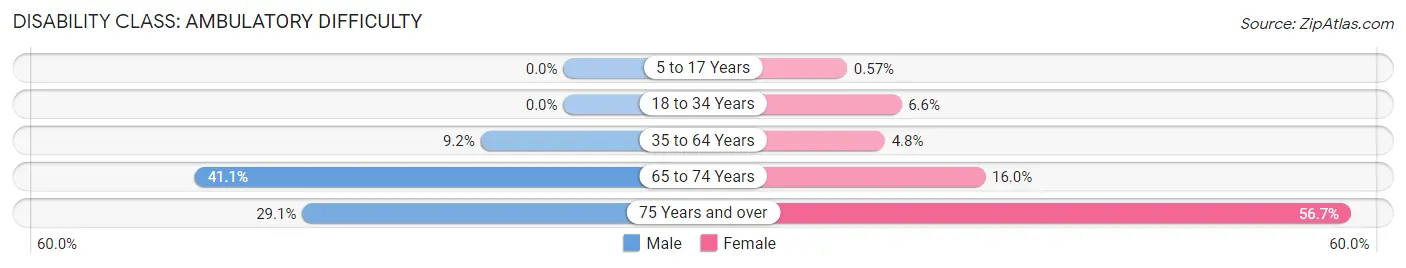
| Age Bracket | Male | Female |
| 5 to 17 Years | 0 (0.0%) | 4 (0.6%) |
| 18 to 34 Years | 0 (0.0%) | 127 (6.6%) |
| 35 to 64 Years | 148 (9.2%) | 82 (4.8%) |
| 65 to 74 Years | 234 (41.0%) | 85 (16.0%) |
| 75 Years and over | 57 (29.1%) | 148 (56.7%) |
Disability Class: Self-Care Difficulty
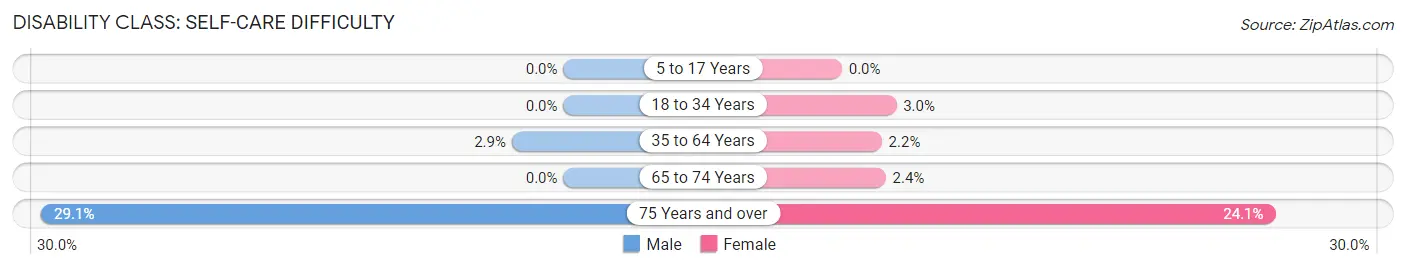
| Age Bracket | Male | Female |
| 5 to 17 Years | 0 (0.0%) | 0 (0.0%) |
| 18 to 34 Years | 0 (0.0%) | 58 (3.0%) |
| 35 to 64 Years | 46 (2.9%) | 38 (2.2%) |
| 65 to 74 Years | 0 (0.0%) | 13 (2.4%) |
| 75 Years and over | 57 (29.1%) | 63 (24.1%) |
Technology Access in Port Royal
Computing Device Access in Port Royal
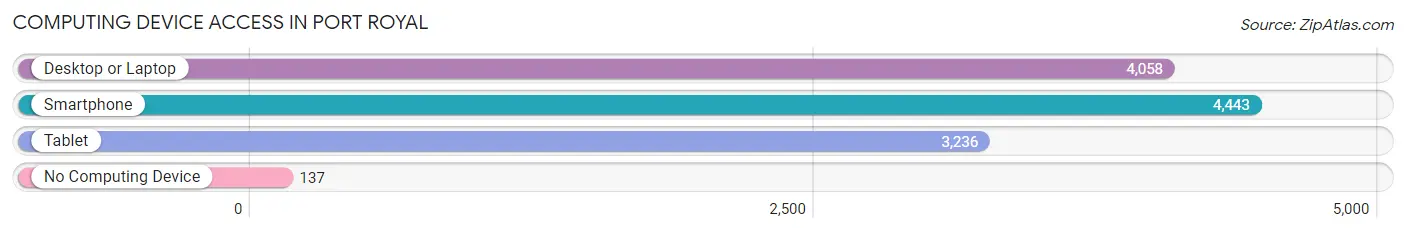
| Device Type | # Households | % Households |
| Desktop or Laptop | 4,058 | 86.3% |
| Smartphone | 4,443 | 94.4% |
| Tablet | 3,236 | 68.8% |
| No Computing Device | 137 | 2.9% |
| Total | 4,705 | 100.0% |
Internet Access in Port Royal
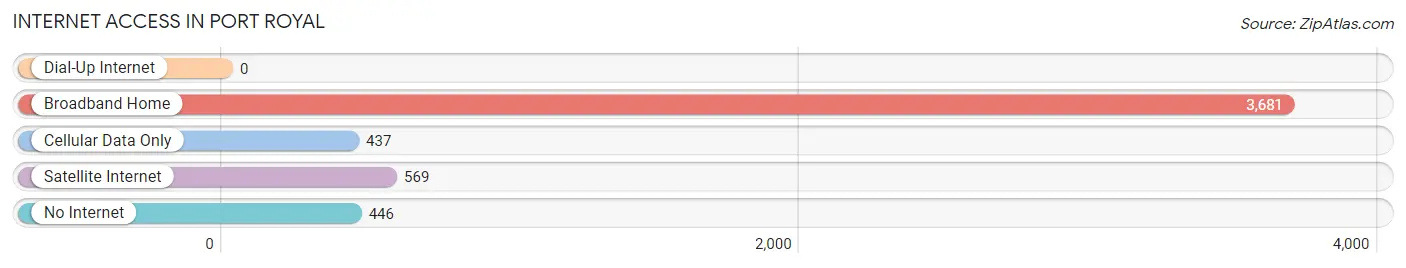
| Internet Type | # Households | % Households |
| Dial-Up Internet | 0 | 0.0% |
| Broadband Home | 3,681 | 78.2% |
| Cellular Data Only | 437 | 9.3% |
| Satellite Internet | 569 | 12.1% |
| No Internet | 446 | 9.5% |
| Total | 4,705 | 100.0% |
Port Royal Summary
Introduction
Port Royal is a town located in Beaufort County, South Carolina. It is situated on the banks of the Beaufort River, and is part of the Hilton Head Island-Beaufort Micropolitan Statistical Area. The town has a rich history, and has been a popular tourist destination for many years. It is known for its beautiful beaches, historic sites, and vibrant culture.
History
Port Royal was first settled in the early 1700s by French Huguenots. The town was originally called “Port Royal de la Caroline”, and was a major port for the French colony of South Carolina. The town was a major trading center for the region, and was home to many merchants and traders.
In 1782, the British captured Port Royal during the American Revolutionary War. The town was then renamed “Port Royal”, and was used as a naval base by the British. After the war, the town was returned to the United States, and the name was changed back to “Port Royal de la Caroline”.
In the late 1800s, the town began to grow and develop. The town was incorporated in 1891, and the population began to increase. In the early 1900s, the town was a popular tourist destination, and many wealthy families built large homes in the area.
Geography
Port Royal is located in Beaufort County, South Carolina. It is situated on the banks of the Beaufort River, and is part of the Hilton Head Island-Beaufort Micropolitan Statistical Area. The town is located approximately 25 miles south of Charleston, and is bordered by the towns of Beaufort, Burton, and Lady’s Island.
The town has a total area of 4.2 square miles, and is located at an elevation of 8 feet above sea level. The town is located in a humid subtropical climate zone, and has mild winters and hot, humid summers.
Economy
Port Royal’s economy is largely based on tourism and the service industry. The town is home to several hotels, restaurants, and shops, and is a popular destination for tourists. The town is also home to several marinas, and is a popular destination for boaters and fishermen.
The town is also home to several manufacturing companies, including a paper mill and a boat building company. The town is also home to several military bases, including the Marine Corps Air Station Beaufort and the Naval Hospital Beaufort.
Demographics
As of the 2010 census, the population of Port Royal was 11,599. The population is largely white (77.3%), with African Americans making up the largest minority group (20.2%). The median household income is $41,945, and the median age is 37.
Conclusion
Port Royal is a town located in Beaufort County, South Carolina. It is situated on the banks of the Beaufort River, and is part of the Hilton Head Island-Beaufort Micropolitan Statistical Area. The town has a rich history, and has been a popular tourist destination for many years. It is known for its beautiful beaches, historic sites, and vibrant culture. The town’s economy is largely based on tourism and the service industry, and the population is largely white.
Common Questions
What is Per Capita Income in Port Royal?
Per Capita income in Port Royal is $31,381.
What is the Median Family Income in Port Royal?
Median Family Income in Port Royal is $69,143.
What is the Median Household income in Port Royal?
Median Household Income in Port Royal is $68,909.
What is Income or Wage Gap in Port Royal?
Income or Wage Gap in Port Royal is 2.9%.
Women in Port Royal earn 97.1 cents for every dollar earned by a man.
What is Family Income Deficit in Port Royal?
Family Income Deficit in Port Royal is $17,572.
Families that are below poverty line in Port Royal earn $17,572 less on average than the poverty threshold level.
What is Inequality or Gini Index in Port Royal?
Inequality or Gini Index in Port Royal is 0.37.
What is the Total Population of Port Royal?
Total Population of Port Royal is 14,573.
What is the Total Male Population of Port Royal?
Total Male Population of Port Royal is 8,482.
What is the Total Female Population of Port Royal?
Total Female Population of Port Royal is 6,091.
What is the Ratio of Males per 100 Females in Port Royal?
There are 139.25 Males per 100 Females in Port Royal.
What is the Ratio of Females per 100 Males in Port Royal?
There are 71.81 Females per 100 Males in Port Royal.
What is the Median Population Age in Port Royal?
Median Population Age in Port Royal is 26.6 Years.
What is the Average Family Size in Port Royal
Average Family Size in Port Royal is 3.2 People.
What is the Average Household Size in Port Royal
Average Household Size in Port Royal is 2.5 People.
How Large is the Labor Force in Port Royal?
There are 8,883 People in the Labor Forcein in Port Royal.
What is the Percentage of People in the Labor Force in Port Royal?
71.1% of People are in the Labor Force in Port Royal.
What is the Unemployment Rate in Port Royal?
Unemployment Rate in Port Royal is 1.6%.