Cities with the Most Immigrants from Eastern Africa in South Carolina
RELATED REPORTS & OPTIONS
Eastern Africa
South Carolina
Compare Cities
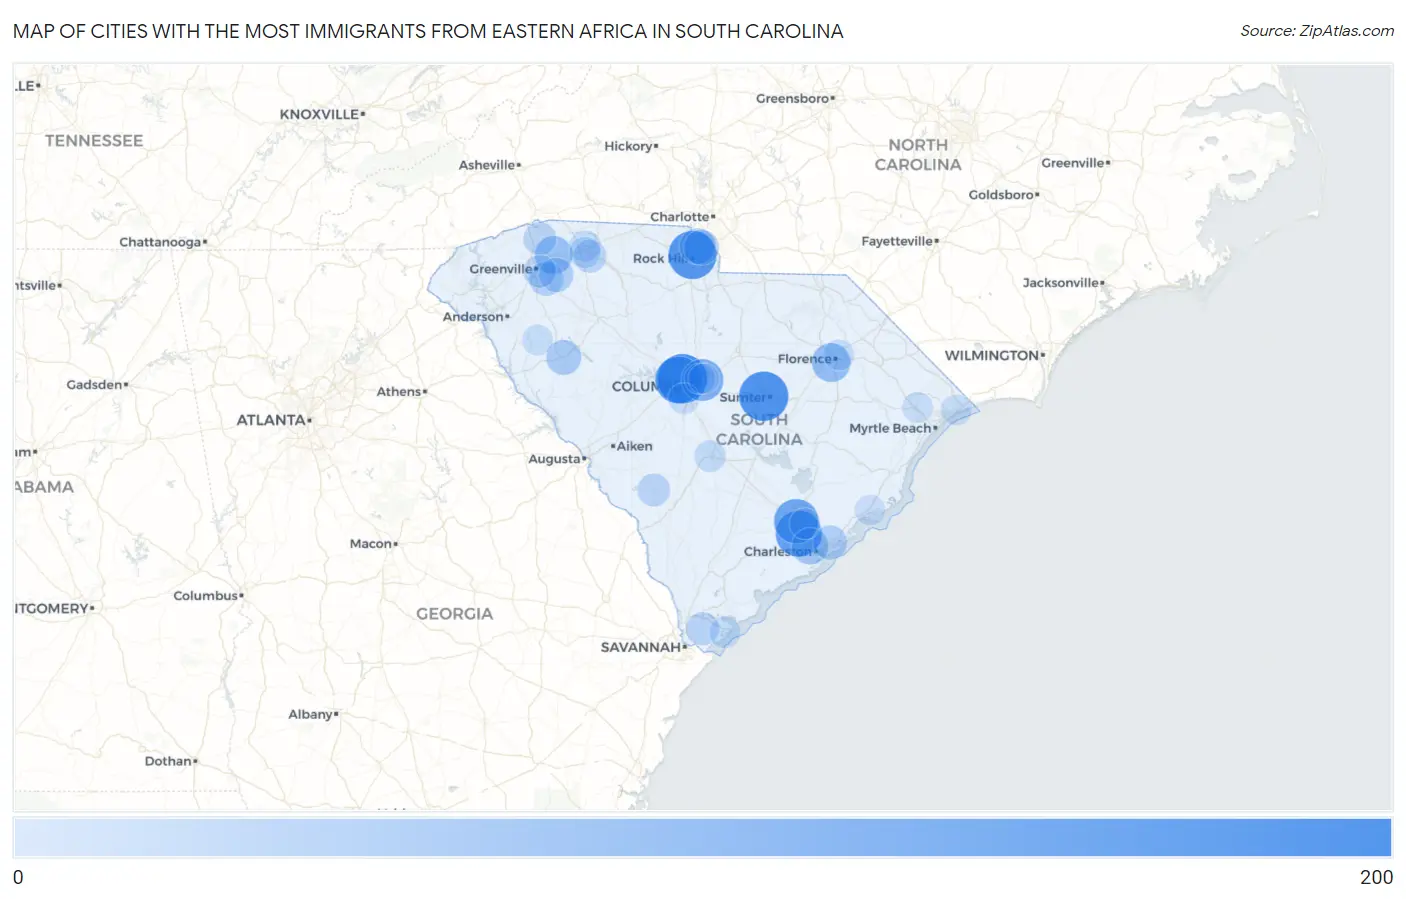
Map of Cities with the Most Immigrants from Eastern Africa in South Carolina
0
200
Cities with the Most Immigrants from Eastern Africa in South Carolina
| City | Eastern Africa | vs State | vs National | |
| 1. | St Andrews | 189 | 3,036(6.23%)#1 | 752,337(0.03%)#559 |
| 2. | Sumter | 186 | 3,036(6.13%)#2 | 752,337(0.02%)#565 |
| 3. | Rock Hill | 175 | 3,036(5.76%)#3 | 752,337(0.02%)#588 |
| 4. | Seven Oaks | 165 | 3,036(5.43%)#4 | 752,337(0.02%)#614 |
| 5. | North Charleston | 155 | 3,036(5.11%)#5 | 752,337(0.02%)#652 |
| 6. | Ladson | 139 | 3,036(4.58%)#6 | 752,337(0.02%)#705 |
| 7. | Columbia | 113 | 3,036(3.72%)#7 | 752,337(0.02%)#818 |
| 8. | Florence | 82 | 3,036(2.70%)#8 | 752,337(0.01%)#1,006 |
| 9. | Greer | 74 | 3,036(2.44%)#9 | 752,337(0.01%)#1,081 |
| 10. | Charleston | 60 | 3,036(1.98%)#10 | 752,337(0.01%)#1,219 |
| 11. | Riverview | 53 | 3,036(1.75%)#11 | 752,337(0.01%)#1,346 |
| 12. | Fort Mill | 46 | 3,036(1.52%)#12 | 752,337(0.01%)#1,438 |
| 13. | Greenwood | 46 | 3,036(1.52%)#13 | 752,337(0.01%)#1,441 |
| 14. | Mount Pleasant | 38 | 3,036(1.25%)#14 | 752,337(0.01%)#1,567 |
| 15. | Mauldin | 38 | 3,036(1.25%)#15 | 752,337(0.01%)#1,575 |
| 16. | Five Forks | 38 | 3,036(1.25%)#16 | 752,337(0.01%)#1,578 |
| 17. | Carolina Forest | 33 | 3,036(1.09%)#17 | 752,337(0.00%)#1,685 |
| 18. | Drayton | 31 | 3,036(1.02%)#18 | 752,337(0.00%)#1,751 |
| 19. | Bluffton | 27 | 3,036(0.89%)#19 | 752,337(0.00%)#1,858 |
| 20. | Spartanburg | 26 | 3,036(0.86%)#20 | 752,337(0.00%)#1,887 |
| 21. | Tigerville | 25 | 3,036(0.82%)#21 | 752,337(0.00%)#1,934 |
| 22. | Barnwell | 24 | 3,036(0.79%)#22 | 752,337(0.00%)#1,978 |
| 23. | Greenville | 22 | 3,036(0.72%)#23 | 752,337(0.00%)#2,031 |
| 24. | Orangeburg | 13 | 3,036(0.43%)#24 | 752,337(0.00%)#2,442 |
| 25. | Valley Falls | 13 | 3,036(0.43%)#25 | 752,337(0.00%)#2,451 |
| 26. | Saxon | 11 | 3,036(0.36%)#26 | 752,337(0.00%)#2,586 |
| 27. | Hilton Head Island | 9 | 3,036(0.30%)#27 | 752,337(0.00%)#2,680 |
| 28. | North Myrtle Beach | 7 | 3,036(0.23%)#28 | 752,337(0.00%)#2,847 |
| 29. | Pine Ridge | 7 | 3,036(0.23%)#29 | 752,337(0.00%)#2,885 |
| 30. | Quinby | 7 | 3,036(0.23%)#30 | 752,337(0.00%)#2,901 |
| 31. | Goose Creek | 6 | 3,036(0.20%)#31 | 752,337(0.00%)#2,910 |
| 32. | Conway | 6 | 3,036(0.20%)#32 | 752,337(0.00%)#2,920 |
| 33. | Due West | 6 | 3,036(0.20%)#33 | 752,337(0.00%)#2,981 |
| 34. | Arcadia Lakes | 3 | 3,036(0.10%)#34 | 752,337(0.00%)#3,242 |
| 35. | Mcclellanville | 3 | 3,036(0.10%)#35 | 752,337(0.00%)#3,246 |
| 36. | Woodfield | 1 | 3,036(0.03%)#36 | 752,337(0.00%)#3,410 |
Common Questions
What are the Top 10 Cities with the Most Immigrants from Eastern Africa in South Carolina?
Top 10 Cities with the Most Immigrants from Eastern Africa in South Carolina are:
#1
189
#2
186
#3
175
#4
165
#5
155
#6
139
#7
113
#8
82
#9
74
#10
60
What city has the Most Immigrants from Eastern Africa in South Carolina?
St Andrews has the Most Immigrants from Eastern Africa in South Carolina with 189.
What is the Total Immigrants from Eastern Africa in the State of South Carolina?
Total Immigrants from Eastern Africa in South Carolina is 3,036.
What is the Total Immigrants from Eastern Africa in the United States?
Total Immigrants from Eastern Africa in the United States is 752,337.