Lancaster, SC Map & Demographics
Lancaster Map
Lancaster Overview
$25,845
PER CAPITA INCOME
$49,126
AVG FAMILY INCOME
$37,714
AVG HOUSEHOLD INCOME
16.6%
WAGE / INCOME GAP [ % ]
83.4¢/ $1
WAGE / INCOME GAP [ $ ]
0.57
INEQUALITY / GINI INDEX
8,592
TOTAL POPULATION
3,912
MALE POPULATION
4,680
FEMALE POPULATION
83.59
MALES / 100 FEMALES
119.63
FEMALES / 100 MALES
35.6
MEDIAN AGE
3.4
AVG FAMILY SIZE
2.6
AVG HOUSEHOLD SIZE
3,917
LABOR FORCE [ PEOPLE ]
59.2%
PERCENT IN LABOR FORCE
13.3%
UNEMPLOYMENT RATE
Lancaster Zip Codes
Lancaster Area Codes
Income in Lancaster
Income Overview in Lancaster
Per Capita Income in Lancaster is $25,845, while median incomes of families and households are $49,126 and $37,714 respectively.
| Characteristic | Number | Measure |
| Per Capita Income | 8,592 | $25,845 |
| Median Family Income | 2,127 | $49,126 |
| Mean Family Income | 2,127 | $77,945 |
| Median Household Income | 3,211 | $37,714 |
| Mean Household Income | 3,211 | $64,854 |
| Income Deficit | 2,127 | $0 |
| Wage / Income Gap (%) | 8,592 | 16.56% |
| Wage / Income Gap ($) | 8,592 | 83.44¢ per $1 |
| Gini / Inequality Index | 8,592 | 0.57 |
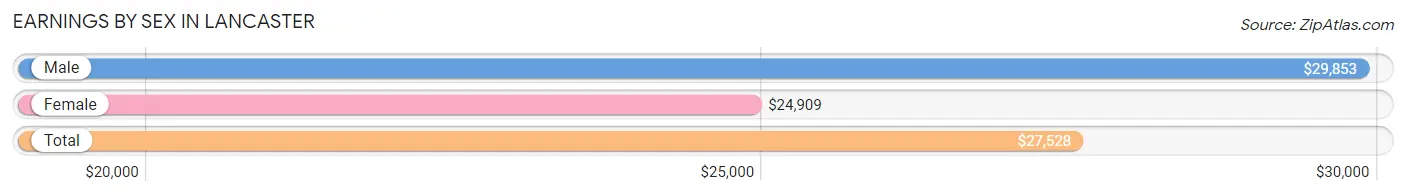
Earnings by Sex in Lancaster
Average Earnings in Lancaster are $27,528, $29,853 for men and $24,909 for women, a difference of 16.6%.
| Sex | Number | Average Earnings |
| Male | 1,738 (43.8%) | $29,853 |
| Female | 2,226 (56.2%) | $24,909 |
| Total | 3,964 (100.0%) | $27,528 |
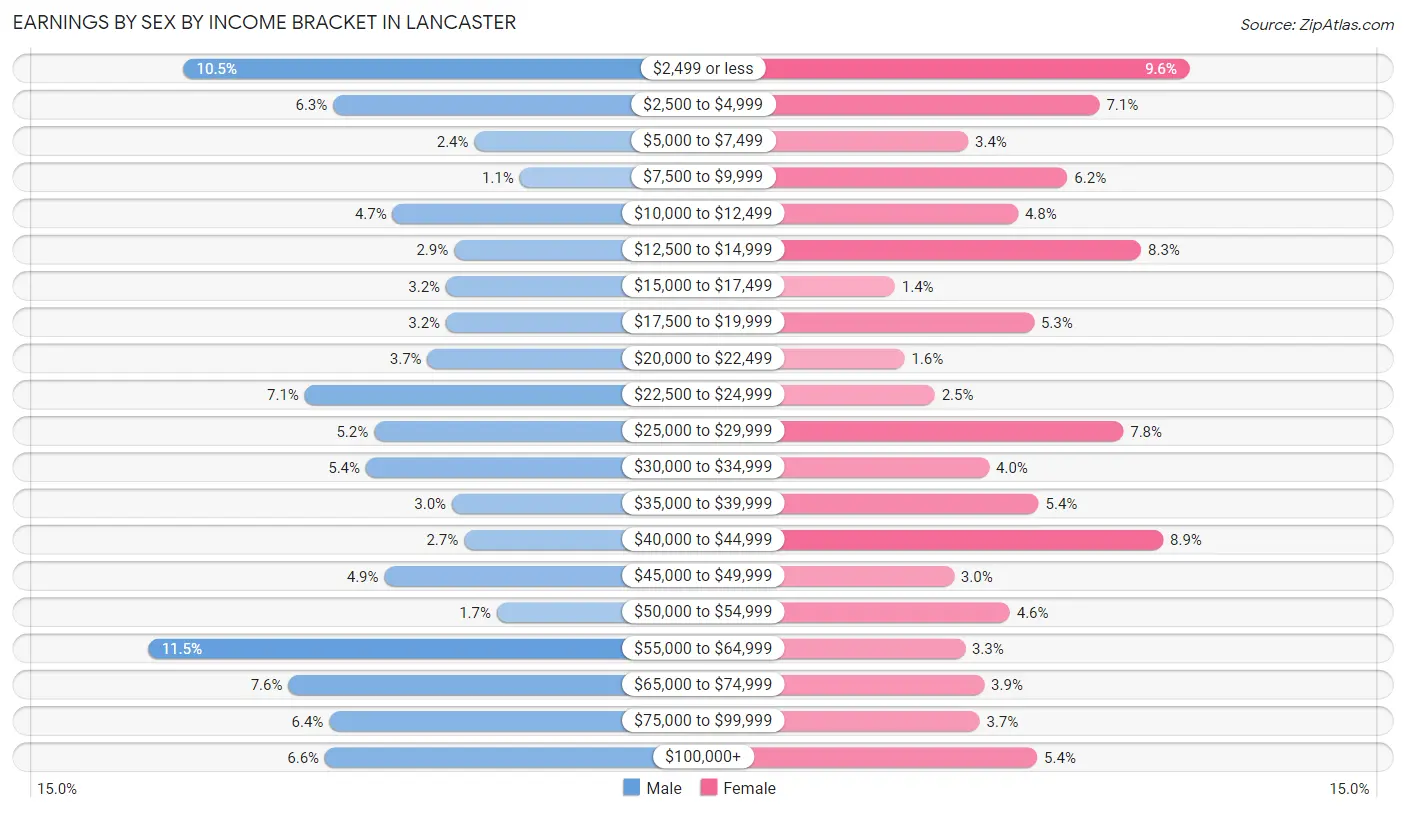
Earnings by Sex by Income Bracket in Lancaster
The most common earnings brackets in Lancaster are $55,000 to $64,999 for men (200 | 11.5%) and $2,499 or less for women (214 | 9.6%).
| Income | Male | Female |
| $2,499 or less | 183 (10.5%) | 214 (9.6%) |
| $2,500 to $4,999 | 110 (6.3%) | 158 (7.1%) |
| $5,000 to $7,499 | 41 (2.4%) | 76 (3.4%) |
| $7,500 to $9,999 | 19 (1.1%) | 138 (6.2%) |
| $10,000 to $12,499 | 81 (4.7%) | 107 (4.8%) |
| $12,500 to $14,999 | 51 (2.9%) | 184 (8.3%) |
| $15,000 to $17,499 | 55 (3.2%) | 30 (1.3%) |
| $17,500 to $19,999 | 55 (3.2%) | 117 (5.3%) |
| $20,000 to $22,499 | 64 (3.7%) | 36 (1.6%) |
| $22,500 to $24,999 | 124 (7.1%) | 55 (2.5%) |
| $25,000 to $29,999 | 90 (5.2%) | 173 (7.8%) |
| $30,000 to $34,999 | 94 (5.4%) | 89 (4.0%) |
| $35,000 to $39,999 | 52 (3.0%) | 120 (5.4%) |
| $40,000 to $44,999 | 46 (2.6%) | 198 (8.9%) |
| $45,000 to $49,999 | 85 (4.9%) | 67 (3.0%) |
| $50,000 to $54,999 | 30 (1.7%) | 102 (4.6%) |
| $55,000 to $64,999 | 200 (11.5%) | 74 (3.3%) |
| $65,000 to $74,999 | 132 (7.6%) | 86 (3.9%) |
| $75,000 to $99,999 | 112 (6.4%) | 83 (3.7%) |
| $100,000+ | 114 (6.6%) | 119 (5.3%) |
| Total | 1,738 (100.0%) | 2,226 (100.0%) |
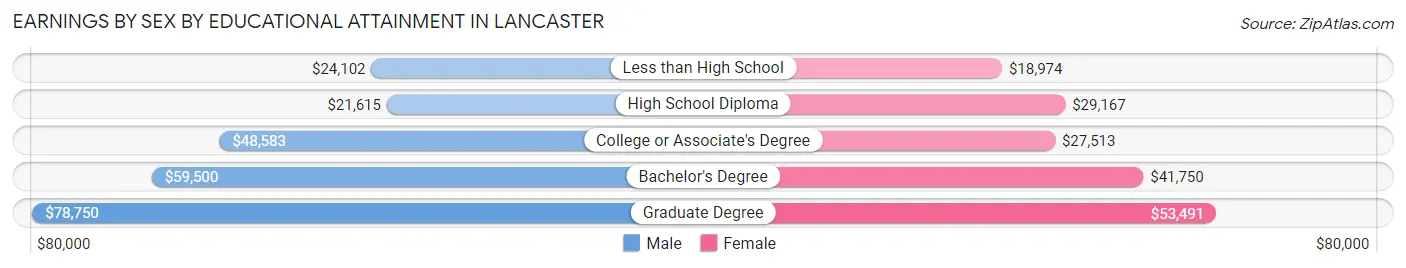
Earnings by Sex by Educational Attainment in Lancaster
Average earnings in Lancaster are $39,338 for men and $30,357 for women, a difference of 22.8%. Men with an educational attainment of graduate degree enjoy the highest average annual earnings of $78,750, while those with high school diploma education earn the least with $21,615. Women with an educational attainment of graduate degree earn the most with the average annual earnings of $53,491, while those with less than high school education have the smallest earnings of $18,974.
| Educational Attainment | Male Income | Female Income |
| Less than High School | $24,102 | $18,974 |
| High School Diploma | $21,615 | $29,167 |
| College or Associate's Degree | $48,583 | $27,513 |
| Bachelor's Degree | $59,500 | $41,750 |
| Graduate Degree | $78,750 | $53,491 |
| Total | $39,338 | $30,357 |
Family Income in Lancaster
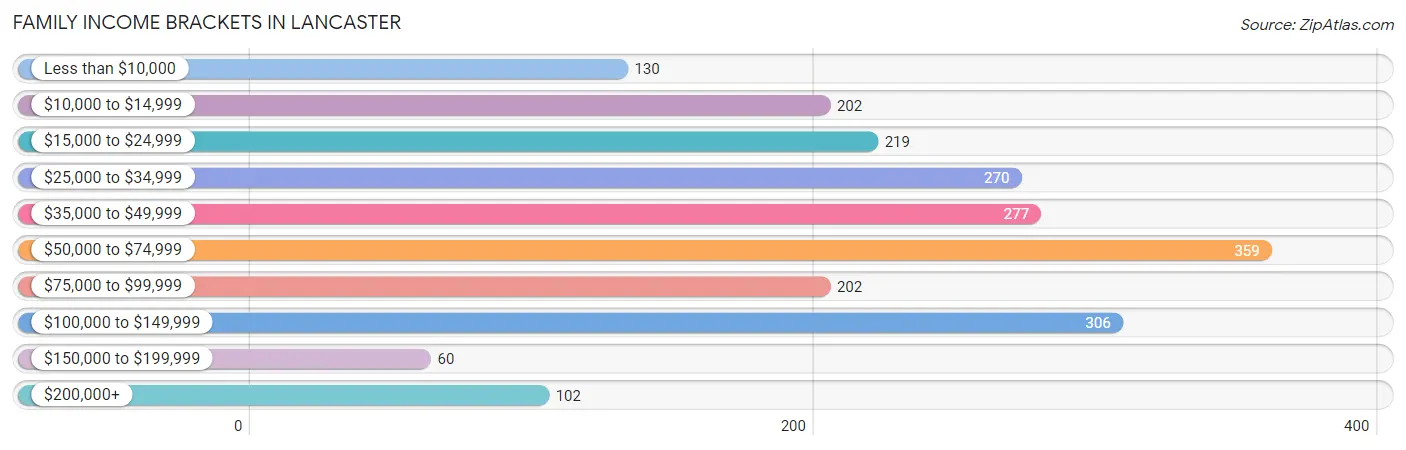
Family Income Brackets in Lancaster
According to the Lancaster family income data, there are 359 families falling into the $50,000 to $74,999 income range, which is the most common income bracket and makes up 16.9% of all families. Conversely, the $150,000 to $199,999 income bracket is the least frequent group with only 60 families (2.8%) belonging to this category.
| Income Bracket | # Families | % Families |
| Less than $10,000 | 130 | 6.1% |
| $10,000 to $14,999 | 202 | 9.5% |
| $15,000 to $24,999 | 219 | 10.3% |
| $25,000 to $34,999 | 270 | 12.7% |
| $35,000 to $49,999 | 277 | 13.0% |
| $50,000 to $74,999 | 359 | 16.9% |
| $75,000 to $99,999 | 202 | 9.5% |
| $100,000 to $149,999 | 306 | 14.4% |
| $150,000 to $199,999 | 60 | 2.8% |
| $200,000+ | 102 | 4.8% |
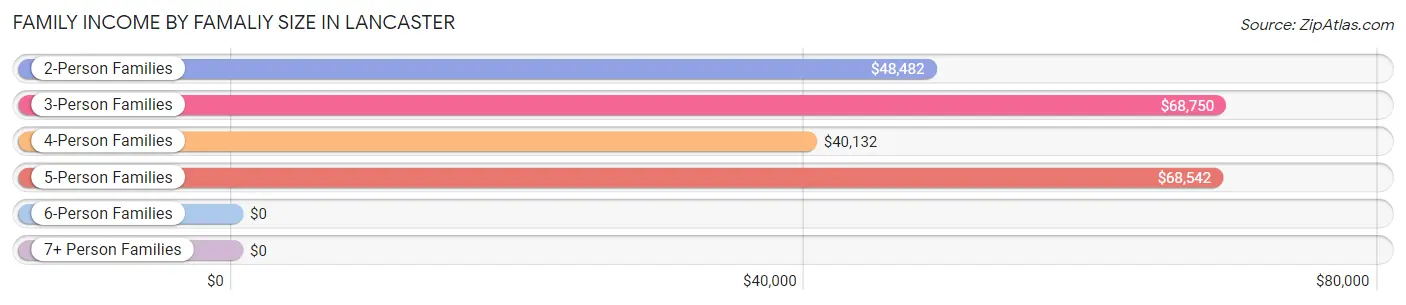
Family Income by Famaliy Size in Lancaster
3-person families (345 | 16.2%) account for the highest median family income in Lancaster with $68,750 per family, while 2-person families (1,023 | 48.1%) have the highest median income of $24,241 per family member.
| Income Bracket | # Families | Median Income |
| 2-Person Families | 1,023 (48.1%) | $48,482 |
| 3-Person Families | 345 (16.2%) | $68,750 |
| 4-Person Families | 458 (21.5%) | $40,132 |
| 5-Person Families | 147 (6.9%) | $68,542 |
| 6-Person Families | 145 (6.8%) | $0 |
| 7+ Person Families | 9 (0.4%) | $0 |
| Total | 2,127 (100.0%) | $49,126 |
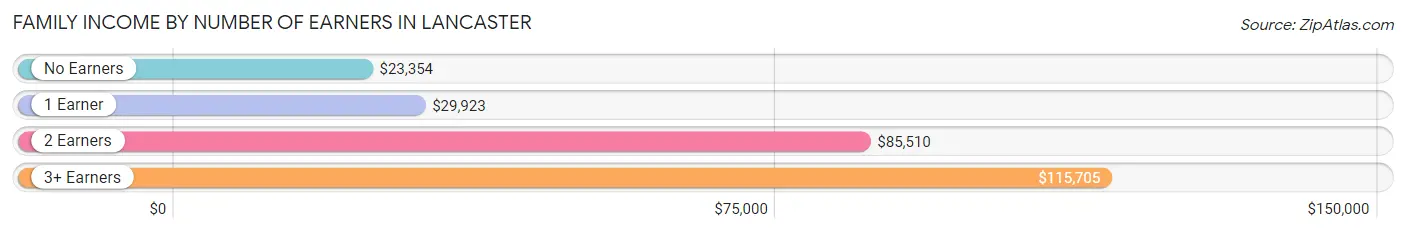
Family Income by Number of Earners in Lancaster
The median family income in Lancaster is $49,126, with families comprising 3+ earners (237) having the highest median family income of $115,705, while families with no earners (314) have the lowest median family income of $23,354, accounting for 11.1% and 14.8% of families, respectively.
| Number of Earners | # Families | Median Income |
| No Earners | 314 (14.8%) | $23,354 |
| 1 Earner | 928 (43.6%) | $29,923 |
| 2 Earners | 648 (30.5%) | $85,510 |
| 3+ Earners | 237 (11.1%) | $115,705 |
| Total | 2,127 (100.0%) | $49,126 |
Household Income in Lancaster
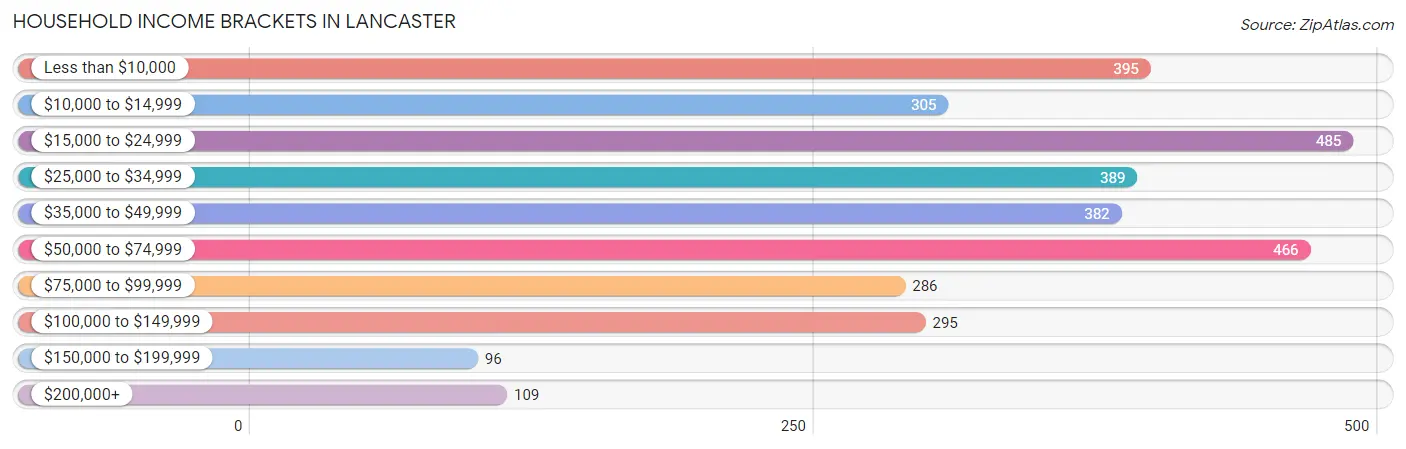
Household Income Brackets in Lancaster
With 485 households falling in the category, the $15,000 to $24,999 income range is the most frequent in Lancaster, accounting for 15.1% of all households. In contrast, only 96 households (3.0%) fall into the $150,000 to $199,999 income bracket, making it the least populous group.
| Income Bracket | # Households | % Households |
| Less than $10,000 | 395 | 12.3% |
| $10,000 to $14,999 | 305 | 9.5% |
| $15,000 to $24,999 | 485 | 15.1% |
| $25,000 to $34,999 | 389 | 12.1% |
| $35,000 to $49,999 | 382 | 11.9% |
| $50,000 to $74,999 | 466 | 14.5% |
| $75,000 to $99,999 | 286 | 8.9% |
| $100,000 to $149,999 | 295 | 9.2% |
| $150,000 to $199,999 | 96 | 3.0% |
| $200,000+ | 109 | 3.4% |
Household Income by Householder Age in Lancaster
The median household income in Lancaster is $37,714, with the highest median household income of $43,636 found in the 25 to 44 years age bracket for the primary householder. A total of 1,150 households (35.8%) fall into this category. Meanwhile, the 15 to 24 years age bracket for the primary householder has the lowest median household income of $13,705, with 167 households (5.2%) in this group.
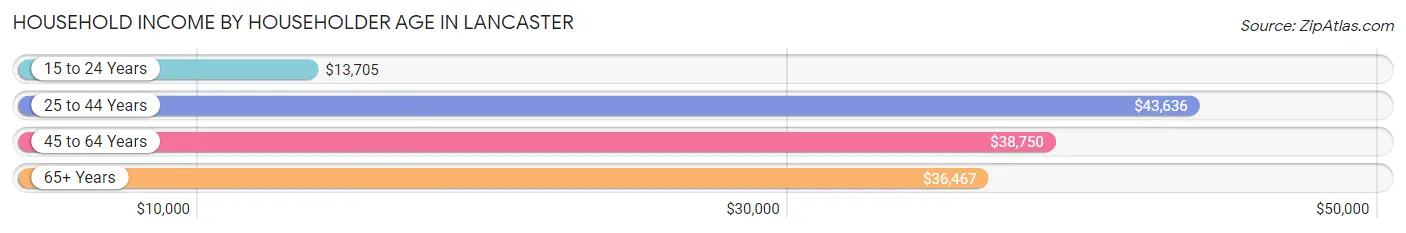
| Income Bracket | # Households | Median Income |
| 15 to 24 Years | 167 (5.2%) | $13,705 |
| 25 to 44 Years | 1,150 (35.8%) | $43,636 |
| 45 to 64 Years | 1,043 (32.5%) | $38,750 |
| 65+ Years | 851 (26.5%) | $36,467 |
| Total | 3,211 (100.0%) | $37,714 |
Poverty in Lancaster
Income Below Poverty by Sex and Age in Lancaster
With 26.8% poverty level for males and 35.6% for females among the residents of Lancaster, under 5 year old males and 15 year old females are the most vulnerable to poverty, with 183 males (70.1%) and 70 females (92.1%) in their respective age groups living below the poverty level.
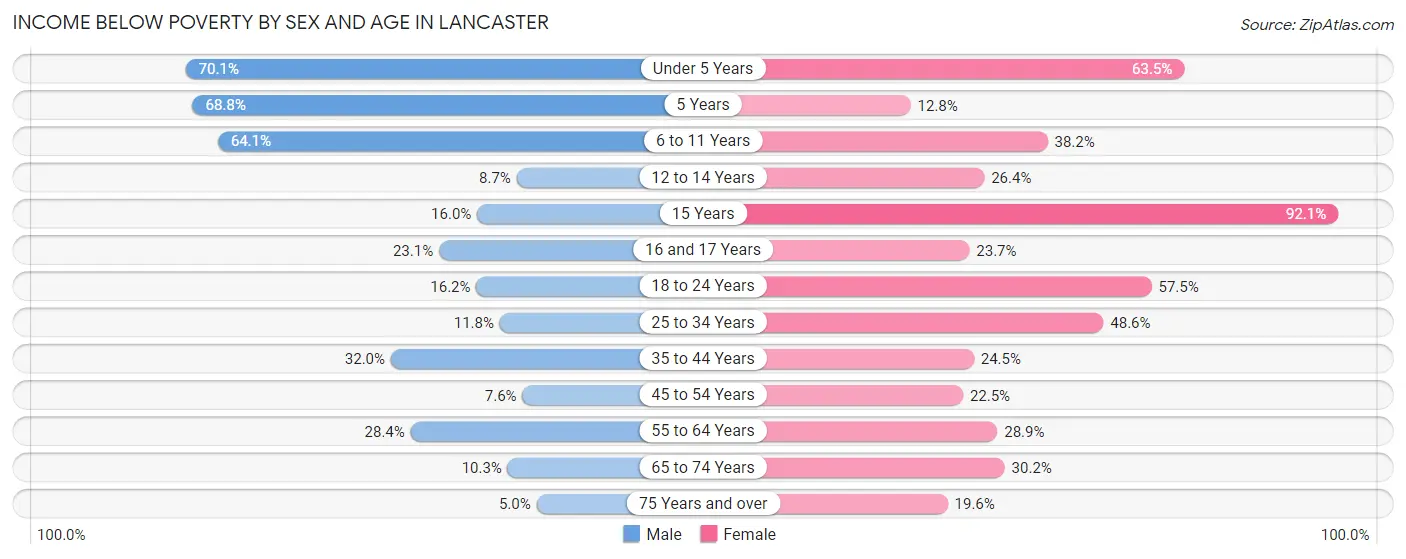
| Age Bracket | Male | Female |
| Under 5 Years | 183 (70.1%) | 176 (63.5%) |
| 5 Years | 53 (68.8%) | 6 (12.8%) |
| 6 to 11 Years | 295 (64.1%) | 110 (38.2%) |
| 12 to 14 Years | 20 (8.7%) | 55 (26.4%) |
| 15 Years | 8 (16.0%) | 70 (92.1%) |
| 16 and 17 Years | 30 (23.1%) | 54 (23.7%) |
| 18 to 24 Years | 47 (16.2%) | 215 (57.5%) |
| 25 to 34 Years | 66 (11.8%) | 334 (48.5%) |
| 35 to 44 Years | 155 (32.0%) | 182 (24.5%) |
| 45 to 54 Years | 31 (7.6%) | 101 (22.5%) |
| 55 to 64 Years | 112 (28.3%) | 151 (28.9%) |
| 65 to 74 Years | 34 (10.3%) | 130 (30.2%) |
| 75 Years and over | 11 (5.0%) | 54 (19.6%) |
| Total | 1,045 (26.8%) | 1,638 (35.6%) |
Income Above Poverty by Sex and Age in Lancaster
According to the poverty statistics in Lancaster, males aged 75 years and over and females aged 5 years are the age groups that are most secure financially, with 95.0% of males and 87.2% of females in these age groups living above the poverty line.
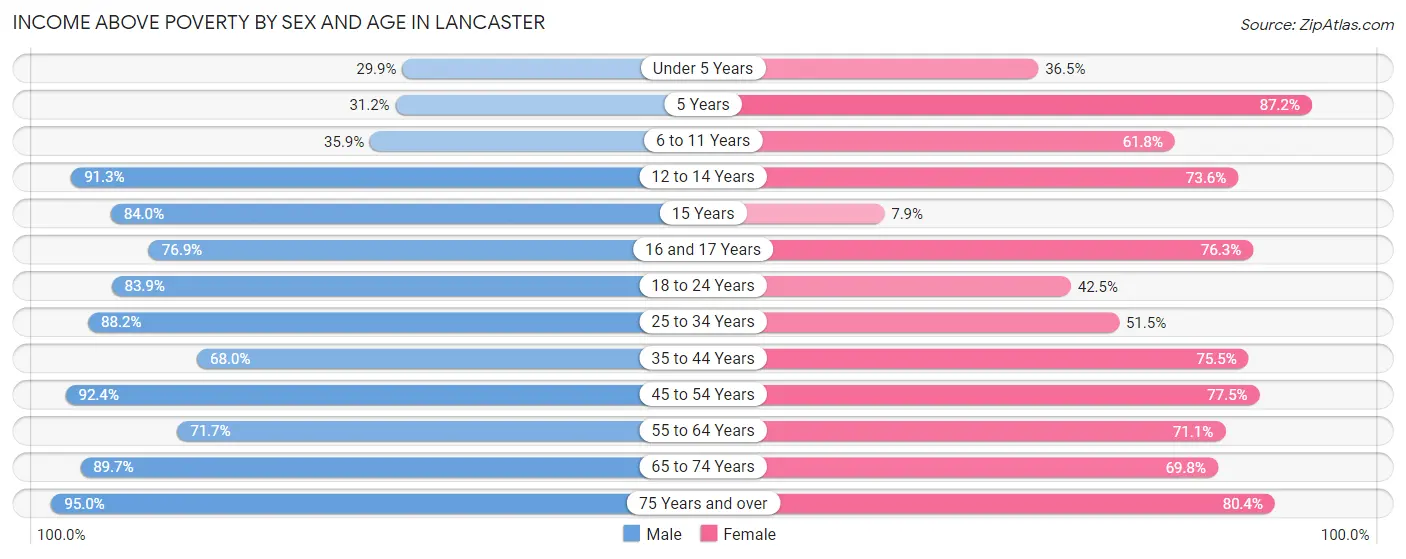
| Age Bracket | Male | Female |
| Under 5 Years | 78 (29.9%) | 101 (36.5%) |
| 5 Years | 24 (31.2%) | 41 (87.2%) |
| 6 to 11 Years | 165 (35.9%) | 178 (61.8%) |
| 12 to 14 Years | 211 (91.3%) | 153 (73.6%) |
| 15 Years | 42 (84.0%) | 6 (7.9%) |
| 16 and 17 Years | 100 (76.9%) | 174 (76.3%) |
| 18 to 24 Years | 244 (83.9%) | 159 (42.5%) |
| 25 to 34 Years | 494 (88.2%) | 354 (51.4%) |
| 35 to 44 Years | 329 (68.0%) | 561 (75.5%) |
| 45 to 54 Years | 377 (92.4%) | 348 (77.5%) |
| 55 to 64 Years | 283 (71.7%) | 372 (71.1%) |
| 65 to 74 Years | 295 (89.7%) | 300 (69.8%) |
| 75 Years and over | 210 (95.0%) | 221 (80.4%) |
| Total | 2,852 (73.2%) | 2,968 (64.4%) |
Income Below Poverty Among Married-Couple Families in Lancaster
The poverty statistics for married-couple families in Lancaster show that 8.3% or 89 of the total 1,079 families live below the poverty line. Families with no children have the highest poverty rate of 9.8%, comprising of 70 families. On the other hand, families with 3 or 4 children have the lowest poverty rate of 0.0%, which includes 0 families.
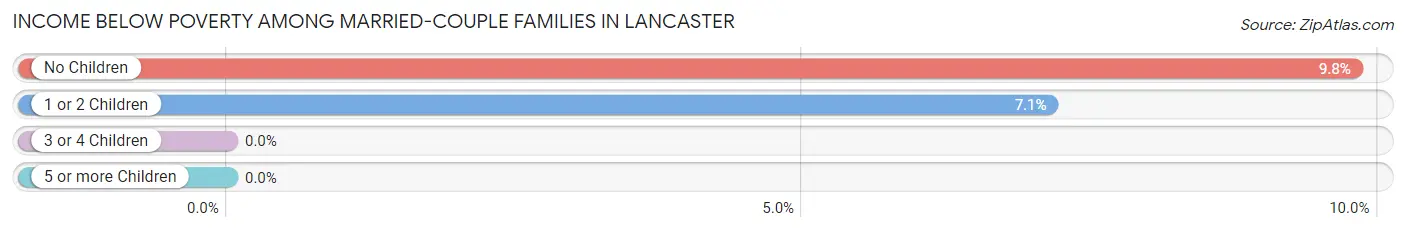
| Children | Above Poverty | Below Poverty |
| No Children | 645 (90.2%) | 70 (9.8%) |
| 1 or 2 Children | 247 (92.9%) | 19 (7.1%) |
| 3 or 4 Children | 98 (100.0%) | 0 (0.0%) |
| 5 or more Children | 0 (0.0%) | 0 (0.0%) |
| Total | 990 (91.7%) | 89 (8.3%) |
Income Below Poverty Among Single-Parent Households in Lancaster
According to the poverty data in Lancaster, 17.8% or 18 single-father households and 54.2% or 513 single-mother households are living below the poverty line. Among single-father households, those with 1 or 2 children have the highest poverty rate, with 13 households (26.5%) experiencing poverty. Likewise, among single-mother households, those with 5 or more children have the highest poverty rate, with 7 households (100.0%) falling below the poverty line.
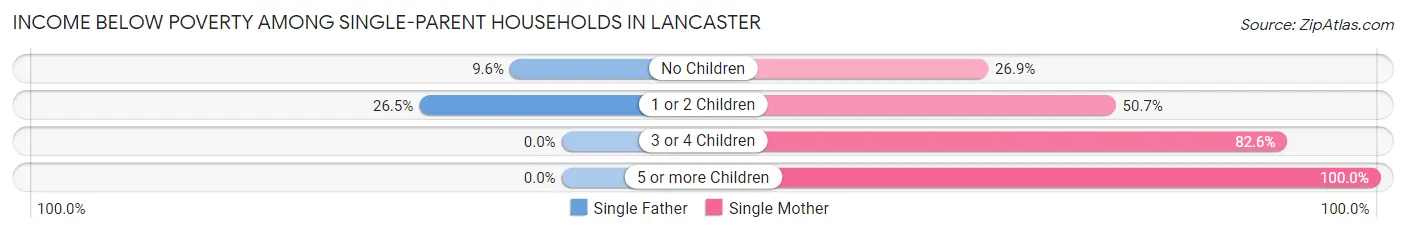
| Children | Single Father | Single Mother |
| No Children | 5 (9.6%) | 60 (26.9%) |
| 1 or 2 Children | 13 (26.5%) | 232 (50.7%) |
| 3 or 4 Children | 0 (0.0%) | 214 (82.6%) |
| 5 or more Children | 0 (0.0%) | 7 (100.0%) |
| Total | 18 (17.8%) | 513 (54.2%) |
Income Below Poverty Among Married-Couple vs Single-Parent Households in Lancaster
The poverty data for Lancaster shows that 89 of the married-couple family households (8.3%) and 531 of the single-parent households (50.7%) are living below the poverty level. Within the married-couple family households, those with no children have the highest poverty rate, with 70 households (9.8%) falling below the poverty line. Among the single-parent households, those with 5 or more children have the highest poverty rate, with 7 household (100.0%) living below poverty.
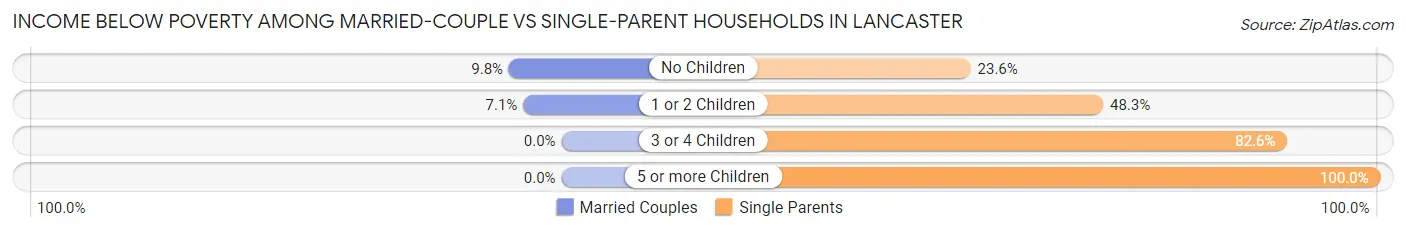
| Children | Married-Couple Families | Single-Parent Households |
| No Children | 70 (9.8%) | 65 (23.6%) |
| 1 or 2 Children | 19 (7.1%) | 245 (48.3%) |
| 3 or 4 Children | 0 (0.0%) | 214 (82.6%) |
| 5 or more Children | 0 (0.0%) | 7 (100.0%) |
| Total | 89 (8.3%) | 531 (50.7%) |
Race in Lancaster
The most populous races in Lancaster are Black / African American (4,386 | 51.0%), White / Caucasian (3,122 | 36.3%), and Hispanic or Latino (916 | 10.7%).
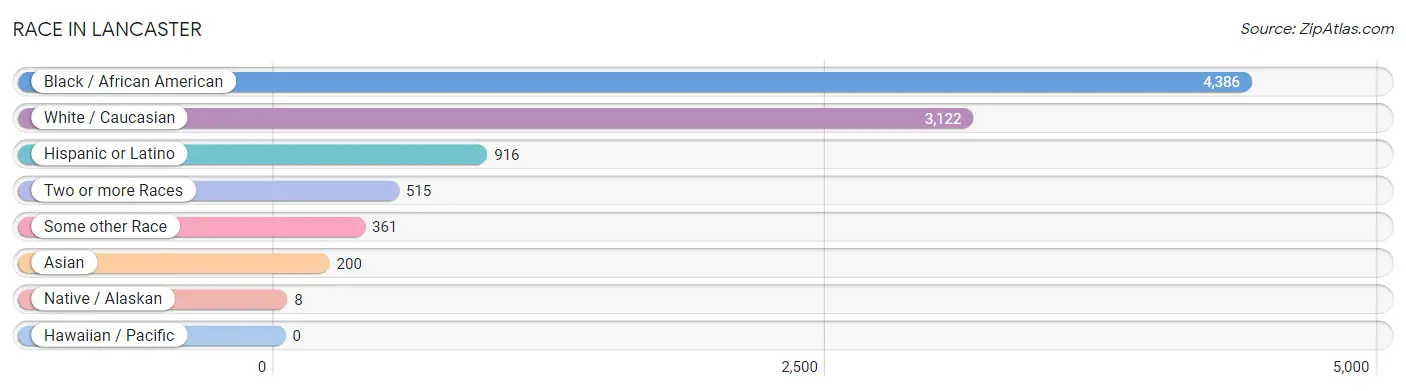
| Race | # Population | % Population |
| Asian | 200 | 2.3% |
| Black / African American | 4,386 | 51.0% |
| Hawaiian / Pacific | 0 | 0.0% |
| Hispanic or Latino | 916 | 10.7% |
| Native / Alaskan | 8 | 0.1% |
| White / Caucasian | 3,122 | 36.3% |
| Two or more Races | 515 | 6.0% |
| Some other Race | 361 | 4.2% |
| Total | 8,592 | 100.0% |
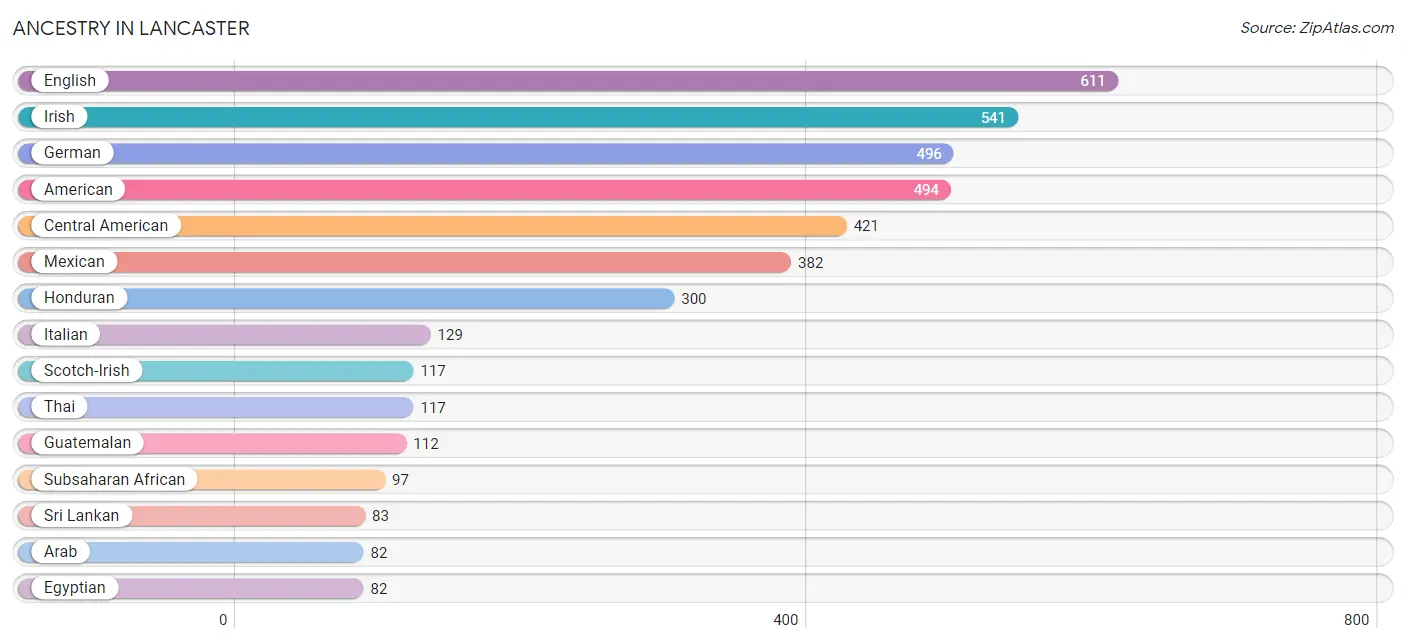
Ancestry in Lancaster
The most populous ancestries reported in Lancaster are English (611 | 7.1%), Irish (541 | 6.3%), German (496 | 5.8%), American (494 | 5.8%), and Central American (421 | 4.9%), together accounting for 29.8% of all Lancaster residents.
| Ancestry | # Population | % Population |
| African | 71 | 0.8% |
| American | 494 | 5.8% |
| Arab | 82 | 0.9% |
| Brazilian | 7 | 0.1% |
| British | 42 | 0.5% |
| Central American | 421 | 4.9% |
| Cherokee | 8 | 0.1% |
| Colombian | 49 | 0.6% |
| Costa Rican | 9 | 0.1% |
| Czech | 8 | 0.1% |
| Dutch | 54 | 0.6% |
| Egyptian | 82 | 0.9% |
| English | 611 | 7.1% |
| European | 38 | 0.4% |
| French | 22 | 0.3% |
| French Canadian | 4 | 0.1% |
| German | 496 | 5.8% |
| Guatemalan | 112 | 1.3% |
| Honduran | 300 | 3.5% |
| Irish | 541 | 6.3% |
| Italian | 129 | 1.5% |
| Latvian | 5 | 0.1% |
| Mexican | 382 | 4.4% |
| Nigerian | 26 | 0.3% |
| Northern European | 29 | 0.3% |
| Norwegian | 53 | 0.6% |
| Peruvian | 25 | 0.3% |
| Polish | 22 | 0.3% |
| Portuguese | 20 | 0.2% |
| Puerto Rican | 27 | 0.3% |
| Russian | 14 | 0.2% |
| Scotch-Irish | 117 | 1.4% |
| Scottish | 53 | 0.6% |
| South American | 74 | 0.9% |
| Sri Lankan | 83 | 1.0% |
| Subsaharan African | 97 | 1.1% |
| Thai | 117 | 1.4% |
| Ukrainian | 6 | 0.1% | View All 38 Rows |
Immigrants in Lancaster
The most numerous immigrant groups reported in Lancaster came from Latin America (395 | 4.6%), Central America (292 | 3.4%), Honduras (198 | 2.3%), Asia (172 | 2.0%), and India (121 | 1.4%), together accounting for 13.7% of all Lancaster residents.
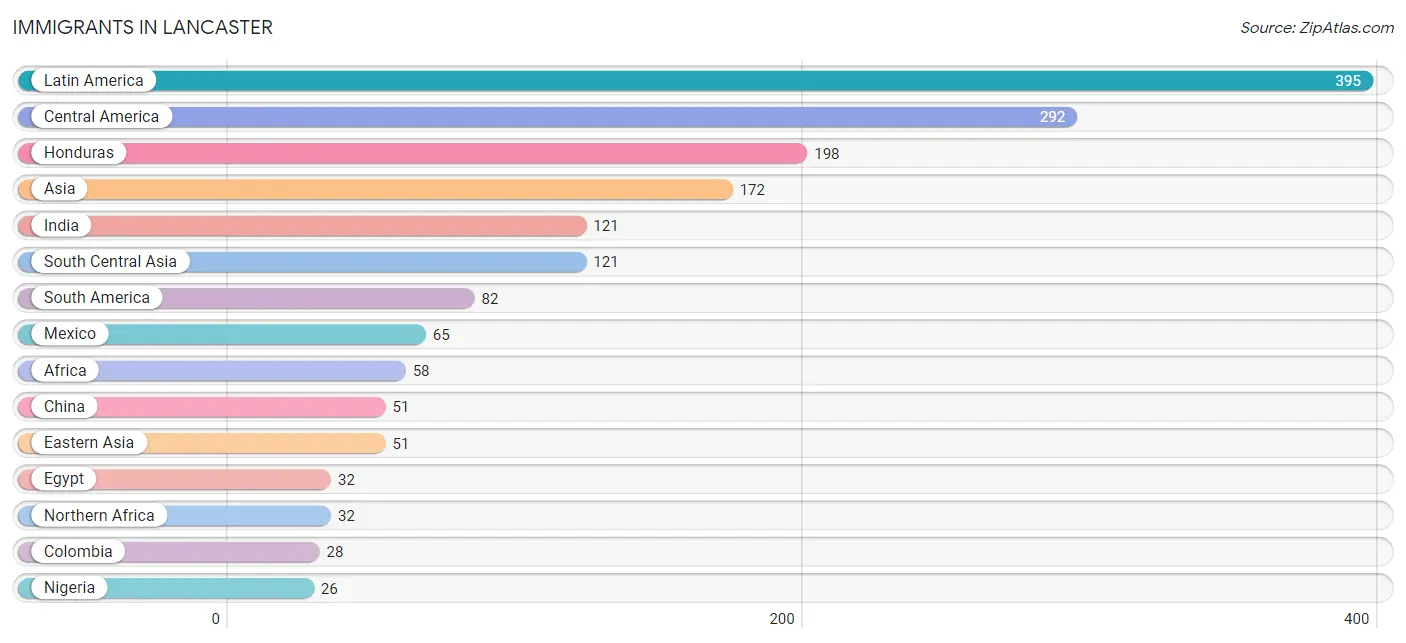
| Immigration Origin | # Population | % Population |
| Africa | 58 | 0.7% |
| Asia | 172 | 2.0% |
| Brazil | 20 | 0.2% |
| Caribbean | 21 | 0.2% |
| Central America | 292 | 3.4% |
| China | 51 | 0.6% |
| Colombia | 28 | 0.3% |
| Costa Rica | 9 | 0.1% |
| Eastern Asia | 51 | 0.6% |
| Ecuador | 9 | 0.1% |
| Egypt | 32 | 0.4% |
| Guatemala | 20 | 0.2% |
| Honduras | 198 | 2.3% |
| India | 121 | 1.4% |
| Jamaica | 21 | 0.2% |
| Latin America | 395 | 4.6% |
| Mexico | 65 | 0.8% |
| Nigeria | 26 | 0.3% |
| Northern Africa | 32 | 0.4% |
| Peru | 25 | 0.3% |
| South America | 82 | 0.9% |
| South Central Asia | 121 | 1.4% |
| Western Africa | 26 | 0.3% | View All 23 Rows |
Sex and Age in Lancaster
Sex and Age in Lancaster
The most populous age groups in Lancaster are 10 to 14 Years (419 | 10.7%) for men and 15 to 19 Years (476 | 10.2%) for women.
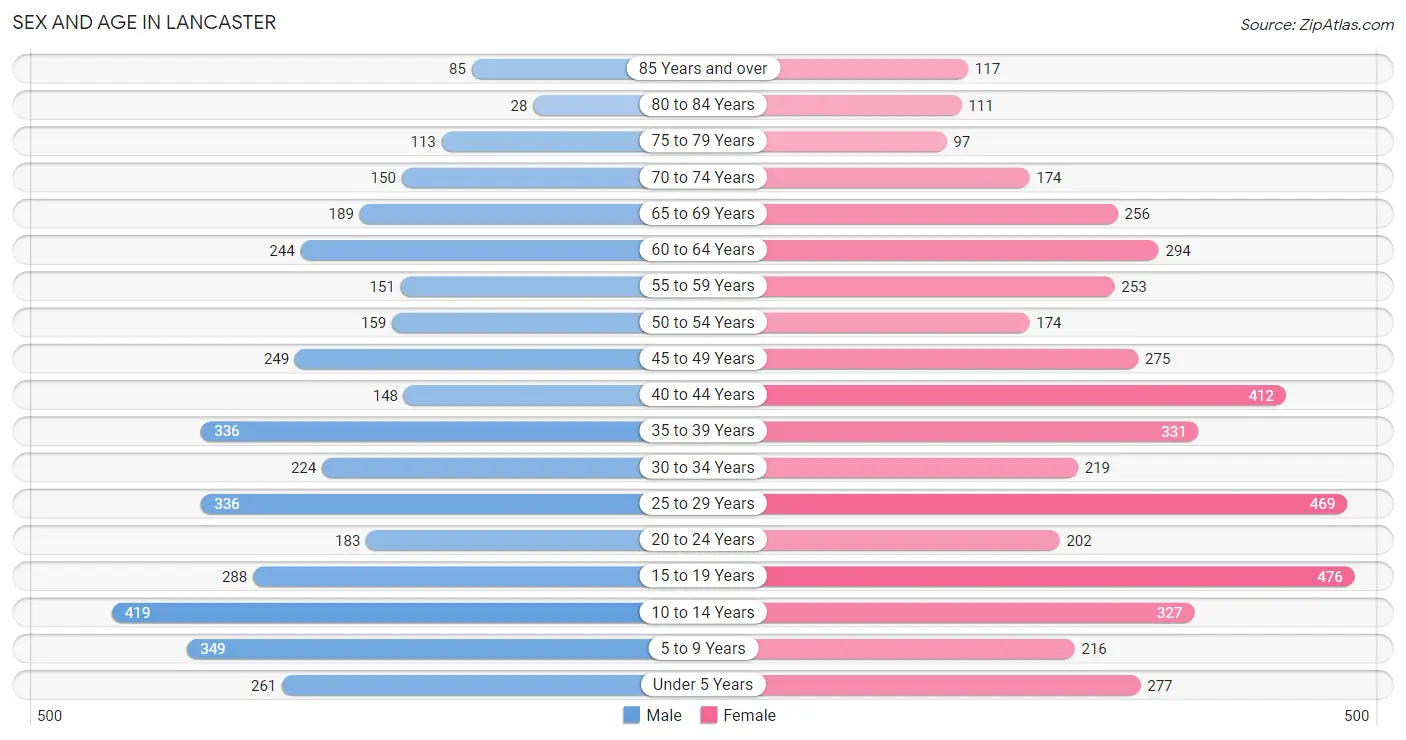
| Age Bracket | Male | Female |
| Under 5 Years | 261 (6.7%) | 277 (5.9%) |
| 5 to 9 Years | 349 (8.9%) | 216 (4.6%) |
| 10 to 14 Years | 419 (10.7%) | 327 (7.0%) |
| 15 to 19 Years | 288 (7.4%) | 476 (10.2%) |
| 20 to 24 Years | 183 (4.7%) | 202 (4.3%) |
| 25 to 29 Years | 336 (8.6%) | 469 (10.0%) |
| 30 to 34 Years | 224 (5.7%) | 219 (4.7%) |
| 35 to 39 Years | 336 (8.6%) | 331 (7.1%) |
| 40 to 44 Years | 148 (3.8%) | 412 (8.8%) |
| 45 to 49 Years | 249 (6.4%) | 275 (5.9%) |
| 50 to 54 Years | 159 (4.1%) | 174 (3.7%) |
| 55 to 59 Years | 151 (3.9%) | 253 (5.4%) |
| 60 to 64 Years | 244 (6.2%) | 294 (6.3%) |
| 65 to 69 Years | 189 (4.8%) | 256 (5.5%) |
| 70 to 74 Years | 150 (3.8%) | 174 (3.7%) |
| 75 to 79 Years | 113 (2.9%) | 97 (2.1%) |
| 80 to 84 Years | 28 (0.7%) | 111 (2.4%) |
| 85 Years and over | 85 (2.2%) | 117 (2.5%) |
| Total | 3,912 (100.0%) | 4,680 (100.0%) |
Families and Households in Lancaster
Median Family Size in Lancaster
The median family size in Lancaster is 3.37 persons per family, with single female/mother families (947 | 44.5%) accounting for the largest median family size of 3.56 persons per family. On the other hand, married-couple families (1,079 | 50.7%) represent the smallest median family size with 3.20 persons per family.
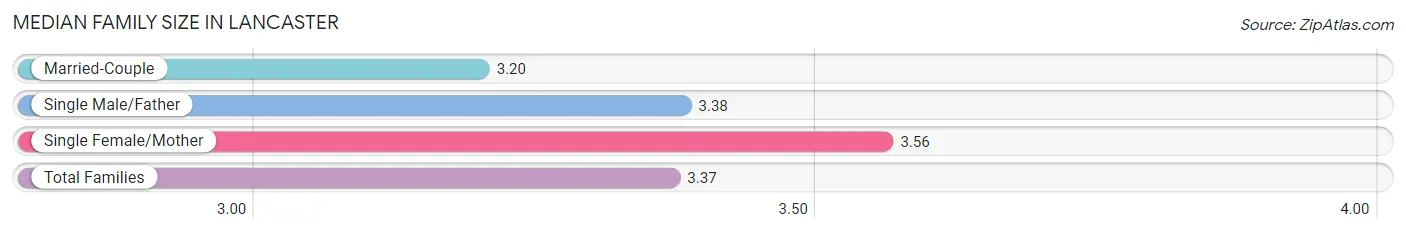
| Family Type | # Families | Family Size |
| Married-Couple | 1,079 (50.7%) | 3.20 |
| Single Male/Father | 101 (4.8%) | 3.38 |
| Single Female/Mother | 947 (44.5%) | 3.56 |
| Total Families | 2,127 (100.0%) | 3.37 |
Median Household Size in Lancaster
The median household size in Lancaster is 2.63 persons per household, with single male/father households (101 | 3.2%) accounting for the largest median household size of 3.64 persons per household. non-family households (1,084 | 33.8%) represent the smallest median household size with 1.06 persons per household.
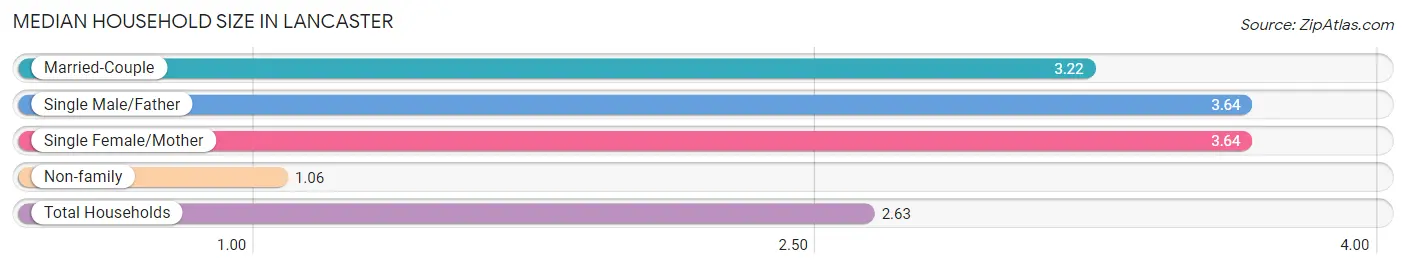
| Household Type | # Households | Household Size |
| Married-Couple | 1,079 (33.6%) | 3.22 |
| Single Male/Father | 101 (3.2%) | 3.64 |
| Single Female/Mother | 947 (29.5%) | 3.64 |
| Non-family | 1,084 (33.8%) | 1.06 |
| Total Households | 3,211 (100.0%) | 2.63 |
Household Size by Marriage Status in Lancaster
Out of a total of 3,211 households in Lancaster, 2,127 (66.2%) are family households, while 1,084 (33.8%) are nonfamily households. The most numerous type of family households are 2-person households, comprising 988, and the most common type of nonfamily households are 1-person households, comprising 1,029.
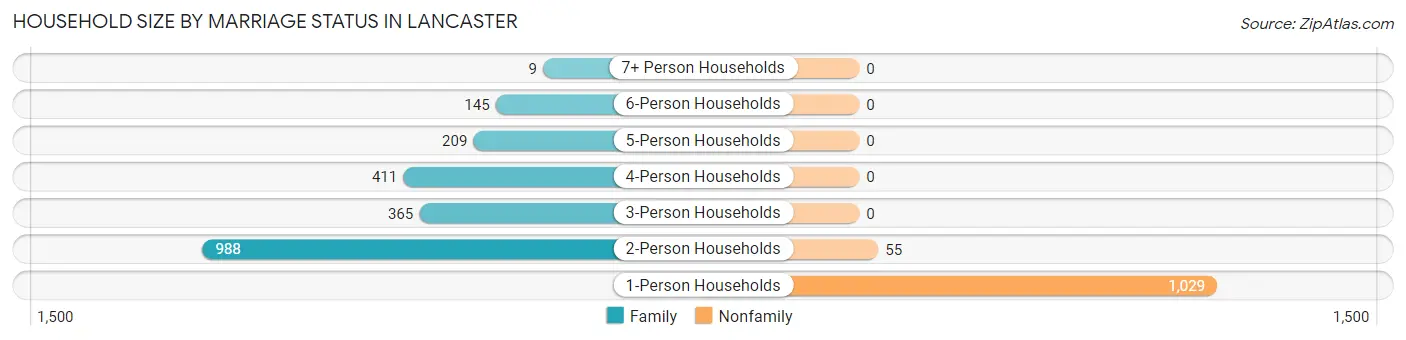
| Household Size | Family Households | Nonfamily Households |
| 1-Person Households | - | 1,029 (32.1%) |
| 2-Person Households | 988 (30.8%) | 55 (1.7%) |
| 3-Person Households | 365 (11.4%) | 0 (0.0%) |
| 4-Person Households | 411 (12.8%) | 0 (0.0%) |
| 5-Person Households | 209 (6.5%) | 0 (0.0%) |
| 6-Person Households | 145 (4.5%) | 0 (0.0%) |
| 7+ Person Households | 9 (0.3%) | 0 (0.0%) |
| Total | 2,127 (66.2%) | 1,084 (33.8%) |
Female Fertility in Lancaster
Fertility by Age in Lancaster
Average fertility rate in Lancaster is 118.0 births per 1,000 women. Women in the age bracket of 20 to 34 years have the highest fertility rate with 207.0 births per 1,000 women. Women in the age bracket of 20 to 34 years acount for 64.6% of all women with births.
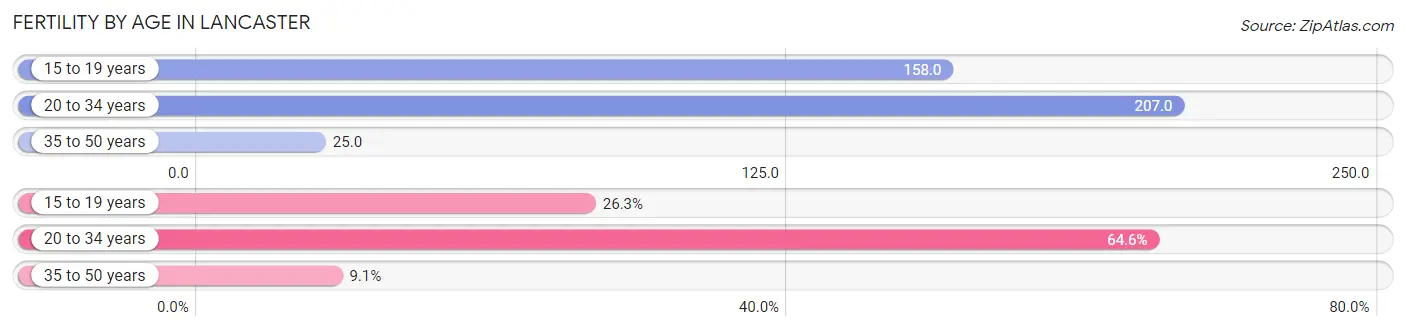
| Age Bracket | Women with Births | Births / 1,000 Women |
| 15 to 19 years | 75 (26.3%) | 158.0 |
| 20 to 34 years | 184 (64.6%) | 207.0 |
| 35 to 50 years | 26 (9.1%) | 25.0 |
| Total | 285 (100.0%) | 118.0 |
Fertility by Age by Marriage Status in Lancaster
16.8% of women with births (285) in Lancaster are married. The highest percentage of unmarried women with births falls into 15 to 19 years age bracket with 100.0% of them unmarried at the time of birth, while the lowest percentage of unmarried women with births belong to 20 to 34 years age bracket with 73.9% of them unmarried.
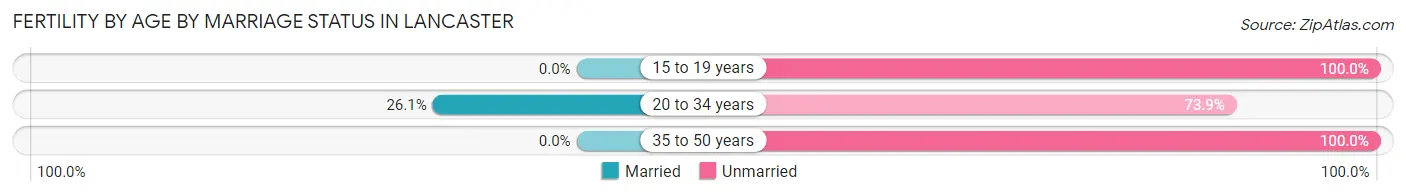
| Age Bracket | Married | Unmarried |
| 15 to 19 years | 0 (0.0%) | 75 (100.0%) |
| 20 to 34 years | 48 (26.1%) | 136 (73.9%) |
| 35 to 50 years | 0 (0.0%) | 26 (100.0%) |
| Total | 48 (16.8%) | 237 (83.2%) |
Fertility by Education in Lancaster
Average fertility rate in Lancaster is 118.0 births per 1,000 women. Women with the education attainment of less than high school have the highest fertility rate of 208.0 births per 1,000 women, while women with the education attainment of college or associate's degree have the lowest fertility at 22.0 births per 1,000 women. Women with the education attainment of less than high school represent 52.3% of all women with births.
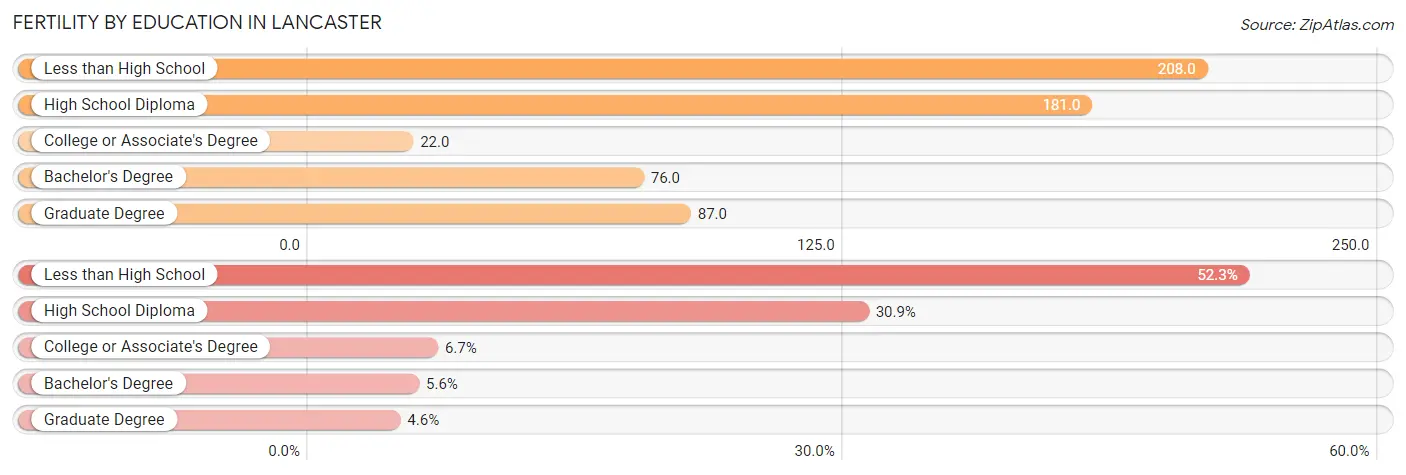
| Educational Attainment | Women with Births | Births / 1,000 Women |
| Less than High School | 149 (52.3%) | 208.0 |
| High School Diploma | 88 (30.9%) | 181.0 |
| College or Associate's Degree | 19 (6.7%) | 22.0 |
| Bachelor's Degree | 16 (5.6%) | 76.0 |
| Graduate Degree | 13 (4.6%) | 87.0 |
| Total | 285 (100.0%) | 118.0 |
Fertility by Education by Marriage Status in Lancaster
83.2% of women with births in Lancaster are unmarried. Women with the educational attainment of college or associate's degree are most likely to be married with 100.0% of them married at childbirth, while women with the educational attainment of less than high school are least likely to be married with 100.0% of them unmarried at childbirth.
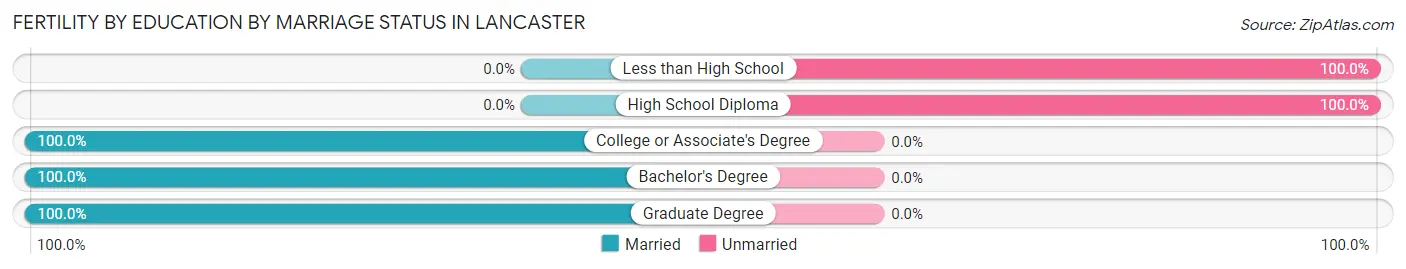
| Educational Attainment | Married | Unmarried |
| Less than High School | 0 (0.0%) | 149 (100.0%) |
| High School Diploma | 0 (0.0%) | 88 (100.0%) |
| College or Associate's Degree | 19 (100.0%) | 0 (0.0%) |
| Bachelor's Degree | 16 (100.0%) | 0 (0.0%) |
| Graduate Degree | 13 (100.0%) | 0 (0.0%) |
| Total | 48 (16.8%) | 237 (83.2%) |
Employment Characteristics in Lancaster
Employment by Class of Employer in Lancaster
Among the 3,278 employed individuals in Lancaster, private company employees (2,379 | 72.6%), not-for-profit organizations (278 | 8.5%), and local government employees (186 | 5.7%) make up the most common classes of employment.
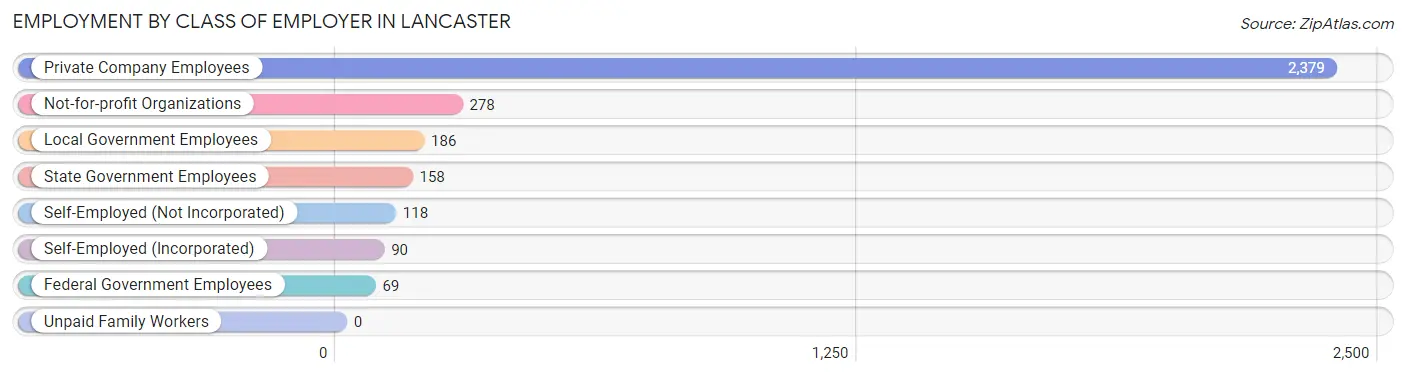
| Employer Class | # Employees | % Employees |
| Private Company Employees | 2,379 | 72.6% |
| Self-Employed (Incorporated) | 90 | 2.8% |
| Self-Employed (Not Incorporated) | 118 | 3.6% |
| Not-for-profit Organizations | 278 | 8.5% |
| Local Government Employees | 186 | 5.7% |
| State Government Employees | 158 | 4.8% |
| Federal Government Employees | 69 | 2.1% |
| Unpaid Family Workers | 0 | 0.0% |
| Total | 3,278 | 100.0% |
Employment Status by Age in Lancaster
According to the labor force statistics for Lancaster, out of the total population over 16 years of age (6,617), 59.2% or 3,917 individuals are in the labor force, with 13.3% or 521 of them unemployed. The age group with the highest labor force participation rate is 30 to 34 years, with 87.4% or 387 individuals in the labor force. Within the labor force, the 30 to 34 years age range has the highest percentage of unemployed individuals, with 38.8% or 150 of them being unemployed.
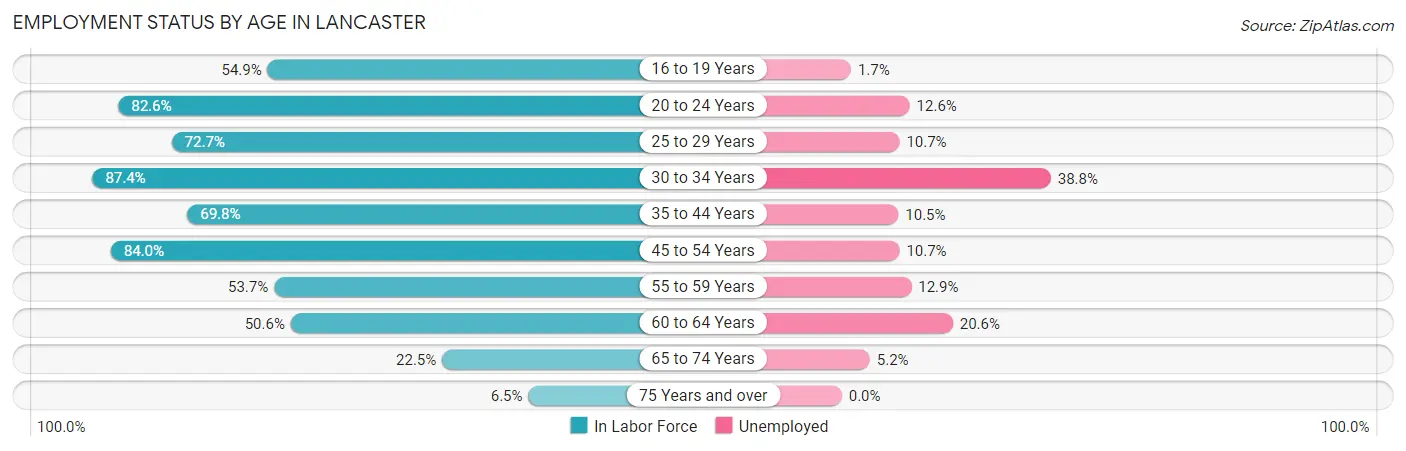
| Age Bracket | In Labor Force | Unemployed |
| 16 to 19 Years | 350 (54.9%) | 6 (1.7%) |
| 20 to 24 Years | 318 (82.6%) | 40 (12.6%) |
| 25 to 29 Years | 585 (72.7%) | 63 (10.7%) |
| 30 to 34 Years | 387 (87.4%) | 150 (38.8%) |
| 35 to 44 Years | 856 (69.8%) | 90 (10.5%) |
| 45 to 54 Years | 720 (84.0%) | 77 (10.7%) |
| 55 to 59 Years | 217 (53.7%) | 28 (12.9%) |
| 60 to 64 Years | 272 (50.6%) | 56 (20.6%) |
| 65 to 74 Years | 173 (22.5%) | 9 (5.2%) |
| 75 Years and over | 36 (6.5%) | 0 (0.0%) |
| Total | 3,917 (59.2%) | 521 (13.3%) |
Employment Status by Educational Attainment in Lancaster
According to labor force statistics for Lancaster, 71.1% of individuals (3,039) out of the total population between 25 and 64 years of age (4,274) are in the labor force, with 15.3% or 465 of them being unemployed. The group with the highest labor force participation rate are those with the educational attainment of bachelor's degree or higher, with 86.4% or 596 individuals in the labor force. Within the labor force, individuals with less than high school education have the highest percentage of unemployment, with 27.8% or 121 of them being unemployed.
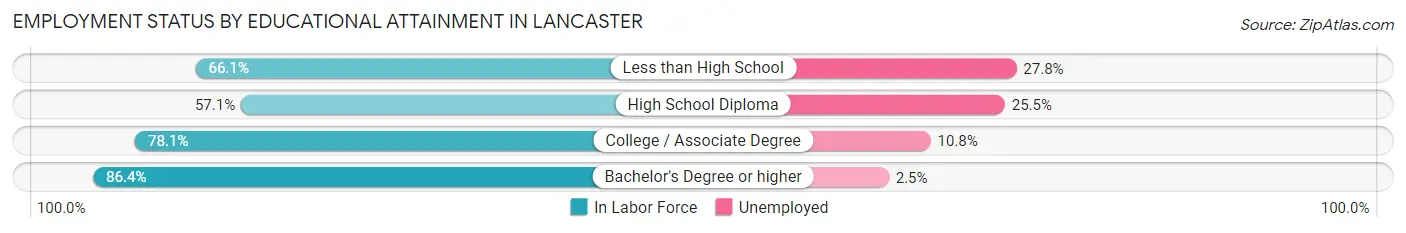
| Educational Attainment | In Labor Force | Unemployed |
| Less than High School | 436 (66.1%) | 183 (27.8%) |
| High School Diploma | 755 (57.1%) | 337 (25.5%) |
| College / Associate Degree | 1,250 (78.1%) | 173 (10.8%) |
| Bachelor's Degree or higher | 596 (86.4%) | 17 (2.5%) |
| Total | 3,039 (71.1%) | 654 (15.3%) |
Employment Occupations by Sex in Lancaster
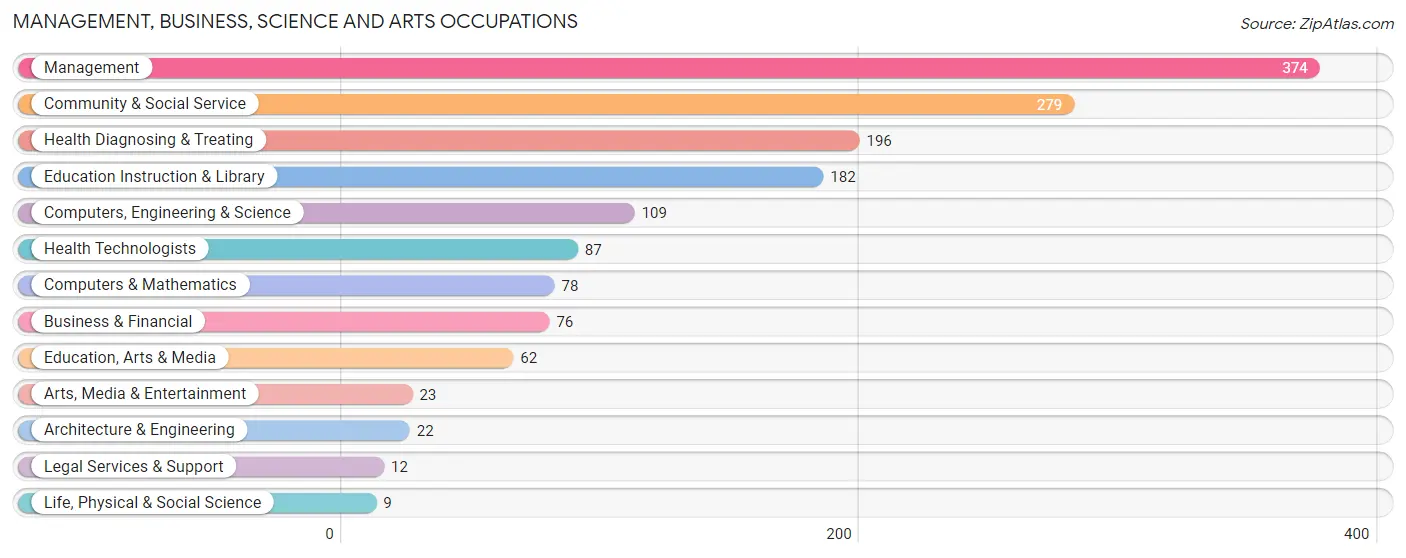
Management, Business, Science and Arts Occupations
The most common Management, Business, Science and Arts occupations in Lancaster are Management (374 | 11.1%), Community & Social Service (279 | 8.3%), Health Diagnosing & Treating (196 | 5.8%), Education Instruction & Library (182 | 5.4%), and Computers, Engineering & Science (109 | 3.2%).
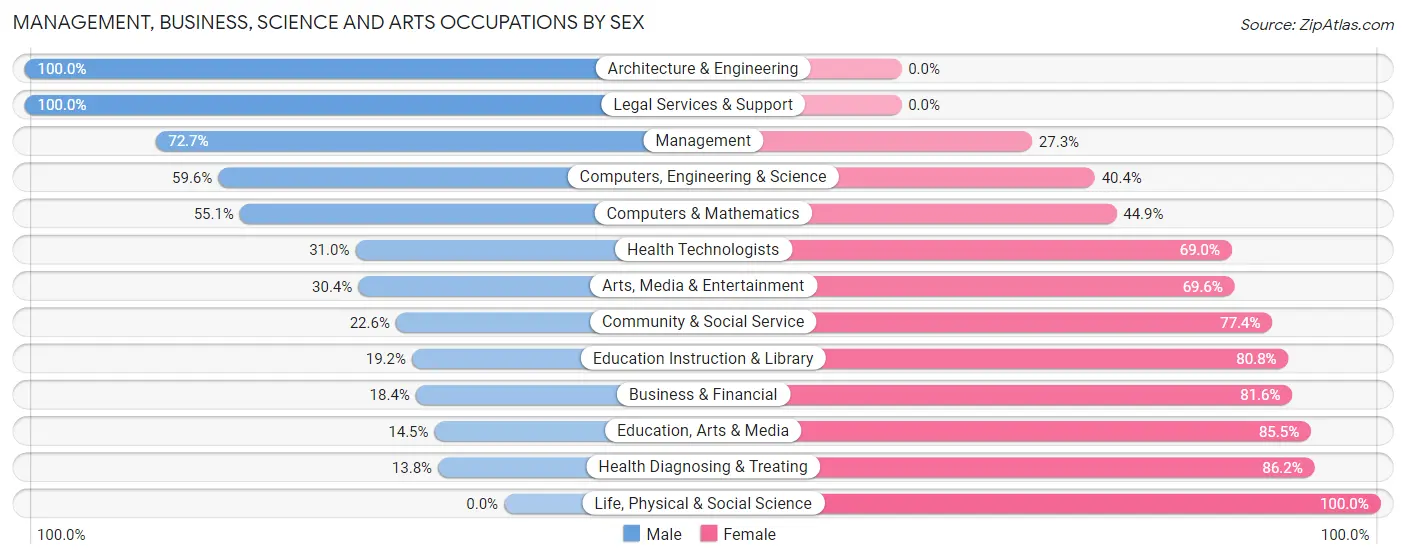
Management, Business, Science and Arts Occupations by Sex
Within the Management, Business, Science and Arts occupations in Lancaster, the most male-oriented occupations are Architecture & Engineering (100.0%), Legal Services & Support (100.0%), and Management (72.7%), while the most female-oriented occupations are Life, Physical & Social Science (100.0%), Health Diagnosing & Treating (86.2%), and Education, Arts & Media (85.5%).
| Occupation | Male | Female |
| Management | 272 (72.7%) | 102 (27.3%) |
| Business & Financial | 14 (18.4%) | 62 (81.6%) |
| Computers, Engineering & Science | 65 (59.6%) | 44 (40.4%) |
| Computers & Mathematics | 43 (55.1%) | 35 (44.9%) |
| Architecture & Engineering | 22 (100.0%) | 0 (0.0%) |
| Life, Physical & Social Science | 0 (0.0%) | 9 (100.0%) |
| Community & Social Service | 63 (22.6%) | 216 (77.4%) |
| Education, Arts & Media | 9 (14.5%) | 53 (85.5%) |
| Legal Services & Support | 12 (100.0%) | 0 (0.0%) |
| Education Instruction & Library | 35 (19.2%) | 147 (80.8%) |
| Arts, Media & Entertainment | 7 (30.4%) | 16 (69.6%) |
| Health Diagnosing & Treating | 27 (13.8%) | 169 (86.2%) |
| Health Technologists | 27 (31.0%) | 60 (69.0%) |
| Total (Category) | 441 (42.6%) | 593 (57.4%) |
| Total (Overall) | 1,545 (45.8%) | 1,829 (54.2%) |
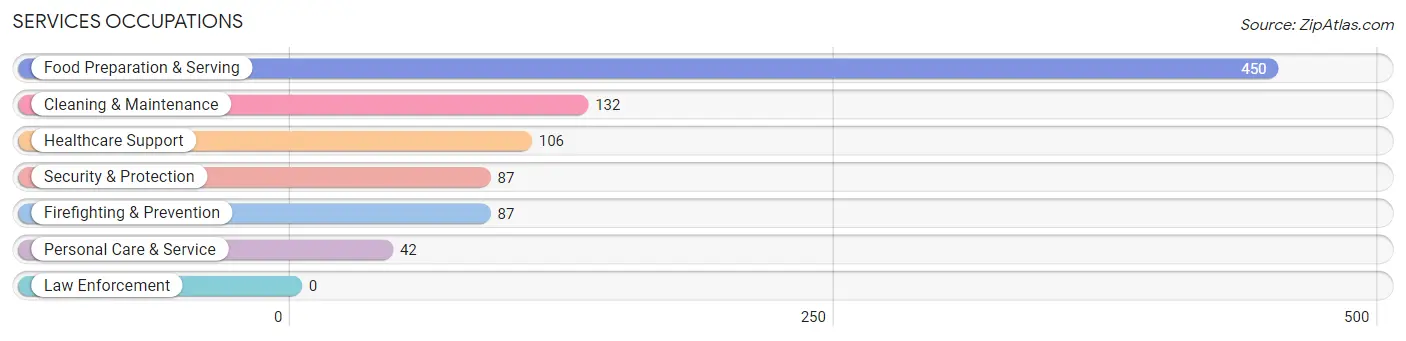
Services Occupations
The most common Services occupations in Lancaster are Food Preparation & Serving (450 | 13.3%), Cleaning & Maintenance (132 | 3.9%), Healthcare Support (106 | 3.1%), Security & Protection (87 | 2.6%), and Firefighting & Prevention (87 | 2.6%).
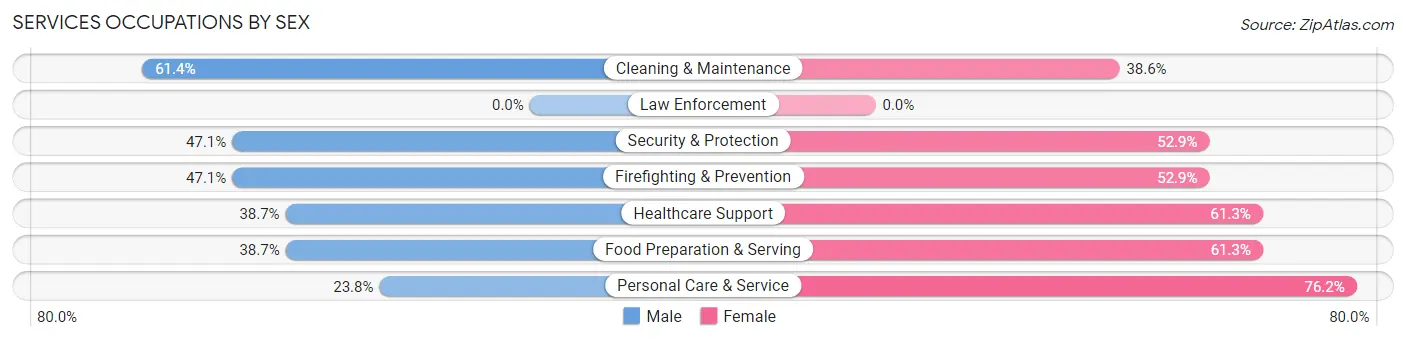
Services Occupations by Sex
Within the Services occupations in Lancaster, the most male-oriented occupations are Cleaning & Maintenance (61.4%), Security & Protection (47.1%), and Firefighting & Prevention (47.1%), while the most female-oriented occupations are Personal Care & Service (76.2%), Food Preparation & Serving (61.3%), and Healthcare Support (61.3%).
| Occupation | Male | Female |
| Healthcare Support | 41 (38.7%) | 65 (61.3%) |
| Security & Protection | 41 (47.1%) | 46 (52.9%) |
| Firefighting & Prevention | 41 (47.1%) | 46 (52.9%) |
| Law Enforcement | 0 (0.0%) | 0 (0.0%) |
| Food Preparation & Serving | 174 (38.7%) | 276 (61.3%) |
| Cleaning & Maintenance | 81 (61.4%) | 51 (38.6%) |
| Personal Care & Service | 10 (23.8%) | 32 (76.2%) |
| Total (Category) | 347 (42.5%) | 470 (57.5%) |
| Total (Overall) | 1,545 (45.8%) | 1,829 (54.2%) |
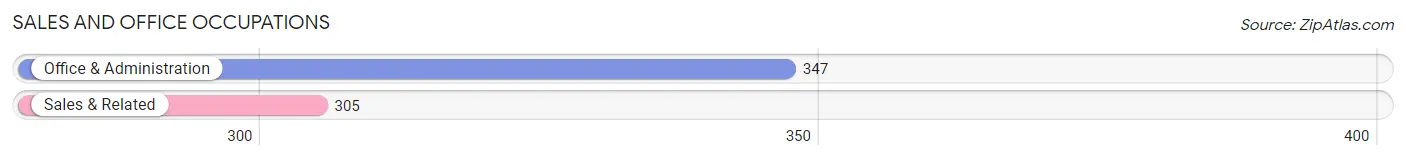
Sales and Office Occupations
The most common Sales and Office occupations in Lancaster are Office & Administration (347 | 10.3%), and Sales & Related (305 | 9.0%).
Sales and Office Occupations by Sex
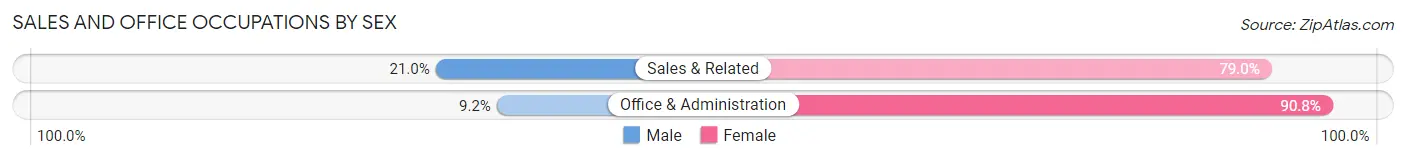
| Occupation | Male | Female |
| Sales & Related | 64 (21.0%) | 241 (79.0%) |
| Office & Administration | 32 (9.2%) | 315 (90.8%) |
| Total (Category) | 96 (14.7%) | 556 (85.3%) |
| Total (Overall) | 1,545 (45.8%) | 1,829 (54.2%) |
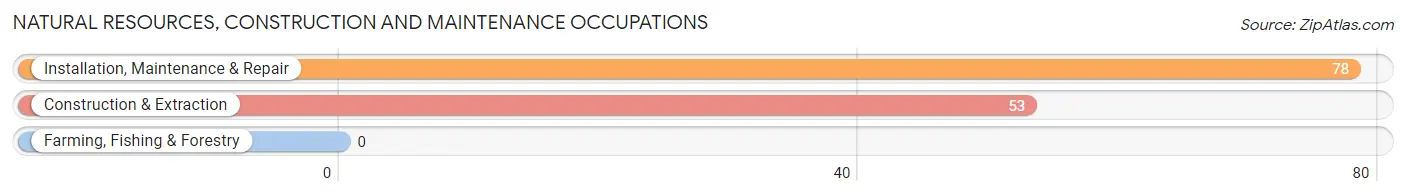
Natural Resources, Construction and Maintenance Occupations
The most common Natural Resources, Construction and Maintenance occupations in Lancaster are Installation, Maintenance & Repair (78 | 2.3%), and Construction & Extraction (53 | 1.6%).
Natural Resources, Construction and Maintenance Occupations by Sex
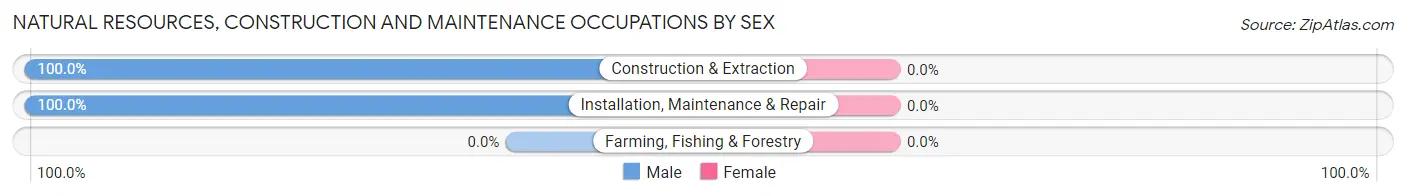
| Occupation | Male | Female |
| Farming, Fishing & Forestry | 0 (0.0%) | 0 (0.0%) |
| Construction & Extraction | 53 (100.0%) | 0 (0.0%) |
| Installation, Maintenance & Repair | 78 (100.0%) | 0 (0.0%) |
| Total (Category) | 131 (100.0%) | 0 (0.0%) |
| Total (Overall) | 1,545 (45.8%) | 1,829 (54.2%) |
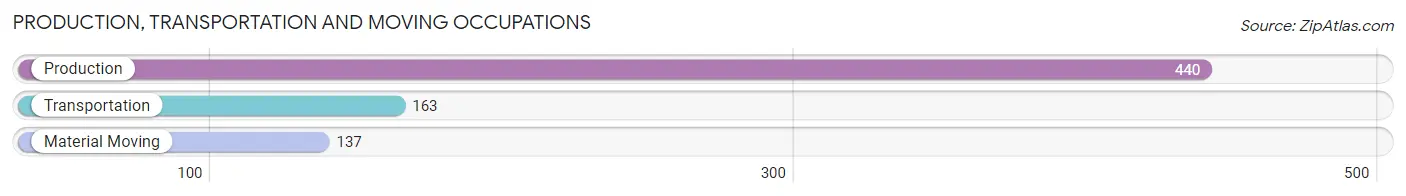
Production, Transportation and Moving Occupations
The most common Production, Transportation and Moving occupations in Lancaster are Production (440 | 13.0%), Transportation (163 | 4.8%), and Material Moving (137 | 4.1%).
Production, Transportation and Moving Occupations by Sex
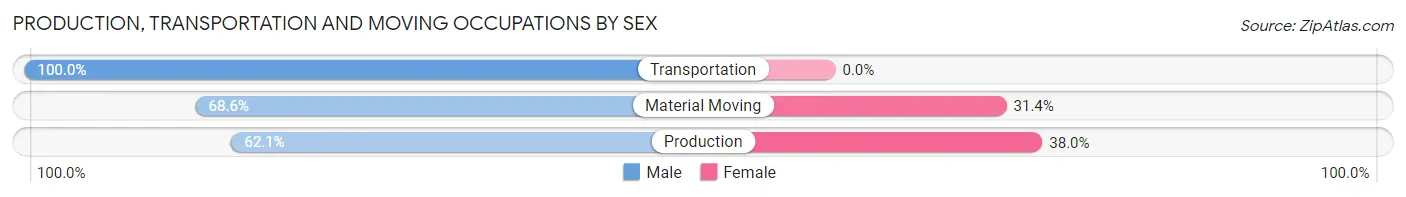
| Occupation | Male | Female |
| Production | 273 (62.1%) | 167 (38.0%) |
| Transportation | 163 (100.0%) | 0 (0.0%) |
| Material Moving | 94 (68.6%) | 43 (31.4%) |
| Total (Category) | 530 (71.6%) | 210 (28.4%) |
| Total (Overall) | 1,545 (45.8%) | 1,829 (54.2%) |
Employment Industries by Sex in Lancaster
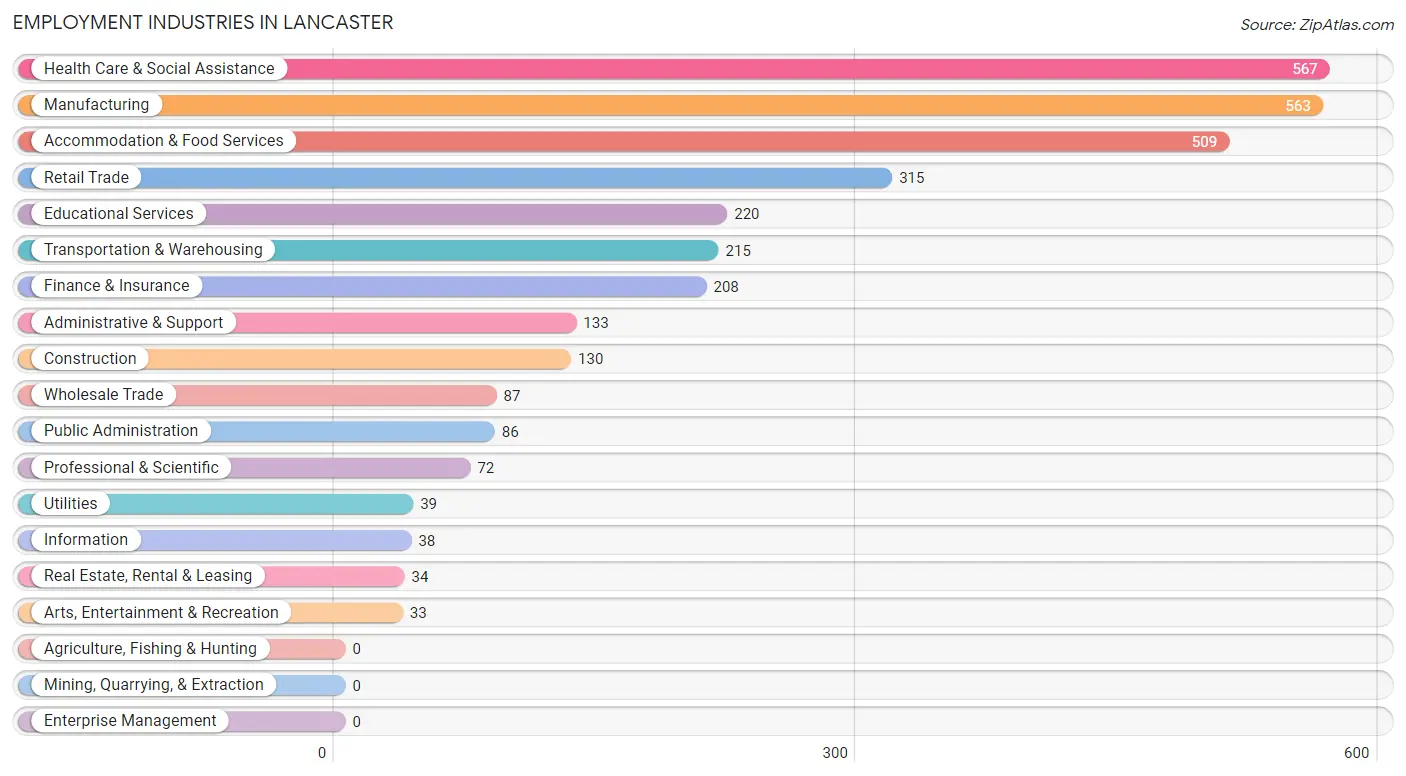
Employment Industries in Lancaster
The major employment industries in Lancaster include Health Care & Social Assistance (567 | 16.8%), Manufacturing (563 | 16.7%), Accommodation & Food Services (509 | 15.1%), Retail Trade (315 | 9.3%), and Educational Services (220 | 6.5%).
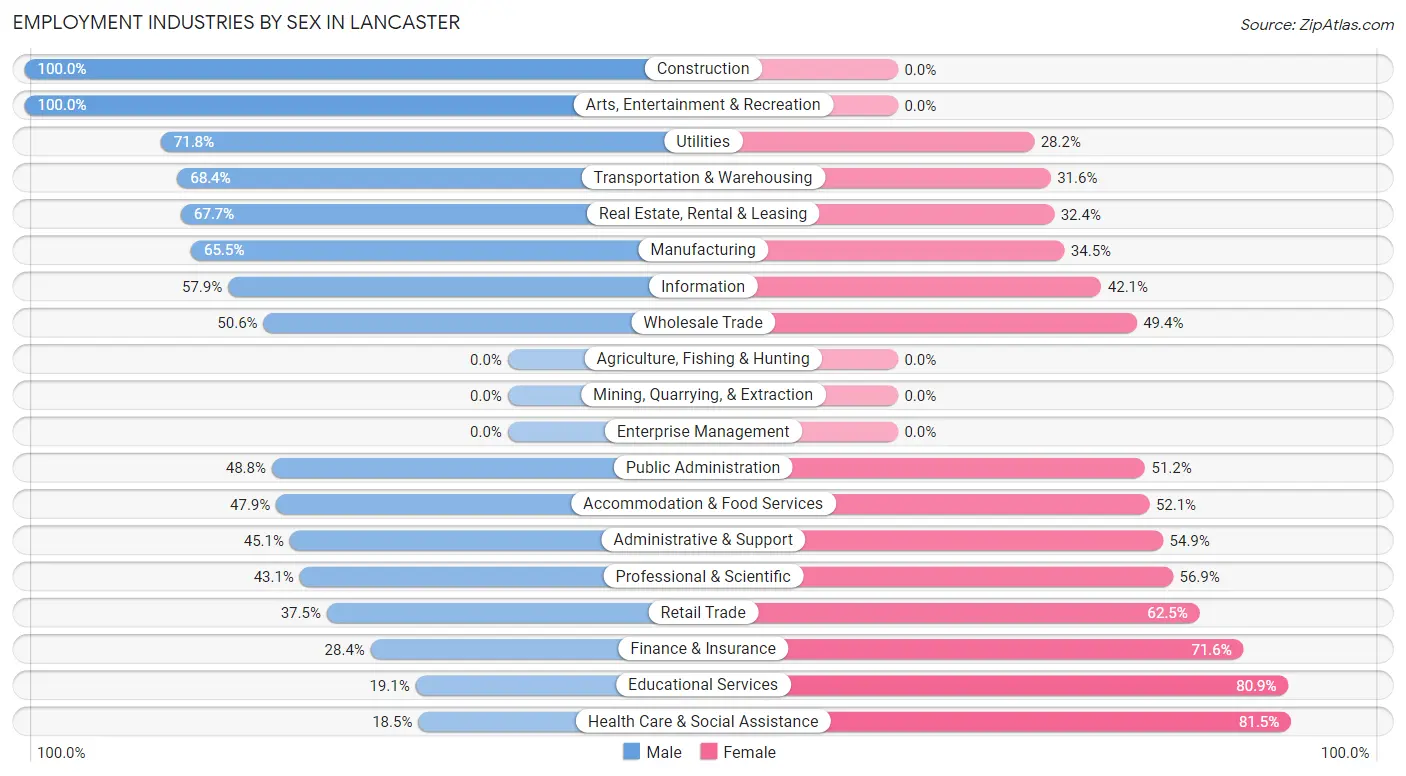
Employment Industries by Sex in Lancaster
The Lancaster industries that see more men than women are Construction (100.0%), Arts, Entertainment & Recreation (100.0%), and Utilities (71.8%), whereas the industries that tend to have a higher number of women are Health Care & Social Assistance (81.5%), Educational Services (80.9%), and Finance & Insurance (71.6%).
| Industry | Male | Female |
| Agriculture, Fishing & Hunting | 0 (0.0%) | 0 (0.0%) |
| Mining, Quarrying, & Extraction | 0 (0.0%) | 0 (0.0%) |
| Construction | 130 (100.0%) | 0 (0.0%) |
| Manufacturing | 369 (65.5%) | 194 (34.5%) |
| Wholesale Trade | 44 (50.6%) | 43 (49.4%) |
| Retail Trade | 118 (37.5%) | 197 (62.5%) |
| Transportation & Warehousing | 147 (68.4%) | 68 (31.6%) |
| Utilities | 28 (71.8%) | 11 (28.2%) |
| Information | 22 (57.9%) | 16 (42.1%) |
| Finance & Insurance | 59 (28.4%) | 149 (71.6%) |
| Real Estate, Rental & Leasing | 23 (67.6%) | 11 (32.4%) |
| Professional & Scientific | 31 (43.1%) | 41 (56.9%) |
| Enterprise Management | 0 (0.0%) | 0 (0.0%) |
| Administrative & Support | 60 (45.1%) | 73 (54.9%) |
| Educational Services | 42 (19.1%) | 178 (80.9%) |
| Health Care & Social Assistance | 105 (18.5%) | 462 (81.5%) |
| Arts, Entertainment & Recreation | 33 (100.0%) | 0 (0.0%) |
| Accommodation & Food Services | 244 (47.9%) | 265 (52.1%) |
| Public Administration | 42 (48.8%) | 44 (51.2%) |
| Total | 1,545 (45.8%) | 1,829 (54.2%) |
Education in Lancaster
School Enrollment in Lancaster
The most common levels of schooling among the 2,349 students in Lancaster are middle school (632 | 26.9%), high school (615 | 26.2%), and college / undergraduate (381 | 16.2%).
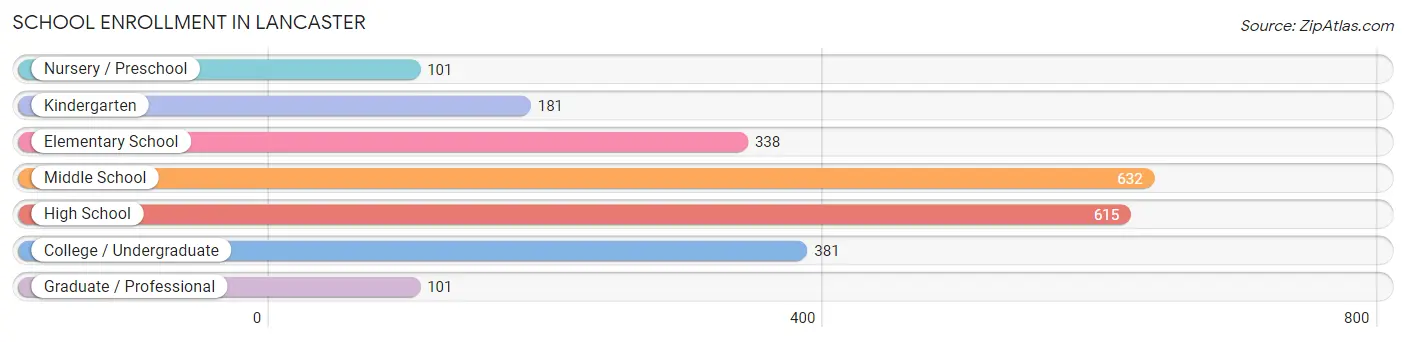
| School Level | # Students | % Students |
| Nursery / Preschool | 101 | 4.3% |
| Kindergarten | 181 | 7.7% |
| Elementary School | 338 | 14.4% |
| Middle School | 632 | 26.9% |
| High School | 615 | 26.2% |
| College / Undergraduate | 381 | 16.2% |
| Graduate / Professional | 101 | 4.3% |
| Total | 2,349 | 100.0% |
School Enrollment by Age by Funding Source in Lancaster
Out of a total of 2,349 students who are enrolled in schools in Lancaster, 183 (7.8%) attend a private institution, while the remaining 2,166 (92.2%) are enrolled in public schools. The age group of 25 to 34 year olds has the highest likelihood of being enrolled in private schools, with 43 (32.3% in the age bracket) enrolled. Conversely, the age group of 3 to 4 year olds has the lowest likelihood of being enrolled in a private school, with 60 (100.0% in the age bracket) attending a public institution.
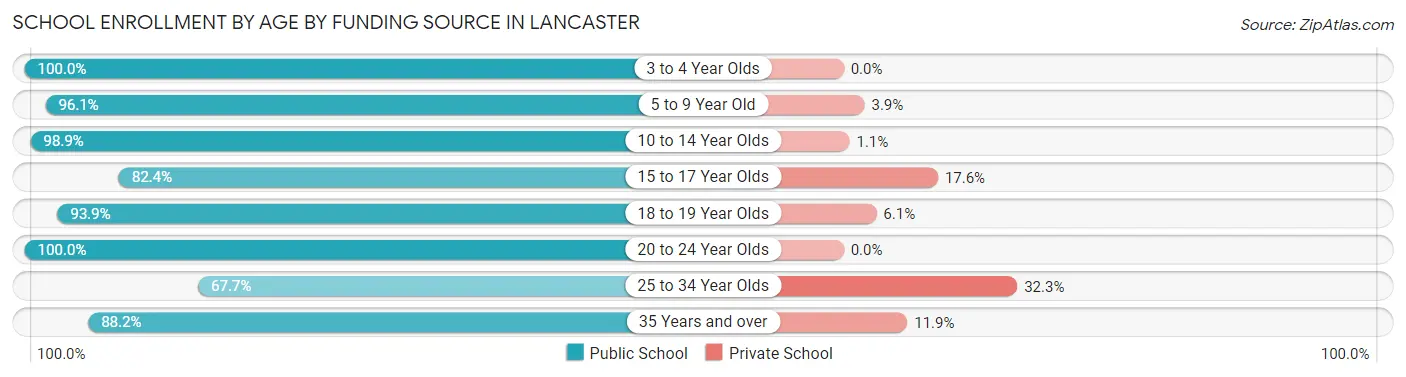
| Age Bracket | Public School | Private School |
| 3 to 4 Year Olds | 60 (100.0%) | 0 (0.0%) |
| 5 to 9 Year Old | 519 (96.1%) | 21 (3.9%) |
| 10 to 14 Year Olds | 727 (98.9%) | 8 (1.1%) |
| 15 to 17 Year Olds | 399 (82.4%) | 85 (17.6%) |
| 18 to 19 Year Olds | 154 (93.9%) | 10 (6.1%) |
| 20 to 24 Year Olds | 98 (100.0%) | 0 (0.0%) |
| 25 to 34 Year Olds | 90 (67.7%) | 43 (32.3%) |
| 35 Years and over | 119 (88.1%) | 16 (11.8%) |
| Total | 2,166 (92.2%) | 183 (7.8%) |
Educational Attainment by Field of Study in Lancaster
Business (248 | 25.4%), education (174 | 17.8%), science & technology (117 | 12.0%), social sciences (105 | 10.7%), and arts & humanities (63 | 6.4%) are the most common fields of study among 978 individuals in Lancaster who have obtained a bachelor's degree or higher.
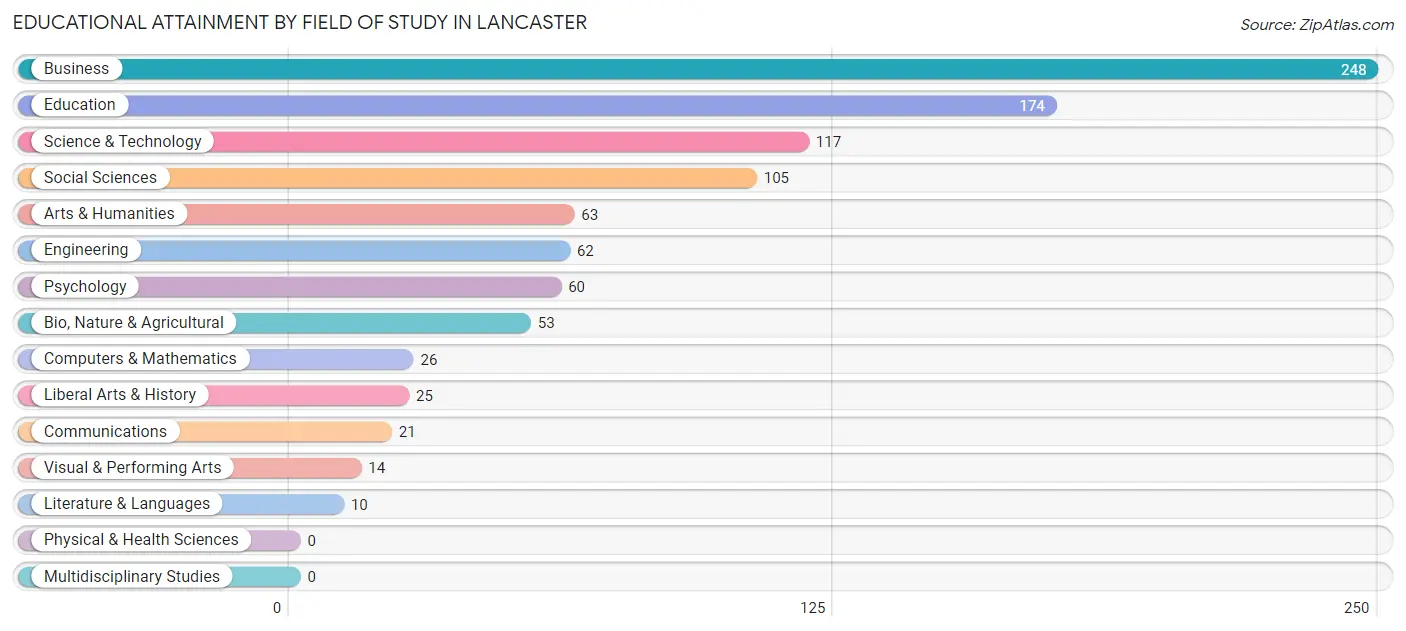
| Field of Study | # Graduates | % Graduates |
| Computers & Mathematics | 26 | 2.7% |
| Bio, Nature & Agricultural | 53 | 5.4% |
| Physical & Health Sciences | 0 | 0.0% |
| Psychology | 60 | 6.1% |
| Social Sciences | 105 | 10.7% |
| Engineering | 62 | 6.3% |
| Multidisciplinary Studies | 0 | 0.0% |
| Science & Technology | 117 | 12.0% |
| Business | 248 | 25.4% |
| Education | 174 | 17.8% |
| Literature & Languages | 10 | 1.0% |
| Liberal Arts & History | 25 | 2.6% |
| Visual & Performing Arts | 14 | 1.4% |
| Communications | 21 | 2.1% |
| Arts & Humanities | 63 | 6.4% |
| Total | 978 | 100.0% |
Transportation & Commute in Lancaster
Vehicle Availability by Sex in Lancaster
The most prevalent vehicle ownership categories in Lancaster are males with 2 vehicles (576, accounting for 37.9%) and females with 2 vehicles (460, making up 32.8%).
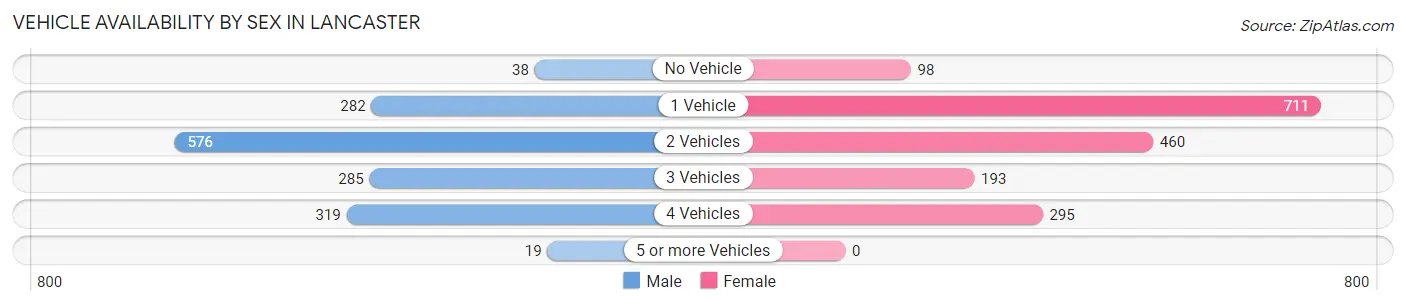
| Vehicles Available | Male | Female |
| No Vehicle | 38 (2.5%) | 98 (5.6%) |
| 1 Vehicle | 282 (18.6%) | 711 (40.5%) |
| 2 Vehicles | 576 (37.9%) | 460 (26.2%) |
| 3 Vehicles | 285 (18.8%) | 193 (11.0%) |
| 4 Vehicles | 319 (21.0%) | 295 (16.8%) |
| 5 or more Vehicles | 19 (1.3%) | 0 (0.0%) |
| Total | 1,519 (100.0%) | 1,757 (100.0%) |
Commute Time in Lancaster
The most frequently occuring commute durations in Lancaster are 30 to 34 minutes (548 commuters, 17.2%), 5 to 9 minutes (476 commuters, 14.9%), and 15 to 19 minutes (461 commuters, 14.5%).
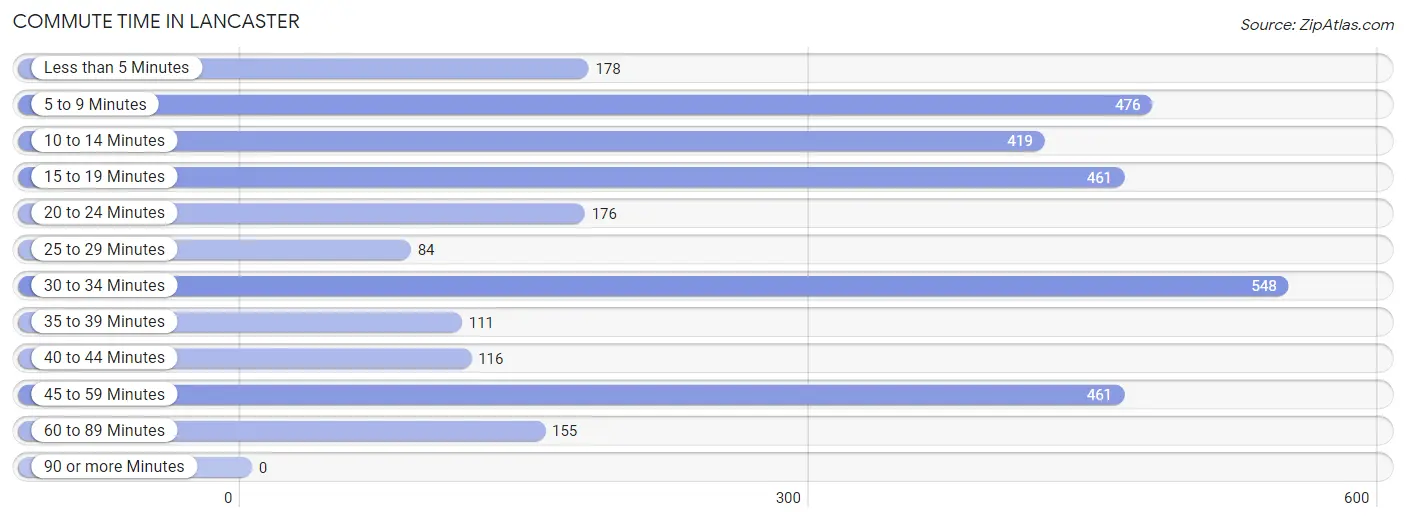
| Commute Time | # Commuters | % Commuters |
| Less than 5 Minutes | 178 | 5.6% |
| 5 to 9 Minutes | 476 | 14.9% |
| 10 to 14 Minutes | 419 | 13.2% |
| 15 to 19 Minutes | 461 | 14.5% |
| 20 to 24 Minutes | 176 | 5.5% |
| 25 to 29 Minutes | 84 | 2.6% |
| 30 to 34 Minutes | 548 | 17.2% |
| 35 to 39 Minutes | 111 | 3.5% |
| 40 to 44 Minutes | 116 | 3.6% |
| 45 to 59 Minutes | 461 | 14.5% |
| 60 to 89 Minutes | 155 | 4.9% |
| 90 or more Minutes | 0 | 0.0% |
Commute Time by Sex in Lancaster
The most common commute times in Lancaster are 45 to 59 minutes (305 commuters, 20.6%) for males and 30 to 34 minutes (312 commuters, 18.3%) for females.
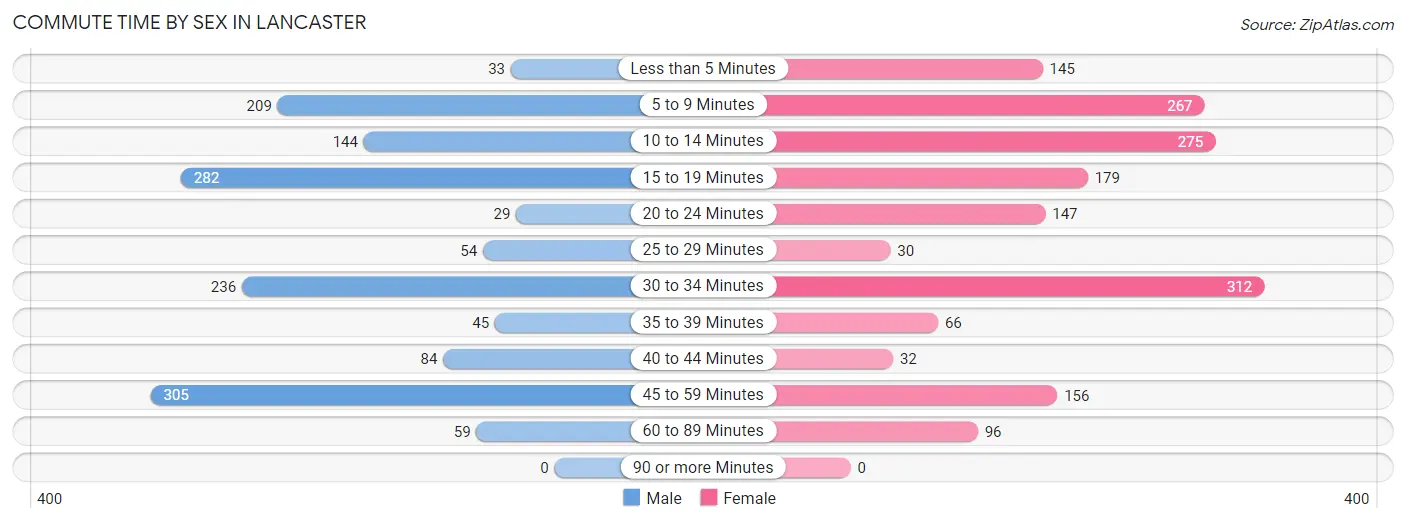
| Commute Time | Male | Female |
| Less than 5 Minutes | 33 (2.2%) | 145 (8.5%) |
| 5 to 9 Minutes | 209 (14.1%) | 267 (15.7%) |
| 10 to 14 Minutes | 144 (9.7%) | 275 (16.1%) |
| 15 to 19 Minutes | 282 (19.1%) | 179 (10.5%) |
| 20 to 24 Minutes | 29 (2.0%) | 147 (8.6%) |
| 25 to 29 Minutes | 54 (3.6%) | 30 (1.8%) |
| 30 to 34 Minutes | 236 (16.0%) | 312 (18.3%) |
| 35 to 39 Minutes | 45 (3.0%) | 66 (3.9%) |
| 40 to 44 Minutes | 84 (5.7%) | 32 (1.9%) |
| 45 to 59 Minutes | 305 (20.6%) | 156 (9.1%) |
| 60 to 89 Minutes | 59 (4.0%) | 96 (5.6%) |
| 90 or more Minutes | 0 (0.0%) | 0 (0.0%) |
Time of Departure to Work by Sex in Lancaster
The most frequent times of departure to work in Lancaster are 12:00 PM to 3:59 PM (201, 13.6%) for males and 6:30 AM to 6:59 AM (333, 19.5%) for females.
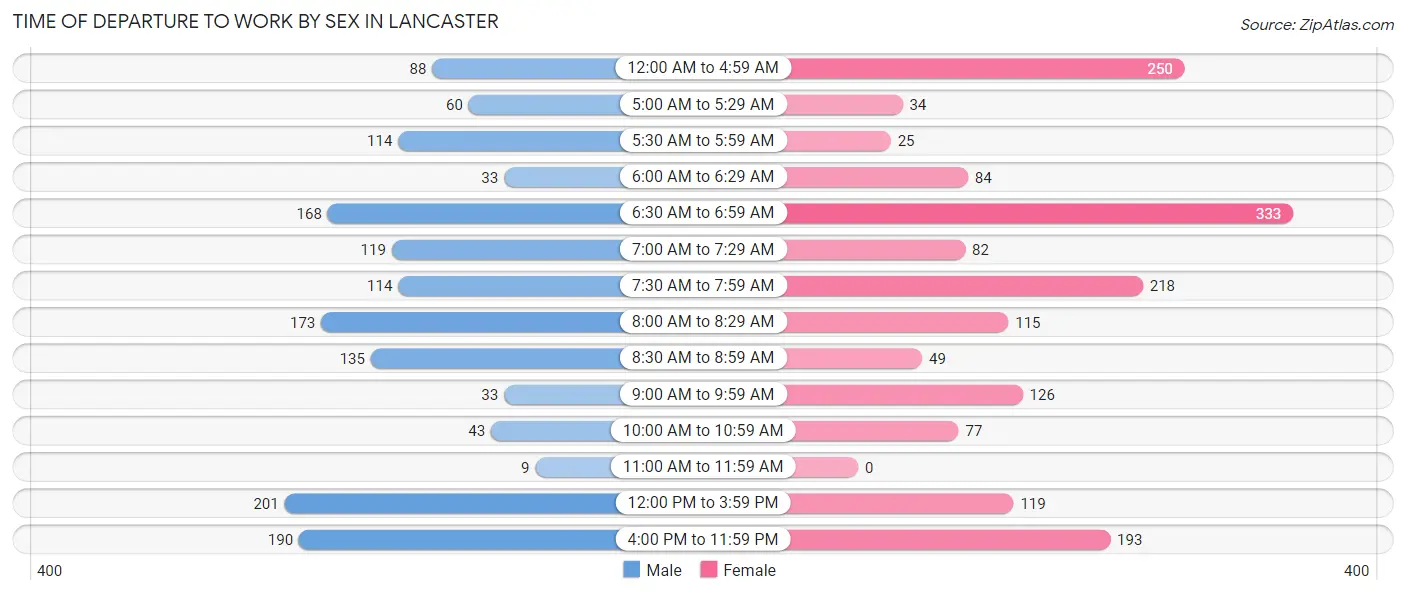
| Time of Departure | Male | Female |
| 12:00 AM to 4:59 AM | 88 (5.9%) | 250 (14.7%) |
| 5:00 AM to 5:29 AM | 60 (4.1%) | 34 (2.0%) |
| 5:30 AM to 5:59 AM | 114 (7.7%) | 25 (1.5%) |
| 6:00 AM to 6:29 AM | 33 (2.2%) | 84 (4.9%) |
| 6:30 AM to 6:59 AM | 168 (11.4%) | 333 (19.5%) |
| 7:00 AM to 7:29 AM | 119 (8.0%) | 82 (4.8%) |
| 7:30 AM to 7:59 AM | 114 (7.7%) | 218 (12.8%) |
| 8:00 AM to 8:29 AM | 173 (11.7%) | 115 (6.7%) |
| 8:30 AM to 8:59 AM | 135 (9.1%) | 49 (2.9%) |
| 9:00 AM to 9:59 AM | 33 (2.2%) | 126 (7.4%) |
| 10:00 AM to 10:59 AM | 43 (2.9%) | 77 (4.5%) |
| 11:00 AM to 11:59 AM | 9 (0.6%) | 0 (0.0%) |
| 12:00 PM to 3:59 PM | 201 (13.6%) | 119 (7.0%) |
| 4:00 PM to 11:59 PM | 190 (12.8%) | 193 (11.3%) |
| Total | 1,480 (100.0%) | 1,705 (100.0%) |
Housing Occupancy in Lancaster
Occupancy by Ownership in Lancaster
Of the total 3,211 dwellings in Lancaster, owner-occupied units account for 1,327 (41.3%), while renter-occupied units make up 1,884 (58.7%).
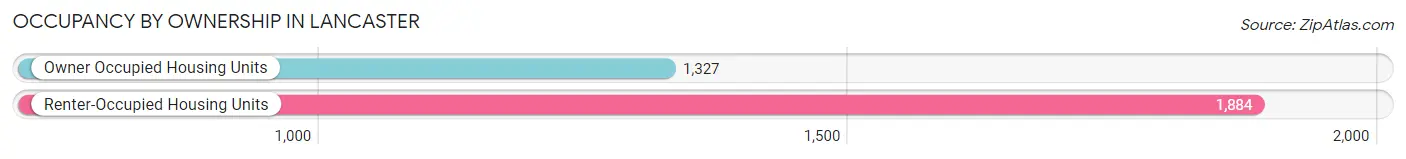
| Occupancy | # Housing Units | % Housing Units |
| Owner Occupied Housing Units | 1,327 | 41.3% |
| Renter-Occupied Housing Units | 1,884 | 58.7% |
| Total Occupied Housing Units | 3,211 | 100.0% |
Occupancy by Household Size in Lancaster
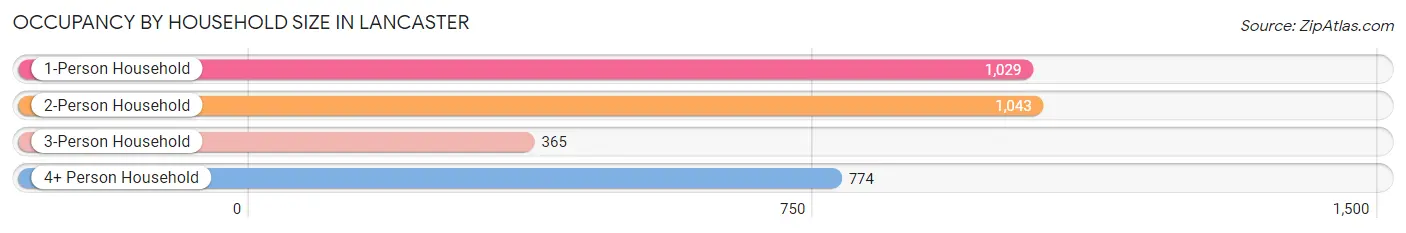
| Household Size | # Housing Units | % Housing Units |
| 1-Person Household | 1,029 | 32.1% |
| 2-Person Household | 1,043 | 32.5% |
| 3-Person Household | 365 | 11.4% |
| 4+ Person Household | 774 | 24.1% |
| Total Housing Units | 3,211 | 100.0% |
Occupancy by Ownership by Household Size in Lancaster
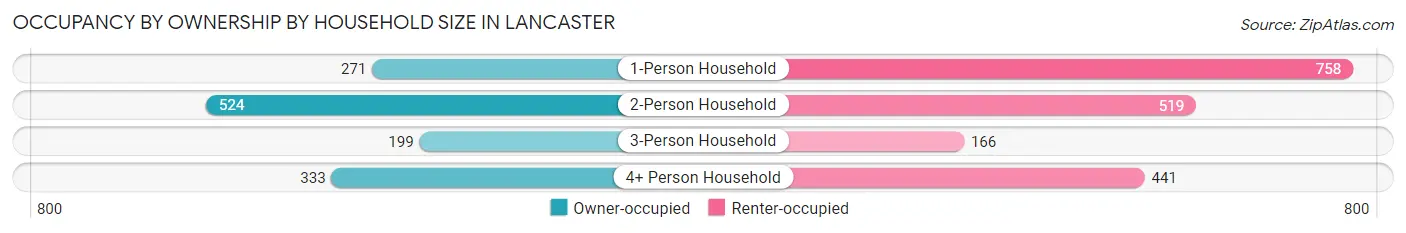
| Household Size | Owner-occupied | Renter-occupied |
| 1-Person Household | 271 (26.3%) | 758 (73.7%) |
| 2-Person Household | 524 (50.2%) | 519 (49.8%) |
| 3-Person Household | 199 (54.5%) | 166 (45.5%) |
| 4+ Person Household | 333 (43.0%) | 441 (57.0%) |
| Total Housing Units | 1,327 (41.3%) | 1,884 (58.7%) |
Occupancy by Educational Attainment in Lancaster
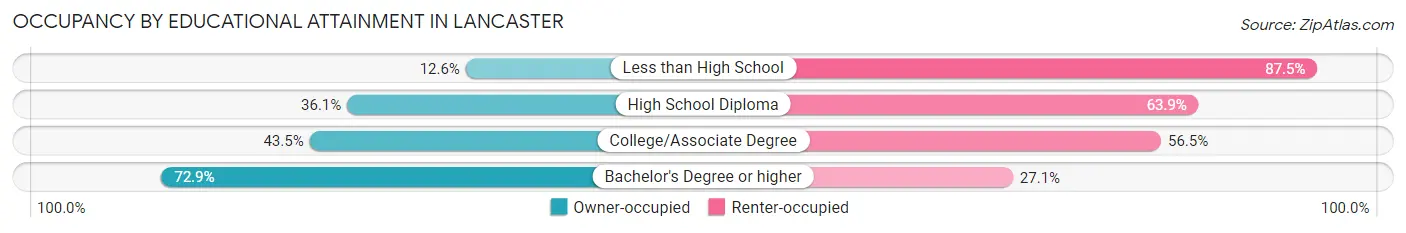
| Household Size | Owner-occupied | Renter-occupied |
| Less than High School | 65 (12.6%) | 453 (87.5%) |
| High School Diploma | 340 (36.1%) | 603 (63.9%) |
| College/Associate Degree | 524 (43.5%) | 680 (56.5%) |
| Bachelor's Degree or higher | 398 (72.9%) | 148 (27.1%) |
Occupancy by Age of Householder in Lancaster
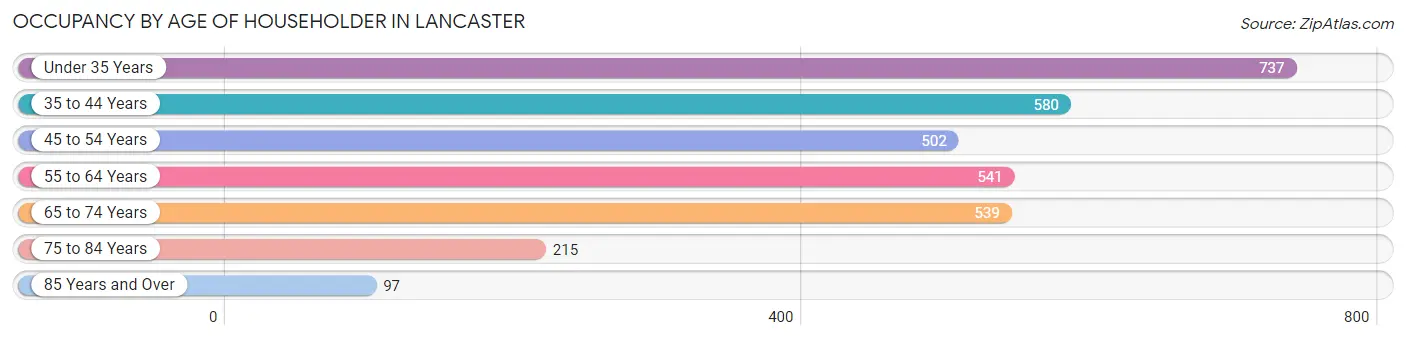
| Age Bracket | # Households | % Households |
| Under 35 Years | 737 | 23.0% |
| 35 to 44 Years | 580 | 18.1% |
| 45 to 54 Years | 502 | 15.6% |
| 55 to 64 Years | 541 | 16.9% |
| 65 to 74 Years | 539 | 16.8% |
| 75 to 84 Years | 215 | 6.7% |
| 85 Years and Over | 97 | 3.0% |
| Total | 3,211 | 100.0% |
Housing Finances in Lancaster
Median Income by Occupancy in Lancaster
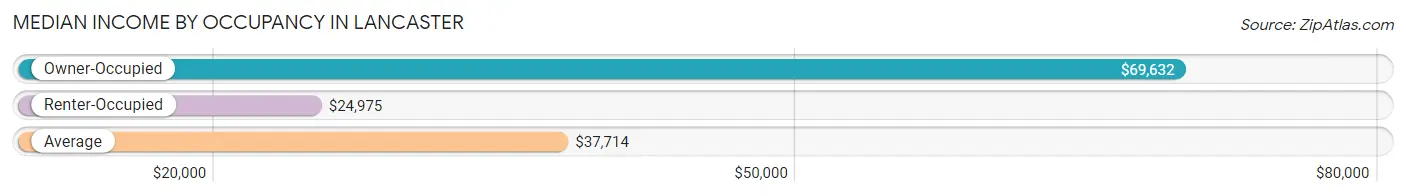
| Occupancy Type | # Households | Median Income |
| Owner-Occupied | 1,327 (41.3%) | $69,632 |
| Renter-Occupied | 1,884 (58.7%) | $24,975 |
| Average | 3,211 (100.0%) | $37,714 |
Occupancy by Householder Income Bracket in Lancaster
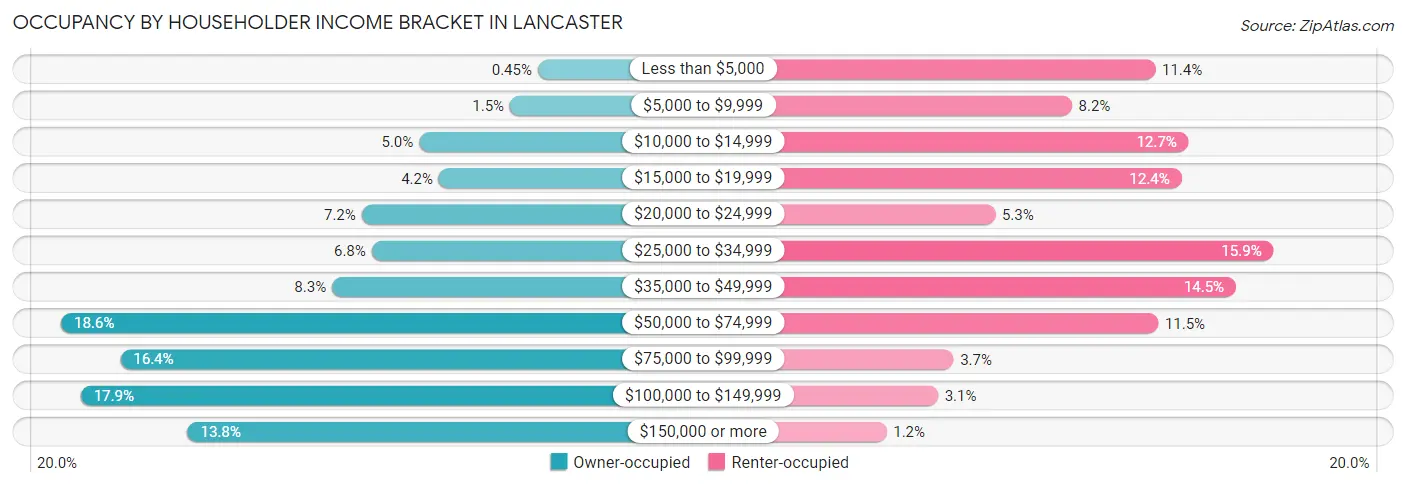
| Income Bracket | Owner-occupied | Renter-occupied |
| Less than $5,000 | 6 (0.4%) | 215 (11.4%) |
| $5,000 to $9,999 | 20 (1.5%) | 155 (8.2%) |
| $10,000 to $14,999 | 66 (5.0%) | 239 (12.7%) |
| $15,000 to $19,999 | 56 (4.2%) | 234 (12.4%) |
| $20,000 to $24,999 | 95 (7.2%) | 100 (5.3%) |
| $25,000 to $34,999 | 90 (6.8%) | 300 (15.9%) |
| $35,000 to $49,999 | 110 (8.3%) | 273 (14.5%) |
| $50,000 to $74,999 | 247 (18.6%) | 217 (11.5%) |
| $75,000 to $99,999 | 217 (16.4%) | 70 (3.7%) |
| $100,000 to $149,999 | 237 (17.9%) | 59 (3.1%) |
| $150,000 or more | 183 (13.8%) | 22 (1.2%) |
| Total | 1,327 (100.0%) | 1,884 (100.0%) |
Monthly Housing Cost Tiers in Lancaster
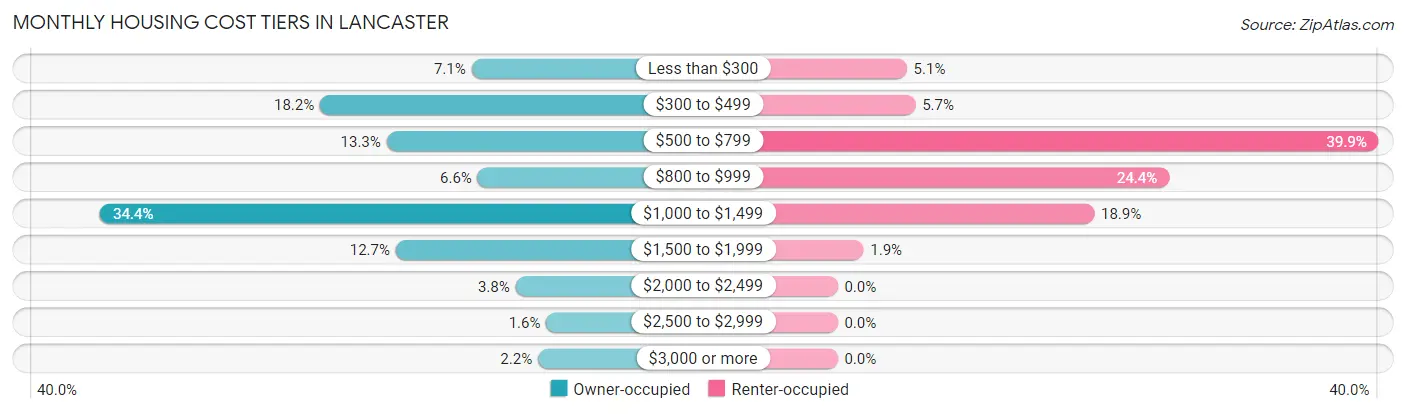
| Monthly Cost | Owner-occupied | Renter-occupied |
| Less than $300 | 94 (7.1%) | 96 (5.1%) |
| $300 to $499 | 242 (18.2%) | 108 (5.7%) |
| $500 to $799 | 177 (13.3%) | 751 (39.9%) |
| $800 to $999 | 88 (6.6%) | 460 (24.4%) |
| $1,000 to $1,499 | 457 (34.4%) | 356 (18.9%) |
| $1,500 to $1,999 | 168 (12.7%) | 36 (1.9%) |
| $2,000 to $2,499 | 51 (3.8%) | 0 (0.0%) |
| $2,500 to $2,999 | 21 (1.6%) | 0 (0.0%) |
| $3,000 or more | 29 (2.2%) | 0 (0.0%) |
| Total | 1,327 (100.0%) | 1,884 (100.0%) |
Physical Housing Characteristics in Lancaster
Housing Structures in Lancaster
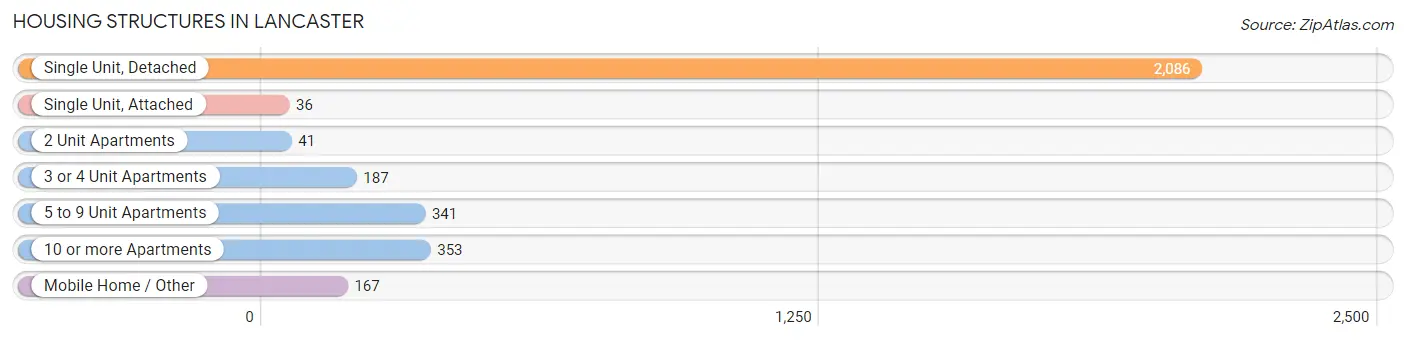
| Structure Type | # Housing Units | % Housing Units |
| Single Unit, Detached | 2,086 | 65.0% |
| Single Unit, Attached | 36 | 1.1% |
| 2 Unit Apartments | 41 | 1.3% |
| 3 or 4 Unit Apartments | 187 | 5.8% |
| 5 to 9 Unit Apartments | 341 | 10.6% |
| 10 or more Apartments | 353 | 11.0% |
| Mobile Home / Other | 167 | 5.2% |
| Total | 3,211 | 100.0% |
Housing Structures by Occupancy in Lancaster
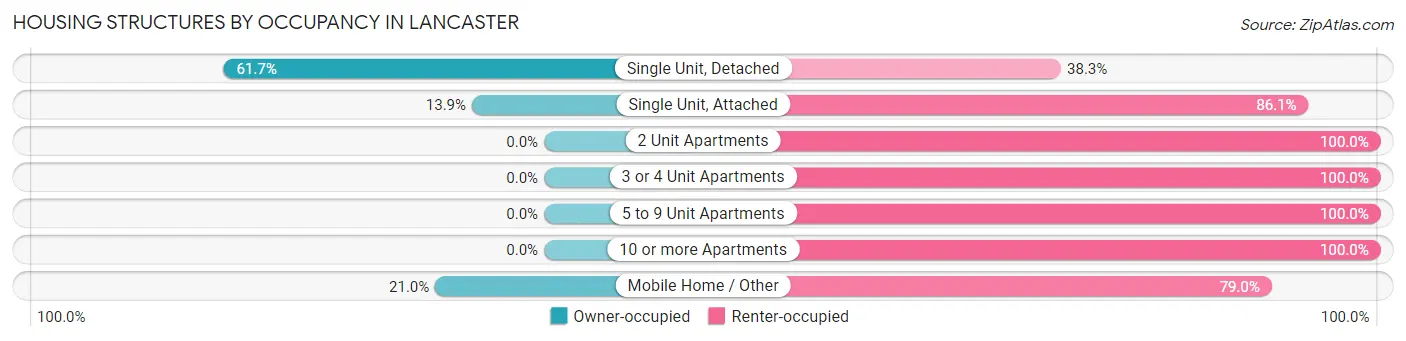
| Structure Type | Owner-occupied | Renter-occupied |
| Single Unit, Detached | 1,287 (61.7%) | 799 (38.3%) |
| Single Unit, Attached | 5 (13.9%) | 31 (86.1%) |
| 2 Unit Apartments | 0 (0.0%) | 41 (100.0%) |
| 3 or 4 Unit Apartments | 0 (0.0%) | 187 (100.0%) |
| 5 to 9 Unit Apartments | 0 (0.0%) | 341 (100.0%) |
| 10 or more Apartments | 0 (0.0%) | 353 (100.0%) |
| Mobile Home / Other | 35 (21.0%) | 132 (79.0%) |
| Total | 1,327 (41.3%) | 1,884 (58.7%) |
Housing Structures by Number of Rooms in Lancaster
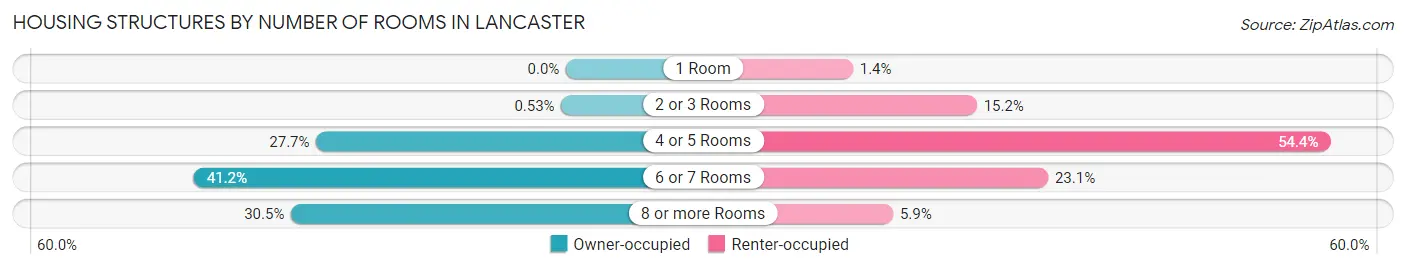
| Number of Rooms | Owner-occupied | Renter-occupied |
| 1 Room | 0 (0.0%) | 27 (1.4%) |
| 2 or 3 Rooms | 7 (0.5%) | 286 (15.2%) |
| 4 or 5 Rooms | 368 (27.7%) | 1,025 (54.4%) |
| 6 or 7 Rooms | 547 (41.2%) | 435 (23.1%) |
| 8 or more Rooms | 405 (30.5%) | 111 (5.9%) |
| Total | 1,327 (100.0%) | 1,884 (100.0%) |
Housing Structure by Heating Type in Lancaster
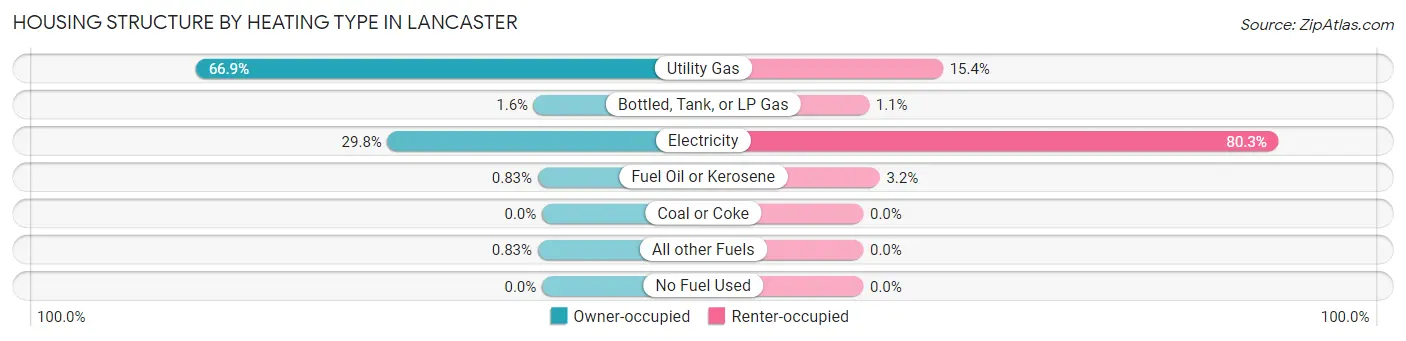
| Heating Type | Owner-occupied | Renter-occupied |
| Utility Gas | 888 (66.9%) | 290 (15.4%) |
| Bottled, Tank, or LP Gas | 21 (1.6%) | 21 (1.1%) |
| Electricity | 396 (29.8%) | 1,513 (80.3%) |
| Fuel Oil or Kerosene | 11 (0.8%) | 60 (3.2%) |
| Coal or Coke | 0 (0.0%) | 0 (0.0%) |
| All other Fuels | 11 (0.8%) | 0 (0.0%) |
| No Fuel Used | 0 (0.0%) | 0 (0.0%) |
| Total | 1,327 (100.0%) | 1,884 (100.0%) |
Household Vehicle Usage in Lancaster
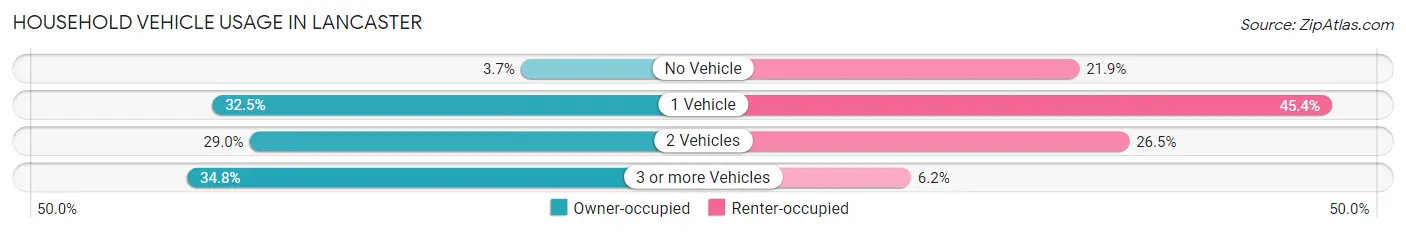
| Vehicles per Household | Owner-occupied | Renter-occupied |
| No Vehicle | 49 (3.7%) | 412 (21.9%) |
| 1 Vehicle | 431 (32.5%) | 856 (45.4%) |
| 2 Vehicles | 385 (29.0%) | 500 (26.5%) |
| 3 or more Vehicles | 462 (34.8%) | 116 (6.2%) |
| Total | 1,327 (100.0%) | 1,884 (100.0%) |
Real Estate & Mortgages in Lancaster
Real Estate and Mortgage Overview in Lancaster
| Characteristic | Without Mortgage | With Mortgage |
| Housing Units | 450 | 877 |
| Median Property Value | $139,600 | $232,800 |
| Median Household Income | $58,500 | $124 |
| Monthly Housing Costs | $392 | $29 |
| Real Estate Taxes | $863 | $30 |
Property Value by Mortgage Status in Lancaster
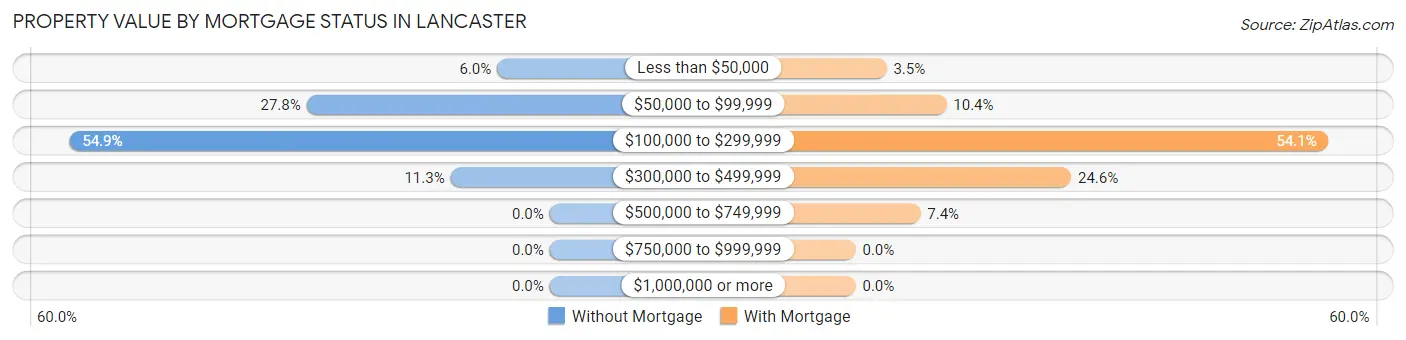
| Property Value | Without Mortgage | With Mortgage |
| Less than $50,000 | 27 (6.0%) | 31 (3.5%) |
| $50,000 to $99,999 | 125 (27.8%) | 91 (10.4%) |
| $100,000 to $299,999 | 247 (54.9%) | 474 (54.0%) |
| $300,000 to $499,999 | 51 (11.3%) | 216 (24.6%) |
| $500,000 to $749,999 | 0 (0.0%) | 65 (7.4%) |
| $750,000 to $999,999 | 0 (0.0%) | 0 (0.0%) |
| $1,000,000 or more | 0 (0.0%) | 0 (0.0%) |
| Total | 450 (100.0%) | 877 (100.0%) |
Household Income by Mortgage Status in Lancaster
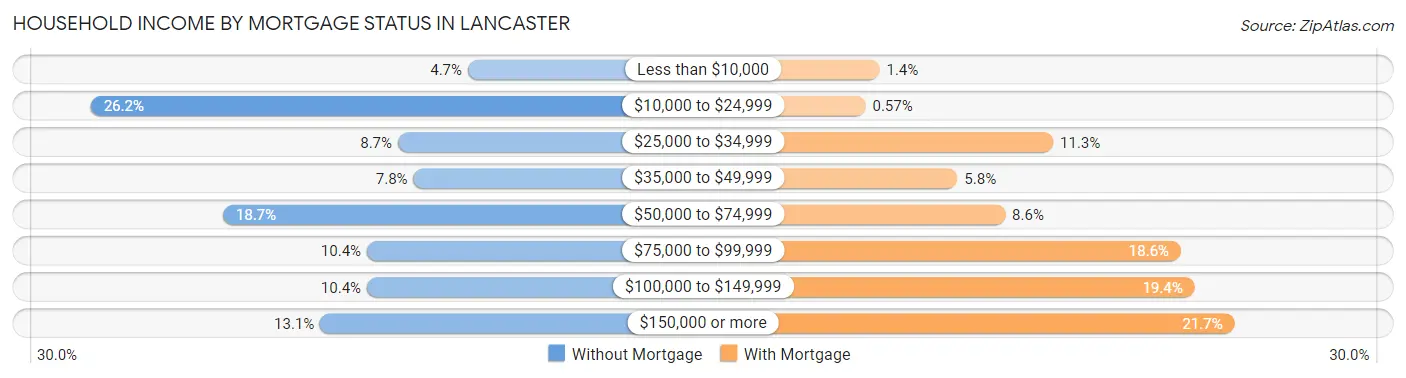
| Household Income | Without Mortgage | With Mortgage |
| Less than $10,000 | 21 (4.7%) | 12 (1.4%) |
| $10,000 to $24,999 | 118 (26.2%) | 5 (0.6%) |
| $25,000 to $34,999 | 39 (8.7%) | 99 (11.3%) |
| $35,000 to $49,999 | 35 (7.8%) | 51 (5.8%) |
| $50,000 to $74,999 | 84 (18.7%) | 75 (8.6%) |
| $75,000 to $99,999 | 47 (10.4%) | 163 (18.6%) |
| $100,000 to $149,999 | 47 (10.4%) | 170 (19.4%) |
| $150,000 or more | 59 (13.1%) | 190 (21.7%) |
| Total | 450 (100.0%) | 877 (100.0%) |
Property Value to Household Income Ratio in Lancaster
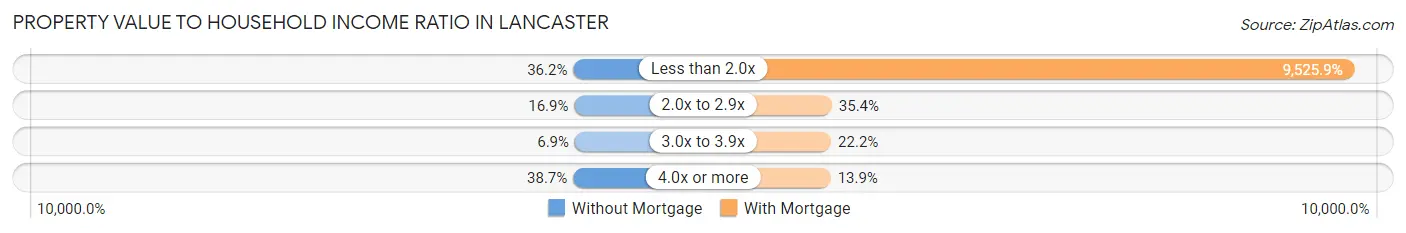
| Value-to-Income Ratio | Without Mortgage | With Mortgage |
| Less than 2.0x | 163 (36.2%) | 83,542 (9,525.9%) |
| 2.0x to 2.9x | 76 (16.9%) | 310 (35.3%) |
| 3.0x to 3.9x | 31 (6.9%) | 195 (22.2%) |
| 4.0x or more | 174 (38.7%) | 122 (13.9%) |
| Total | 450 (100.0%) | 877 (100.0%) |
Real Estate Taxes by Mortgage Status in Lancaster
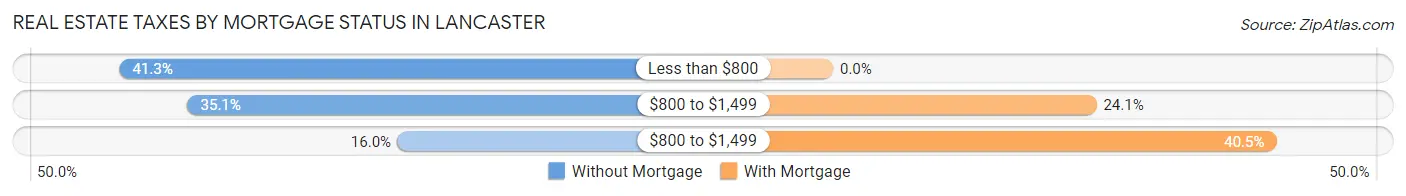
| Property Taxes | Without Mortgage | With Mortgage |
| Less than $800 | 186 (41.3%) | 0 (0.0%) |
| $800 to $1,499 | 158 (35.1%) | 211 (24.1%) |
| $800 to $1,499 | 72 (16.0%) | 355 (40.5%) |
| Total | 450 (100.0%) | 877 (100.0%) |
Health & Disability in Lancaster
Health Insurance Coverage by Age in Lancaster
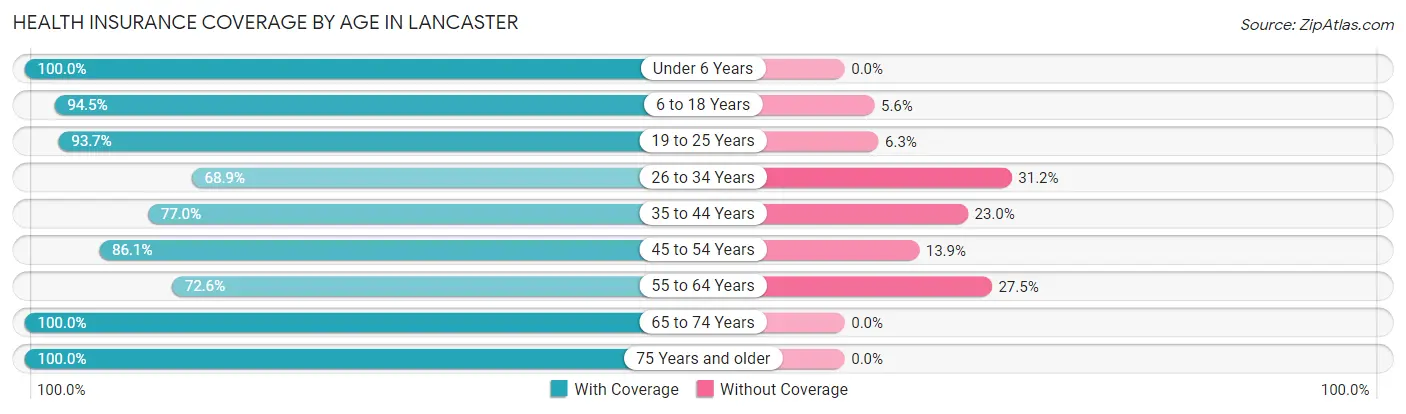
| Age Bracket | With Coverage | Without Coverage |
| Under 6 Years | 662 (100.0%) | 0 (0.0%) |
| 6 to 18 Years | 1,754 (94.5%) | 103 (5.6%) |
| 19 to 25 Years | 506 (93.7%) | 34 (6.3%) |
| 26 to 34 Years | 800 (68.9%) | 362 (31.1%) |
| 35 to 44 Years | 945 (77.0%) | 282 (23.0%) |
| 45 to 54 Years | 738 (86.1%) | 119 (13.9%) |
| 55 to 64 Years | 666 (72.6%) | 252 (27.5%) |
| 65 to 74 Years | 759 (100.0%) | 0 (0.0%) |
| 75 Years and older | 496 (100.0%) | 0 (0.0%) |
| Total | 7,326 (86.4%) | 1,152 (13.6%) |
Health Insurance Coverage by Citizenship Status in Lancaster
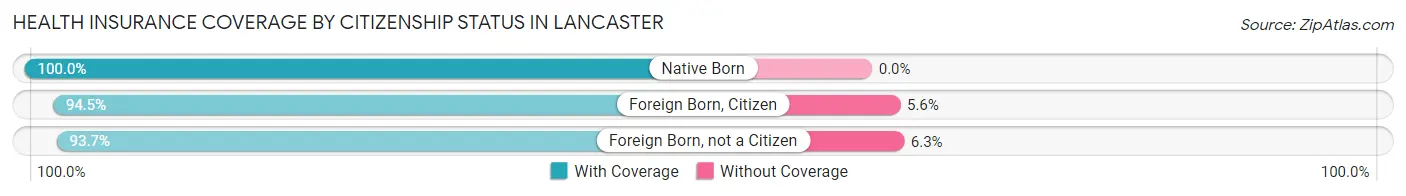
| Citizenship Status | With Coverage | Without Coverage |
| Native Born | 662 (100.0%) | 0 (0.0%) |
| Foreign Born, Citizen | 1,754 (94.5%) | 103 (5.6%) |
| Foreign Born, not a Citizen | 506 (93.7%) | 34 (6.3%) |
Health Insurance Coverage by Household Income in Lancaster
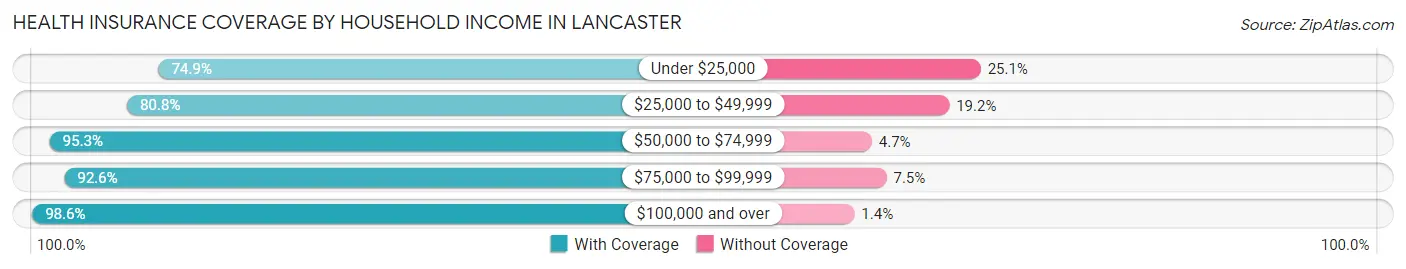
| Household Income | With Coverage | Without Coverage |
| Under $25,000 | 1,854 (74.9%) | 621 (25.1%) |
| $25,000 to $49,999 | 1,634 (80.8%) | 388 (19.2%) |
| $50,000 to $74,999 | 1,378 (95.3%) | 68 (4.7%) |
| $75,000 to $99,999 | 609 (92.5%) | 49 (7.4%) |
| $100,000 and over | 1,790 (98.6%) | 26 (1.4%) |
Public vs Private Health Insurance Coverage by Age in Lancaster
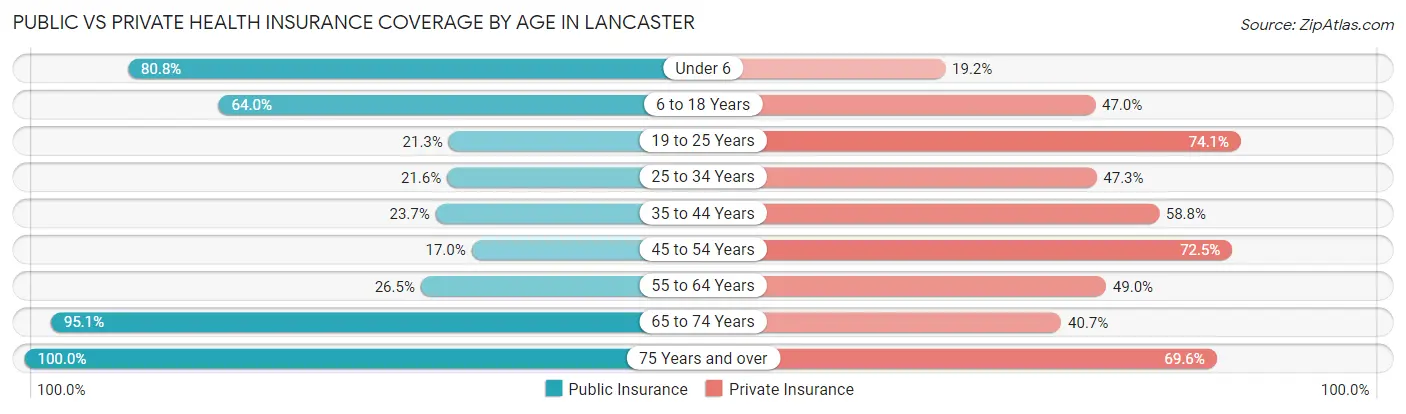
| Age Bracket | Public Insurance | Private Insurance |
| Under 6 | 535 (80.8%) | 127 (19.2%) |
| 6 to 18 Years | 1,188 (64.0%) | 873 (47.0%) |
| 19 to 25 Years | 115 (21.3%) | 400 (74.1%) |
| 25 to 34 Years | 251 (21.6%) | 549 (47.2%) |
| 35 to 44 Years | 291 (23.7%) | 722 (58.8%) |
| 45 to 54 Years | 146 (17.0%) | 621 (72.5%) |
| 55 to 64 Years | 243 (26.5%) | 450 (49.0%) |
| 65 to 74 Years | 722 (95.1%) | 309 (40.7%) |
| 75 Years and over | 496 (100.0%) | 345 (69.6%) |
| Total | 3,987 (47.0%) | 4,396 (51.8%) |
Disability Status by Sex by Age in Lancaster
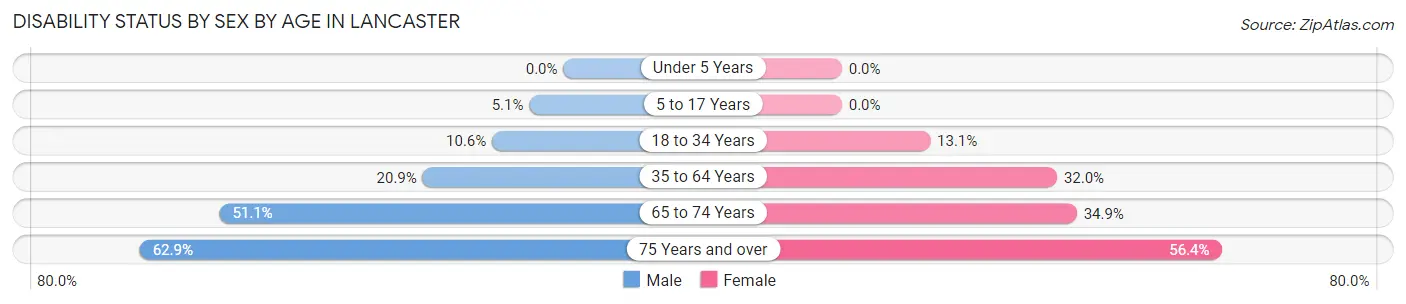
| Age Bracket | Male | Female |
| Under 5 Years | 0 (0.0%) | 0 (0.0%) |
| 5 to 17 Years | 48 (5.1%) | 0 (0.0%) |
| 18 to 34 Years | 90 (10.6%) | 136 (13.1%) |
| 35 to 64 Years | 269 (20.9%) | 548 (32.0%) |
| 65 to 74 Years | 168 (51.1%) | 150 (34.9%) |
| 75 Years and over | 139 (62.9%) | 155 (56.4%) |
Disability Class by Sex by Age in Lancaster
Disability Class: Hearing Difficulty
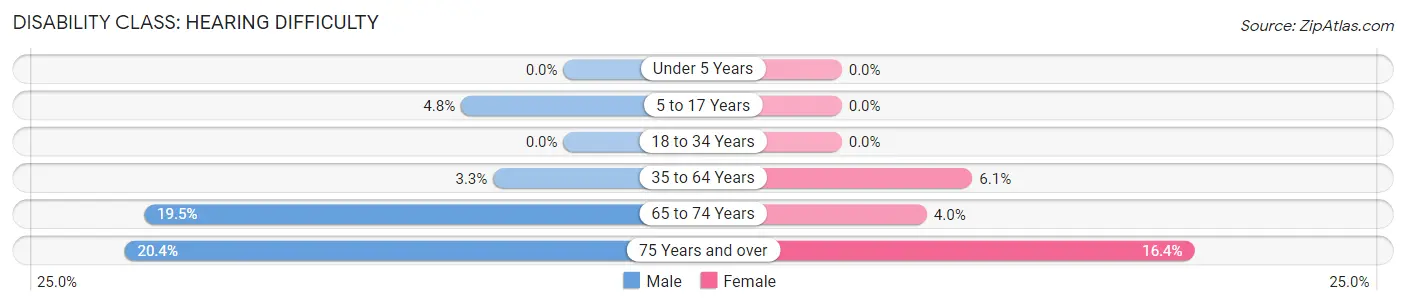
| Age Bracket | Male | Female |
| Under 5 Years | 0 (0.0%) | 0 (0.0%) |
| 5 to 17 Years | 45 (4.8%) | 0 (0.0%) |
| 18 to 34 Years | 0 (0.0%) | 0 (0.0%) |
| 35 to 64 Years | 42 (3.3%) | 104 (6.1%) |
| 65 to 74 Years | 64 (19.5%) | 17 (4.0%) |
| 75 Years and over | 45 (20.4%) | 45 (16.4%) |
Disability Class: Vision Difficulty
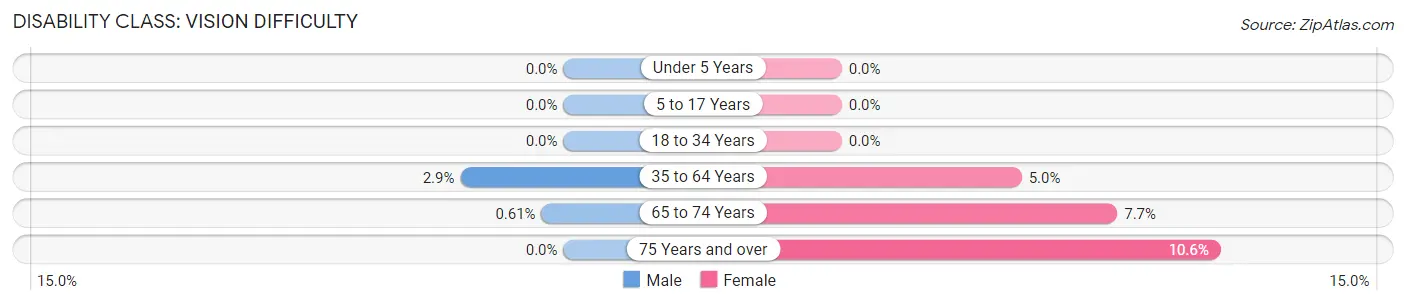
| Age Bracket | Male | Female |
| Under 5 Years | 0 (0.0%) | 0 (0.0%) |
| 5 to 17 Years | 0 (0.0%) | 0 (0.0%) |
| 18 to 34 Years | 0 (0.0%) | 0 (0.0%) |
| 35 to 64 Years | 37 (2.9%) | 86 (5.0%) |
| 65 to 74 Years | 2 (0.6%) | 33 (7.7%) |
| 75 Years and over | 0 (0.0%) | 29 (10.5%) |
Disability Class: Cognitive Difficulty
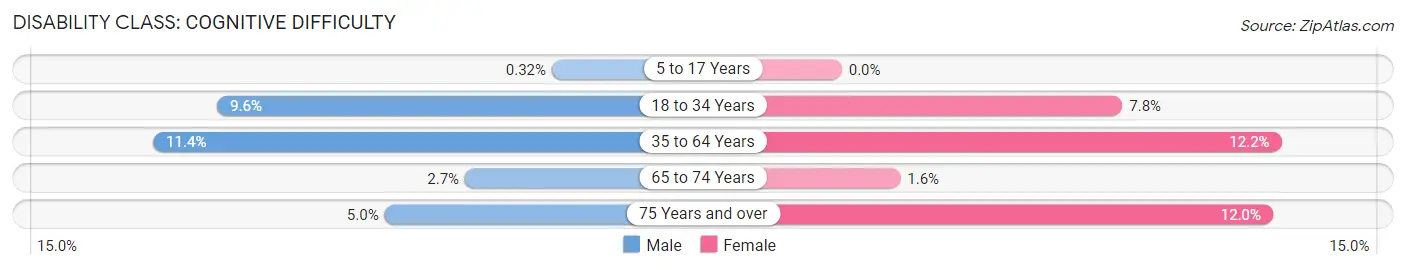
| Age Bracket | Male | Female |
| 5 to 17 Years | 3 (0.3%) | 0 (0.0%) |
| 18 to 34 Years | 82 (9.6%) | 81 (7.8%) |
| 35 to 64 Years | 147 (11.4%) | 210 (12.2%) |
| 65 to 74 Years | 9 (2.7%) | 7 (1.6%) |
| 75 Years and over | 11 (5.0%) | 33 (12.0%) |
Disability Class: Ambulatory Difficulty
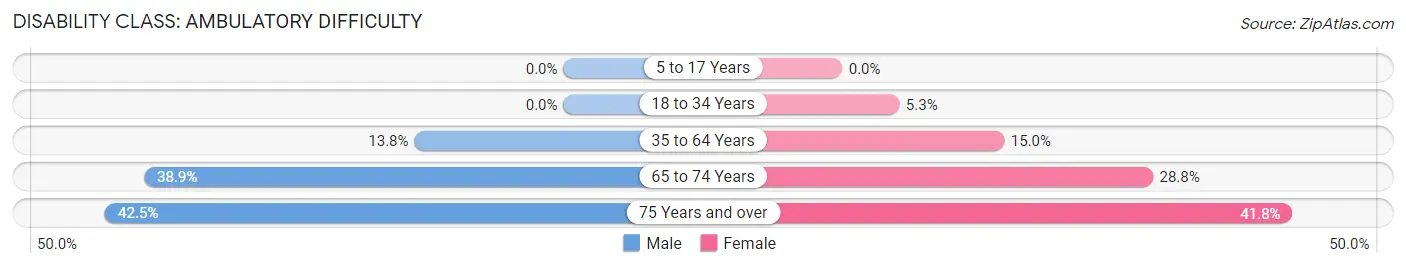
| Age Bracket | Male | Female |
| 5 to 17 Years | 0 (0.0%) | 0 (0.0%) |
| 18 to 34 Years | 0 (0.0%) | 55 (5.3%) |
| 35 to 64 Years | 178 (13.8%) | 258 (15.0%) |
| 65 to 74 Years | 128 (38.9%) | 124 (28.8%) |
| 75 Years and over | 94 (42.5%) | 115 (41.8%) |
Disability Class: Self-Care Difficulty
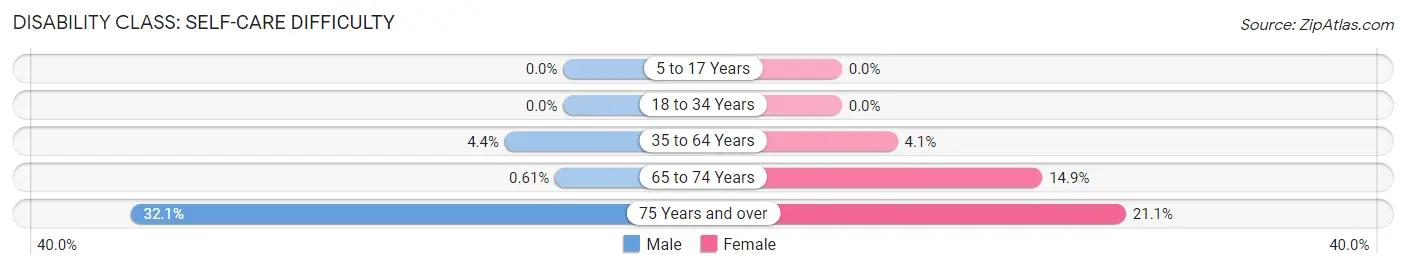
| Age Bracket | Male | Female |
| 5 to 17 Years | 0 (0.0%) | 0 (0.0%) |
| 18 to 34 Years | 0 (0.0%) | 0 (0.0%) |
| 35 to 64 Years | 56 (4.3%) | 71 (4.1%) |
| 65 to 74 Years | 2 (0.6%) | 64 (14.9%) |
| 75 Years and over | 71 (32.1%) | 58 (21.1%) |
Technology Access in Lancaster
Computing Device Access in Lancaster
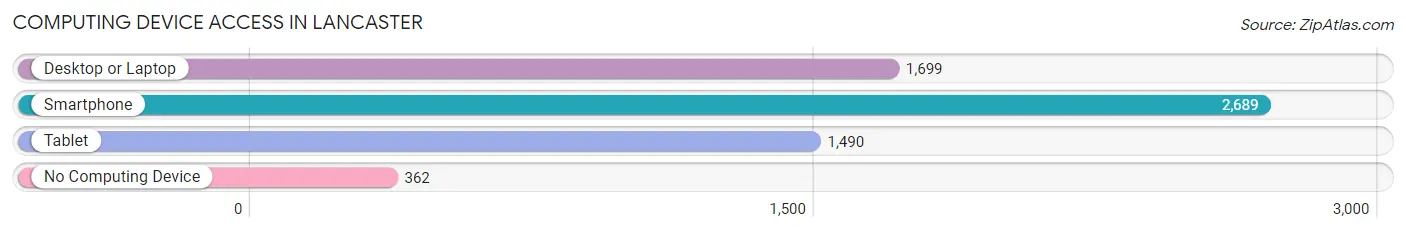
| Device Type | # Households | % Households |
| Desktop or Laptop | 1,699 | 52.9% |
| Smartphone | 2,689 | 83.7% |
| Tablet | 1,490 | 46.4% |
| No Computing Device | 362 | 11.3% |
| Total | 3,211 | 100.0% |
Internet Access in Lancaster
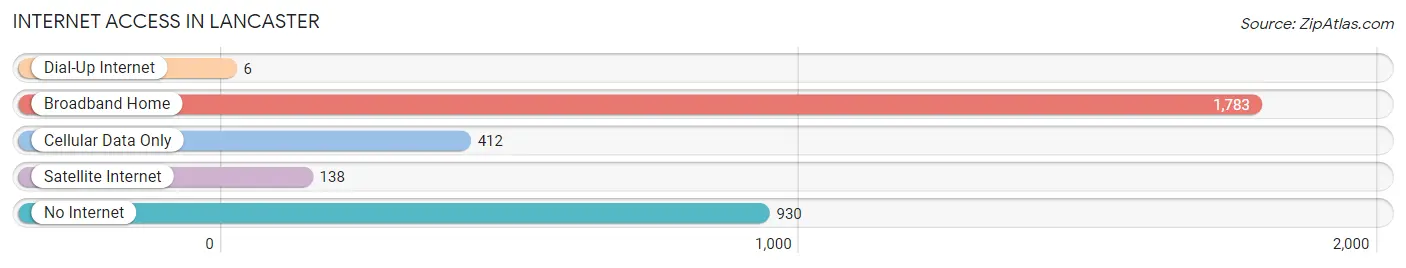
| Internet Type | # Households | % Households |
| Dial-Up Internet | 6 | 0.2% |
| Broadband Home | 1,783 | 55.5% |
| Cellular Data Only | 412 | 12.8% |
| Satellite Internet | 138 | 4.3% |
| No Internet | 930 | 29.0% |
| Total | 3,211 | 100.0% |
Lancaster Summary
Lancaster, South Carolina is a small city located in the northern part of the state, about 40 miles south of Charlotte, North Carolina. It is the county seat of Lancaster County and is part of the Charlotte metropolitan area. The city has a population of 8,529 as of the 2010 census.
History
Lancaster was founded in 1798 and named after the English city of Lancaster. The city was originally part of the Catawba Nation, a Native American tribe that inhabited the area. The city was incorporated in 1821 and was the first town in the state to be incorporated.
The city was an important trading center during the 19th century and was home to several cotton mills. The city was also the site of the first cotton mill in the state, which was built in 1845.
The city was also the site of the first railroad in the state, which was built in 1854. The railroad connected the city to Charlotte and other cities in the region.
The city was also the site of the first public school in the state which was established in 1856
Geography
Lancaster is located in northern South Carolina, about 40 miles south of Charlotte, North Carolina. The city is situated in the Piedmont region of the state and is located on the Catawba River. The city has a total area of 8.3 square miles, of which 8.2 square miles is land and 0.1 square miles is water.
The city has a humid subtropical climate, with hot, humid summers and mild winters. The average annual temperature is around 70 degrees Fahrenheit.
Economy
Lancaster’s economy is largely based on manufacturing and agriculture. The city is home to several manufacturing companies, including a paper mill, a textile mill, and a furniture factory. The city is also home to several agricultural businesses, including a poultry farm and a dairy farm.
The city is also home to several retail stores, restaurants, and other businesses. The city is also home to several educational institutions, including a community college and a technical college.
Demographics
As of the 2010 census, the population of Lancaster was 8,529. The racial makeup of the city was 68.3% White, 28.2% African American, 0.3% Native American, 0.7% Asian, 0.1% Pacific Islander, 0.7% from other races, and 1.9% from two or more races. Hispanic or Latino of any race were 2.2% of the population.
The median income for a household in the city was $33,906, and the median income for a family was $41,919. The per capita income for the city was $17,845. About 17.2% of families and 20.7% of the population were below the poverty line, including 28.2% of those under age 18 and 16.2% of those age 65 or over.
Common Questions
What is Per Capita Income in Lancaster?
Per Capita income in Lancaster is $25,845.
What is the Median Family Income in Lancaster?
Median Family Income in Lancaster is $49,126.
What is the Median Household income in Lancaster?
Median Household Income in Lancaster is $37,714.
What is Income or Wage Gap in Lancaster?
Income or Wage Gap in Lancaster is 16.6%.
Women in Lancaster earn 83.4 cents for every dollar earned by a man.
What is Inequality or Gini Index in Lancaster?
Inequality or Gini Index in Lancaster is 0.57.
What is the Total Population of Lancaster?
Total Population of Lancaster is 8,592.
What is the Total Male Population of Lancaster?
Total Male Population of Lancaster is 3,912.
What is the Total Female Population of Lancaster?
Total Female Population of Lancaster is 4,680.
What is the Ratio of Males per 100 Females in Lancaster?
There are 83.59 Males per 100 Females in Lancaster.
What is the Ratio of Females per 100 Males in Lancaster?
There are 119.63 Females per 100 Males in Lancaster.
What is the Median Population Age in Lancaster?
Median Population Age in Lancaster is 35.6 Years.
What is the Average Family Size in Lancaster
Average Family Size in Lancaster is 3.4 People.
What is the Average Household Size in Lancaster
Average Household Size in Lancaster is 2.6 People.
How Large is the Labor Force in Lancaster?
There are 3,917 People in the Labor Forcein in Lancaster.
What is the Percentage of People in the Labor Force in Lancaster?
59.2% of People are in the Labor Force in Lancaster.
What is the Unemployment Rate in Lancaster?
Unemployment Rate in Lancaster is 13.3%.