Murrells Inlet, SC Map & Demographics
Murrells Inlet Map
Murrells Inlet Overview
$59,521
PER CAPITA INCOME
$87,636
AVG FAMILY INCOME
$71,019
AVG HOUSEHOLD INCOME
49.3%
WAGE / INCOME GAP [ % ]
50.7¢/ $1
WAGE / INCOME GAP [ $ ]
$10,059
FAMILY INCOME DEFICIT
0.49
INEQUALITY / GINI INDEX
10,297
TOTAL POPULATION
5,291
MALE POPULATION
5,006
FEMALE POPULATION
105.69
MALES / 100 FEMALES
94.61
FEMALES / 100 MALES
60.2
MEDIAN AGE
2.6
AVG FAMILY SIZE
2.2
AVG HOUSEHOLD SIZE
4,595
LABOR FORCE [ PEOPLE ]
49.2%
PERCENT IN LABOR FORCE
3.1%
UNEMPLOYMENT RATE
Murrells Inlet Zip Codes
Murrells Inlet Area Codes
Income in Murrells Inlet
Income Overview in Murrells Inlet
Per Capita Income in Murrells Inlet is $59,521, while median incomes of families and households are $87,636 and $71,019 respectively.
| Characteristic | Number | Measure |
| Per Capita Income | 10,297 | $59,521 |
| Median Family Income | 3,191 | $87,636 |
| Mean Family Income | 3,191 | $134,113 |
| Median Household Income | 4,576 | $71,019 |
| Mean Household Income | 4,576 | $109,643 |
| Income Deficit | 3,191 | $10,059 |
| Wage / Income Gap (%) | 10,297 | 49.28% |
| Wage / Income Gap ($) | 10,297 | 50.72¢ per $1 |
| Gini / Inequality Index | 10,297 | 0.49 |
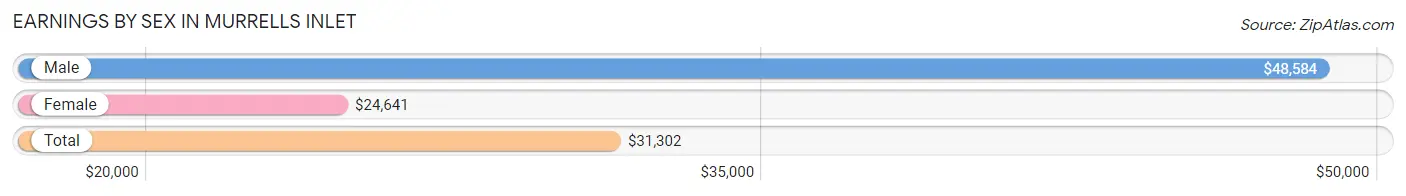
Earnings by Sex in Murrells Inlet
Average Earnings in Murrells Inlet are $31,302, $48,584 for men and $24,641 for women, a difference of 49.3%.
| Sex | Number | Average Earnings |
| Male | 2,779 (55.0%) | $48,584 |
| Female | 2,269 (45.0%) | $24,641 |
| Total | 5,048 (100.0%) | $31,302 |
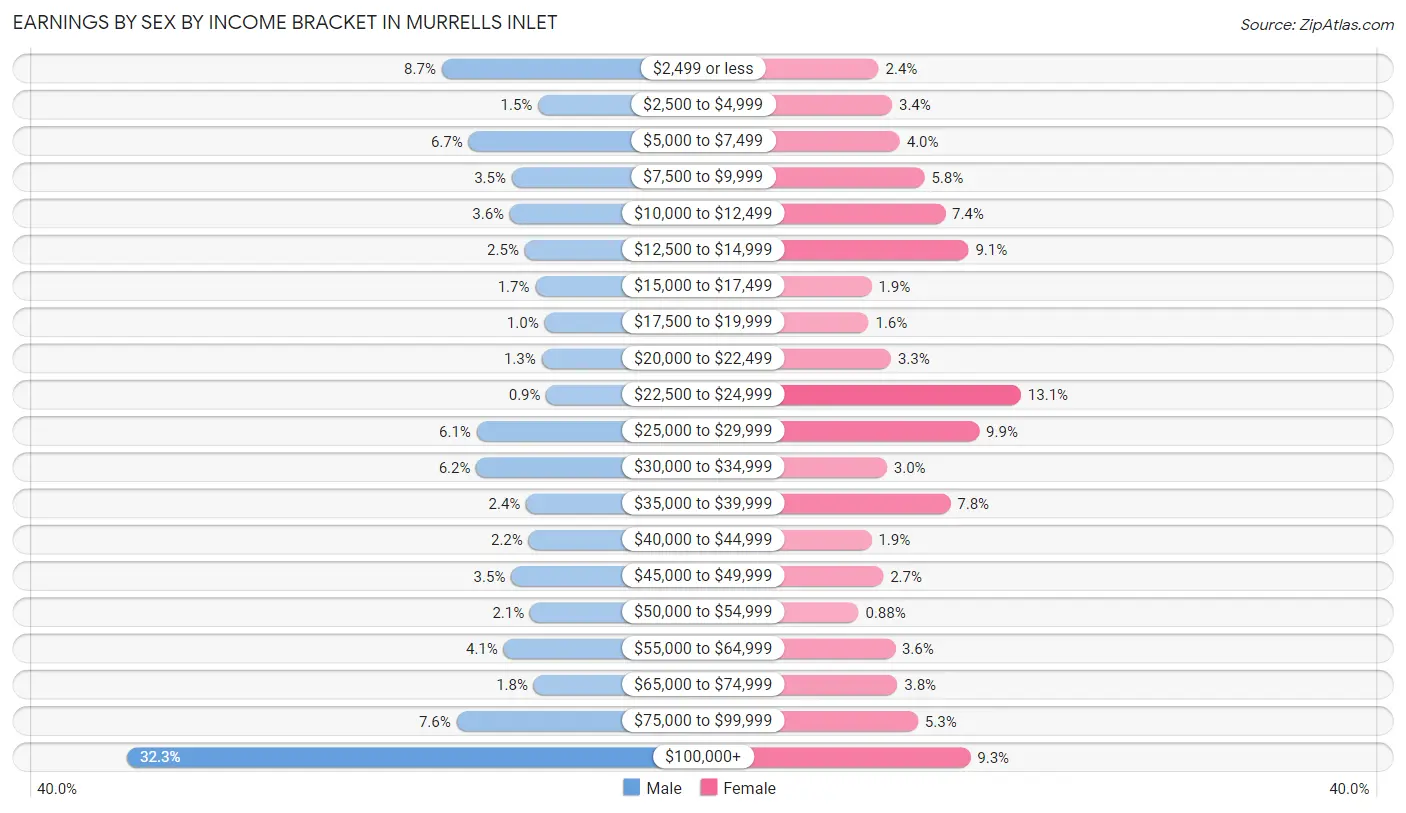
Earnings by Sex by Income Bracket in Murrells Inlet
The most common earnings brackets in Murrells Inlet are $100,000+ for men (898 | 32.3%) and $22,500 to $24,999 for women (296 | 13.1%).
| Income | Male | Female |
| $2,499 or less | 243 (8.7%) | 54 (2.4%) |
| $2,500 to $4,999 | 42 (1.5%) | 77 (3.4%) |
| $5,000 to $7,499 | 187 (6.7%) | 90 (4.0%) |
| $7,500 to $9,999 | 97 (3.5%) | 132 (5.8%) |
| $10,000 to $12,499 | 101 (3.6%) | 167 (7.4%) |
| $12,500 to $14,999 | 70 (2.5%) | 207 (9.1%) |
| $15,000 to $17,499 | 48 (1.7%) | 42 (1.8%) |
| $17,500 to $19,999 | 29 (1.0%) | 37 (1.6%) |
| $20,000 to $22,499 | 35 (1.3%) | 75 (3.3%) |
| $22,500 to $24,999 | 25 (0.9%) | 296 (13.1%) |
| $25,000 to $29,999 | 170 (6.1%) | 225 (9.9%) |
| $30,000 to $34,999 | 171 (6.1%) | 68 (3.0%) |
| $35,000 to $39,999 | 67 (2.4%) | 176 (7.8%) |
| $40,000 to $44,999 | 62 (2.2%) | 42 (1.8%) |
| $45,000 to $49,999 | 98 (3.5%) | 62 (2.7%) |
| $50,000 to $54,999 | 59 (2.1%) | 20 (0.9%) |
| $55,000 to $64,999 | 114 (4.1%) | 82 (3.6%) |
| $65,000 to $74,999 | 51 (1.8%) | 86 (3.8%) |
| $75,000 to $99,999 | 212 (7.6%) | 121 (5.3%) |
| $100,000+ | 898 (32.3%) | 210 (9.3%) |
| Total | 2,779 (100.0%) | 2,269 (100.0%) |
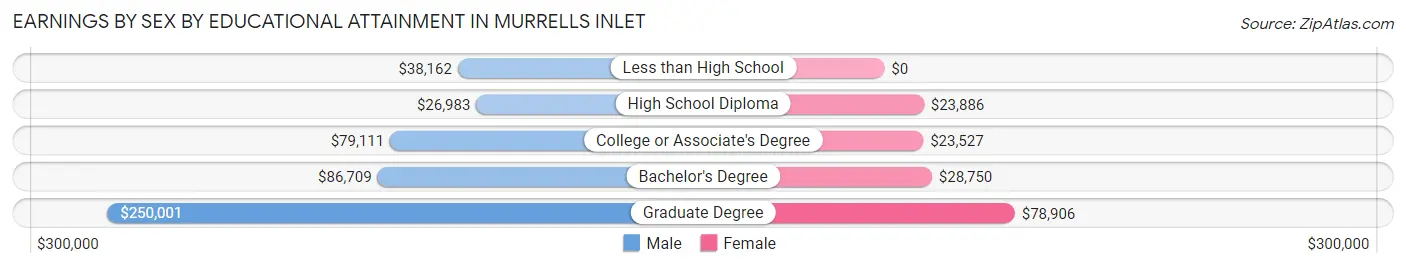
Earnings by Sex by Educational Attainment in Murrells Inlet
Average earnings in Murrells Inlet are $58,184 for men and $25,348 for women, a difference of 56.4%. Men with an educational attainment of graduate degree enjoy the highest average annual earnings of $250,001, while those with high school diploma education earn the least with $26,983. Women with an educational attainment of graduate degree earn the most with the average annual earnings of $78,906, while those with college or associate's degree education have the smallest earnings of $23,527.
| Educational Attainment | Male Income | Female Income |
| Less than High School | $38,162 | $0 |
| High School Diploma | $26,983 | $23,886 |
| College or Associate's Degree | $79,111 | $23,527 |
| Bachelor's Degree | $86,709 | $28,750 |
| Graduate Degree | $250,001 | $78,906 |
| Total | $58,184 | $25,348 |
Family Income in Murrells Inlet
Family Income Brackets in Murrells Inlet
According to the Murrells Inlet family income data, there are 641 families falling into the $100,000 to $149,999 income range, which is the most common income bracket and makes up 20.1% of all families.
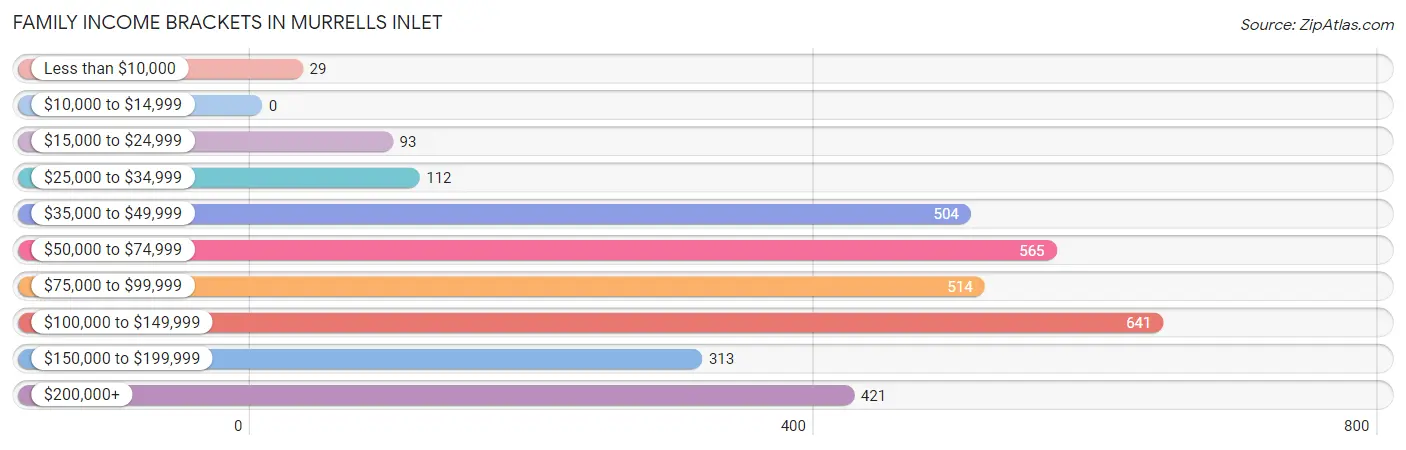
| Income Bracket | # Families | % Families |
| Less than $10,000 | 29 | 0.9% |
| $10,000 to $14,999 | 0 | 0.0% |
| $15,000 to $24,999 | 93 | 2.9% |
| $25,000 to $34,999 | 112 | 3.5% |
| $35,000 to $49,999 | 504 | 15.8% |
| $50,000 to $74,999 | 565 | 17.7% |
| $75,000 to $99,999 | 514 | 16.1% |
| $100,000 to $149,999 | 641 | 20.1% |
| $150,000 to $199,999 | 313 | 9.8% |
| $200,000+ | 421 | 13.2% |
Family Income by Famaliy Size in Murrells Inlet
4-person families (298 | 9.3%) account for the highest median family income in Murrells Inlet with $124,091 per family, while 2-person families (2,270 | 71.1%) have the highest median income of $43,106 per family member.
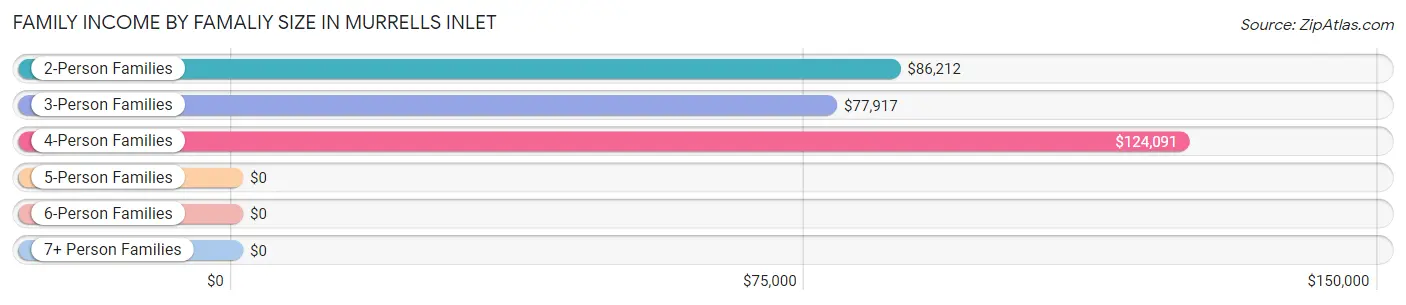
| Income Bracket | # Families | Median Income |
| 2-Person Families | 2,270 (71.1%) | $86,212 |
| 3-Person Families | 576 (18.0%) | $77,917 |
| 4-Person Families | 298 (9.3%) | $124,091 |
| 5-Person Families | 28 (0.9%) | $0 |
| 6-Person Families | 19 (0.6%) | $0 |
| 7+ Person Families | 0 (0.0%) | $0 |
| Total | 3,191 (100.0%) | $87,636 |
Family Income by Number of Earners in Murrells Inlet
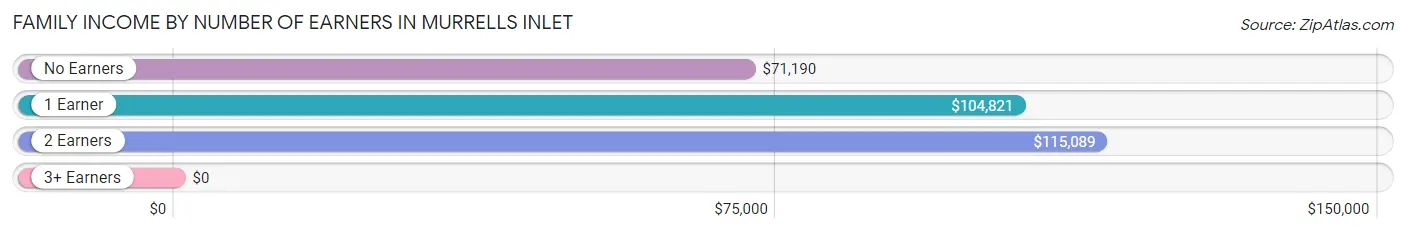
| Number of Earners | # Families | Median Income |
| No Earners | 994 (31.1%) | $71,190 |
| 1 Earner | 1,093 (34.3%) | $104,821 |
| 2 Earners | 877 (27.5%) | $115,089 |
| 3+ Earners | 227 (7.1%) | $0 |
| Total | 3,191 (100.0%) | $87,636 |
Household Income in Murrells Inlet
Household Income Brackets in Murrells Inlet
With 764 households falling in the category, the $50,000 to $74,999 income range is the most frequent in Murrells Inlet, accounting for 16.7% of all households. In contrast, only 96 households (2.1%) fall into the $10,000 to $14,999 income bracket, making it the least populous group.
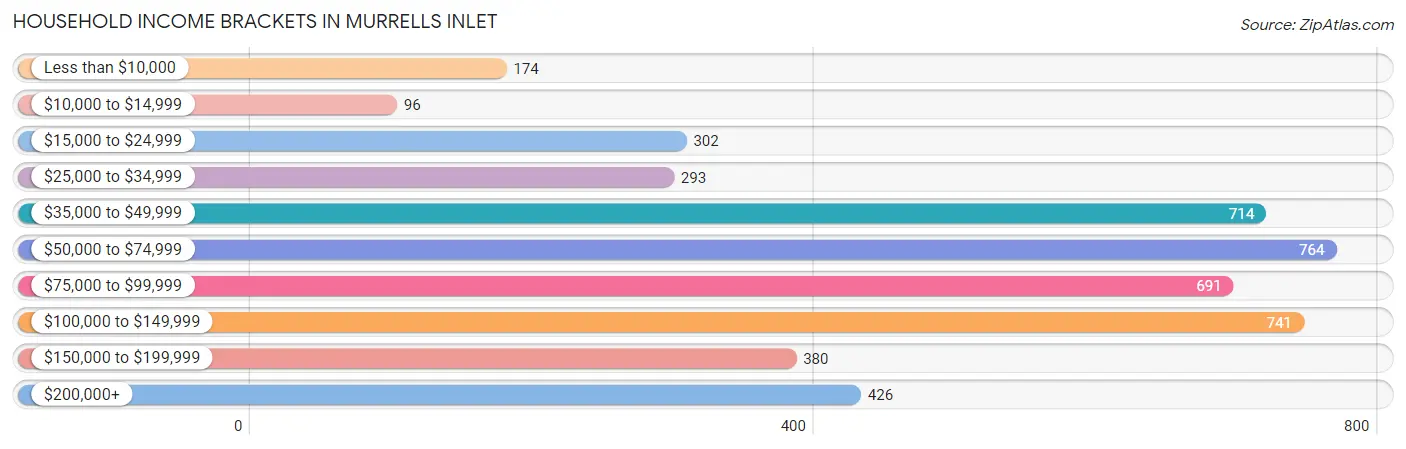
| Income Bracket | # Households | % Households |
| Less than $10,000 | 174 | 3.8% |
| $10,000 to $14,999 | 96 | 2.1% |
| $15,000 to $24,999 | 302 | 6.6% |
| $25,000 to $34,999 | 293 | 6.4% |
| $35,000 to $49,999 | 714 | 15.6% |
| $50,000 to $74,999 | 764 | 16.7% |
| $75,000 to $99,999 | 691 | 15.1% |
| $100,000 to $149,999 | 741 | 16.2% |
| $150,000 to $199,999 | 380 | 8.3% |
| $200,000+ | 426 | 9.3% |
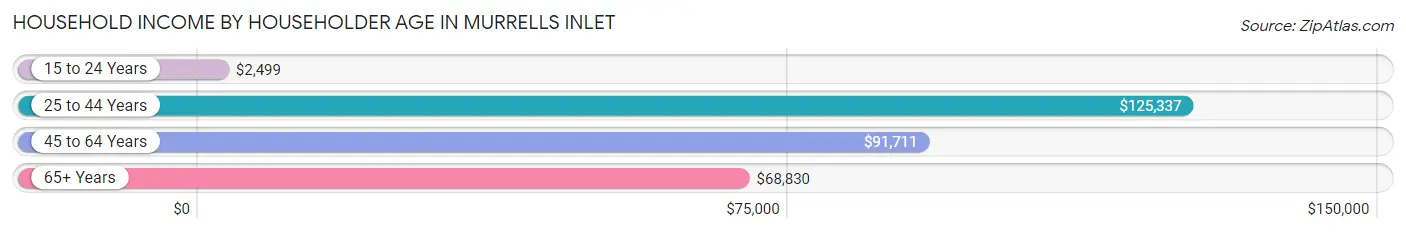
Household Income by Householder Age in Murrells Inlet
The median household income in Murrells Inlet is $71,019, with the highest median household income of $125,337 found in the 25 to 44 years age bracket for the primary householder. A total of 528 households (11.5%) fall into this category. Meanwhile, the 15 to 24 years age bracket for the primary householder has the lowest median household income of $2,499, with 89 households (1.9%) in this group.
| Income Bracket | # Households | Median Income |
| 15 to 24 Years | 89 (1.9%) | $2,499 |
| 25 to 44 Years | 528 (11.5%) | $125,337 |
| 45 to 64 Years | 1,636 (35.7%) | $91,711 |
| 65+ Years | 2,323 (50.8%) | $68,830 |
| Total | 4,576 (100.0%) | $71,019 |
Poverty in Murrells Inlet
Income Below Poverty by Sex and Age in Murrells Inlet
With 8.2% poverty level for males and 9.4% for females among the residents of Murrells Inlet, 12 to 14 year old males and 6 to 11 year old females are the most vulnerable to poverty, with 123 males (63.7%) and 70 females (60.9%) in their respective age groups living below the poverty level.
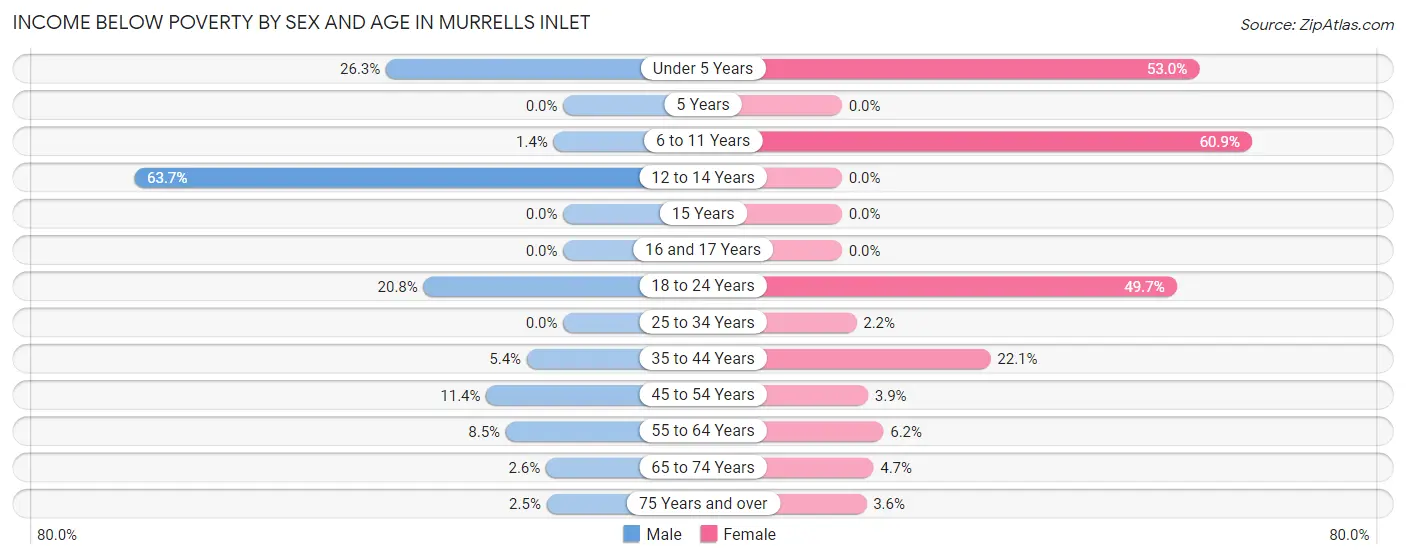
| Age Bracket | Male | Female |
| Under 5 Years | 10 (26.3%) | 61 (53.0%) |
| 5 Years | 0 (0.0%) | 0 (0.0%) |
| 6 to 11 Years | 3 (1.4%) | 70 (60.9%) |
| 12 to 14 Years | 123 (63.7%) | 0 (0.0%) |
| 15 Years | 0 (0.0%) | 0 (0.0%) |
| 16 and 17 Years | 0 (0.0%) | 0 (0.0%) |
| 18 to 24 Years | 72 (20.7%) | 80 (49.7%) |
| 25 to 34 Years | 0 (0.0%) | 9 (2.1%) |
| 35 to 44 Years | 20 (5.4%) | 75 (22.1%) |
| 45 to 54 Years | 55 (11.4%) | 25 (3.9%) |
| 55 to 64 Years | 104 (8.5%) | 62 (6.2%) |
| 65 to 74 Years | 30 (2.6%) | 59 (4.7%) |
| 75 Years and over | 14 (2.5%) | 30 (3.6%) |
| Total | 431 (8.2%) | 471 (9.4%) |
Income Above Poverty by Sex and Age in Murrells Inlet
According to the poverty statistics in Murrells Inlet, males aged 5 years and females aged 5 years are the age groups that are most secure financially, with 100.0% of males and 100.0% of females in these age groups living above the poverty line.
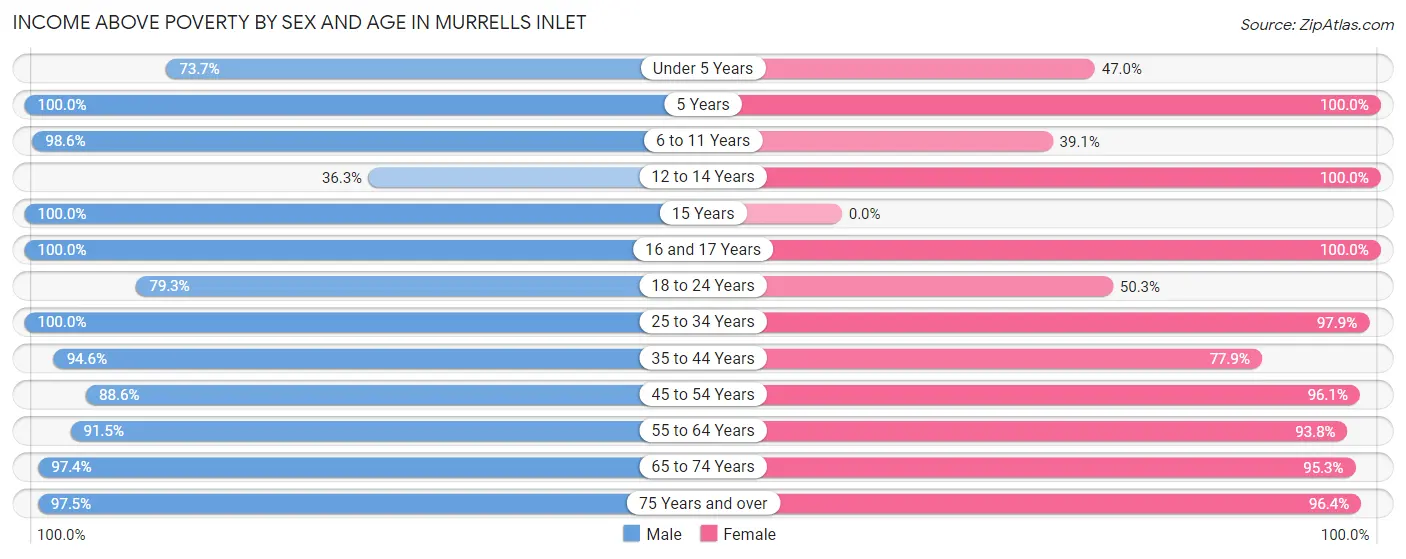
| Age Bracket | Male | Female |
| Under 5 Years | 28 (73.7%) | 54 (47.0%) |
| 5 Years | 48 (100.0%) | 21 (100.0%) |
| 6 to 11 Years | 207 (98.6%) | 45 (39.1%) |
| 12 to 14 Years | 70 (36.3%) | 74 (100.0%) |
| 15 Years | 144 (100.0%) | 0 (0.0%) |
| 16 and 17 Years | 86 (100.0%) | 18 (100.0%) |
| 18 to 24 Years | 275 (79.2%) | 81 (50.3%) |
| 25 to 34 Years | 414 (100.0%) | 409 (97.9%) |
| 35 to 44 Years | 350 (94.6%) | 265 (77.9%) |
| 45 to 54 Years | 426 (88.6%) | 621 (96.1%) |
| 55 to 64 Years | 1,115 (91.5%) | 944 (93.8%) |
| 65 to 74 Years | 1,144 (97.4%) | 1,202 (95.3%) |
| 75 Years and over | 553 (97.5%) | 799 (96.4%) |
| Total | 4,860 (91.8%) | 4,533 (90.6%) |
Income Below Poverty Among Married-Couple Families in Murrells Inlet
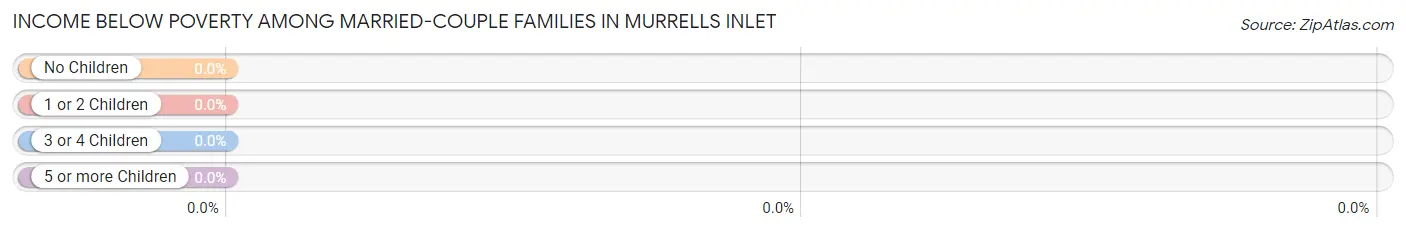
| Children | Above Poverty | Below Poverty |
| No Children | 2,115 (100.0%) | 0 (0.0%) |
| 1 or 2 Children | 463 (100.0%) | 0 (0.0%) |
| 3 or 4 Children | 14 (100.0%) | 0 (0.0%) |
| 5 or more Children | 0 (0.0%) | 0 (0.0%) |
| Total | 2,592 (100.0%) | 0 (0.0%) |
Income Below Poverty Among Single-Parent Households in Murrells Inlet
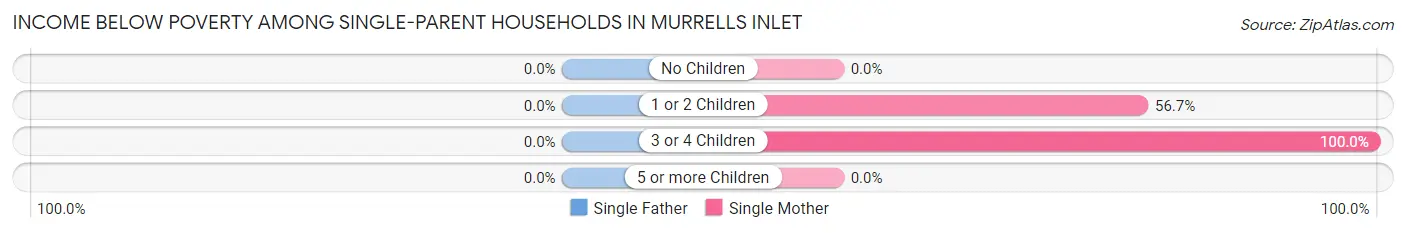
| Children | Single Father | Single Mother |
| No Children | 0 (0.0%) | 0 (0.0%) |
| 1 or 2 Children | 0 (0.0%) | 55 (56.7%) |
| 3 or 4 Children | 0 (0.0%) | 45 (100.0%) |
| 5 or more Children | 0 (0.0%) | 0 (0.0%) |
| Total | 0 (0.0%) | 100 (19.1%) |
Income Below Poverty Among Married-Couple vs Single-Parent Households in Murrells Inlet
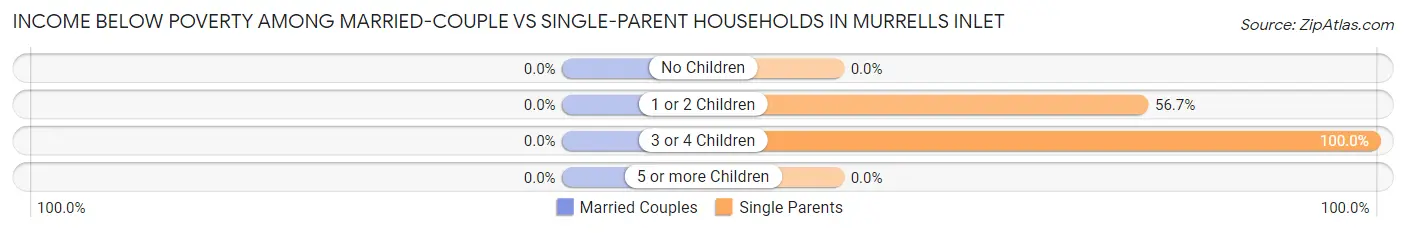
| Children | Married-Couple Families | Single-Parent Households |
| No Children | 0 (0.0%) | 0 (0.0%) |
| 1 or 2 Children | 0 (0.0%) | 55 (56.7%) |
| 3 or 4 Children | 0 (0.0%) | 45 (100.0%) |
| 5 or more Children | 0 (0.0%) | 0 (0.0%) |
| Total | 0 (0.0%) | 100 (16.7%) |
Race in Murrells Inlet
The most populous races in Murrells Inlet are White / Caucasian (9,067 | 88.0%), Hispanic or Latino (704 | 6.8%), and Black / African American (464 | 4.5%).
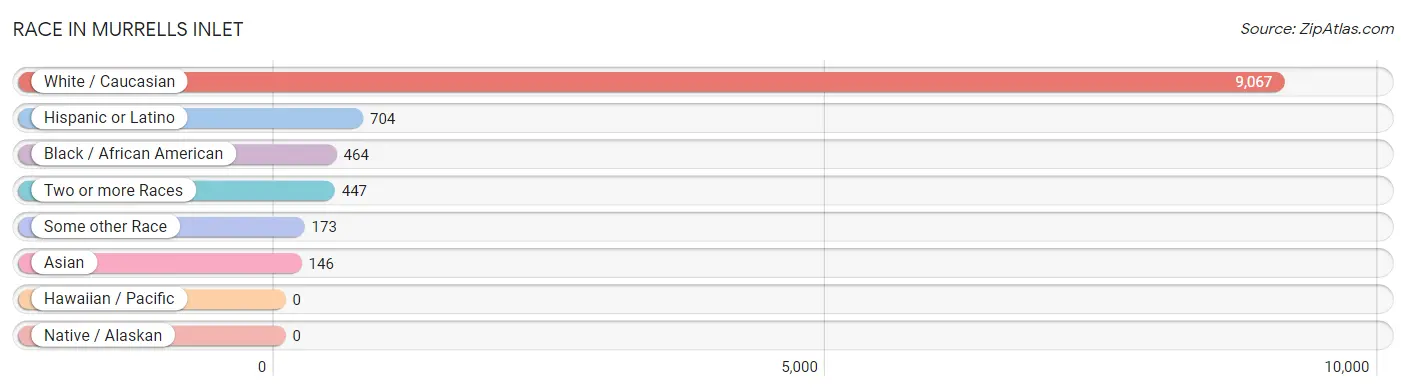
| Race | # Population | % Population |
| Asian | 146 | 1.4% |
| Black / African American | 464 | 4.5% |
| Hawaiian / Pacific | 0 | 0.0% |
| Hispanic or Latino | 704 | 6.8% |
| Native / Alaskan | 0 | 0.0% |
| White / Caucasian | 9,067 | 88.0% |
| Two or more Races | 447 | 4.3% |
| Some other Race | 173 | 1.7% |
| Total | 10,297 | 100.0% |
Ancestry in Murrells Inlet
The most populous ancestries reported in Murrells Inlet are English (2,392 | 23.2%), German (2,087 | 20.3%), Irish (1,974 | 19.2%), American (843 | 8.2%), and Greek (687 | 6.7%), together accounting for 77.5% of all Murrells Inlet residents.
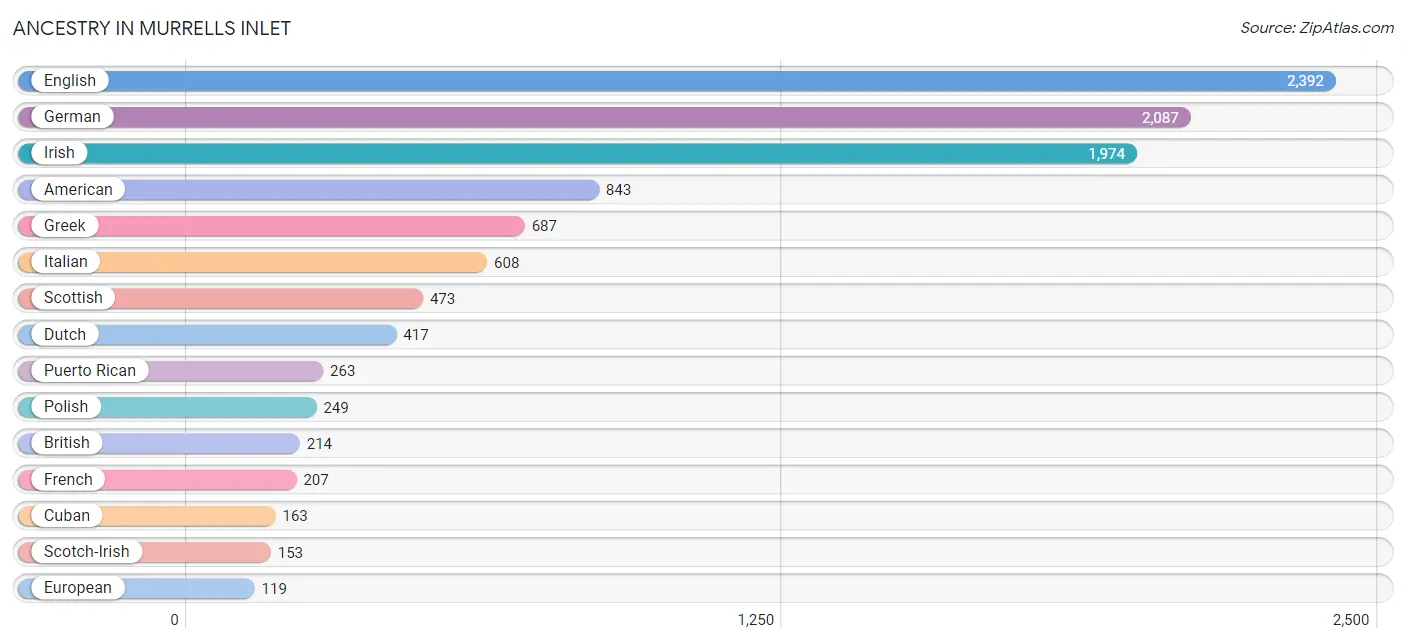
| Ancestry | # Population | % Population |
| African | 5 | 0.1% |
| American | 843 | 8.2% |
| Arab | 47 | 0.5% |
| Armenian | 14 | 0.1% |
| Austrian | 9 | 0.1% |
| Belgian | 18 | 0.2% |
| British | 214 | 2.1% |
| Burmese | 58 | 0.6% |
| Canadian | 15 | 0.2% |
| Central American | 15 | 0.2% |
| Chippewa | 12 | 0.1% |
| Costa Rican | 15 | 0.2% |
| Croatian | 10 | 0.1% |
| Cuban | 163 | 1.6% |
| Czech | 22 | 0.2% |
| Czechoslovakian | 13 | 0.1% |
| Danish | 45 | 0.4% |
| Dutch | 417 | 4.1% |
| English | 2,392 | 23.2% |
| European | 119 | 1.2% |
| Finnish | 63 | 0.6% |
| French | 207 | 2.0% |
| French Canadian | 38 | 0.4% |
| German | 2,087 | 20.3% |
| Greek | 687 | 6.7% |
| Hungarian | 51 | 0.5% |
| Indian (Asian) | 72 | 0.7% |
| Irish | 1,974 | 19.2% |
| Italian | 608 | 5.9% |
| Lebanese | 47 | 0.5% |
| Lithuanian | 26 | 0.3% |
| Lumbee | 47 | 0.5% |
| Mexican | 93 | 0.9% |
| Northern European | 18 | 0.2% |
| Norwegian | 12 | 0.1% |
| Pennsylvania German | 21 | 0.2% |
| Polish | 249 | 2.4% |
| Portuguese | 79 | 0.8% |
| Puerto Rican | 263 | 2.5% |
| Romanian | 8 | 0.1% |
| Russian | 83 | 0.8% |
| Scandinavian | 75 | 0.7% |
| Scotch-Irish | 153 | 1.5% |
| Scottish | 473 | 4.6% |
| Serbian | 10 | 0.1% |
| Slovak | 83 | 0.8% |
| Spaniard | 62 | 0.6% |
| Spanish | 90 | 0.9% |
| Sri Lankan | 16 | 0.2% |
| Subsaharan African | 5 | 0.1% |
| Swedish | 86 | 0.8% |
| Swiss | 40 | 0.4% |
| Ukrainian | 26 | 0.3% |
| Welsh | 45 | 0.4% | View All 54 Rows |
Immigrants in Murrells Inlet
The most numerous immigrant groups reported in Murrells Inlet came from Latin America (198 | 1.9%), Europe (197 | 1.9%), Caribbean (163 | 1.6%), Cuba (163 | 1.6%), and Asia (159 | 1.5%), together accounting for 8.5% of all Murrells Inlet residents.
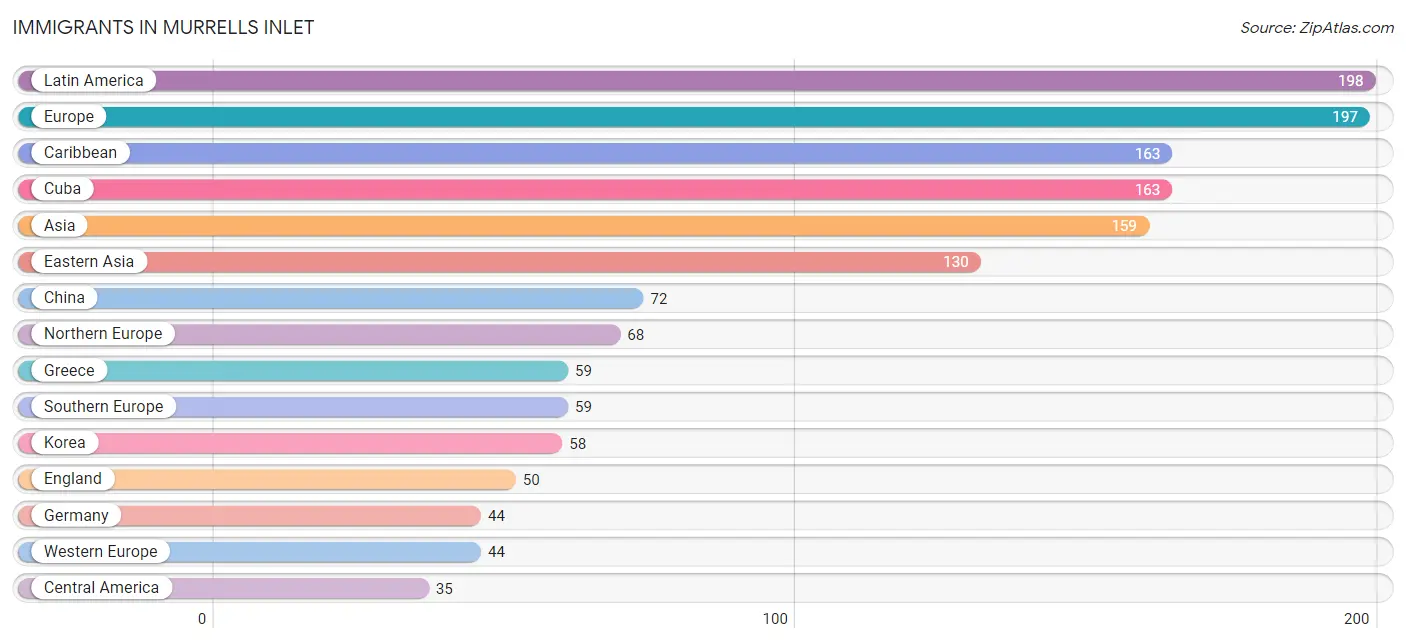
| Immigration Origin | # Population | % Population |
| Asia | 159 | 1.5% |
| Canada | 28 | 0.3% |
| Caribbean | 163 | 1.6% |
| Central America | 35 | 0.3% |
| China | 72 | 0.7% |
| Costa Rica | 15 | 0.2% |
| Cuba | 163 | 1.6% |
| Eastern Asia | 130 | 1.3% |
| Eastern Europe | 26 | 0.3% |
| England | 50 | 0.5% |
| Europe | 197 | 1.9% |
| Germany | 44 | 0.4% |
| Greece | 59 | 0.6% |
| Korea | 58 | 0.6% |
| Latin America | 198 | 1.9% |
| Lebanon | 13 | 0.1% |
| Lithuania | 10 | 0.1% |
| Mexico | 20 | 0.2% |
| Northern Europe | 68 | 0.7% |
| Poland | 16 | 0.2% |
| South Eastern Asia | 16 | 0.2% |
| Southern Europe | 59 | 0.6% |
| Vietnam | 16 | 0.2% |
| Western Asia | 13 | 0.1% |
| Western Europe | 44 | 0.4% | View All 25 Rows |
Sex and Age in Murrells Inlet
Sex and Age in Murrells Inlet
The most populous age groups in Murrells Inlet are 70 to 74 Years (804 | 15.2%) for men and 65 to 69 Years (789 | 15.8%) for women.
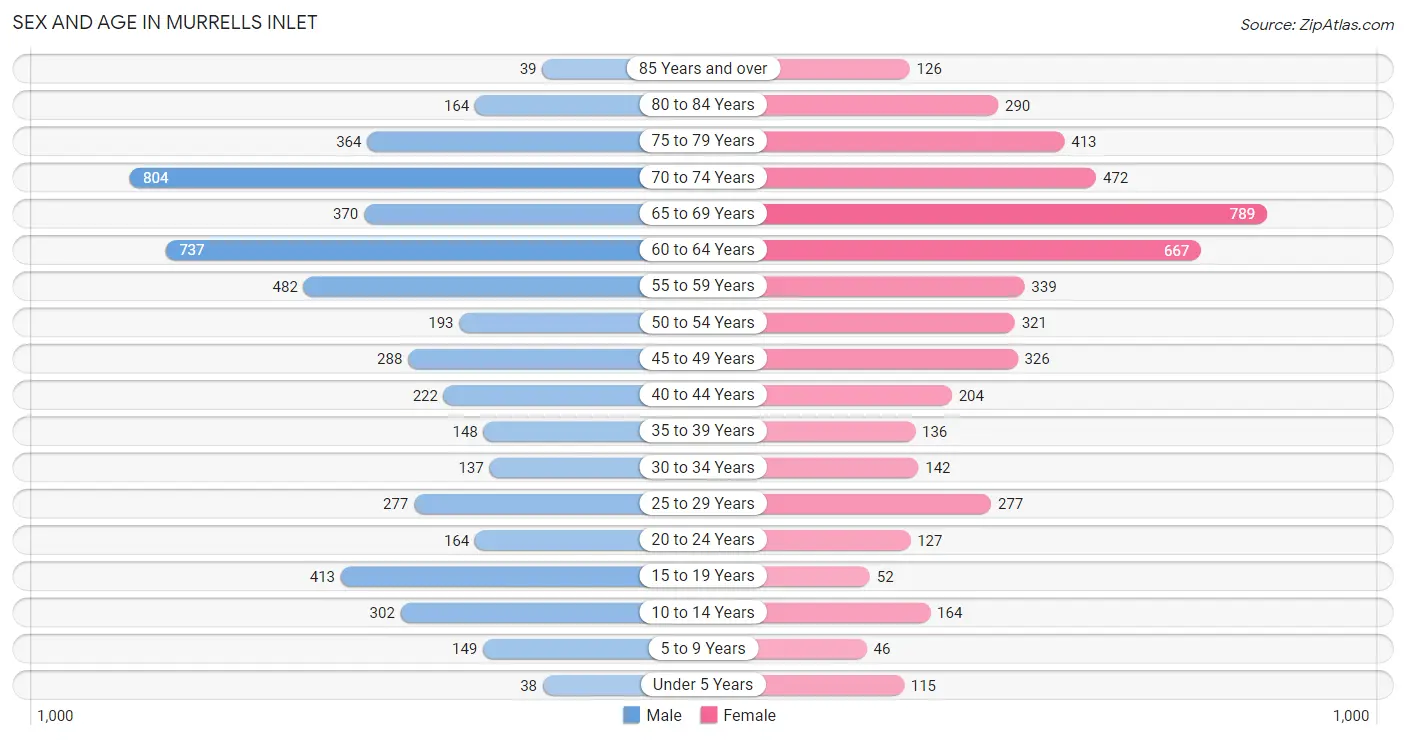
| Age Bracket | Male | Female |
| Under 5 Years | 38 (0.7%) | 115 (2.3%) |
| 5 to 9 Years | 149 (2.8%) | 46 (0.9%) |
| 10 to 14 Years | 302 (5.7%) | 164 (3.3%) |
| 15 to 19 Years | 413 (7.8%) | 52 (1.0%) |
| 20 to 24 Years | 164 (3.1%) | 127 (2.5%) |
| 25 to 29 Years | 277 (5.2%) | 277 (5.5%) |
| 30 to 34 Years | 137 (2.6%) | 142 (2.8%) |
| 35 to 39 Years | 148 (2.8%) | 136 (2.7%) |
| 40 to 44 Years | 222 (4.2%) | 204 (4.1%) |
| 45 to 49 Years | 288 (5.4%) | 326 (6.5%) |
| 50 to 54 Years | 193 (3.6%) | 321 (6.4%) |
| 55 to 59 Years | 482 (9.1%) | 339 (6.8%) |
| 60 to 64 Years | 737 (13.9%) | 667 (13.3%) |
| 65 to 69 Years | 370 (7.0%) | 789 (15.8%) |
| 70 to 74 Years | 804 (15.2%) | 472 (9.4%) |
| 75 to 79 Years | 364 (6.9%) | 413 (8.3%) |
| 80 to 84 Years | 164 (3.1%) | 290 (5.8%) |
| 85 Years and over | 39 (0.7%) | 126 (2.5%) |
| Total | 5,291 (100.0%) | 5,006 (100.0%) |
Families and Households in Murrells Inlet
Median Family Size in Murrells Inlet
The median family size in Murrells Inlet is 2.64 persons per family, with single female/mother families (525 | 16.5%) accounting for the largest median family size of 3.3 persons per family. On the other hand, married-couple families (2,592 | 81.2%) represent the smallest median family size with 2.49 persons per family.
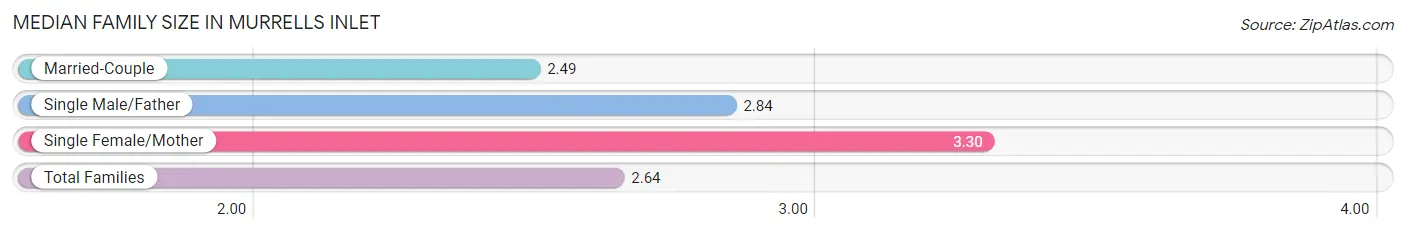
| Family Type | # Families | Family Size |
| Married-Couple | 2,592 (81.2%) | 2.49 |
| Single Male/Father | 74 (2.3%) | 2.84 |
| Single Female/Mother | 525 (16.5%) | 3.30 |
| Total Families | 3,191 (100.0%) | 2.64 |
Median Household Size in Murrells Inlet
The median household size in Murrells Inlet is 2.25 persons per household, with single female/mother households (525 | 11.5%) accounting for the largest median household size of 3.56 persons per household. non-family households (1,385 | 30.3%) represent the smallest median household size with 1.23 persons per household.
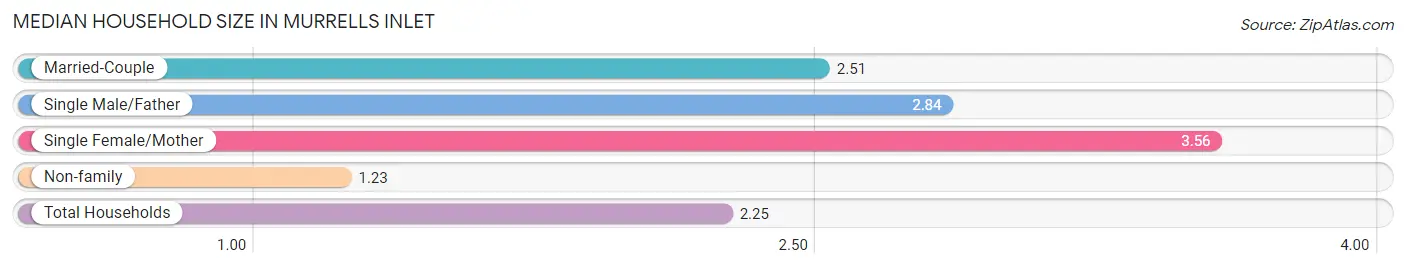
| Household Type | # Households | Household Size |
| Married-Couple | 2,592 (56.6%) | 2.51 |
| Single Male/Father | 74 (1.6%) | 2.84 |
| Single Female/Mother | 525 (11.5%) | 3.56 |
| Non-family | 1,385 (30.3%) | 1.23 |
| Total Households | 4,576 (100.0%) | 2.25 |
Household Size by Marriage Status in Murrells Inlet
Out of a total of 4,576 households in Murrells Inlet, 3,191 (69.7%) are family households, while 1,385 (30.3%) are nonfamily households. The most numerous type of family households are 2-person households, comprising 2,231, and the most common type of nonfamily households are 1-person households, comprising 1,146.
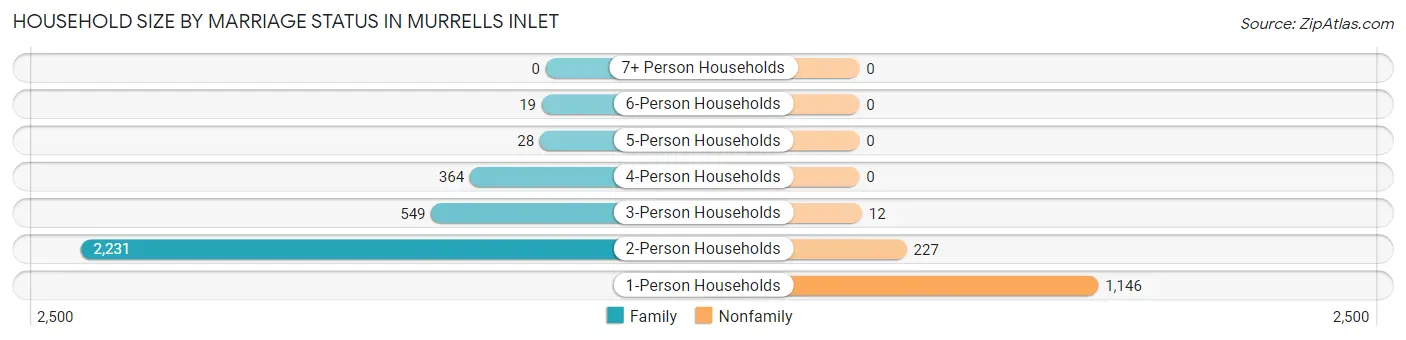
| Household Size | Family Households | Nonfamily Households |
| 1-Person Households | - | 1,146 (25.0%) |
| 2-Person Households | 2,231 (48.7%) | 227 (5.0%) |
| 3-Person Households | 549 (12.0%) | 12 (0.3%) |
| 4-Person Households | 364 (8.0%) | 0 (0.0%) |
| 5-Person Households | 28 (0.6%) | 0 (0.0%) |
| 6-Person Households | 19 (0.4%) | 0 (0.0%) |
| 7+ Person Households | 0 (0.0%) | 0 (0.0%) |
| Total | 3,191 (69.7%) | 1,385 (30.3%) |
Female Fertility in Murrells Inlet
Fertility by Age in Murrells Inlet
Average fertility rate in Murrells Inlet is 67.0 births per 1,000 women. Women in the age bracket of 20 to 34 years have the highest fertility rate with 115.0 births per 1,000 women. Women in the age bracket of 20 to 34 years acount for 67.7% of all women with births.
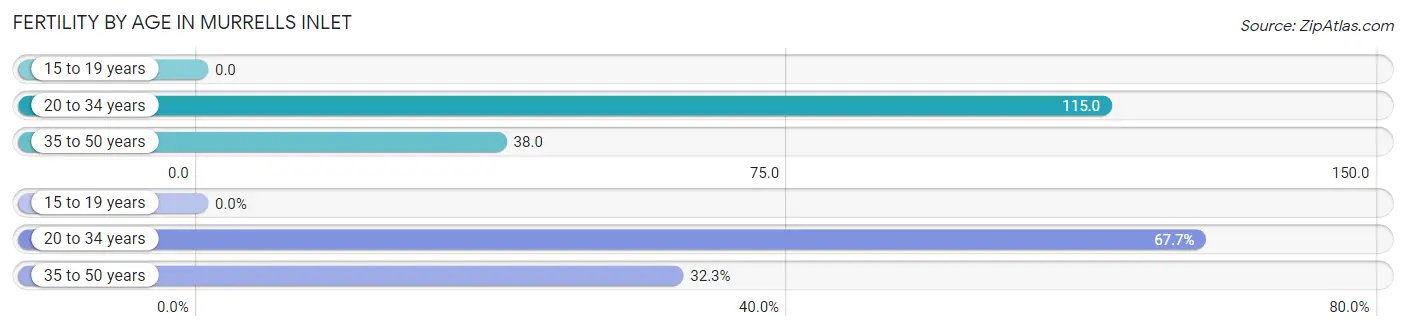
| Age Bracket | Women with Births | Births / 1,000 Women |
| 15 to 19 years | 0 (0.0%) | 0.0 |
| 20 to 34 years | 63 (67.7%) | 115.0 |
| 35 to 50 years | 30 (32.3%) | 38.0 |
| Total | 93 (100.0%) | 67.0 |
Fertility by Age by Marriage Status in Murrells Inlet
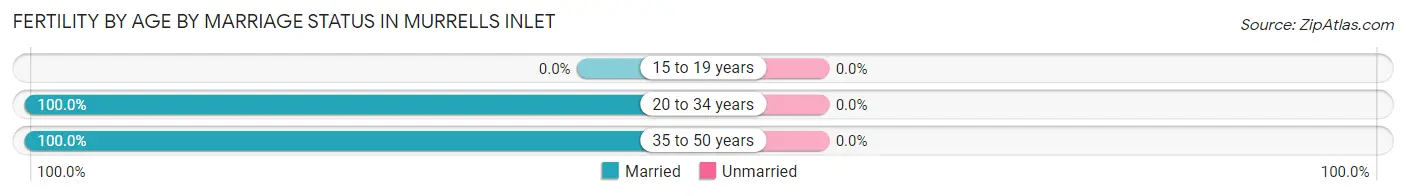
| Age Bracket | Married | Unmarried |
| 15 to 19 years | 0 (0.0%) | 0 (0.0%) |
| 20 to 34 years | 63 (100.0%) | 0 (0.0%) |
| 35 to 50 years | 30 (100.0%) | 0 (0.0%) |
| Total | 93 (100.0%) | 0 (0.0%) |
Fertility by Education in Murrells Inlet
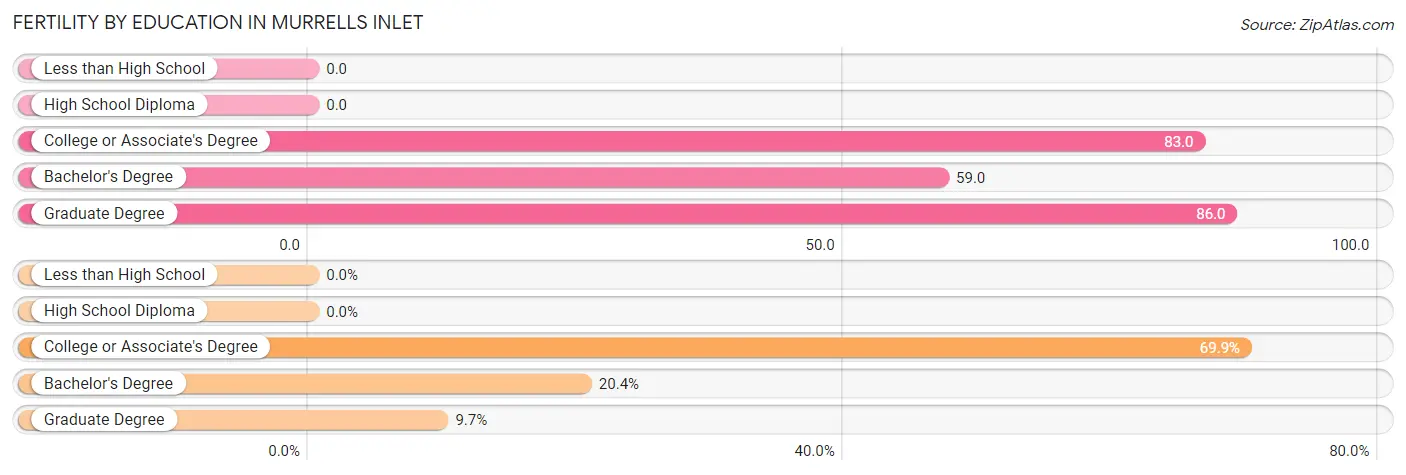
| Educational Attainment | Women with Births | Births / 1,000 Women |
| Less than High School | 0 (0.0%) | 0.0 |
| High School Diploma | 0 (0.0%) | 0.0 |
| College or Associate's Degree | 65 (69.9%) | 83.0 |
| Bachelor's Degree | 19 (20.4%) | 59.0 |
| Graduate Degree | 9 (9.7%) | 86.0 |
| Total | 93 (100.0%) | 67.0 |
Fertility by Education by Marriage Status in Murrells Inlet
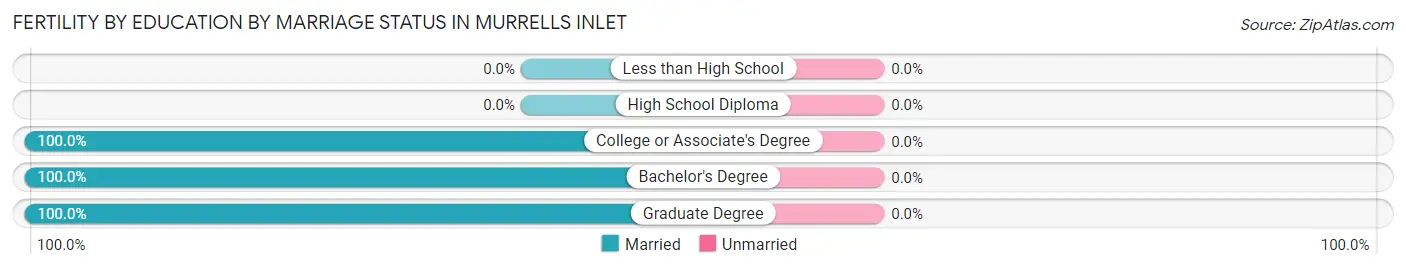
| Educational Attainment | Married | Unmarried |
| Less than High School | 0 (0.0%) | 0 (0.0%) |
| High School Diploma | 0 (0.0%) | 0 (0.0%) |
| College or Associate's Degree | 65 (100.0%) | 0 (0.0%) |
| Bachelor's Degree | 19 (100.0%) | 0 (0.0%) |
| Graduate Degree | 9 (100.0%) | 0 (0.0%) |
| Total | 93 (100.0%) | 0 (0.0%) |
Employment Characteristics in Murrells Inlet
Employment by Class of Employer in Murrells Inlet
Among the 4,386 employed individuals in Murrells Inlet, private company employees (2,221 | 50.6%), self-employed (incorporated) (801 | 18.3%), and self-employed (not incorporated) (438 | 10.0%) make up the most common classes of employment.
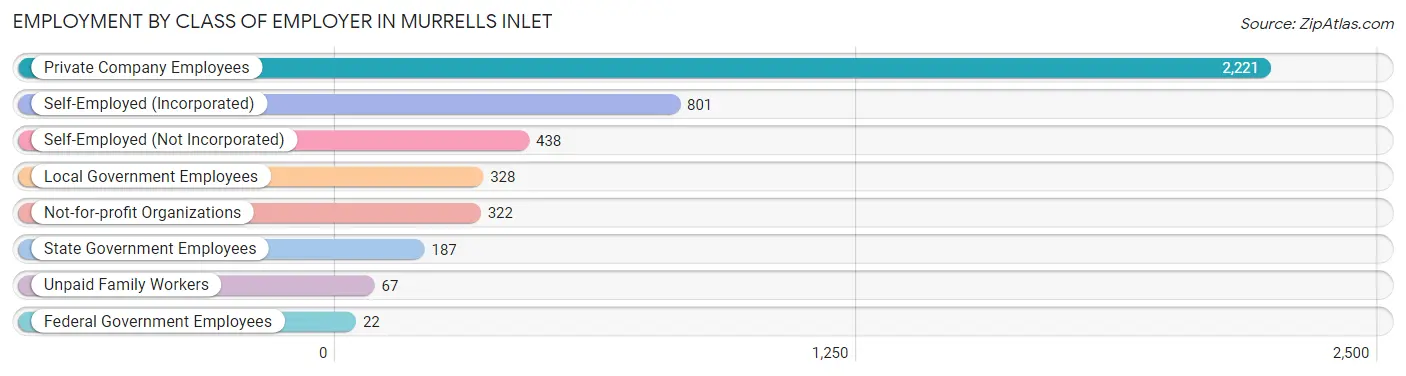
| Employer Class | # Employees | % Employees |
| Private Company Employees | 2,221 | 50.6% |
| Self-Employed (Incorporated) | 801 | 18.3% |
| Self-Employed (Not Incorporated) | 438 | 10.0% |
| Not-for-profit Organizations | 322 | 7.3% |
| Local Government Employees | 328 | 7.5% |
| State Government Employees | 187 | 4.3% |
| Federal Government Employees | 22 | 0.5% |
| Unpaid Family Workers | 67 | 1.5% |
| Total | 4,386 | 100.0% |
Employment Status by Age in Murrells Inlet
According to the labor force statistics for Murrells Inlet, out of the total population over 16 years of age (9,339), 49.2% or 4,595 individuals are in the labor force, with 3.1% or 142 of them unemployed. The age group with the highest labor force participation rate is 25 to 29 years, with 99.8% or 553 individuals in the labor force. Within the labor force, the 75 years and over age range has the highest percentage of unemployed individuals, with 14.4% or 13 of them being unemployed.
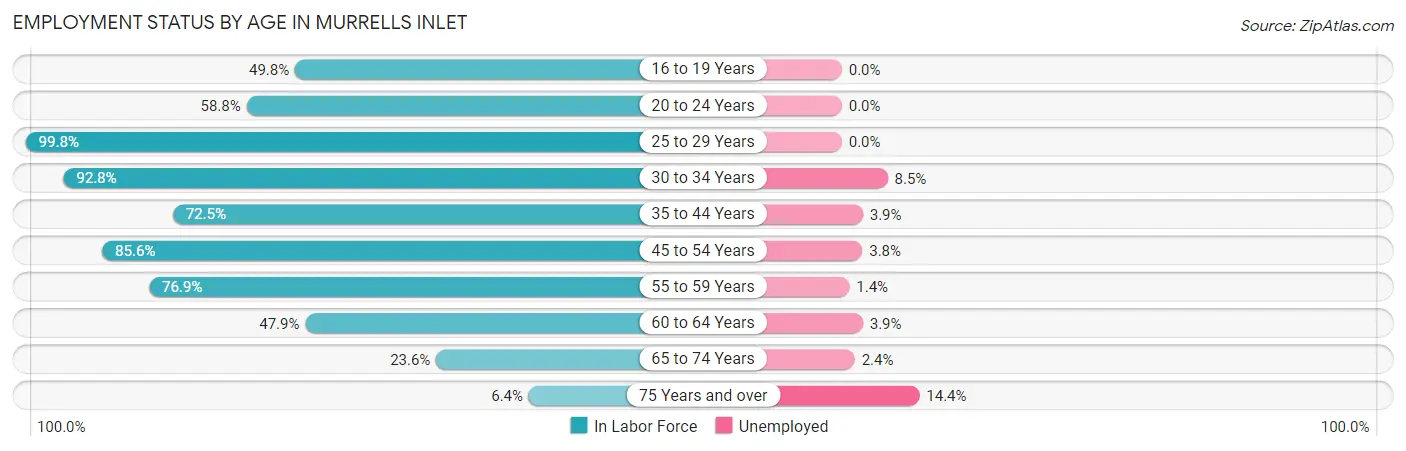
| Age Bracket | In Labor Force | Unemployed |
| 16 to 19 Years | 160 (49.8%) | 0 (0.0%) |
| 20 to 24 Years | 171 (58.8%) | 0 (0.0%) |
| 25 to 29 Years | 553 (99.8%) | 0 (0.0%) |
| 30 to 34 Years | 259 (92.8%) | 22 (8.5%) |
| 35 to 44 Years | 515 (72.5%) | 20 (3.9%) |
| 45 to 54 Years | 966 (85.6%) | 37 (3.8%) |
| 55 to 59 Years | 631 (76.9%) | 9 (1.4%) |
| 60 to 64 Years | 673 (47.9%) | 26 (3.9%) |
| 65 to 74 Years | 575 (23.6%) | 14 (2.4%) |
| 75 Years and over | 89 (6.4%) | 13 (14.4%) |
| Total | 4,595 (49.2%) | 142 (3.1%) |
Employment Status by Educational Attainment in Murrells Inlet
According to labor force statistics for Murrells Inlet, 73.5% of individuals (3,599) out of the total population between 25 and 64 years of age (4,896) are in the labor force, with 3.2% or 115 of them being unemployed. The group with the highest labor force participation rate are those with the educational attainment of bachelor's degree or higher, with 83.4% or 1,629 individuals in the labor force. Within the labor force, individuals with less than high school education have the highest percentage of unemployment, with 11.0% or 19 of them being unemployed.
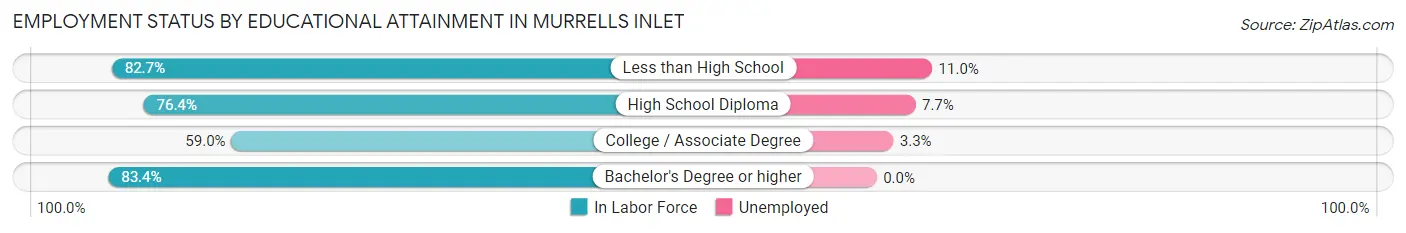
| Educational Attainment | In Labor Force | Unemployed |
| Less than High School | 172 (82.7%) | 23 (11.0%) |
| High School Diploma | 803 (76.4%) | 81 (7.7%) |
| College / Associate Degree | 994 (59.0%) | 56 (3.3%) |
| Bachelor's Degree or higher | 1,629 (83.4%) | 0 (0.0%) |
| Total | 3,599 (73.5%) | 157 (3.2%) |
Employment Occupations by Sex in Murrells Inlet
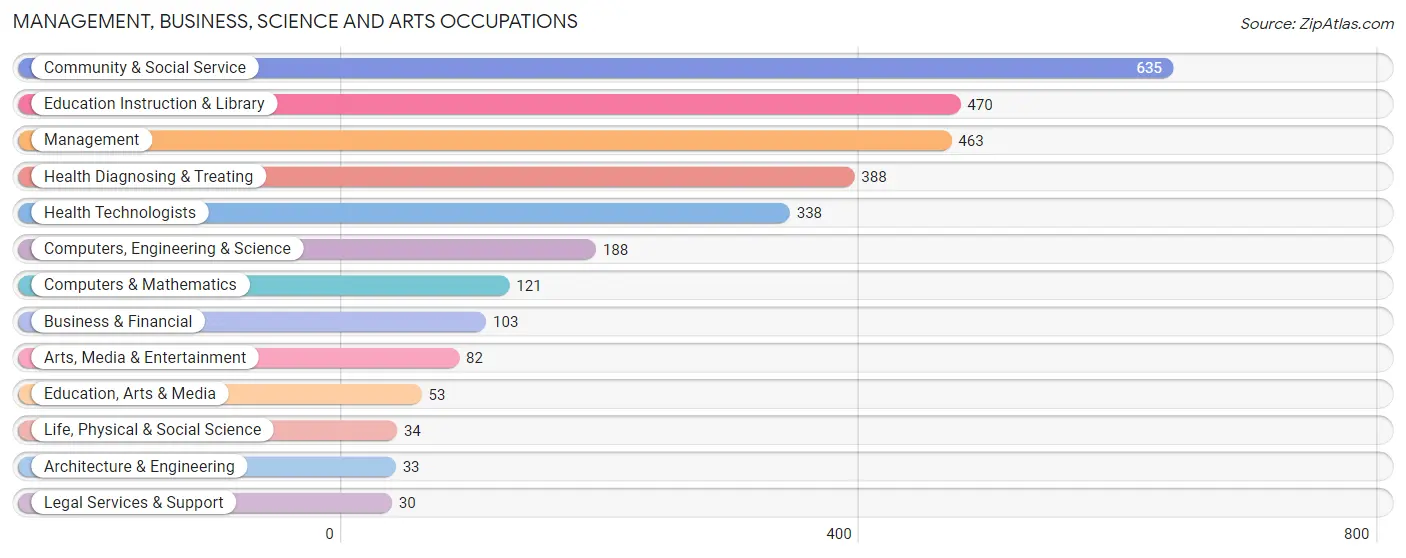
Management, Business, Science and Arts Occupations
The most common Management, Business, Science and Arts occupations in Murrells Inlet are Community & Social Service (635 | 14.3%), Education Instruction & Library (470 | 10.6%), Management (463 | 10.4%), Health Diagnosing & Treating (388 | 8.7%), and Health Technologists (338 | 7.6%).
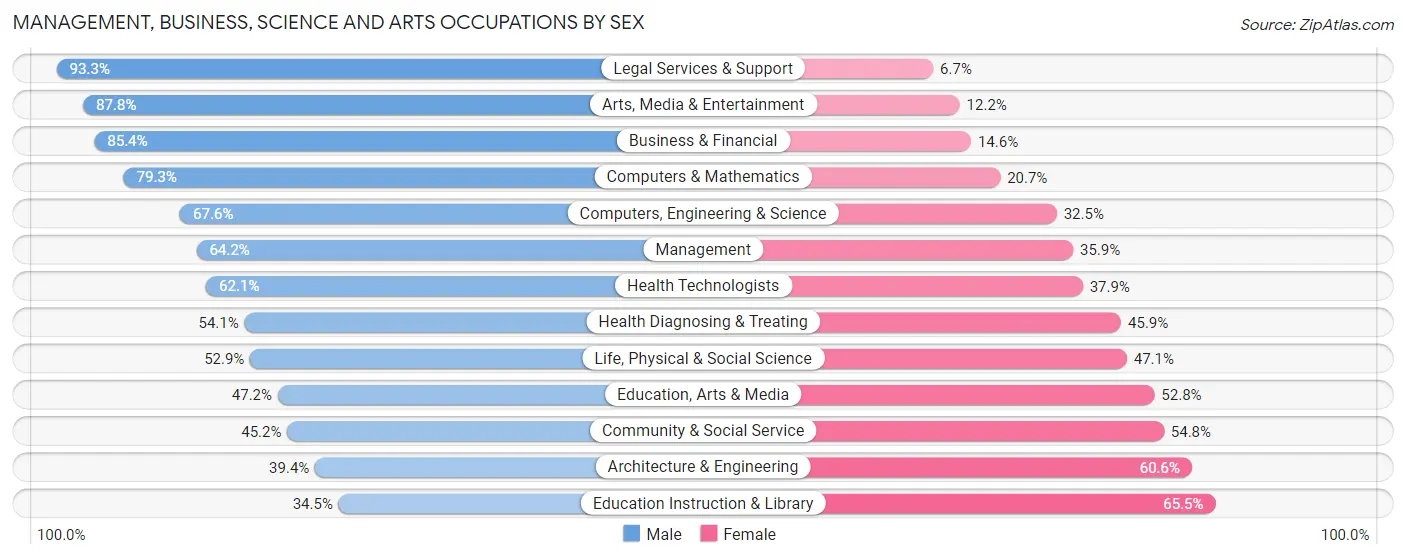
Management, Business, Science and Arts Occupations by Sex
Within the Management, Business, Science and Arts occupations in Murrells Inlet, the most male-oriented occupations are Legal Services & Support (93.3%), Arts, Media & Entertainment (87.8%), and Business & Financial (85.4%), while the most female-oriented occupations are Education Instruction & Library (65.5%), Architecture & Engineering (60.6%), and Community & Social Service (54.8%).
| Occupation | Male | Female |
| Management | 297 (64.1%) | 166 (35.8%) |
| Business & Financial | 88 (85.4%) | 15 (14.6%) |
| Computers, Engineering & Science | 127 (67.5%) | 61 (32.5%) |
| Computers & Mathematics | 96 (79.3%) | 25 (20.7%) |
| Architecture & Engineering | 13 (39.4%) | 20 (60.6%) |
| Life, Physical & Social Science | 18 (52.9%) | 16 (47.1%) |
| Community & Social Service | 287 (45.2%) | 348 (54.8%) |
| Education, Arts & Media | 25 (47.2%) | 28 (52.8%) |
| Legal Services & Support | 28 (93.3%) | 2 (6.7%) |
| Education Instruction & Library | 162 (34.5%) | 308 (65.5%) |
| Arts, Media & Entertainment | 72 (87.8%) | 10 (12.2%) |
| Health Diagnosing & Treating | 210 (54.1%) | 178 (45.9%) |
| Health Technologists | 210 (62.1%) | 128 (37.9%) |
| Total (Category) | 1,009 (56.8%) | 768 (43.2%) |
| Total (Overall) | 2,361 (53.0%) | 2,090 (47.0%) |
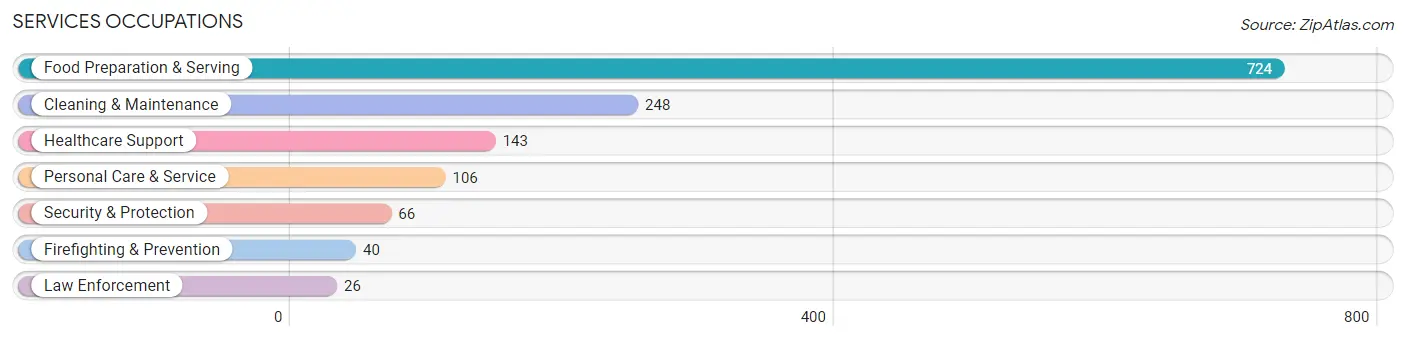
Services Occupations
The most common Services occupations in Murrells Inlet are Food Preparation & Serving (724 | 16.3%), Cleaning & Maintenance (248 | 5.6%), Healthcare Support (143 | 3.2%), Personal Care & Service (106 | 2.4%), and Security & Protection (66 | 1.5%).
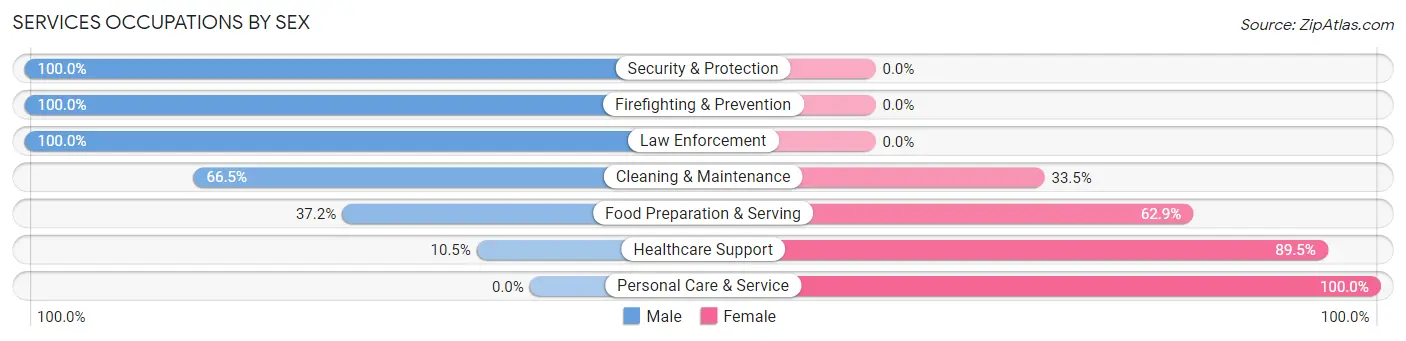
Services Occupations by Sex
Within the Services occupations in Murrells Inlet, the most male-oriented occupations are Security & Protection (100.0%), Firefighting & Prevention (100.0%), and Law Enforcement (100.0%), while the most female-oriented occupations are Personal Care & Service (100.0%), Healthcare Support (89.5%), and Food Preparation & Serving (62.8%).
| Occupation | Male | Female |
| Healthcare Support | 15 (10.5%) | 128 (89.5%) |
| Security & Protection | 66 (100.0%) | 0 (0.0%) |
| Firefighting & Prevention | 40 (100.0%) | 0 (0.0%) |
| Law Enforcement | 26 (100.0%) | 0 (0.0%) |
| Food Preparation & Serving | 269 (37.1%) | 455 (62.8%) |
| Cleaning & Maintenance | 165 (66.5%) | 83 (33.5%) |
| Personal Care & Service | 0 (0.0%) | 106 (100.0%) |
| Total (Category) | 515 (40.0%) | 772 (60.0%) |
| Total (Overall) | 2,361 (53.0%) | 2,090 (47.0%) |
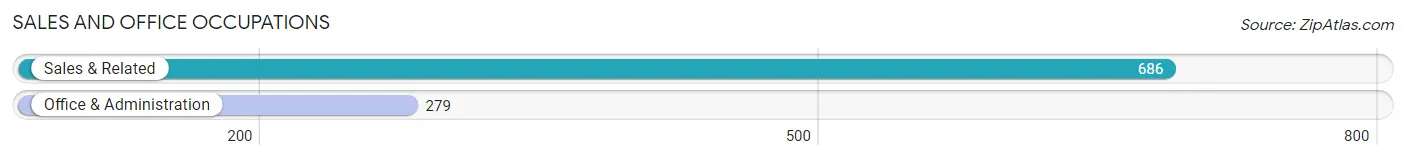
Sales and Office Occupations
The most common Sales and Office occupations in Murrells Inlet are Sales & Related (686 | 15.4%), and Office & Administration (279 | 6.3%).
Sales and Office Occupations by Sex
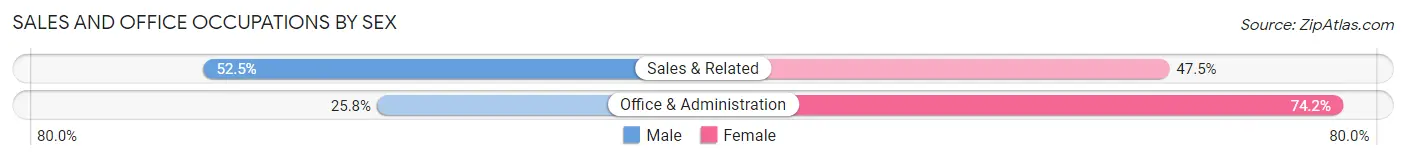
| Occupation | Male | Female |
| Sales & Related | 360 (52.5%) | 326 (47.5%) |
| Office & Administration | 72 (25.8%) | 207 (74.2%) |
| Total (Category) | 432 (44.8%) | 533 (55.2%) |
| Total (Overall) | 2,361 (53.0%) | 2,090 (47.0%) |
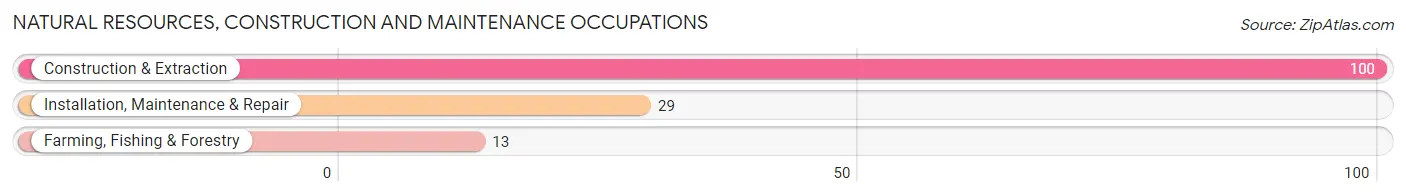
Natural Resources, Construction and Maintenance Occupations
The most common Natural Resources, Construction and Maintenance occupations in Murrells Inlet are Construction & Extraction (100 | 2.2%), Installation, Maintenance & Repair (29 | 0.6%), and Farming, Fishing & Forestry (13 | 0.3%).
Natural Resources, Construction and Maintenance Occupations by Sex
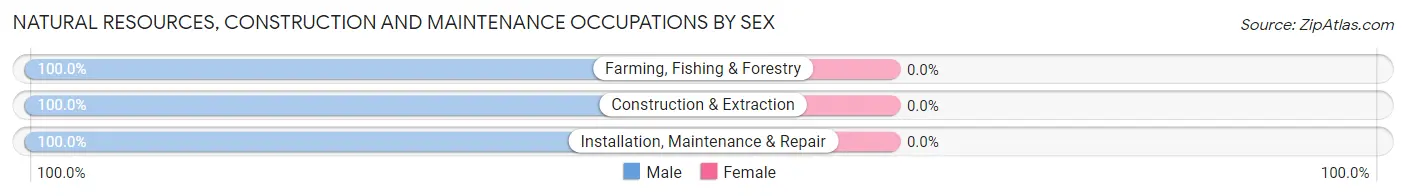
| Occupation | Male | Female |
| Farming, Fishing & Forestry | 13 (100.0%) | 0 (0.0%) |
| Construction & Extraction | 100 (100.0%) | 0 (0.0%) |
| Installation, Maintenance & Repair | 29 (100.0%) | 0 (0.0%) |
| Total (Category) | 142 (100.0%) | 0 (0.0%) |
| Total (Overall) | 2,361 (53.0%) | 2,090 (47.0%) |
Production, Transportation and Moving Occupations
The most common Production, Transportation and Moving occupations in Murrells Inlet are Material Moving (115 | 2.6%), Transportation (99 | 2.2%), and Production (66 | 1.5%).
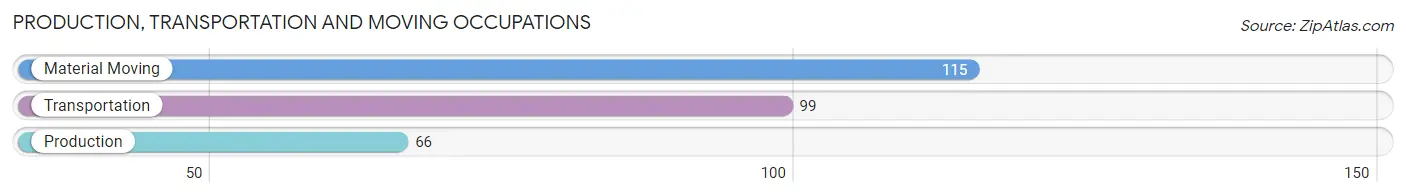
Production, Transportation and Moving Occupations by Sex
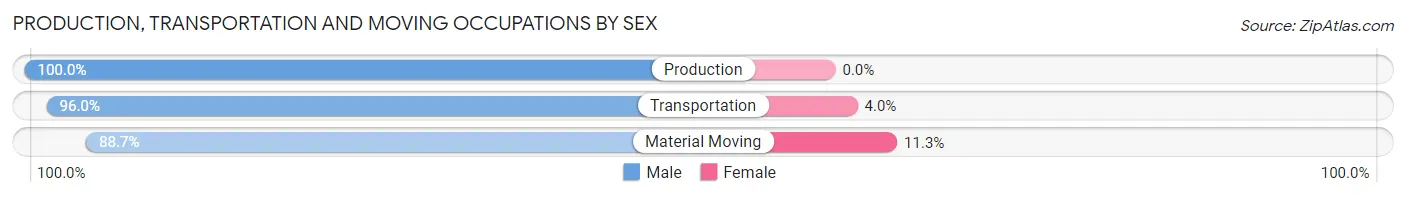
| Occupation | Male | Female |
| Production | 66 (100.0%) | 0 (0.0%) |
| Transportation | 95 (96.0%) | 4 (4.0%) |
| Material Moving | 102 (88.7%) | 13 (11.3%) |
| Total (Category) | 263 (93.9%) | 17 (6.1%) |
| Total (Overall) | 2,361 (53.0%) | 2,090 (47.0%) |
Employment Industries by Sex in Murrells Inlet
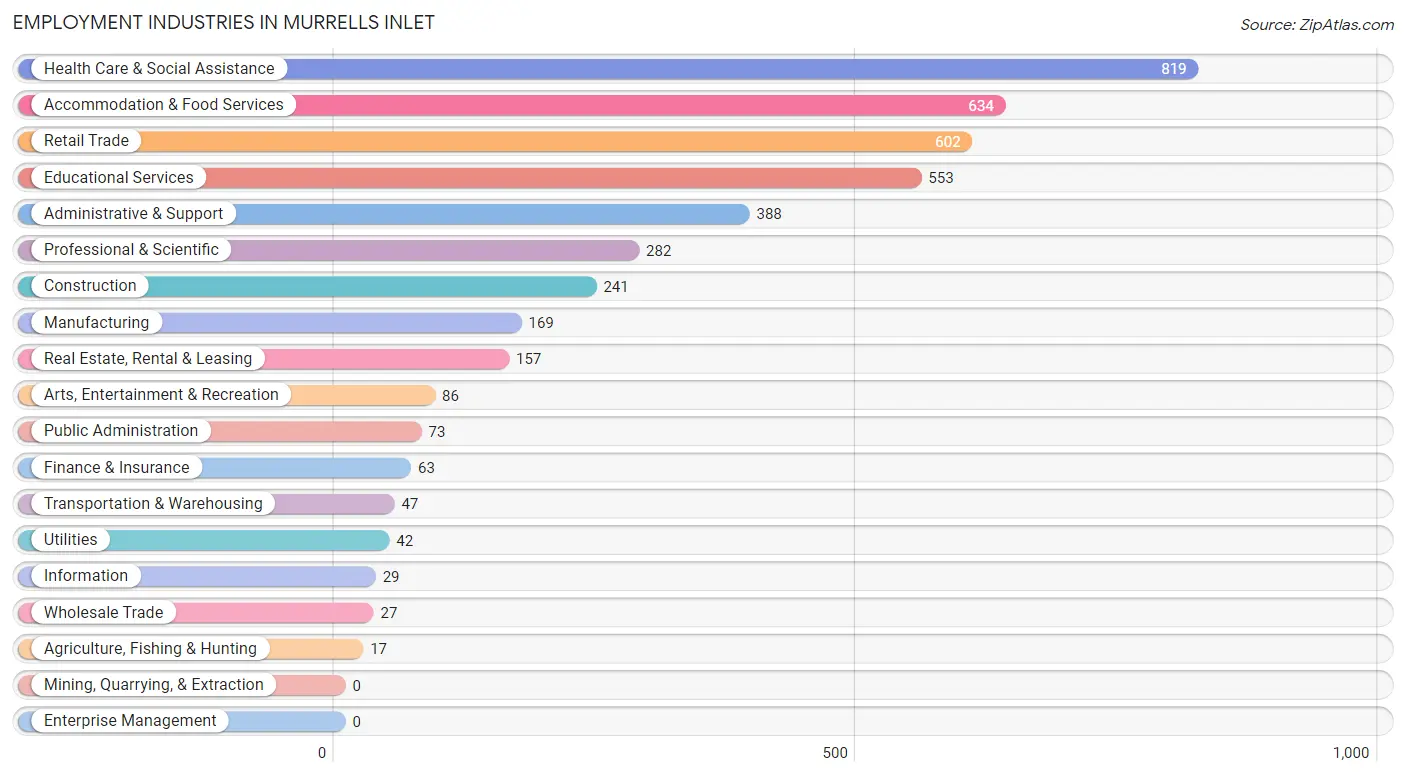
Employment Industries in Murrells Inlet
The major employment industries in Murrells Inlet include Health Care & Social Assistance (819 | 18.4%), Accommodation & Food Services (634 | 14.2%), Retail Trade (602 | 13.5%), Educational Services (553 | 12.4%), and Administrative & Support (388 | 8.7%).
Employment Industries by Sex in Murrells Inlet
The Murrells Inlet industries that see more men than women are Agriculture, Fishing & Hunting (100.0%), Utilities (100.0%), and Transportation & Warehousing (91.5%), whereas the industries that tend to have a higher number of women are Finance & Insurance (100.0%), Information (75.9%), and Accommodation & Food Services (67.2%).
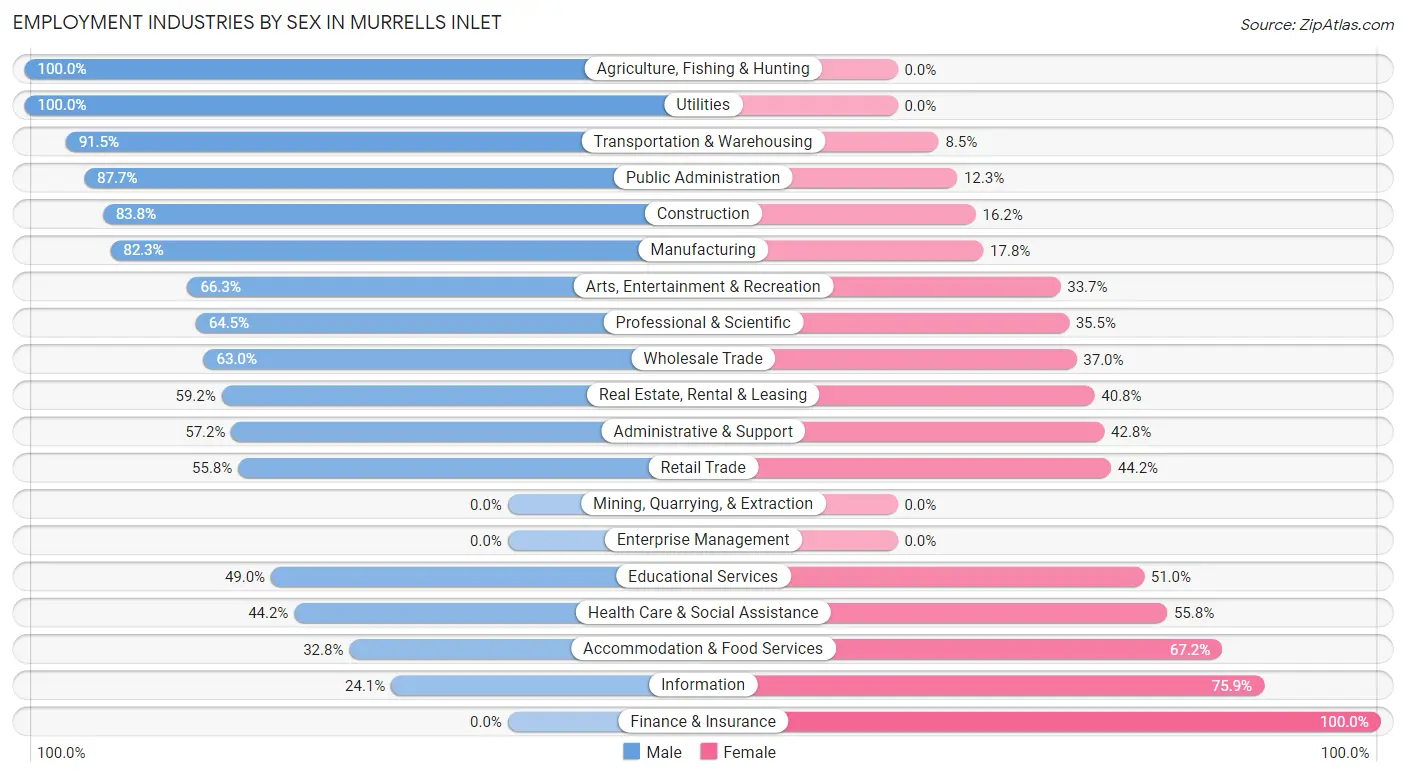
| Industry | Male | Female |
| Agriculture, Fishing & Hunting | 17 (100.0%) | 0 (0.0%) |
| Mining, Quarrying, & Extraction | 0 (0.0%) | 0 (0.0%) |
| Construction | 202 (83.8%) | 39 (16.2%) |
| Manufacturing | 139 (82.3%) | 30 (17.7%) |
| Wholesale Trade | 17 (63.0%) | 10 (37.0%) |
| Retail Trade | 336 (55.8%) | 266 (44.2%) |
| Transportation & Warehousing | 43 (91.5%) | 4 (8.5%) |
| Utilities | 42 (100.0%) | 0 (0.0%) |
| Information | 7 (24.1%) | 22 (75.9%) |
| Finance & Insurance | 0 (0.0%) | 63 (100.0%) |
| Real Estate, Rental & Leasing | 93 (59.2%) | 64 (40.8%) |
| Professional & Scientific | 182 (64.5%) | 100 (35.5%) |
| Enterprise Management | 0 (0.0%) | 0 (0.0%) |
| Administrative & Support | 222 (57.2%) | 166 (42.8%) |
| Educational Services | 271 (49.0%) | 282 (51.0%) |
| Health Care & Social Assistance | 362 (44.2%) | 457 (55.8%) |
| Arts, Entertainment & Recreation | 57 (66.3%) | 29 (33.7%) |
| Accommodation & Food Services | 208 (32.8%) | 426 (67.2%) |
| Public Administration | 64 (87.7%) | 9 (12.3%) |
| Total | 2,361 (53.0%) | 2,090 (47.0%) |
Education in Murrells Inlet
School Enrollment in Murrells Inlet
The most common levels of schooling among the 1,632 students in Murrells Inlet are high school (445 | 27.3%), college / undergraduate (423 | 25.9%), and middle school (289 | 17.7%).
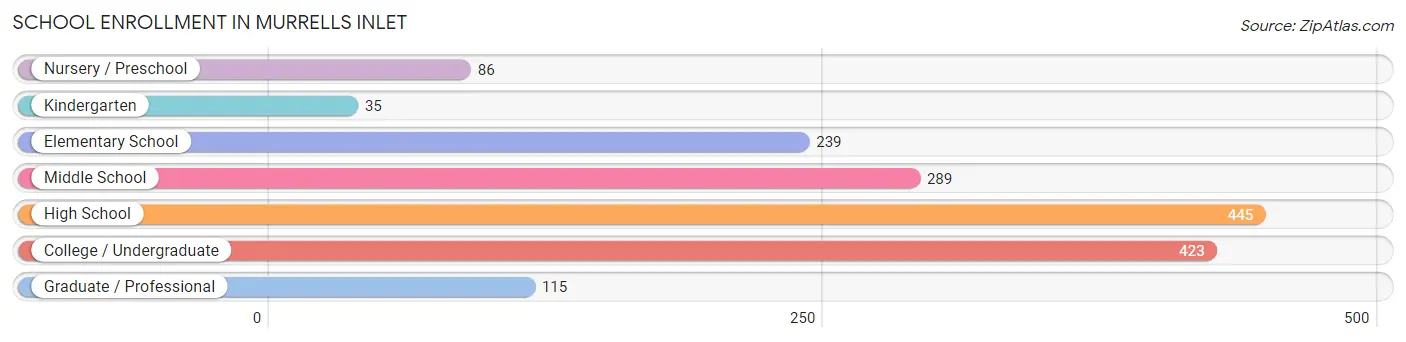
| School Level | # Students | % Students |
| Nursery / Preschool | 86 | 5.3% |
| Kindergarten | 35 | 2.1% |
| Elementary School | 239 | 14.6% |
| Middle School | 289 | 17.7% |
| High School | 445 | 27.3% |
| College / Undergraduate | 423 | 25.9% |
| Graduate / Professional | 115 | 7.0% |
| Total | 1,632 | 100.0% |
School Enrollment by Age by Funding Source in Murrells Inlet
Out of a total of 1,632 students who are enrolled in schools in Murrells Inlet, 246 (15.1%) attend a private institution, while the remaining 1,386 (84.9%) are enrolled in public schools. The age group of 18 to 19 year olds has the highest likelihood of being enrolled in private schools, with 72 (34.9% in the age bracket) enrolled. Conversely, the age group of 3 to 4 year olds has the lowest likelihood of being enrolled in a private school, with 52 (100.0% in the age bracket) attending a public institution.
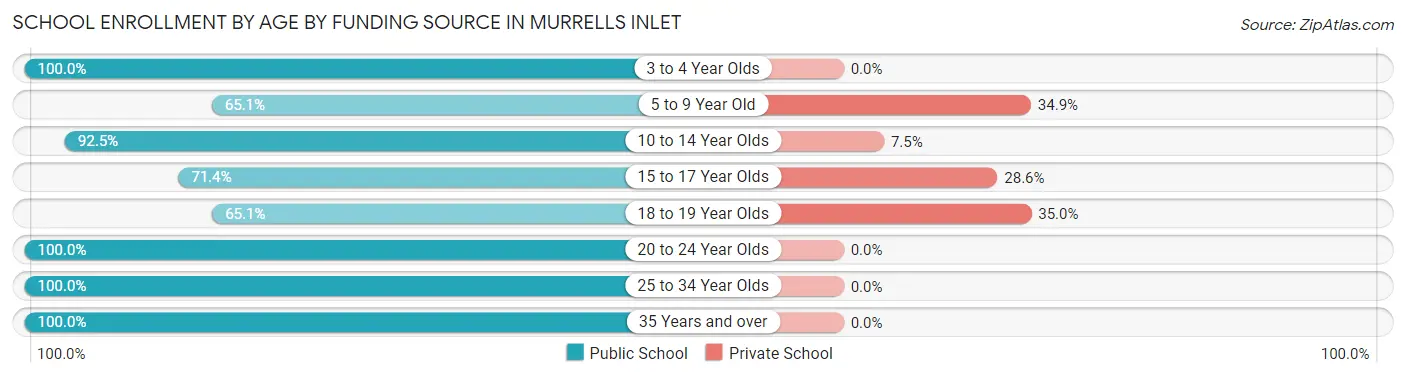
| Age Bracket | Public School | Private School |
| 3 to 4 Year Olds | 52 (100.0%) | 0 (0.0%) |
| 5 to 9 Year Old | 127 (65.1%) | 68 (34.9%) |
| 10 to 14 Year Olds | 431 (92.5%) | 35 (7.5%) |
| 15 to 17 Year Olds | 177 (71.4%) | 71 (28.6%) |
| 18 to 19 Year Olds | 134 (65.0%) | 72 (34.9%) |
| 20 to 24 Year Olds | 226 (100.0%) | 0 (0.0%) |
| 25 to 34 Year Olds | 107 (100.0%) | 0 (0.0%) |
| 35 Years and over | 132 (100.0%) | 0 (0.0%) |
| Total | 1,386 (84.9%) | 246 (15.1%) |
Educational Attainment by Field of Study in Murrells Inlet
Business (811 | 21.3%), education (636 | 16.7%), science & technology (315 | 8.3%), arts & humanities (308 | 8.1%), and social sciences (300 | 7.9%) are the most common fields of study among 3,810 individuals in Murrells Inlet who have obtained a bachelor's degree or higher.
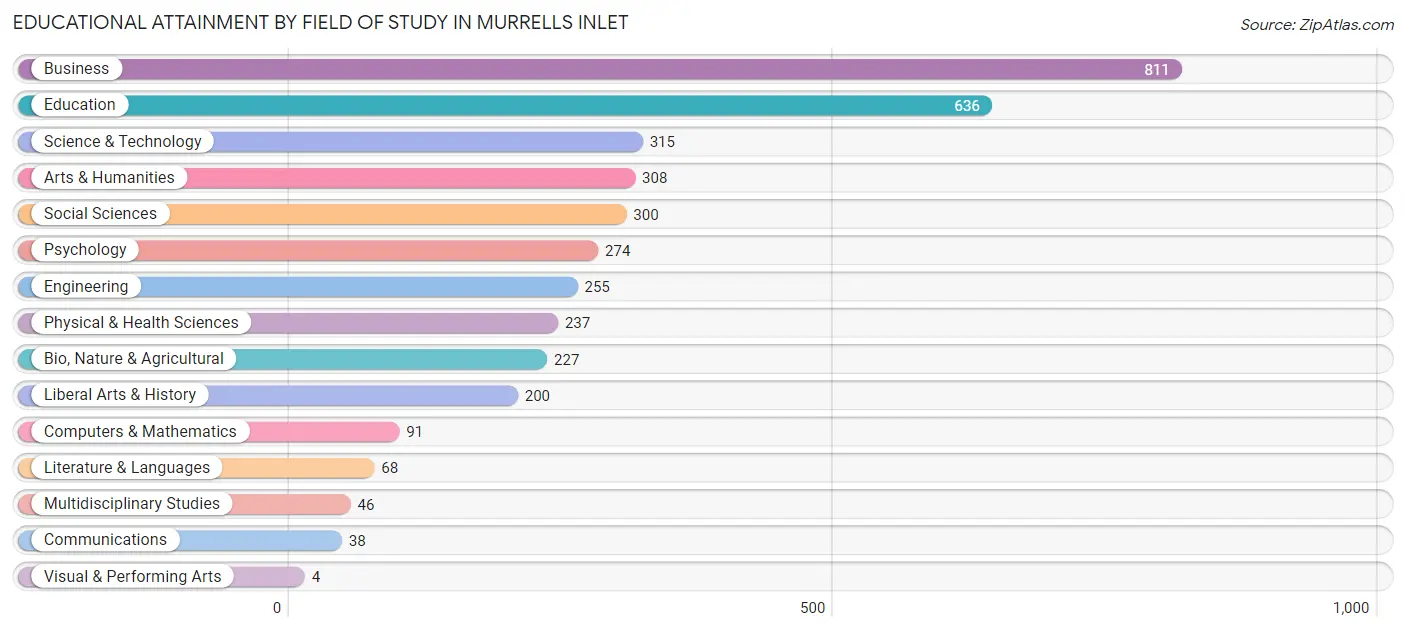
| Field of Study | # Graduates | % Graduates |
| Computers & Mathematics | 91 | 2.4% |
| Bio, Nature & Agricultural | 227 | 6.0% |
| Physical & Health Sciences | 237 | 6.2% |
| Psychology | 274 | 7.2% |
| Social Sciences | 300 | 7.9% |
| Engineering | 255 | 6.7% |
| Multidisciplinary Studies | 46 | 1.2% |
| Science & Technology | 315 | 8.3% |
| Business | 811 | 21.3% |
| Education | 636 | 16.7% |
| Literature & Languages | 68 | 1.8% |
| Liberal Arts & History | 200 | 5.2% |
| Visual & Performing Arts | 4 | 0.1% |
| Communications | 38 | 1.0% |
| Arts & Humanities | 308 | 8.1% |
| Total | 3,810 | 100.0% |
Transportation & Commute in Murrells Inlet
Vehicle Availability by Sex in Murrells Inlet
The most prevalent vehicle ownership categories in Murrells Inlet are males with 2 vehicles (1,067, accounting for 45.7%) and females with 2 vehicles (769, making up 52.1%).
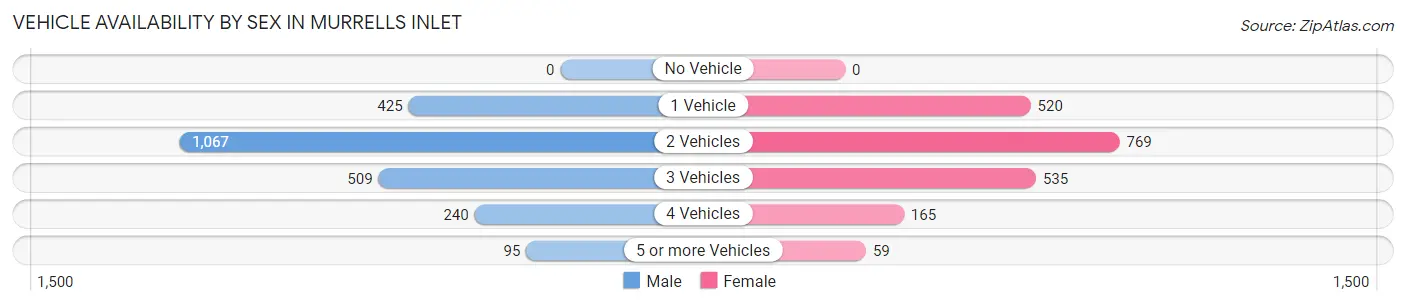
| Vehicles Available | Male | Female |
| No Vehicle | 0 (0.0%) | 0 (0.0%) |
| 1 Vehicle | 425 (18.2%) | 520 (25.4%) |
| 2 Vehicles | 1,067 (45.7%) | 769 (37.6%) |
| 3 Vehicles | 509 (21.8%) | 535 (26.1%) |
| 4 Vehicles | 240 (10.3%) | 165 (8.1%) |
| 5 or more Vehicles | 95 (4.1%) | 59 (2.9%) |
| Total | 2,336 (100.0%) | 2,048 (100.0%) |
Commute Time in Murrells Inlet
The most frequently occuring commute durations in Murrells Inlet are 15 to 19 minutes (805 commuters, 20.8%), 5 to 9 minutes (701 commuters, 18.1%), and 20 to 24 minutes (608 commuters, 15.7%).
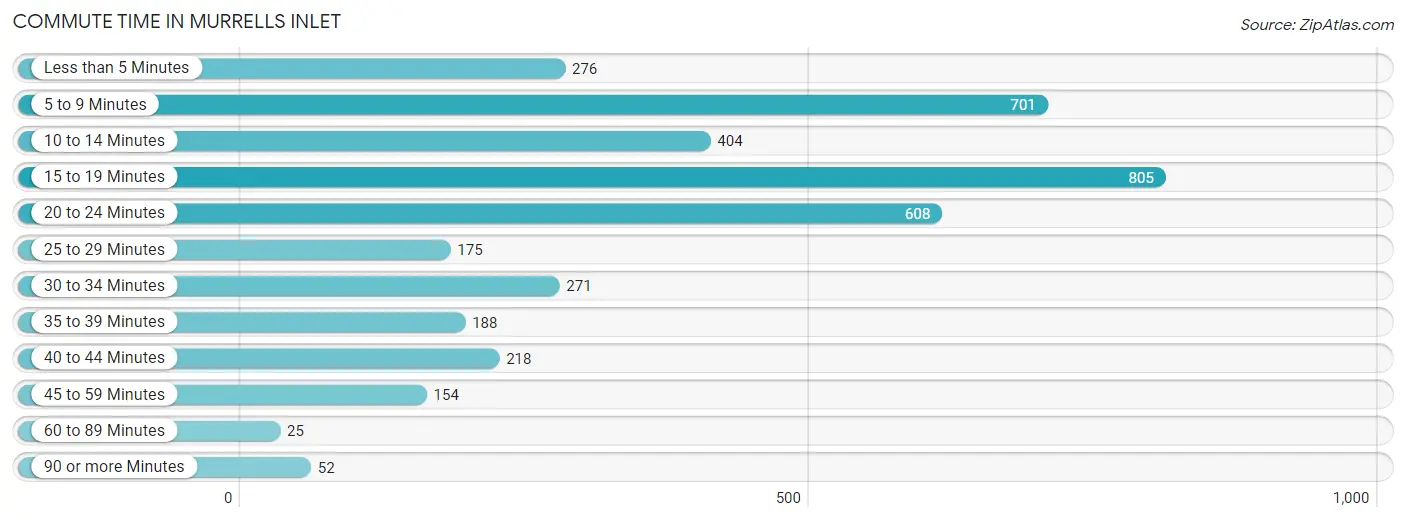
| Commute Time | # Commuters | % Commuters |
| Less than 5 Minutes | 276 | 7.1% |
| 5 to 9 Minutes | 701 | 18.1% |
| 10 to 14 Minutes | 404 | 10.4% |
| 15 to 19 Minutes | 805 | 20.8% |
| 20 to 24 Minutes | 608 | 15.7% |
| 25 to 29 Minutes | 175 | 4.5% |
| 30 to 34 Minutes | 271 | 7.0% |
| 35 to 39 Minutes | 188 | 4.9% |
| 40 to 44 Minutes | 218 | 5.6% |
| 45 to 59 Minutes | 154 | 4.0% |
| 60 to 89 Minutes | 25 | 0.6% |
| 90 or more Minutes | 52 | 1.3% |
Commute Time by Sex in Murrells Inlet
The most common commute times in Murrells Inlet are 5 to 9 minutes (441 commuters, 21.4%) for males and 20 to 24 minutes (408 commuters, 22.5%) for females.
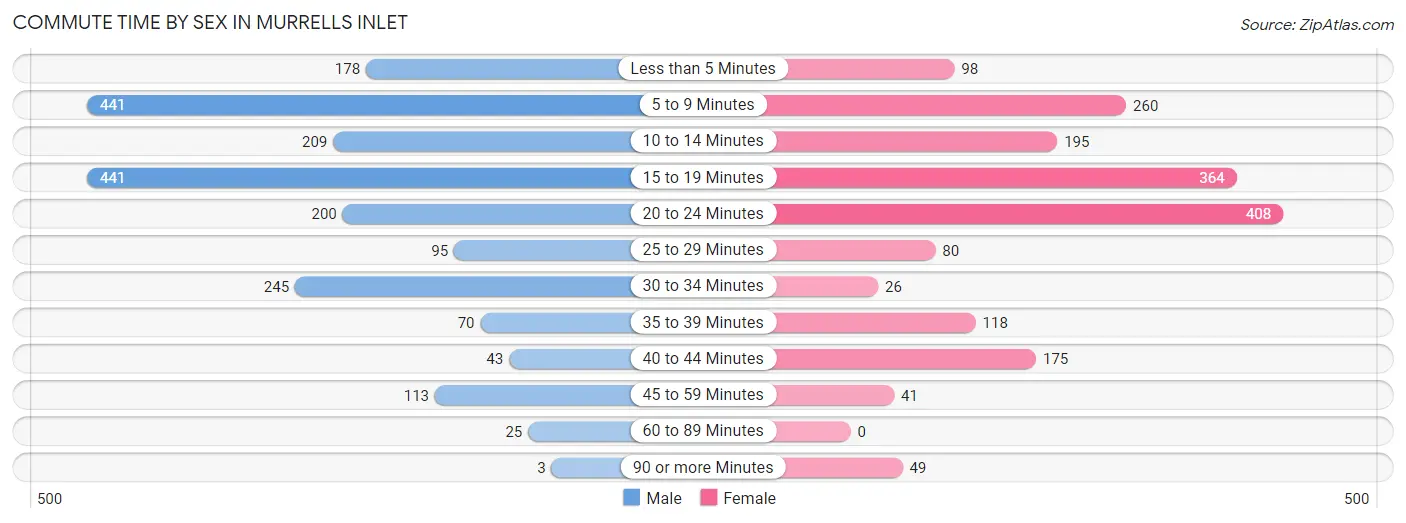
| Commute Time | Male | Female |
| Less than 5 Minutes | 178 (8.6%) | 98 (5.4%) |
| 5 to 9 Minutes | 441 (21.4%) | 260 (14.3%) |
| 10 to 14 Minutes | 209 (10.1%) | 195 (10.7%) |
| 15 to 19 Minutes | 441 (21.4%) | 364 (20.1%) |
| 20 to 24 Minutes | 200 (9.7%) | 408 (22.5%) |
| 25 to 29 Minutes | 95 (4.6%) | 80 (4.4%) |
| 30 to 34 Minutes | 245 (11.9%) | 26 (1.4%) |
| 35 to 39 Minutes | 70 (3.4%) | 118 (6.5%) |
| 40 to 44 Minutes | 43 (2.1%) | 175 (9.7%) |
| 45 to 59 Minutes | 113 (5.5%) | 41 (2.3%) |
| 60 to 89 Minutes | 25 (1.2%) | 0 (0.0%) |
| 90 or more Minutes | 3 (0.2%) | 49 (2.7%) |
Time of Departure to Work by Sex in Murrells Inlet
The most frequent times of departure to work in Murrells Inlet are 6:30 AM to 6:59 AM (362, 17.5%) for males and 12:00 PM to 3:59 PM (238, 13.1%) for females.
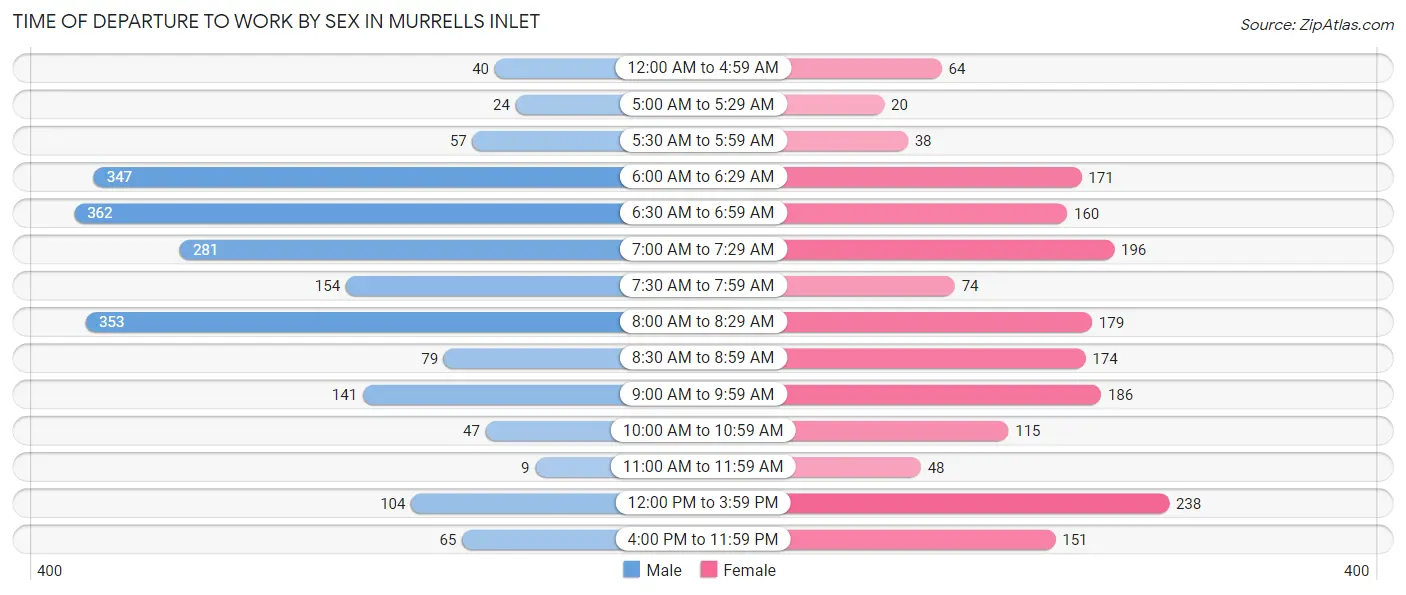
| Time of Departure | Male | Female |
| 12:00 AM to 4:59 AM | 40 (1.9%) | 64 (3.5%) |
| 5:00 AM to 5:29 AM | 24 (1.2%) | 20 (1.1%) |
| 5:30 AM to 5:59 AM | 57 (2.8%) | 38 (2.1%) |
| 6:00 AM to 6:29 AM | 347 (16.8%) | 171 (9.4%) |
| 6:30 AM to 6:59 AM | 362 (17.5%) | 160 (8.8%) |
| 7:00 AM to 7:29 AM | 281 (13.6%) | 196 (10.8%) |
| 7:30 AM to 7:59 AM | 154 (7.5%) | 74 (4.1%) |
| 8:00 AM to 8:29 AM | 353 (17.1%) | 179 (9.9%) |
| 8:30 AM to 8:59 AM | 79 (3.8%) | 174 (9.6%) |
| 9:00 AM to 9:59 AM | 141 (6.8%) | 186 (10.2%) |
| 10:00 AM to 10:59 AM | 47 (2.3%) | 115 (6.3%) |
| 11:00 AM to 11:59 AM | 9 (0.4%) | 48 (2.6%) |
| 12:00 PM to 3:59 PM | 104 (5.0%) | 238 (13.1%) |
| 4:00 PM to 11:59 PM | 65 (3.2%) | 151 (8.3%) |
| Total | 2,063 (100.0%) | 1,814 (100.0%) |
Housing Occupancy in Murrells Inlet
Occupancy by Ownership in Murrells Inlet
Of the total 4,576 dwellings in Murrells Inlet, owner-occupied units account for 3,901 (85.3%), while renter-occupied units make up 675 (14.7%).
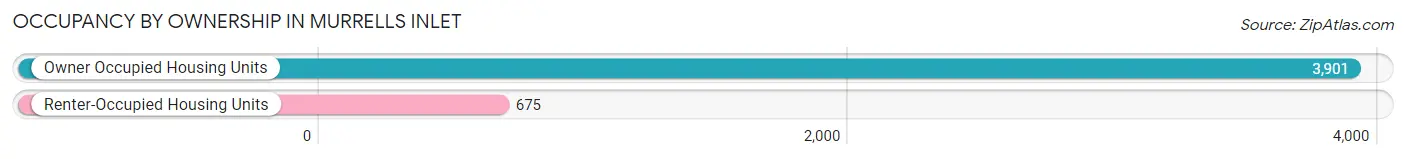
| Occupancy | # Housing Units | % Housing Units |
| Owner Occupied Housing Units | 3,901 | 85.3% |
| Renter-Occupied Housing Units | 675 | 14.7% |
| Total Occupied Housing Units | 4,576 | 100.0% |
Occupancy by Household Size in Murrells Inlet
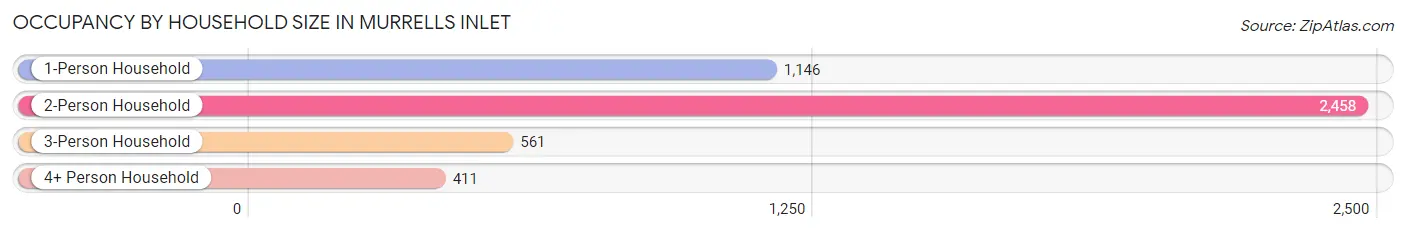
| Household Size | # Housing Units | % Housing Units |
| 1-Person Household | 1,146 | 25.0% |
| 2-Person Household | 2,458 | 53.7% |
| 3-Person Household | 561 | 12.3% |
| 4+ Person Household | 411 | 9.0% |
| Total Housing Units | 4,576 | 100.0% |
Occupancy by Ownership by Household Size in Murrells Inlet
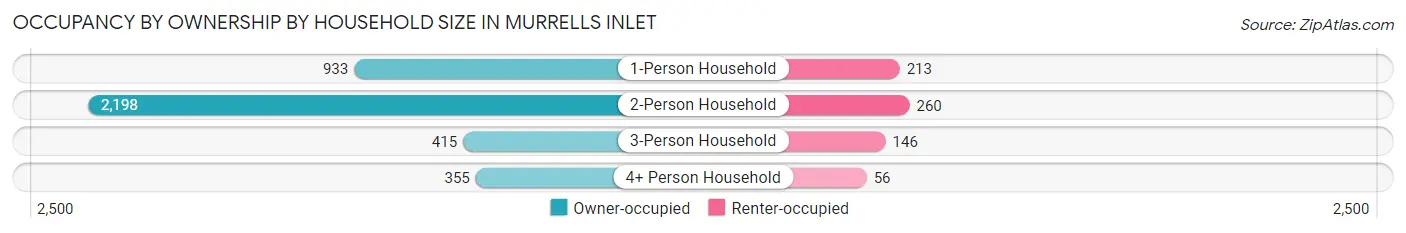
| Household Size | Owner-occupied | Renter-occupied |
| 1-Person Household | 933 (81.4%) | 213 (18.6%) |
| 2-Person Household | 2,198 (89.4%) | 260 (10.6%) |
| 3-Person Household | 415 (74.0%) | 146 (26.0%) |
| 4+ Person Household | 355 (86.4%) | 56 (13.6%) |
| Total Housing Units | 3,901 (85.3%) | 675 (14.7%) |
Occupancy by Educational Attainment in Murrells Inlet
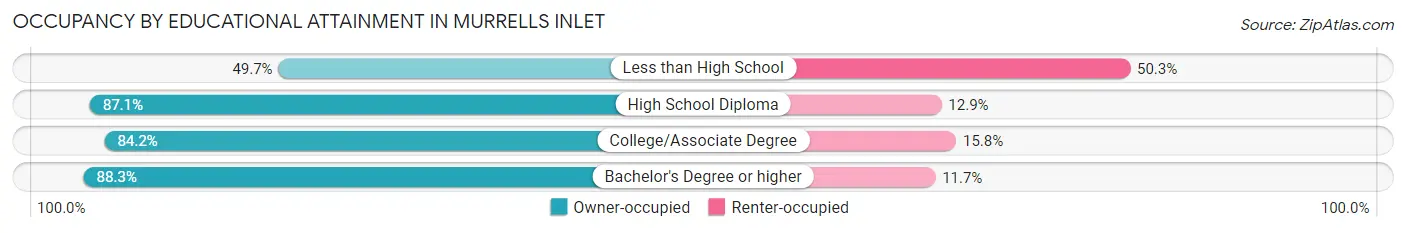
| Household Size | Owner-occupied | Renter-occupied |
| Less than High School | 75 (49.7%) | 76 (50.3%) |
| High School Diploma | 687 (87.1%) | 102 (12.9%) |
| College/Associate Degree | 1,456 (84.2%) | 274 (15.8%) |
| Bachelor's Degree or higher | 1,683 (88.3%) | 223 (11.7%) |
Occupancy by Age of Householder in Murrells Inlet
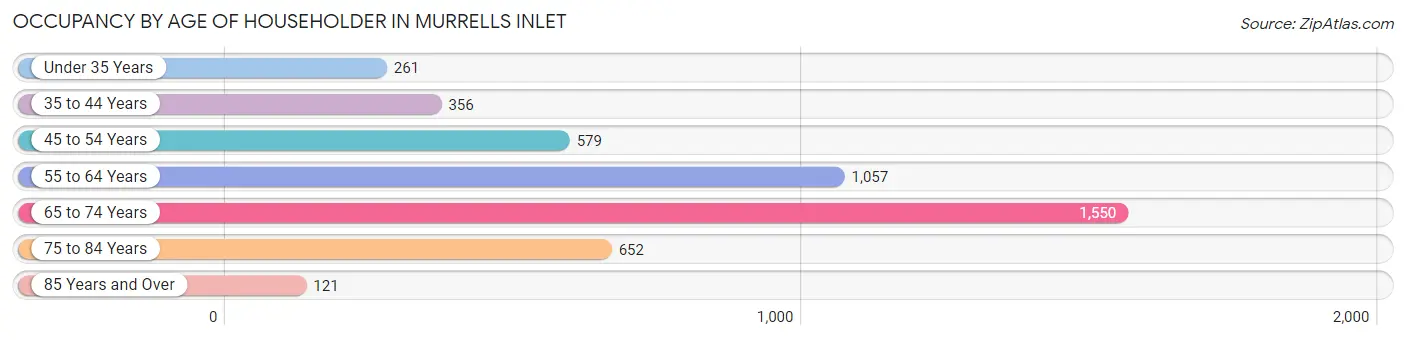
| Age Bracket | # Households | % Households |
| Under 35 Years | 261 | 5.7% |
| 35 to 44 Years | 356 | 7.8% |
| 45 to 54 Years | 579 | 12.7% |
| 55 to 64 Years | 1,057 | 23.1% |
| 65 to 74 Years | 1,550 | 33.9% |
| 75 to 84 Years | 652 | 14.2% |
| 85 Years and Over | 121 | 2.6% |
| Total | 4,576 | 100.0% |
Housing Finances in Murrells Inlet
Median Income by Occupancy in Murrells Inlet
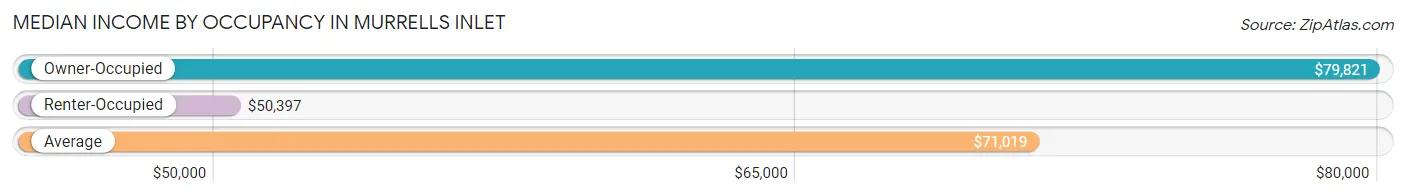
| Occupancy Type | # Households | Median Income |
| Owner-Occupied | 3,901 (85.3%) | $79,821 |
| Renter-Occupied | 675 (14.7%) | $50,397 |
| Average | 4,576 (100.0%) | $71,019 |
Occupancy by Householder Income Bracket in Murrells Inlet
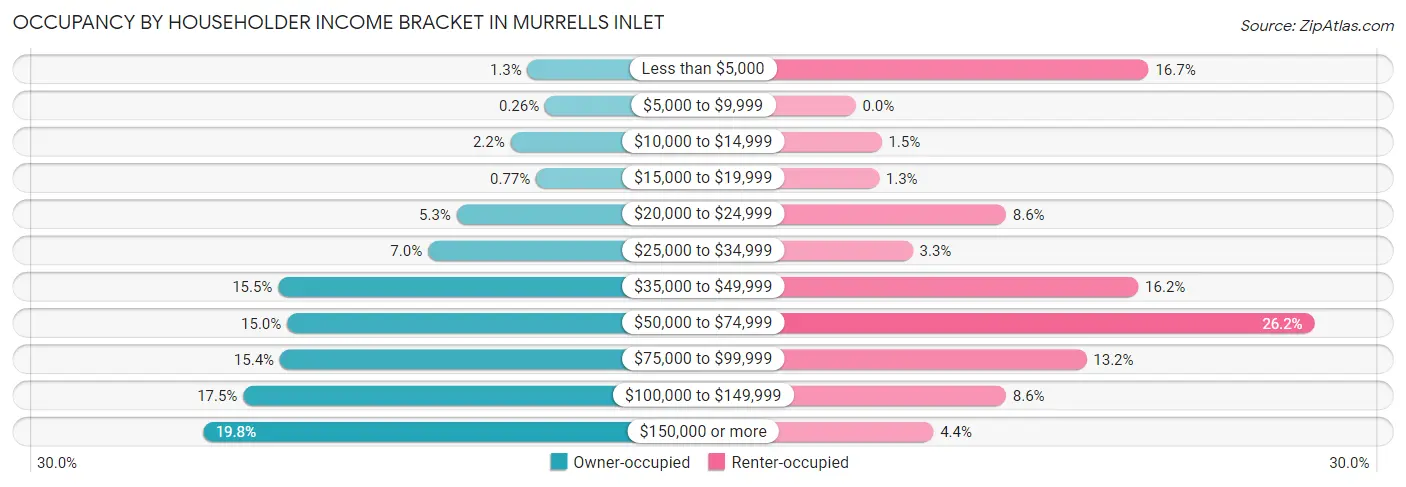
| Income Bracket | Owner-occupied | Renter-occupied |
| Less than $5,000 | 49 (1.3%) | 113 (16.7%) |
| $5,000 to $9,999 | 10 (0.3%) | 0 (0.0%) |
| $10,000 to $14,999 | 87 (2.2%) | 10 (1.5%) |
| $15,000 to $19,999 | 30 (0.8%) | 9 (1.3%) |
| $20,000 to $24,999 | 207 (5.3%) | 58 (8.6%) |
| $25,000 to $34,999 | 271 (7.0%) | 22 (3.3%) |
| $35,000 to $49,999 | 605 (15.5%) | 109 (16.2%) |
| $50,000 to $74,999 | 585 (15.0%) | 177 (26.2%) |
| $75,000 to $99,999 | 601 (15.4%) | 89 (13.2%) |
| $100,000 to $149,999 | 683 (17.5%) | 58 (8.6%) |
| $150,000 or more | 773 (19.8%) | 30 (4.4%) |
| Total | 3,901 (100.0%) | 675 (100.0%) |
Monthly Housing Cost Tiers in Murrells Inlet
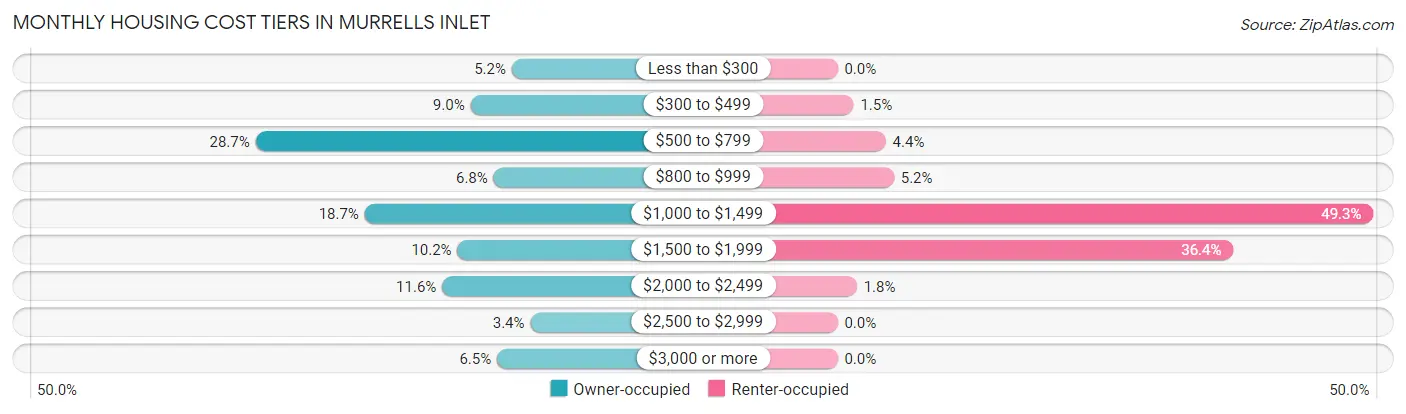
| Monthly Cost | Owner-occupied | Renter-occupied |
| Less than $300 | 201 (5.1%) | 0 (0.0%) |
| $300 to $499 | 349 (8.9%) | 10 (1.5%) |
| $500 to $799 | 1,121 (28.7%) | 30 (4.4%) |
| $800 to $999 | 266 (6.8%) | 35 (5.2%) |
| $1,000 to $1,499 | 729 (18.7%) | 333 (49.3%) |
| $1,500 to $1,999 | 396 (10.2%) | 246 (36.4%) |
| $2,000 to $2,499 | 451 (11.6%) | 12 (1.8%) |
| $2,500 to $2,999 | 134 (3.4%) | 0 (0.0%) |
| $3,000 or more | 254 (6.5%) | 0 (0.0%) |
| Total | 3,901 (100.0%) | 675 (100.0%) |
Physical Housing Characteristics in Murrells Inlet
Housing Structures in Murrells Inlet
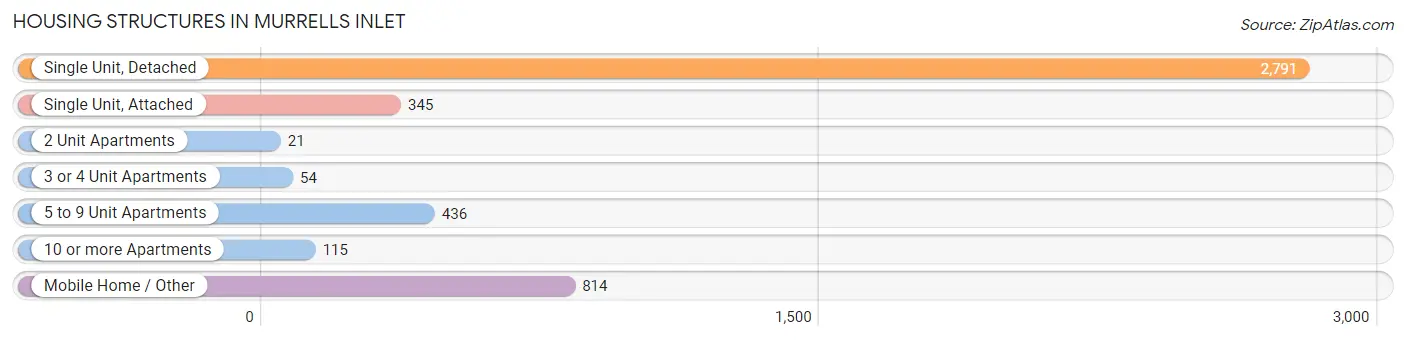
| Structure Type | # Housing Units | % Housing Units |
| Single Unit, Detached | 2,791 | 61.0% |
| Single Unit, Attached | 345 | 7.5% |
| 2 Unit Apartments | 21 | 0.5% |
| 3 or 4 Unit Apartments | 54 | 1.2% |
| 5 to 9 Unit Apartments | 436 | 9.5% |
| 10 or more Apartments | 115 | 2.5% |
| Mobile Home / Other | 814 | 17.8% |
| Total | 4,576 | 100.0% |
Housing Structures by Occupancy in Murrells Inlet
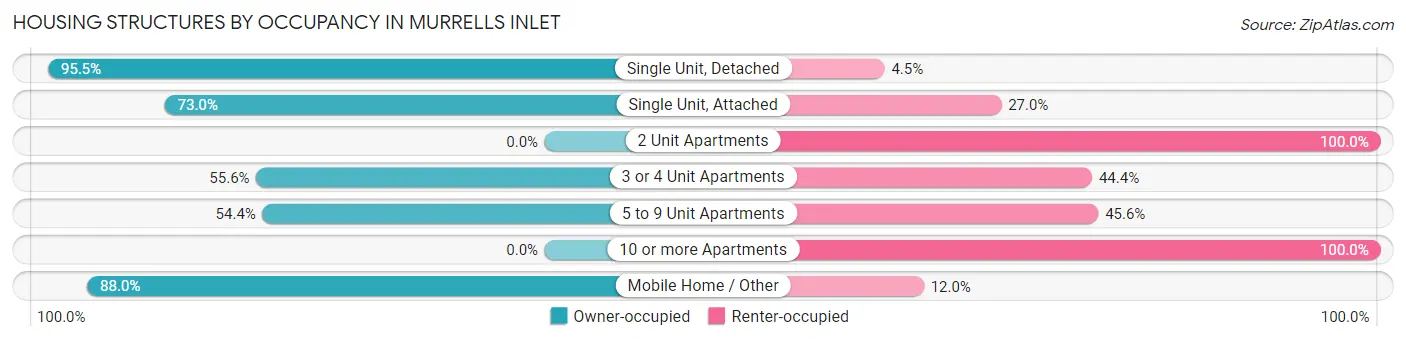
| Structure Type | Owner-occupied | Renter-occupied |
| Single Unit, Detached | 2,666 (95.5%) | 125 (4.5%) |
| Single Unit, Attached | 252 (73.0%) | 93 (27.0%) |
| 2 Unit Apartments | 0 (0.0%) | 21 (100.0%) |
| 3 or 4 Unit Apartments | 30 (55.6%) | 24 (44.4%) |
| 5 to 9 Unit Apartments | 237 (54.4%) | 199 (45.6%) |
| 10 or more Apartments | 0 (0.0%) | 115 (100.0%) |
| Mobile Home / Other | 716 (88.0%) | 98 (12.0%) |
| Total | 3,901 (85.3%) | 675 (14.7%) |
Housing Structures by Number of Rooms in Murrells Inlet
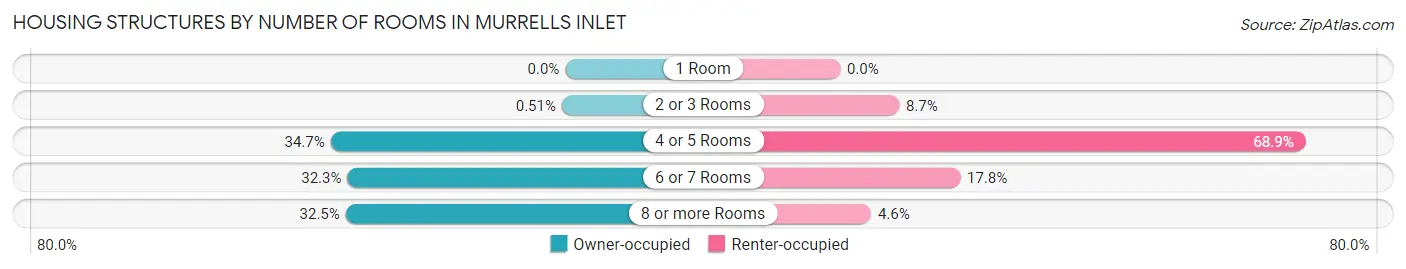
| Number of Rooms | Owner-occupied | Renter-occupied |
| 1 Room | 0 (0.0%) | 0 (0.0%) |
| 2 or 3 Rooms | 20 (0.5%) | 59 (8.7%) |
| 4 or 5 Rooms | 1,355 (34.7%) | 465 (68.9%) |
| 6 or 7 Rooms | 1,258 (32.3%) | 120 (17.8%) |
| 8 or more Rooms | 1,268 (32.5%) | 31 (4.6%) |
| Total | 3,901 (100.0%) | 675 (100.0%) |
Housing Structure by Heating Type in Murrells Inlet
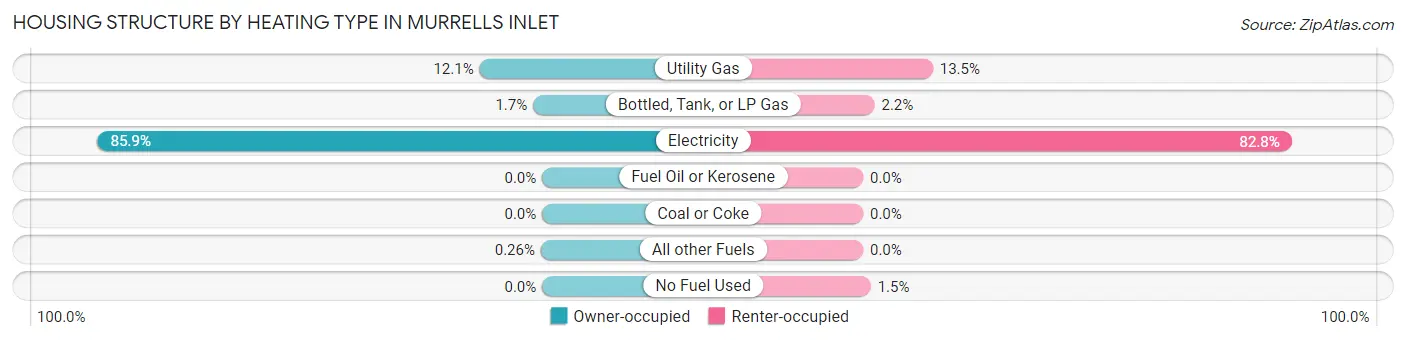
| Heating Type | Owner-occupied | Renter-occupied |
| Utility Gas | 472 (12.1%) | 91 (13.5%) |
| Bottled, Tank, or LP Gas | 68 (1.7%) | 15 (2.2%) |
| Electricity | 3,351 (85.9%) | 559 (82.8%) |
| Fuel Oil or Kerosene | 0 (0.0%) | 0 (0.0%) |
| Coal or Coke | 0 (0.0%) | 0 (0.0%) |
| All other Fuels | 10 (0.3%) | 0 (0.0%) |
| No Fuel Used | 0 (0.0%) | 10 (1.5%) |
| Total | 3,901 (100.0%) | 675 (100.0%) |
Household Vehicle Usage in Murrells Inlet
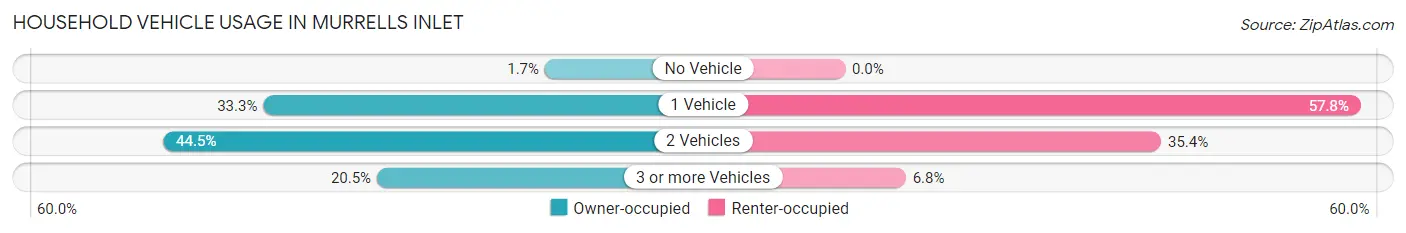
| Vehicles per Household | Owner-occupied | Renter-occupied |
| No Vehicle | 67 (1.7%) | 0 (0.0%) |
| 1 Vehicle | 1,298 (33.3%) | 390 (57.8%) |
| 2 Vehicles | 1,735 (44.5%) | 239 (35.4%) |
| 3 or more Vehicles | 801 (20.5%) | 46 (6.8%) |
| Total | 3,901 (100.0%) | 675 (100.0%) |
Real Estate & Mortgages in Murrells Inlet
Real Estate and Mortgage Overview in Murrells Inlet
| Characteristic | Without Mortgage | With Mortgage |
| Housing Units | 1,629 | 2,272 |
| Median Property Value | $257,700 | $368,900 |
| Median Household Income | $61,488 | $643 |
| Monthly Housing Costs | $584 | $254 |
| Real Estate Taxes | $1,199 | $51 |
Property Value by Mortgage Status in Murrells Inlet
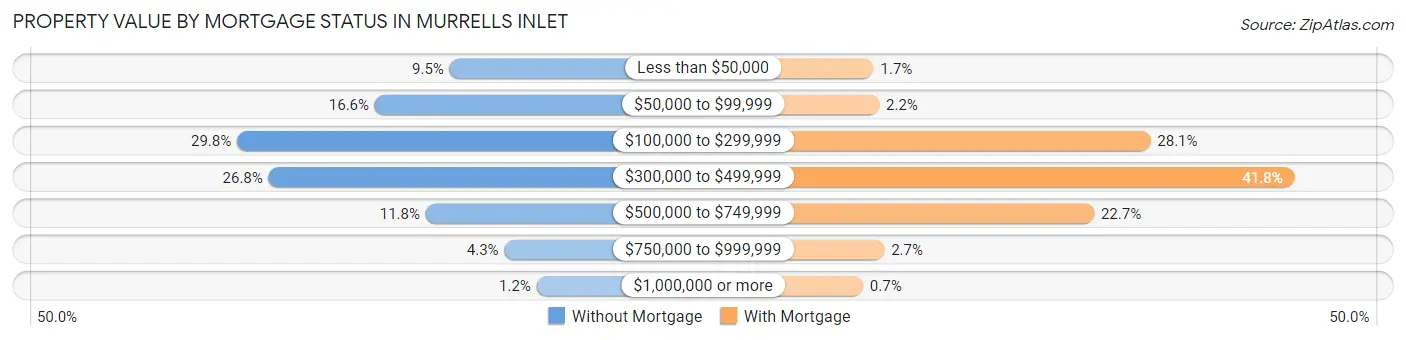
| Property Value | Without Mortgage | With Mortgage |
| Less than $50,000 | 155 (9.5%) | 39 (1.7%) |
| $50,000 to $99,999 | 271 (16.6%) | 51 (2.2%) |
| $100,000 to $299,999 | 485 (29.8%) | 638 (28.1%) |
| $300,000 to $499,999 | 436 (26.8%) | 950 (41.8%) |
| $500,000 to $749,999 | 192 (11.8%) | 516 (22.7%) |
| $750,000 to $999,999 | 70 (4.3%) | 62 (2.7%) |
| $1,000,000 or more | 20 (1.2%) | 16 (0.7%) |
| Total | 1,629 (100.0%) | 2,272 (100.0%) |
Household Income by Mortgage Status in Murrells Inlet
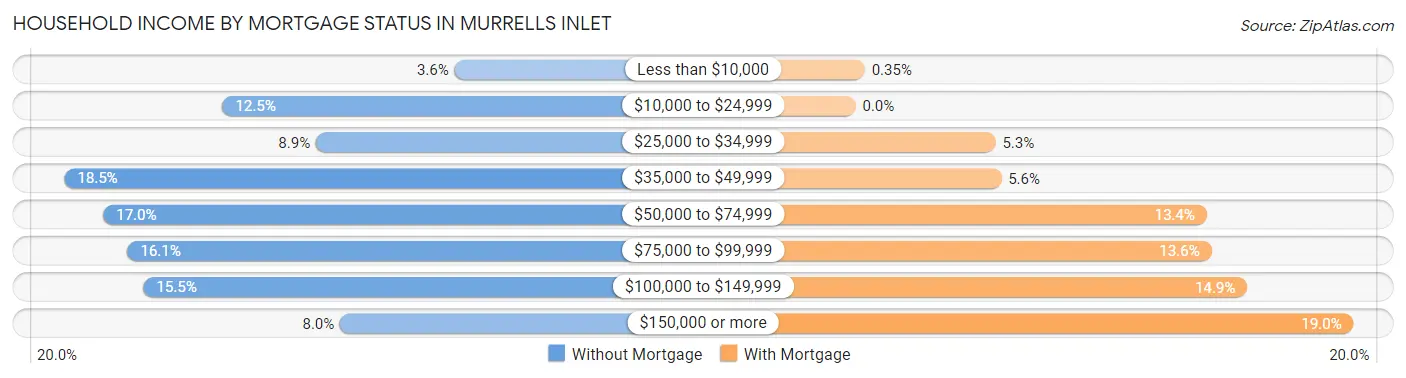
| Household Income | Without Mortgage | With Mortgage |
| Less than $10,000 | 59 (3.6%) | 8 (0.4%) |
| $10,000 to $24,999 | 203 (12.5%) | 0 (0.0%) |
| $25,000 to $34,999 | 145 (8.9%) | 121 (5.3%) |
| $35,000 to $49,999 | 301 (18.5%) | 126 (5.6%) |
| $50,000 to $74,999 | 277 (17.0%) | 304 (13.4%) |
| $75,000 to $99,999 | 262 (16.1%) | 308 (13.6%) |
| $100,000 to $149,999 | 252 (15.5%) | 339 (14.9%) |
| $150,000 or more | 130 (8.0%) | 431 (19.0%) |
| Total | 1,629 (100.0%) | 2,272 (100.0%) |
Property Value to Household Income Ratio in Murrells Inlet
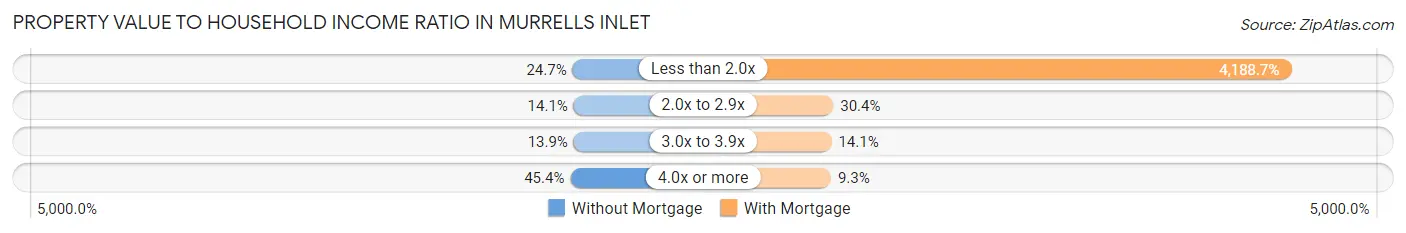
| Value-to-Income Ratio | Without Mortgage | With Mortgage |
| Less than 2.0x | 403 (24.7%) | 95,167 (4,188.7%) |
| 2.0x to 2.9x | 229 (14.1%) | 690 (30.4%) |
| 3.0x to 3.9x | 227 (13.9%) | 320 (14.1%) |
| 4.0x or more | 739 (45.4%) | 212 (9.3%) |
| Total | 1,629 (100.0%) | 2,272 (100.0%) |
Real Estate Taxes by Mortgage Status in Murrells Inlet
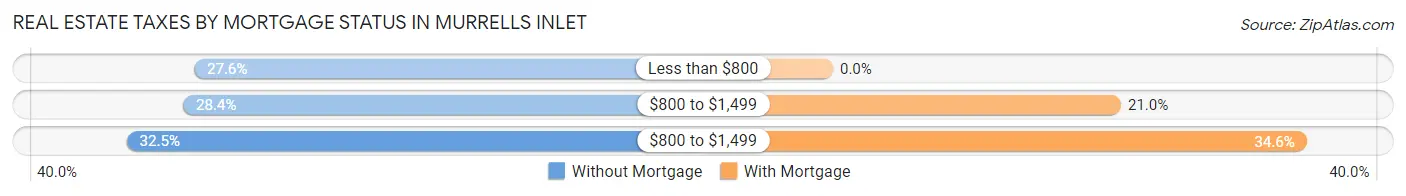
| Property Taxes | Without Mortgage | With Mortgage |
| Less than $800 | 450 (27.6%) | 0 (0.0%) |
| $800 to $1,499 | 463 (28.4%) | 478 (21.0%) |
| $800 to $1,499 | 530 (32.5%) | 786 (34.6%) |
| Total | 1,629 (100.0%) | 2,272 (100.0%) |
Health & Disability in Murrells Inlet
Health Insurance Coverage by Age in Murrells Inlet
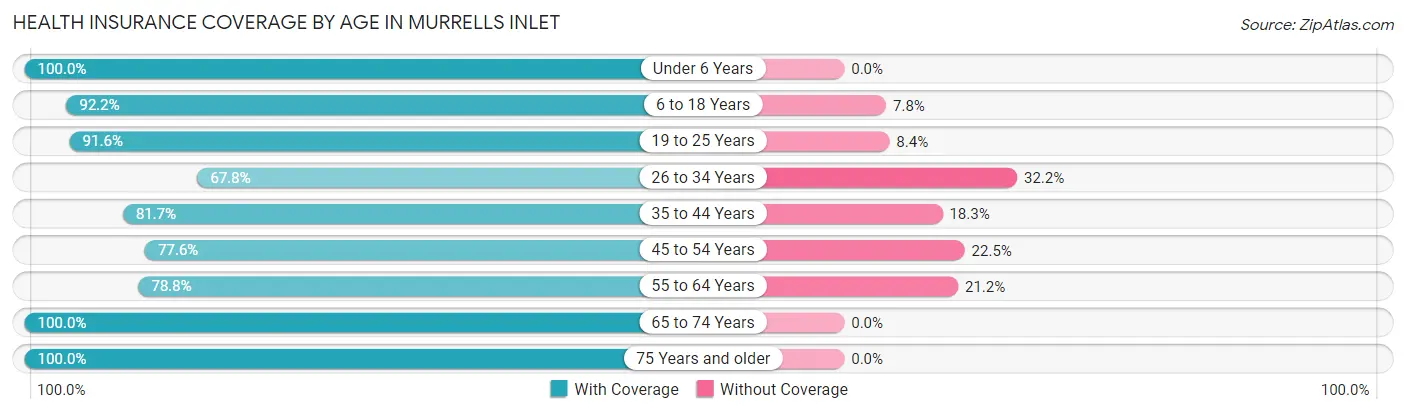
| Age Bracket | With Coverage | Without Coverage |
| Under 6 Years | 222 (100.0%) | 0 (0.0%) |
| 6 to 18 Years | 899 (92.2%) | 76 (7.8%) |
| 19 to 25 Years | 697 (91.6%) | 64 (8.4%) |
| 26 to 34 Years | 301 (67.8%) | 143 (32.2%) |
| 35 to 44 Years | 580 (81.7%) | 130 (18.3%) |
| 45 to 54 Years | 874 (77.5%) | 253 (22.5%) |
| 55 to 64 Years | 1,753 (78.8%) | 472 (21.2%) |
| 65 to 74 Years | 2,435 (100.0%) | 0 (0.0%) |
| 75 Years and older | 1,396 (100.0%) | 0 (0.0%) |
| Total | 9,157 (88.9%) | 1,138 (11.1%) |
Health Insurance Coverage by Citizenship Status in Murrells Inlet
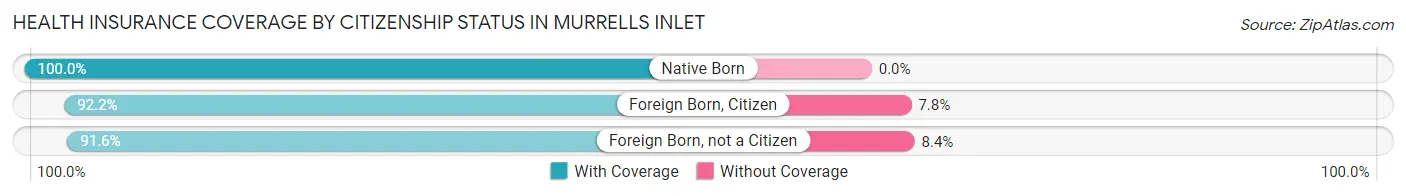
| Citizenship Status | With Coverage | Without Coverage |
| Native Born | 222 (100.0%) | 0 (0.0%) |
| Foreign Born, Citizen | 899 (92.2%) | 76 (7.8%) |
| Foreign Born, not a Citizen | 697 (91.6%) | 64 (8.4%) |
Health Insurance Coverage by Household Income in Murrells Inlet
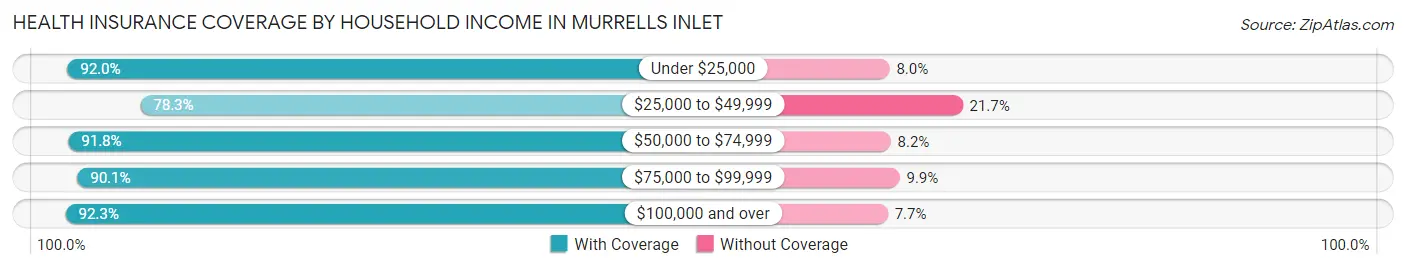
| Household Income | With Coverage | Without Coverage |
| Under $25,000 | 885 (92.0%) | 77 (8.0%) |
| $25,000 to $49,999 | 1,679 (78.3%) | 465 (21.7%) |
| $50,000 to $74,999 | 1,486 (91.8%) | 133 (8.2%) |
| $75,000 to $99,999 | 1,477 (90.1%) | 162 (9.9%) |
| $100,000 and over | 3,624 (92.3%) | 301 (7.7%) |
Public vs Private Health Insurance Coverage by Age in Murrells Inlet
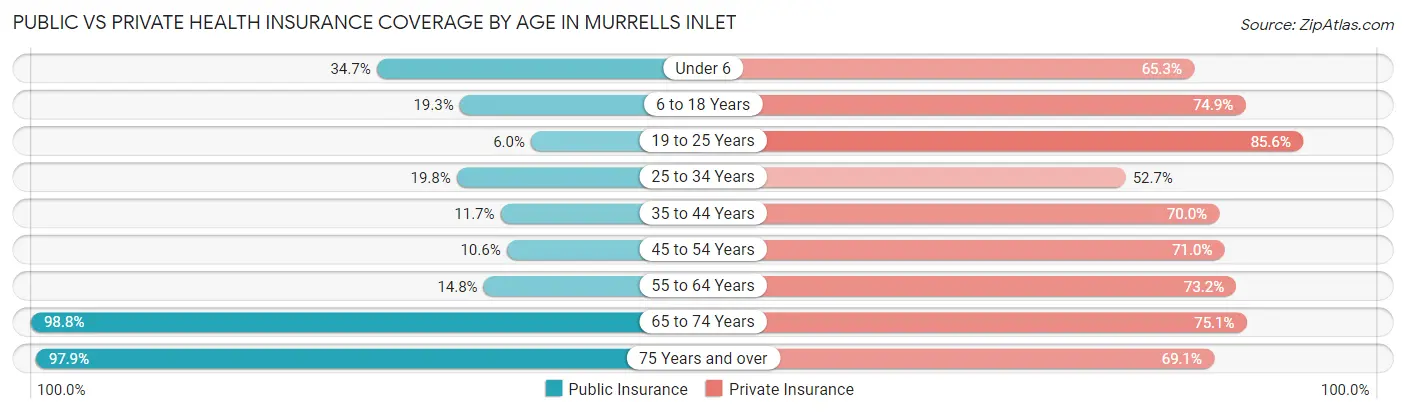
| Age Bracket | Public Insurance | Private Insurance |
| Under 6 | 77 (34.7%) | 145 (65.3%) |
| 6 to 18 Years | 188 (19.3%) | 730 (74.9%) |
| 19 to 25 Years | 46 (6.0%) | 651 (85.6%) |
| 25 to 34 Years | 88 (19.8%) | 234 (52.7%) |
| 35 to 44 Years | 83 (11.7%) | 497 (70.0%) |
| 45 to 54 Years | 119 (10.6%) | 800 (71.0%) |
| 55 to 64 Years | 330 (14.8%) | 1,628 (73.2%) |
| 65 to 74 Years | 2,406 (98.8%) | 1,828 (75.1%) |
| 75 Years and over | 1,367 (97.9%) | 964 (69.1%) |
| Total | 4,704 (45.7%) | 7,477 (72.6%) |
Disability Status by Sex by Age in Murrells Inlet
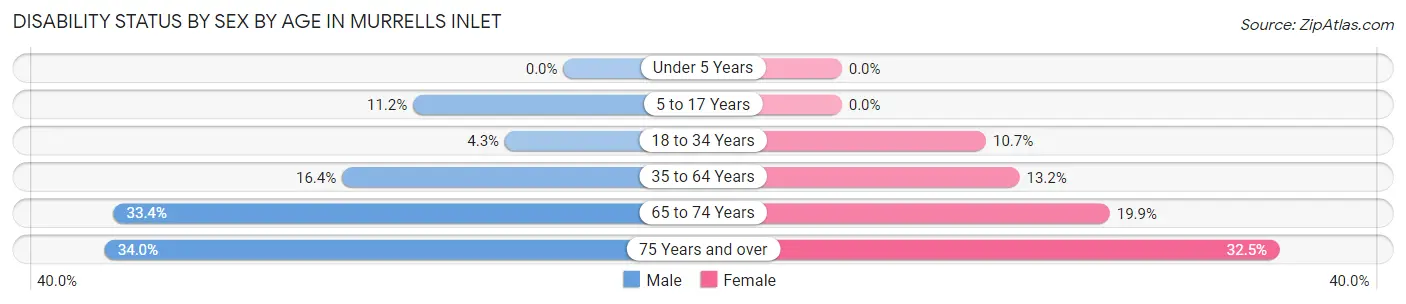
| Age Bracket | Male | Female |
| Under 5 Years | 0 (0.0%) | 0 (0.0%) |
| 5 to 17 Years | 76 (11.2%) | 0 (0.0%) |
| 18 to 34 Years | 33 (4.3%) | 62 (10.7%) |
| 35 to 64 Years | 340 (16.4%) | 263 (13.2%) |
| 65 to 74 Years | 392 (33.4%) | 251 (19.9%) |
| 75 Years and over | 193 (34.0%) | 269 (32.5%) |
Disability Class by Sex by Age in Murrells Inlet
Disability Class: Hearing Difficulty
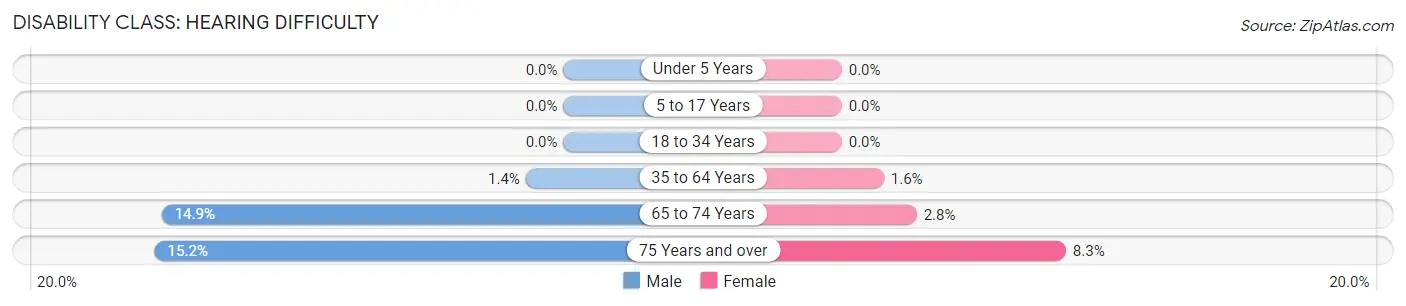
| Age Bracket | Male | Female |
| Under 5 Years | 0 (0.0%) | 0 (0.0%) |
| 5 to 17 Years | 0 (0.0%) | 0 (0.0%) |
| 18 to 34 Years | 0 (0.0%) | 0 (0.0%) |
| 35 to 64 Years | 29 (1.4%) | 31 (1.6%) |
| 65 to 74 Years | 175 (14.9%) | 35 (2.8%) |
| 75 Years and over | 86 (15.2%) | 69 (8.3%) |
Disability Class: Vision Difficulty
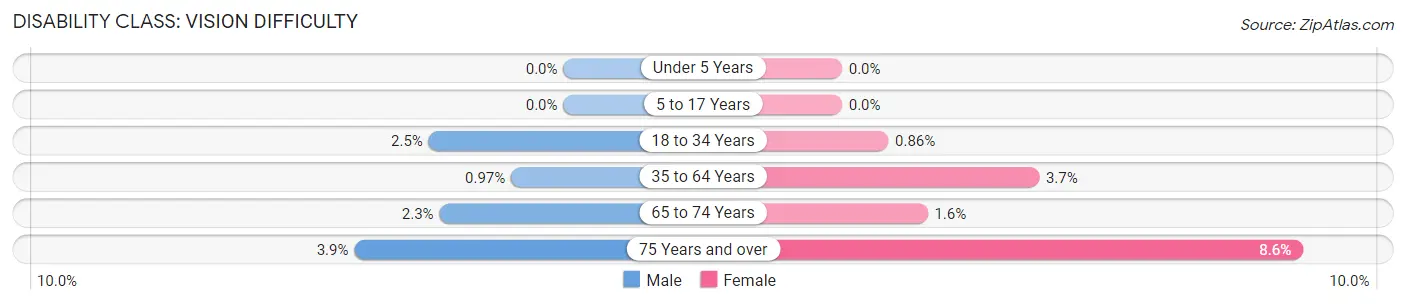
| Age Bracket | Male | Female |
| Under 5 Years | 0 (0.0%) | 0 (0.0%) |
| 5 to 17 Years | 0 (0.0%) | 0 (0.0%) |
| 18 to 34 Years | 19 (2.5%) | 5 (0.9%) |
| 35 to 64 Years | 20 (1.0%) | 73 (3.7%) |
| 65 to 74 Years | 27 (2.3%) | 20 (1.6%) |
| 75 Years and over | 22 (3.9%) | 71 (8.6%) |
Disability Class: Cognitive Difficulty
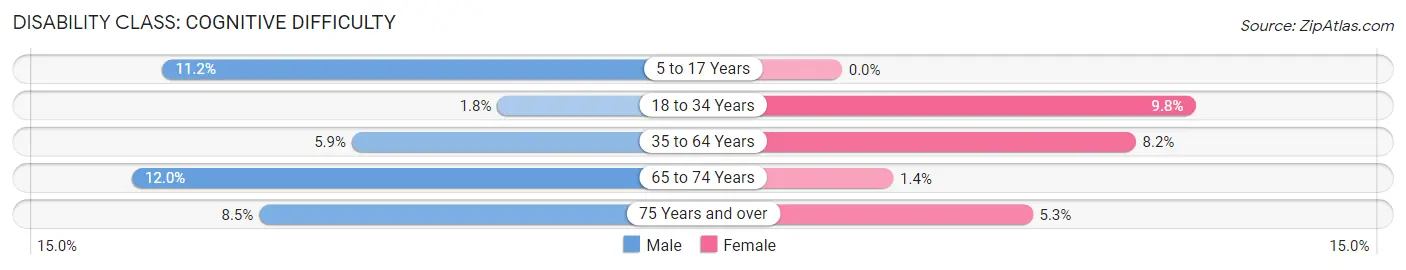
| Age Bracket | Male | Female |
| 5 to 17 Years | 76 (11.2%) | 0 (0.0%) |
| 18 to 34 Years | 14 (1.8%) | 57 (9.8%) |
| 35 to 64 Years | 122 (5.9%) | 163 (8.2%) |
| 65 to 74 Years | 141 (12.0%) | 18 (1.4%) |
| 75 Years and over | 48 (8.5%) | 44 (5.3%) |
Disability Class: Ambulatory Difficulty
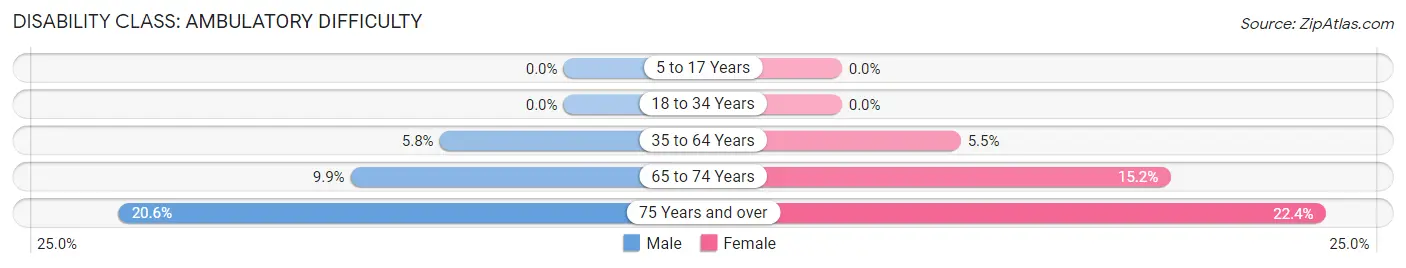
| Age Bracket | Male | Female |
| 5 to 17 Years | 0 (0.0%) | 0 (0.0%) |
| 18 to 34 Years | 0 (0.0%) | 0 (0.0%) |
| 35 to 64 Years | 119 (5.8%) | 110 (5.5%) |
| 65 to 74 Years | 116 (9.9%) | 192 (15.2%) |
| 75 Years and over | 117 (20.6%) | 186 (22.4%) |
Disability Class: Self-Care Difficulty
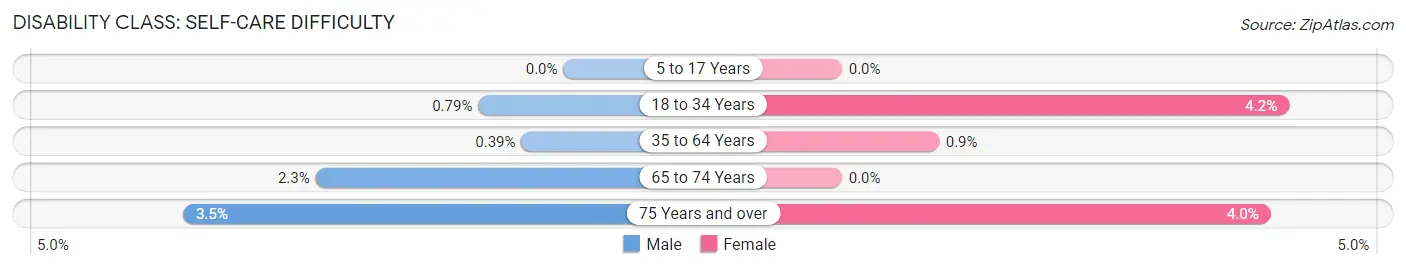
| Age Bracket | Male | Female |
| 5 to 17 Years | 0 (0.0%) | 0 (0.0%) |
| 18 to 34 Years | 6 (0.8%) | 24 (4.2%) |
| 35 to 64 Years | 8 (0.4%) | 18 (0.9%) |
| 65 to 74 Years | 27 (2.3%) | 0 (0.0%) |
| 75 Years and over | 20 (3.5%) | 33 (4.0%) |
Technology Access in Murrells Inlet
Computing Device Access in Murrells Inlet
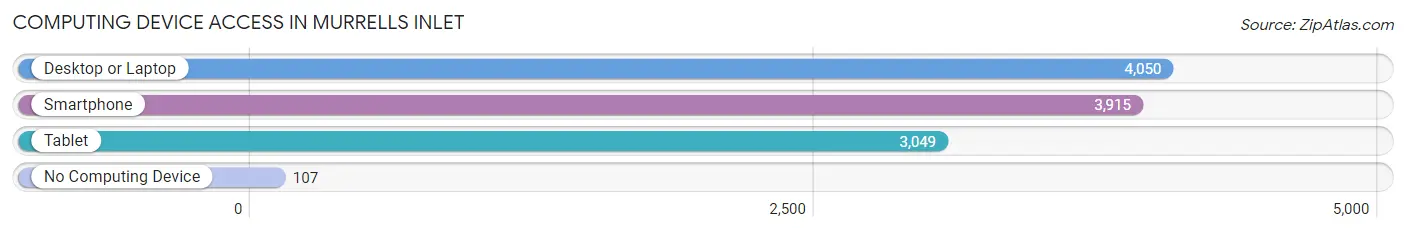
| Device Type | # Households | % Households |
| Desktop or Laptop | 4,050 | 88.5% |
| Smartphone | 3,915 | 85.6% |
| Tablet | 3,049 | 66.6% |
| No Computing Device | 107 | 2.3% |
| Total | 4,576 | 100.0% |
Internet Access in Murrells Inlet
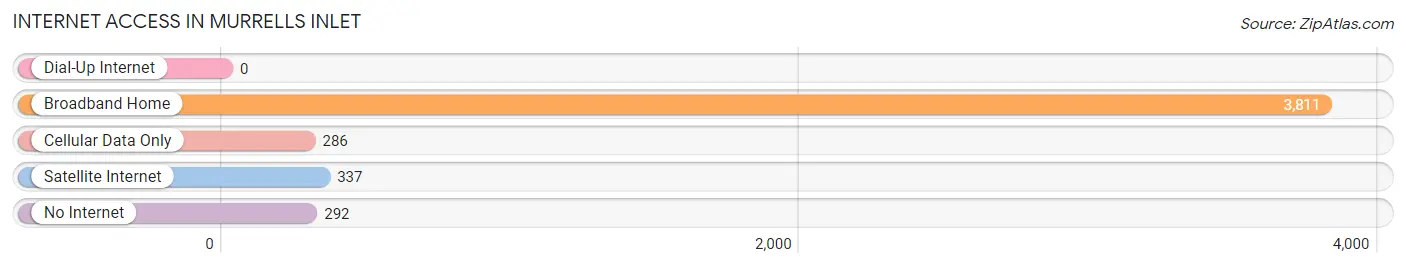
| Internet Type | # Households | % Households |
| Dial-Up Internet | 0 | 0.0% |
| Broadband Home | 3,811 | 83.3% |
| Cellular Data Only | 286 | 6.2% |
| Satellite Internet | 337 | 7.4% |
| No Internet | 292 | 6.4% |
| Total | 4,576 | 100.0% |
Murrells Inlet Summary
Murrells Inlet is a small fishing village located in Georgetown County, South Carolina. It is situated on the south end of the Grand Strand, a 60-mile stretch of beachfront along the Atlantic Ocean. The village is known for its seafood restaurants, fishing charters, and its annual Blessing of the Fleet Festival.
History
The area now known as Murrells Inlet was first settled by the Waccamaw Indians in the late 1600s. The Waccamaw were a Siouan-speaking tribe who lived in the area for centuries before the arrival of European settlers. The first Europeans to settle in the area were English colonists in the early 1700s. The area was named after Captain John Murrell, who was granted a land grant in the area in 1733.
The village of Murrells Inlet was officially established in 1845. It was a popular destination for wealthy planters from the nearby city of Georgetown, who would come to the area to hunt and fish. The village was also a popular destination for wealthy tourists from the North, who would come to the area to enjoy the mild climate and the beautiful scenery.
In the late 1800s, the village began to develop into a resort town. Hotels and boarding houses were built to accommodate the influx of tourists. The village also became a popular destination for fishermen, who would come to the area to take advantage of the abundant seafood.
Geography
Murrells Inlet is located in the southeastern corner of Georgetown County, South Carolina. It is situated on the south end of the Grand Strand, a 60-mile stretch of beachfront along the Atlantic Ocean. The village is bordered by the Waccamaw River to the north and the Atlantic Ocean to the east.
The village is located in a humid subtropical climate zone, with hot, humid summers and mild winters. The average annual temperature is around 70 degrees Fahrenheit. The average annual precipitation is around 50 inches.
Economy
The economy of Murrells Inlet is largely based on tourism and fishing. The village is a popular destination for tourists, who come to the area to enjoy the mild climate and the beautiful scenery. The village is also a popular destination for fishermen, who come to the area to take advantage of the abundant seafood.
The village is home to several seafood restaurants, fishing charters, and other tourist attractions. The village also hosts the annual Blessing of the Fleet Festival, which celebrates the local fishing industry.
Demographics
As of the 2010 census, the population of Murrells Inlet was 3,852. The racial makeup of the village was 94.3% White, 2.3% African American, 0.3% Native American, 0.7% Asian, 0.1% Pacific Islander, and 2.3% from other races. The median household income was $45,938. The per capita income was $25,945.
Conclusion
Murrells Inlet is a small fishing village located in Georgetown County, South Carolina. It is situated on the south end of the Grand Strand, a 60-mile stretch of beachfront along the Atlantic Ocean. The village is known for its seafood restaurants, fishing charters, and its annual Blessing of the Fleet Festival. The economy of Murrells Inlet is largely based on tourism and fishing, and the village is home to a diverse population of people from all walks of life.
Common Questions
What is Per Capita Income in Murrells Inlet?
Per Capita income in Murrells Inlet is $59,521.
What is the Median Family Income in Murrells Inlet?
Median Family Income in Murrells Inlet is $87,636.
What is the Median Household income in Murrells Inlet?
Median Household Income in Murrells Inlet is $71,019.
What is Income or Wage Gap in Murrells Inlet?
Income or Wage Gap in Murrells Inlet is 49.3%.
Women in Murrells Inlet earn 50.7 cents for every dollar earned by a man.
What is Family Income Deficit in Murrells Inlet?
Family Income Deficit in Murrells Inlet is $10,059.
Families that are below poverty line in Murrells Inlet earn $10,059 less on average than the poverty threshold level.
What is Inequality or Gini Index in Murrells Inlet?
Inequality or Gini Index in Murrells Inlet is 0.49.
What is the Total Population of Murrells Inlet?
Total Population of Murrells Inlet is 10,297.
What is the Total Male Population of Murrells Inlet?
Total Male Population of Murrells Inlet is 5,291.
What is the Total Female Population of Murrells Inlet?
Total Female Population of Murrells Inlet is 5,006.
What is the Ratio of Males per 100 Females in Murrells Inlet?
There are 105.69 Males per 100 Females in Murrells Inlet.
What is the Ratio of Females per 100 Males in Murrells Inlet?
There are 94.61 Females per 100 Males in Murrells Inlet.
What is the Median Population Age in Murrells Inlet?
Median Population Age in Murrells Inlet is 60.2 Years.
What is the Average Family Size in Murrells Inlet
Average Family Size in Murrells Inlet is 2.6 People.
What is the Average Household Size in Murrells Inlet
Average Household Size in Murrells Inlet is 2.2 People.
How Large is the Labor Force in Murrells Inlet?
There are 4,595 People in the Labor Forcein in Murrells Inlet.
What is the Percentage of People in the Labor Force in Murrells Inlet?
49.2% of People are in the Labor Force in Murrells Inlet.
What is the Unemployment Rate in Murrells Inlet?
Unemployment Rate in Murrells Inlet is 3.1%.