Burton, SC Map & Demographics
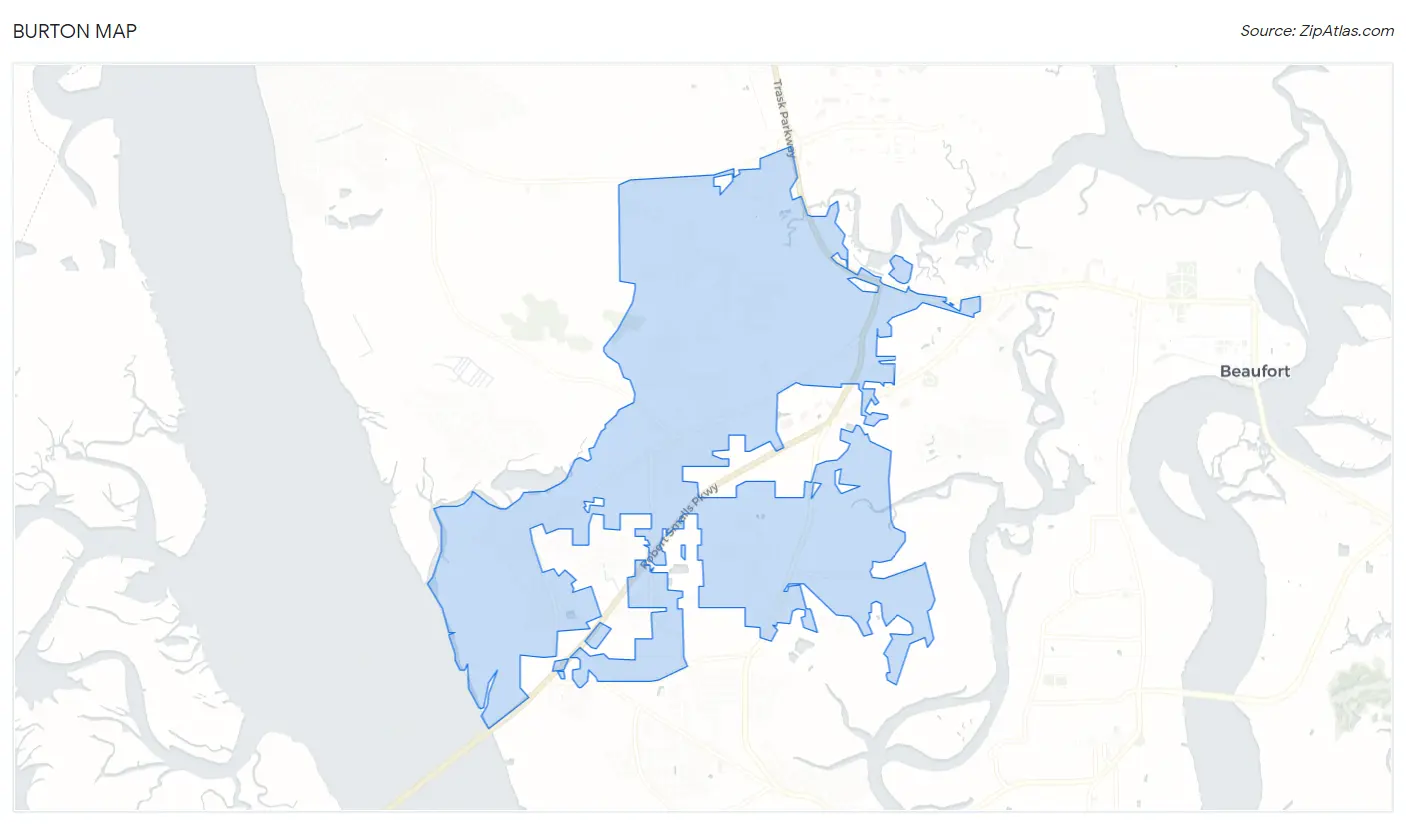
Burton Map
Burton Overview
$25,594
PER CAPITA INCOME
$65,765
AVG FAMILY INCOME
$58,390
AVG HOUSEHOLD INCOME
27.6%
WAGE / INCOME GAP [ % ]
72.4¢/ $1
WAGE / INCOME GAP [ $ ]
0.38
INEQUALITY / GINI INDEX
7,603
TOTAL POPULATION
3,568
MALE POPULATION
4,035
FEMALE POPULATION
88.43
MALES / 100 FEMALES
113.09
FEMALES / 100 MALES
32.4
MEDIAN AGE
3.4
AVG FAMILY SIZE
2.9
AVG HOUSEHOLD SIZE
3,703
LABOR FORCE [ PEOPLE ]
60.5%
PERCENT IN LABOR FORCE
1.4%
UNEMPLOYMENT RATE
Income in Burton
Income Overview in Burton
Per Capita Income in Burton is $25,594, while median incomes of families and households are $65,765 and $58,390 respectively.
| Characteristic | Number | Measure |
| Per Capita Income | 7,603 | $25,594 |
| Median Family Income | 1,923 | $65,765 |
| Mean Family Income | 1,923 | $74,532 |
| Median Household Income | 2,621 | $58,390 |
| Mean Household Income | 2,621 | $66,890 |
| Income Deficit | 1,923 | $0 |
| Wage / Income Gap (%) | 7,603 | 27.58% |
| Wage / Income Gap ($) | 7,603 | 72.42¢ per $1 |
| Gini / Inequality Index | 7,603 | 0.38 |
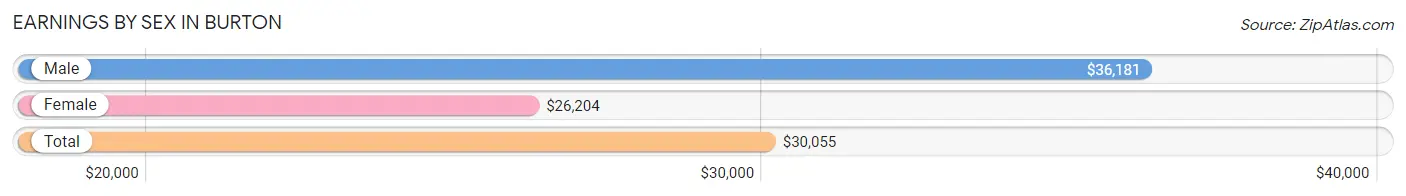
Earnings by Sex in Burton
Average Earnings in Burton are $30,055, $36,181 for men and $26,204 for women, a difference of 27.6%.
| Sex | Number | Average Earnings |
| Male | 1,907 (50.6%) | $36,181 |
| Female | 1,862 (49.4%) | $26,204 |
| Total | 3,769 (100.0%) | $30,055 |
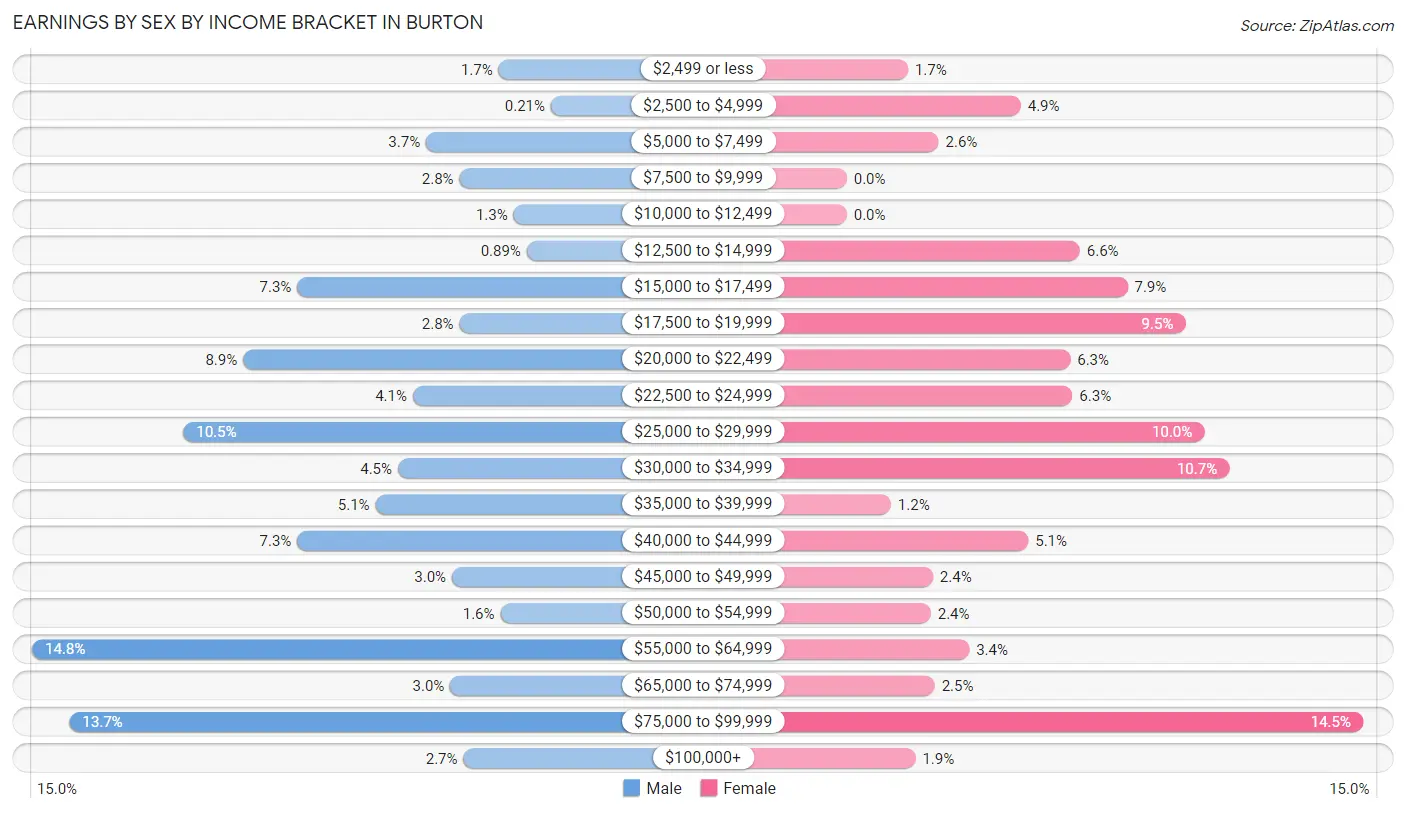
Earnings by Sex by Income Bracket in Burton
The most common earnings brackets in Burton are $55,000 to $64,999 for men (282 | 14.8%) and $75,000 to $99,999 for women (270 | 14.5%).
| Income | Male | Female |
| $2,499 or less | 32 (1.7%) | 32 (1.7%) |
| $2,500 to $4,999 | 4 (0.2%) | 91 (4.9%) |
| $5,000 to $7,499 | 71 (3.7%) | 48 (2.6%) |
| $7,500 to $9,999 | 53 (2.8%) | 0 (0.0%) |
| $10,000 to $12,499 | 24 (1.3%) | 0 (0.0%) |
| $12,500 to $14,999 | 17 (0.9%) | 122 (6.6%) |
| $15,000 to $17,499 | 140 (7.3%) | 147 (7.9%) |
| $17,500 to $19,999 | 53 (2.8%) | 177 (9.5%) |
| $20,000 to $22,499 | 169 (8.9%) | 117 (6.3%) |
| $22,500 to $24,999 | 78 (4.1%) | 118 (6.3%) |
| $25,000 to $29,999 | 201 (10.5%) | 187 (10.0%) |
| $30,000 to $34,999 | 86 (4.5%) | 200 (10.7%) |
| $35,000 to $39,999 | 98 (5.1%) | 23 (1.2%) |
| $40,000 to $44,999 | 140 (7.3%) | 95 (5.1%) |
| $45,000 to $49,999 | 57 (3.0%) | 45 (2.4%) |
| $50,000 to $54,999 | 31 (1.6%) | 44 (2.4%) |
| $55,000 to $64,999 | 282 (14.8%) | 64 (3.4%) |
| $65,000 to $74,999 | 58 (3.0%) | 46 (2.5%) |
| $75,000 to $99,999 | 262 (13.7%) | 270 (14.5%) |
| $100,000+ | 51 (2.7%) | 36 (1.9%) |
| Total | 1,907 (100.0%) | 1,862 (100.0%) |
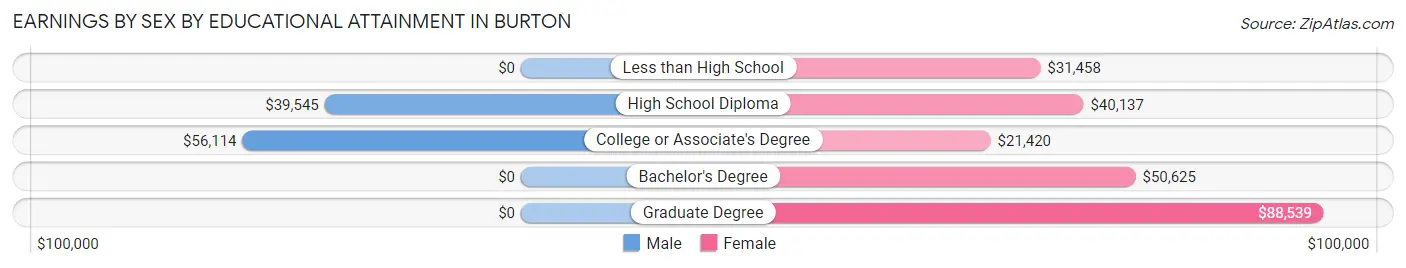
Earnings by Sex by Educational Attainment in Burton
Average earnings in Burton are $41,493 for men and $30,918 for women, a difference of 25.5%. Men with an educational attainment of college or associate's degree enjoy the highest average annual earnings of $56,114, while those with high school diploma education earn the least with $39,545. Women with an educational attainment of graduate degree earn the most with the average annual earnings of $88,539, while those with college or associate's degree education have the smallest earnings of $21,420.
| Educational Attainment | Male Income | Female Income |
| Less than High School | - | - |
| High School Diploma | $39,545 | $40,137 |
| College or Associate's Degree | $56,114 | $21,420 |
| Bachelor's Degree | - | - |
| Graduate Degree | - | - |
| Total | $41,493 | $30,918 |
Family Income in Burton
Family Income Brackets in Burton
According to the Burton family income data, there are 452 families falling into the $50,000 to $74,999 income range, which is the most common income bracket and makes up 23.5% of all families. Conversely, the $200,000+ income bracket is the least frequent group with only 46 families (2.4%) belonging to this category.
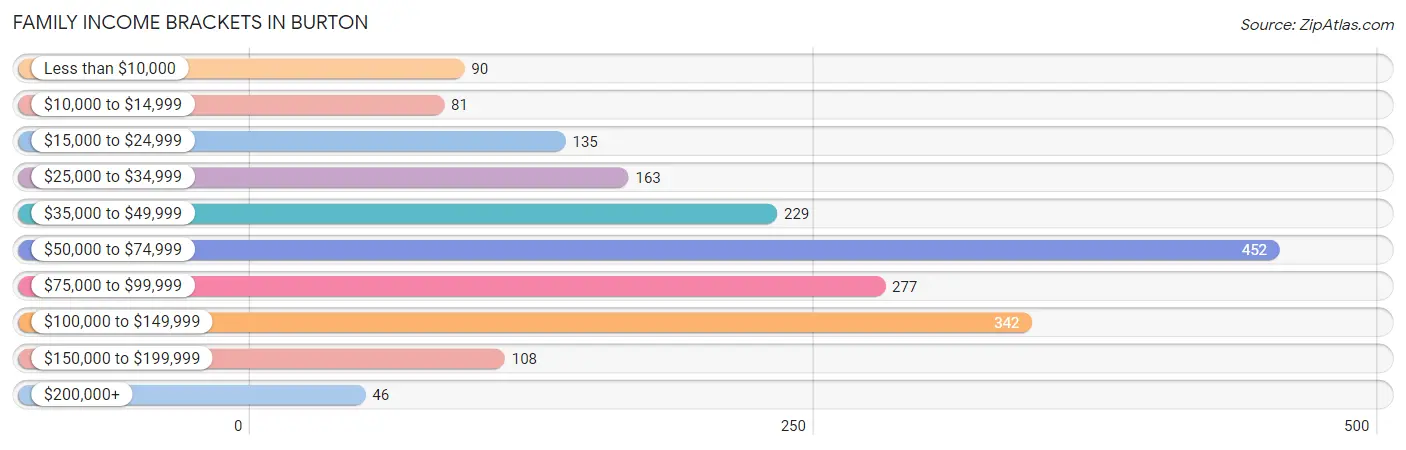
| Income Bracket | # Families | % Families |
| Less than $10,000 | 90 | 4.7% |
| $10,000 to $14,999 | 81 | 4.2% |
| $15,000 to $24,999 | 135 | 7.0% |
| $25,000 to $34,999 | 163 | 8.5% |
| $35,000 to $49,999 | 229 | 11.9% |
| $50,000 to $74,999 | 452 | 23.5% |
| $75,000 to $99,999 | 277 | 14.4% |
| $100,000 to $149,999 | 342 | 17.8% |
| $150,000 to $199,999 | 108 | 5.6% |
| $200,000+ | 46 | 2.4% |
Family Income by Famaliy Size in Burton
3-person families (555 | 28.9%) account for the highest median family income in Burton with $71,899 per family, while 2-person families (919 | 47.8%) have the highest median income of $32,956 per family member.
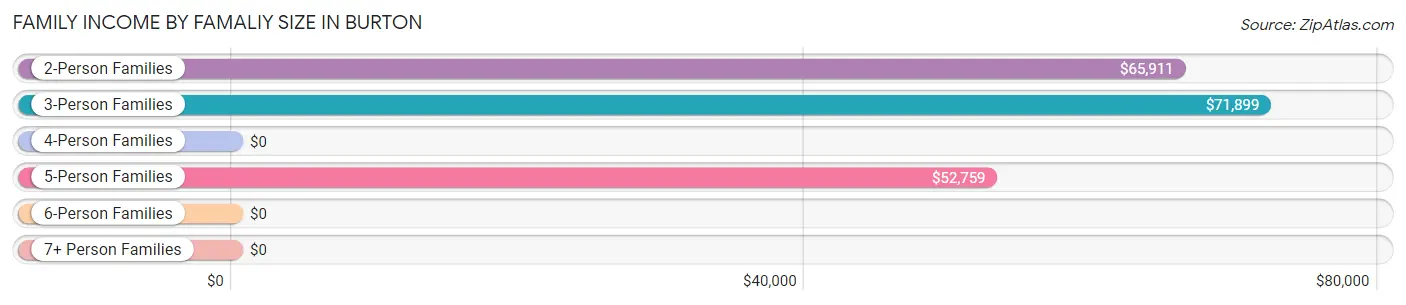
| Income Bracket | # Families | Median Income |
| 2-Person Families | 919 (47.8%) | $65,911 |
| 3-Person Families | 555 (28.9%) | $71,899 |
| 4-Person Families | 236 (12.3%) | $0 |
| 5-Person Families | 140 (7.3%) | $52,759 |
| 6-Person Families | 68 (3.5%) | $0 |
| 7+ Person Families | 5 (0.3%) | $0 |
| Total | 1,923 (100.0%) | $65,765 |
Family Income by Number of Earners in Burton
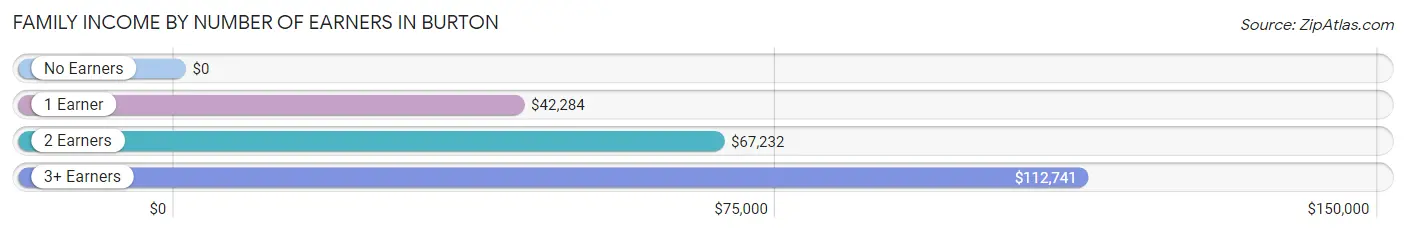
| Number of Earners | # Families | Median Income |
| No Earners | 289 (15.0%) | $0 |
| 1 Earner | 832 (43.3%) | $42,284 |
| 2 Earners | 472 (24.5%) | $67,232 |
| 3+ Earners | 330 (17.2%) | $112,741 |
| Total | 1,923 (100.0%) | $65,765 |
Household Income in Burton
Household Income Brackets in Burton
With 692 households falling in the category, the $50,000 to $74,999 income range is the most frequent in Burton, accounting for 26.4% of all households. In contrast, only 47 households (1.8%) fall into the $200,000+ income bracket, making it the least populous group.
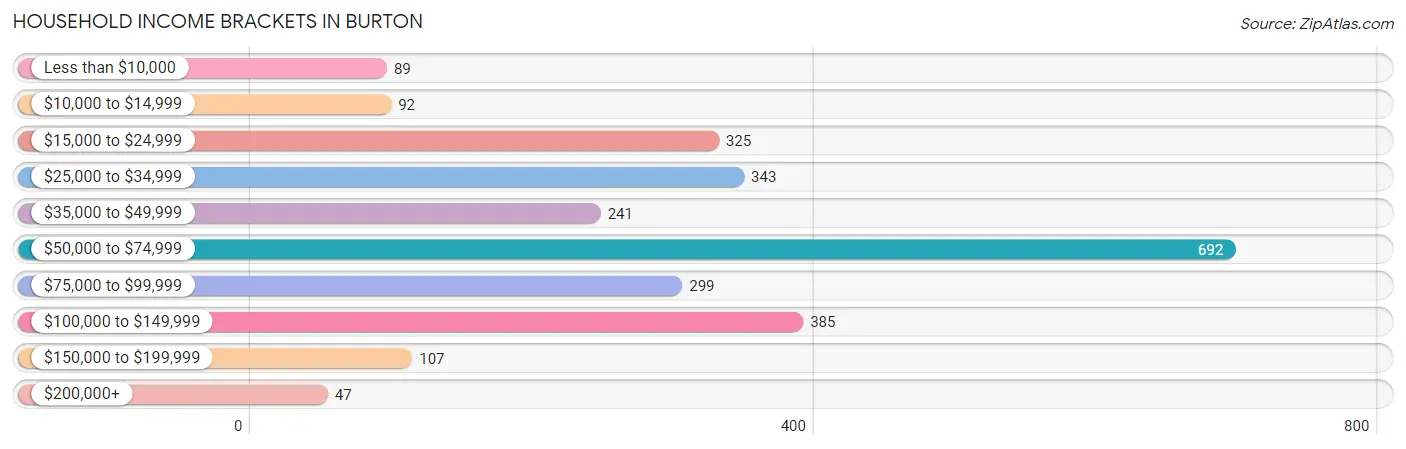
| Income Bracket | # Households | % Households |
| Less than $10,000 | 89 | 3.4% |
| $10,000 to $14,999 | 92 | 3.5% |
| $15,000 to $24,999 | 325 | 12.4% |
| $25,000 to $34,999 | 343 | 13.1% |
| $35,000 to $49,999 | 241 | 9.2% |
| $50,000 to $74,999 | 692 | 26.4% |
| $75,000 to $99,999 | 299 | 11.4% |
| $100,000 to $149,999 | 385 | 14.7% |
| $150,000 to $199,999 | 107 | 4.1% |
| $200,000+ | 47 | 1.8% |
Household Income by Householder Age in Burton
The median household income in Burton is $58,390, with the highest median household income of $70,682 found in the 45 to 64 years age bracket for the primary householder. A total of 1,084 households (41.4%) fall into this category. Meanwhile, the 25 to 44 years age bracket for the primary householder has the lowest median household income of $52,609, with 804 households (30.7%) in this group.
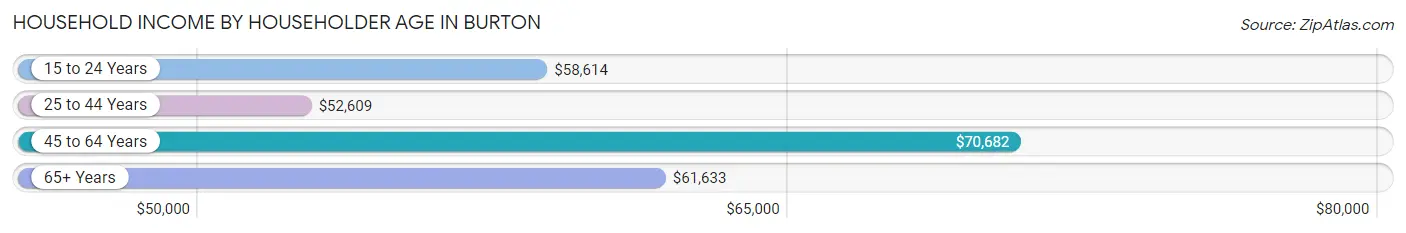
| Income Bracket | # Households | Median Income |
| 15 to 24 Years | 129 (4.9%) | $58,614 |
| 25 to 44 Years | 804 (30.7%) | $52,609 |
| 45 to 64 Years | 1,084 (41.4%) | $70,682 |
| 65+ Years | 604 (23.0%) | $61,633 |
| Total | 2,621 (100.0%) | $58,390 |
Poverty in Burton
Income Below Poverty by Sex and Age in Burton
With 18.6% poverty level for males and 9.9% for females among the residents of Burton, 16 and 17 year old males and 5 year old females are the most vulnerable to poverty, with 78 males (77.2%) and 55 females (100.0%) in their respective age groups living below the poverty level.
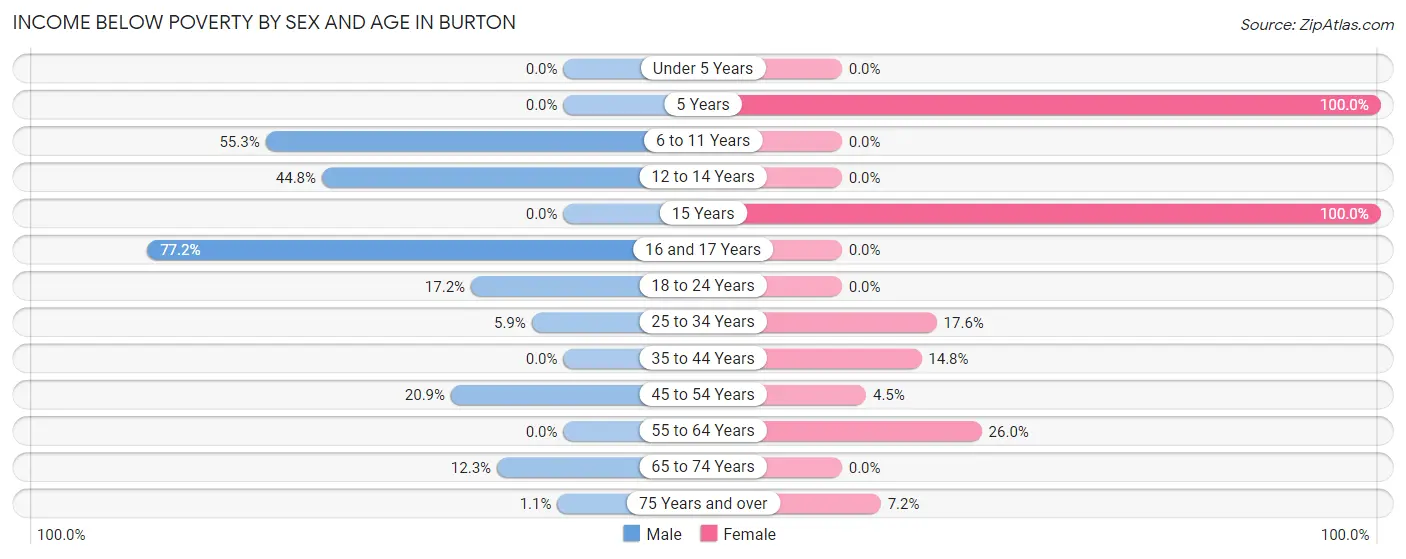
| Age Bracket | Male | Female |
| Under 5 Years | 0 (0.0%) | 0 (0.0%) |
| 5 Years | 0 (0.0%) | 55 (100.0%) |
| 6 to 11 Years | 324 (55.3%) | 0 (0.0%) |
| 12 to 14 Years | 13 (44.8%) | 0 (0.0%) |
| 15 Years | 0 (0.0%) | 8 (100.0%) |
| 16 and 17 Years | 78 (77.2%) | 0 (0.0%) |
| 18 to 24 Years | 76 (17.2%) | 0 (0.0%) |
| 25 to 34 Years | 36 (5.9%) | 93 (17.6%) |
| 35 to 44 Years | 0 (0.0%) | 52 (14.8%) |
| 45 to 54 Years | 90 (20.9%) | 29 (4.5%) |
| 55 to 64 Years | 0 (0.0%) | 149 (26.0%) |
| 65 to 74 Years | 45 (12.3%) | 0 (0.0%) |
| 75 Years and over | 1 (1.1%) | 13 (7.2%) |
| Total | 663 (18.6%) | 399 (9.9%) |
Income Above Poverty by Sex and Age in Burton
According to the poverty statistics in Burton, males aged under 5 years and females aged under 5 years are the age groups that are most secure financially, with 100.0% of males and 100.0% of females in these age groups living above the poverty line.
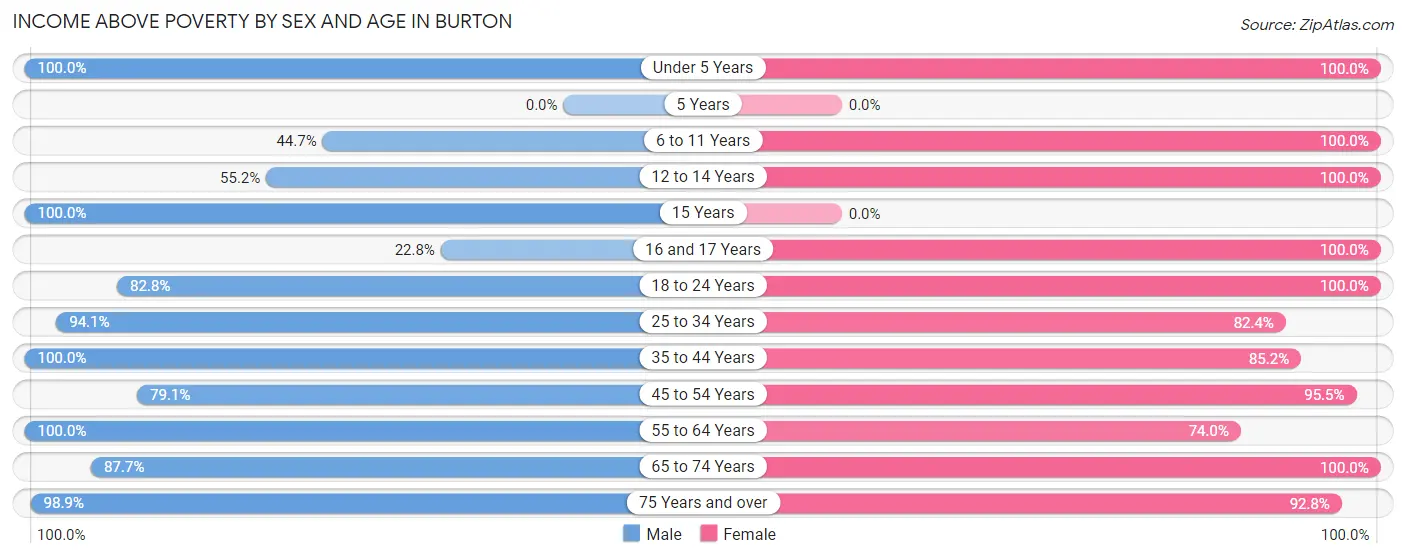
| Age Bracket | Male | Female |
| Under 5 Years | 207 (100.0%) | 351 (100.0%) |
| 5 Years | 0 (0.0%) | 0 (0.0%) |
| 6 to 11 Years | 262 (44.7%) | 129 (100.0%) |
| 12 to 14 Years | 16 (55.2%) | 61 (100.0%) |
| 15 Years | 46 (100.0%) | 0 (0.0%) |
| 16 and 17 Years | 23 (22.8%) | 154 (100.0%) |
| 18 to 24 Years | 367 (82.8%) | 639 (100.0%) |
| 25 to 34 Years | 575 (94.1%) | 435 (82.4%) |
| 35 to 44 Years | 295 (100.0%) | 300 (85.2%) |
| 45 to 54 Years | 341 (79.1%) | 615 (95.5%) |
| 55 to 64 Years | 355 (100.0%) | 425 (74.0%) |
| 65 to 74 Years | 320 (87.7%) | 360 (100.0%) |
| 75 Years and over | 88 (98.9%) | 167 (92.8%) |
| Total | 2,895 (81.4%) | 3,636 (90.1%) |
Income Below Poverty Among Married-Couple Families in Burton
The poverty statistics for married-couple families in Burton show that 4.4% or 51 of the total 1,155 families live below the poverty line. Families with 1 or 2 children have the highest poverty rate of 12.6%, comprising of 42 families. On the other hand, families with no children have the lowest poverty rate of 0.0%, which includes 0 families.
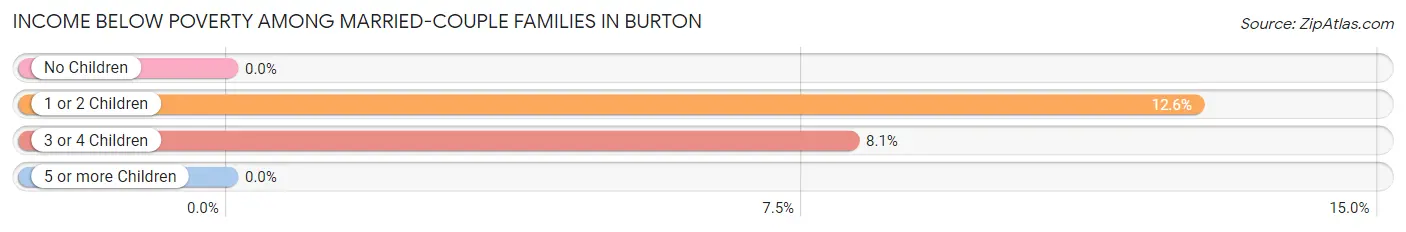
| Children | Above Poverty | Below Poverty |
| No Children | 711 (100.0%) | 0 (0.0%) |
| 1 or 2 Children | 291 (87.4%) | 42 (12.6%) |
| 3 or 4 Children | 102 (91.9%) | 9 (8.1%) |
| 5 or more Children | 0 (0.0%) | 0 (0.0%) |
| Total | 1,104 (95.6%) | 51 (4.4%) |
Income Below Poverty Among Single-Parent Households in Burton
According to the poverty data in Burton, 42.1% or 90 single-father households and 29.8% or 165 single-mother households are living below the poverty line. Among single-father households, those with 1 or 2 children have the highest poverty rate, with 90 households (81.1%) experiencing poverty. Likewise, among single-mother households, those with 3 or 4 children have the highest poverty rate, with 93 households (85.3%) falling below the poverty line.
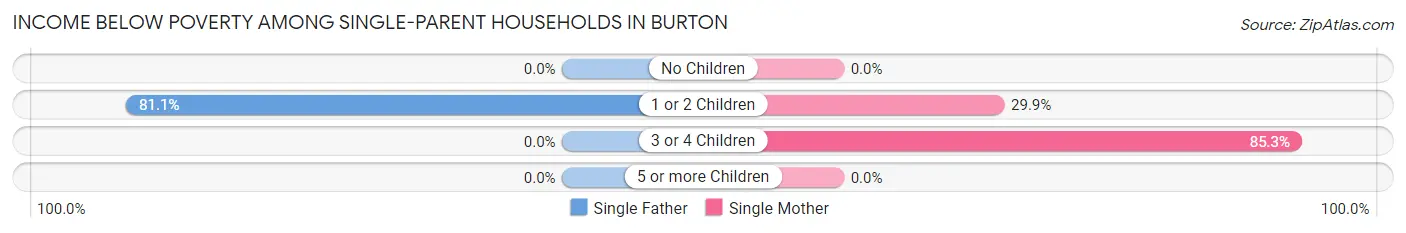
| Children | Single Father | Single Mother |
| No Children | 0 (0.0%) | 0 (0.0%) |
| 1 or 2 Children | 90 (81.1%) | 72 (29.9%) |
| 3 or 4 Children | 0 (0.0%) | 93 (85.3%) |
| 5 or more Children | 0 (0.0%) | 0 (0.0%) |
| Total | 90 (42.1%) | 165 (29.8%) |
Income Below Poverty Among Married-Couple vs Single-Parent Households in Burton
The poverty data for Burton shows that 51 of the married-couple family households (4.4%) and 255 of the single-parent households (33.2%) are living below the poverty level. Within the married-couple family households, those with 1 or 2 children have the highest poverty rate, with 42 households (12.6%) falling below the poverty line. Among the single-parent households, those with 3 or 4 children have the highest poverty rate, with 93 household (85.3%) living below poverty.
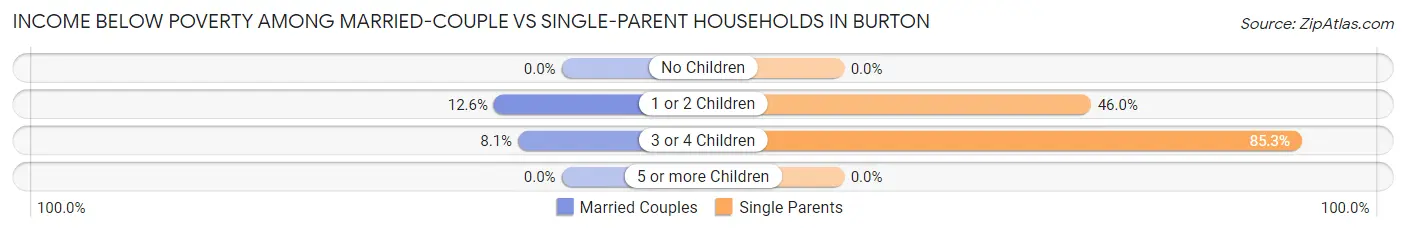
| Children | Married-Couple Families | Single-Parent Households |
| No Children | 0 (0.0%) | 0 (0.0%) |
| 1 or 2 Children | 42 (12.6%) | 162 (46.0%) |
| 3 or 4 Children | 9 (8.1%) | 93 (85.3%) |
| 5 or more Children | 0 (0.0%) | 0 (0.0%) |
| Total | 51 (4.4%) | 255 (33.2%) |
Race in Burton
The most populous races in Burton are Black / African American (3,351 | 44.1%), White / Caucasian (2,980 | 39.2%), and Hispanic or Latino (1,005 | 13.2%).
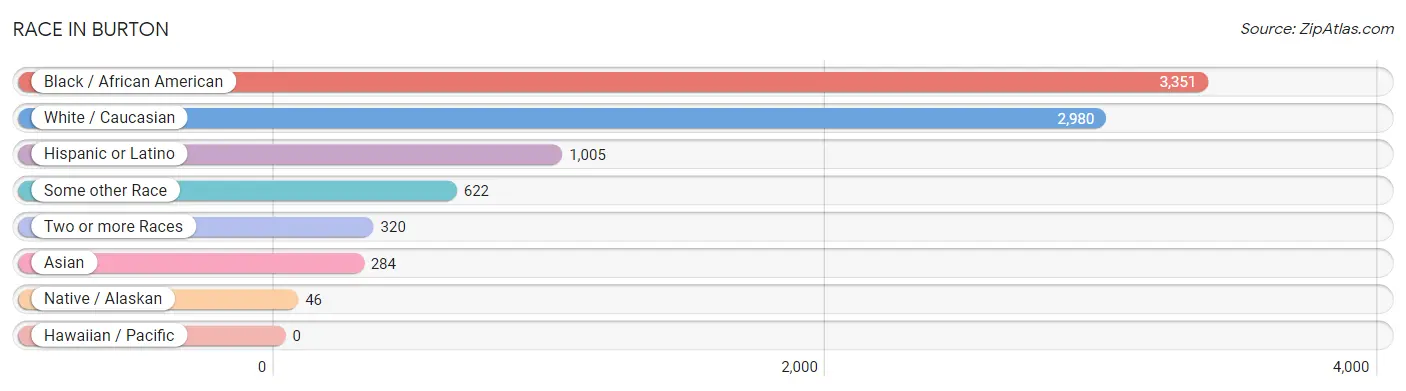
| Race | # Population | % Population |
| Asian | 284 | 3.7% |
| Black / African American | 3,351 | 44.1% |
| Hawaiian / Pacific | 0 | 0.0% |
| Hispanic or Latino | 1,005 | 13.2% |
| Native / Alaskan | 46 | 0.6% |
| White / Caucasian | 2,980 | 39.2% |
| Two or more Races | 320 | 4.2% |
| Some other Race | 622 | 8.2% |
| Total | 7,603 | 100.0% |
Ancestry in Burton
The most populous ancestries reported in Burton are American (665 | 8.7%), Puerto Rican (532 | 7.0%), Mexican (473 | 6.2%), Irish (363 | 4.8%), and German (355 | 4.7%), together accounting for 31.4% of all Burton residents.
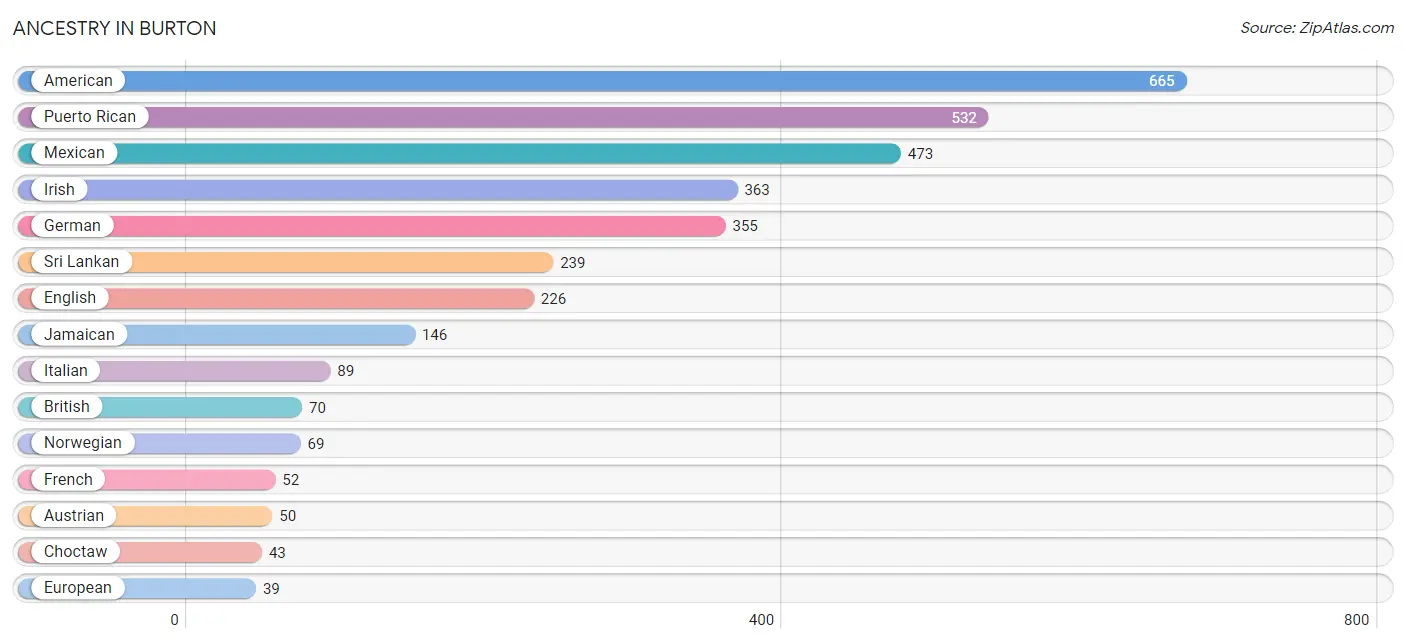
| Ancestry | # Population | % Population |
| African | 17 | 0.2% |
| American | 665 | 8.7% |
| Austrian | 50 | 0.7% |
| Bhutanese | 15 | 0.2% |
| British | 70 | 0.9% |
| Canadian | 15 | 0.2% |
| Cherokee | 4 | 0.1% |
| Choctaw | 43 | 0.6% |
| Danish | 15 | 0.2% |
| Dutch | 32 | 0.4% |
| English | 226 | 3.0% |
| European | 39 | 0.5% |
| French | 52 | 0.7% |
| German | 355 | 4.7% |
| Irish | 363 | 4.8% |
| Italian | 89 | 1.2% |
| Jamaican | 146 | 1.9% |
| Korean | 30 | 0.4% |
| Mexican | 473 | 6.2% |
| Norwegian | 69 | 0.9% |
| Puerto Rican | 532 | 7.0% |
| Scotch-Irish | 37 | 0.5% |
| Scottish | 31 | 0.4% |
| Sri Lankan | 239 | 3.1% |
| Subsaharan African | 17 | 0.2% |
| Swiss | 19 | 0.3% |
| Welsh | 20 | 0.3% | View All 27 Rows |
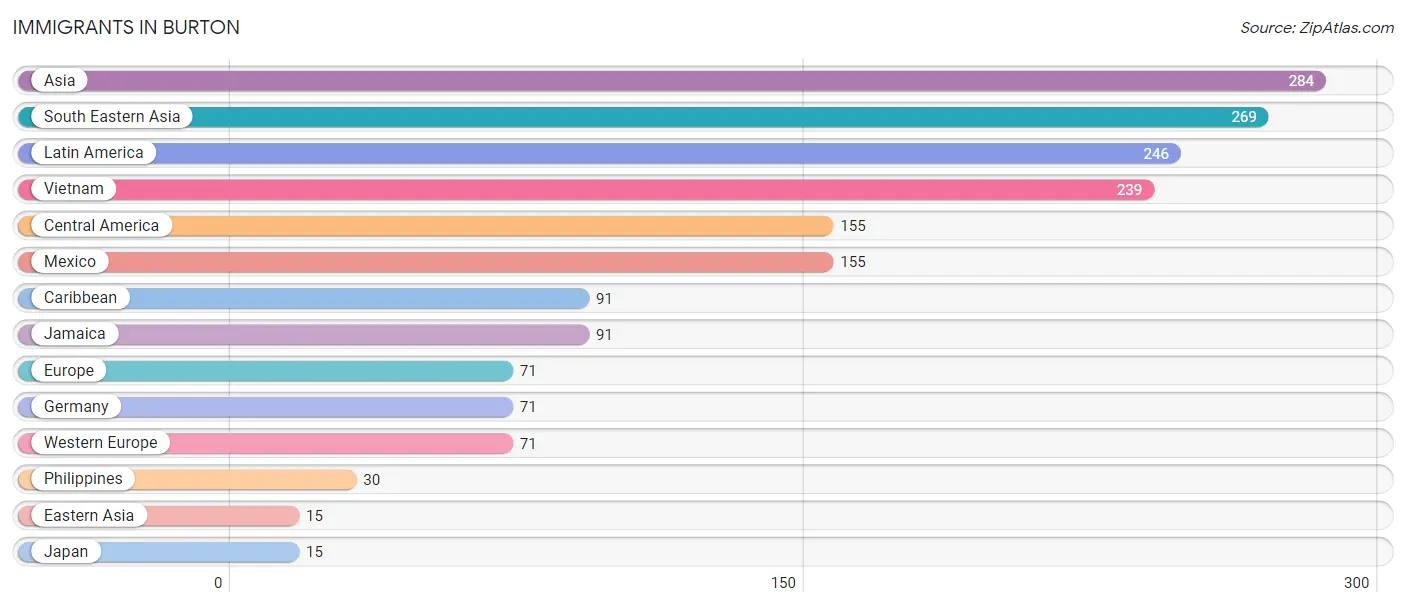
Immigrants in Burton
The most numerous immigrant groups reported in Burton came from Asia (284 | 3.7%), South Eastern Asia (269 | 3.5%), Latin America (246 | 3.2%), Vietnam (239 | 3.1%), and Central America (155 | 2.0%), together accounting for 15.7% of all Burton residents.
| Immigration Origin | # Population | % Population |
| Asia | 284 | 3.7% |
| Caribbean | 91 | 1.2% |
| Central America | 155 | 2.0% |
| Eastern Asia | 15 | 0.2% |
| Europe | 71 | 0.9% |
| Germany | 71 | 0.9% |
| Jamaica | 91 | 1.2% |
| Japan | 15 | 0.2% |
| Latin America | 246 | 3.2% |
| Mexico | 155 | 2.0% |
| Philippines | 30 | 0.4% |
| South Eastern Asia | 269 | 3.5% |
| Vietnam | 239 | 3.1% |
| Western Europe | 71 | 0.9% | View All 14 Rows |
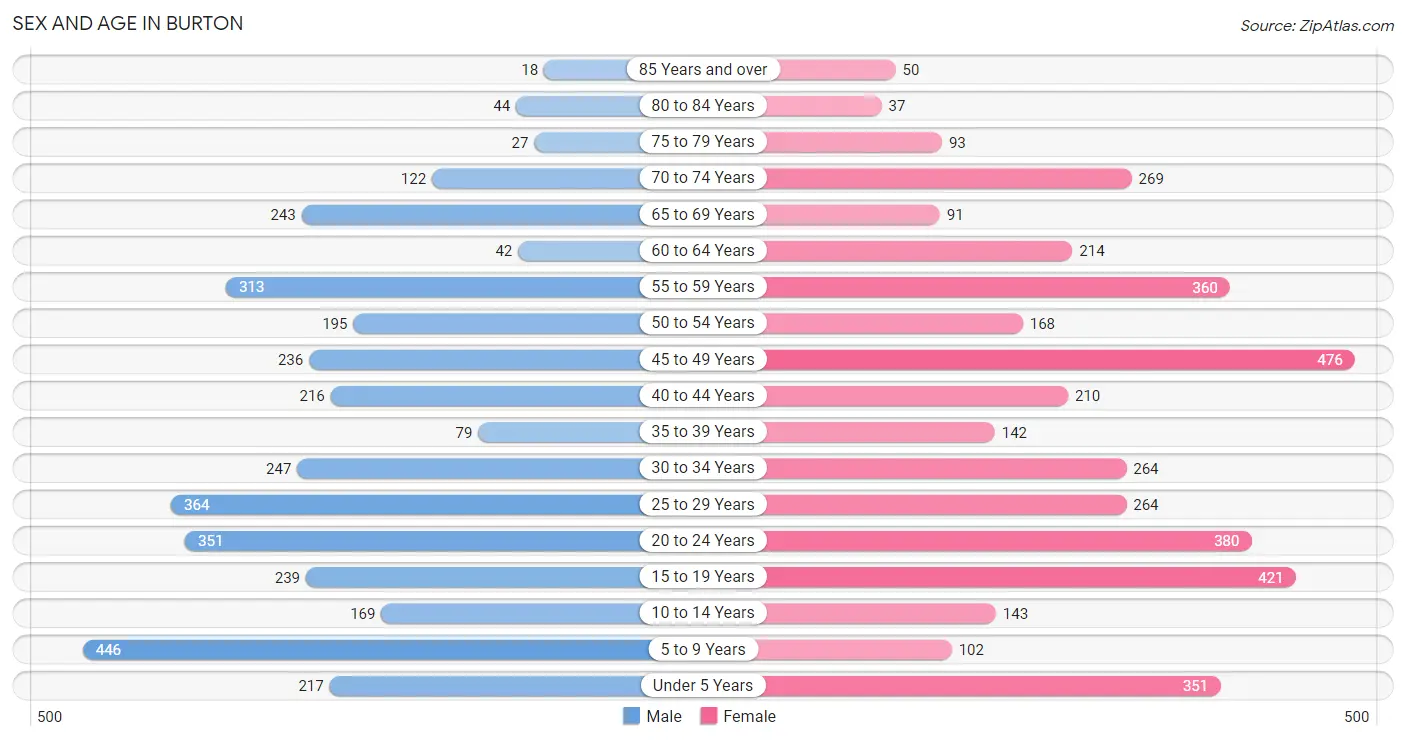
Sex and Age in Burton
Sex and Age in Burton
The most populous age groups in Burton are 5 to 9 Years (446 | 12.5%) for men and 45 to 49 Years (476 | 11.8%) for women.
| Age Bracket | Male | Female |
| Under 5 Years | 217 (6.1%) | 351 (8.7%) |
| 5 to 9 Years | 446 (12.5%) | 102 (2.5%) |
| 10 to 14 Years | 169 (4.7%) | 143 (3.5%) |
| 15 to 19 Years | 239 (6.7%) | 421 (10.4%) |
| 20 to 24 Years | 351 (9.8%) | 380 (9.4%) |
| 25 to 29 Years | 364 (10.2%) | 264 (6.5%) |
| 30 to 34 Years | 247 (6.9%) | 264 (6.5%) |
| 35 to 39 Years | 79 (2.2%) | 142 (3.5%) |
| 40 to 44 Years | 216 (6.0%) | 210 (5.2%) |
| 45 to 49 Years | 236 (6.6%) | 476 (11.8%) |
| 50 to 54 Years | 195 (5.5%) | 168 (4.2%) |
| 55 to 59 Years | 313 (8.8%) | 360 (8.9%) |
| 60 to 64 Years | 42 (1.2%) | 214 (5.3%) |
| 65 to 69 Years | 243 (6.8%) | 91 (2.3%) |
| 70 to 74 Years | 122 (3.4%) | 269 (6.7%) |
| 75 to 79 Years | 27 (0.8%) | 93 (2.3%) |
| 80 to 84 Years | 44 (1.2%) | 37 (0.9%) |
| 85 Years and over | 18 (0.5%) | 50 (1.2%) |
| Total | 3,568 (100.0%) | 4,035 (100.0%) |
Families and Households in Burton
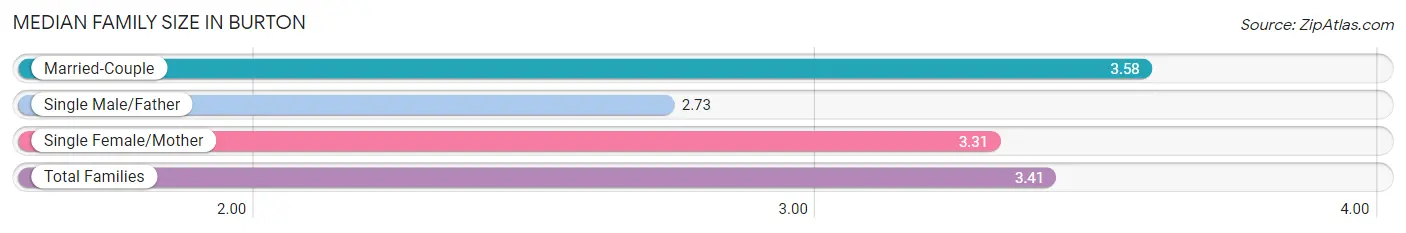
Median Family Size in Burton
The median family size in Burton is 3.41 persons per family, with married-couple families (1,155 | 60.1%) accounting for the largest median family size of 3.58 persons per family. On the other hand, single male/father families (214 | 11.1%) represent the smallest median family size with 2.73 persons per family.
| Family Type | # Families | Family Size |
| Married-Couple | 1,155 (60.1%) | 3.58 |
| Single Male/Father | 214 (11.1%) | 2.73 |
| Single Female/Mother | 554 (28.8%) | 3.31 |
| Total Families | 1,923 (100.0%) | 3.41 |
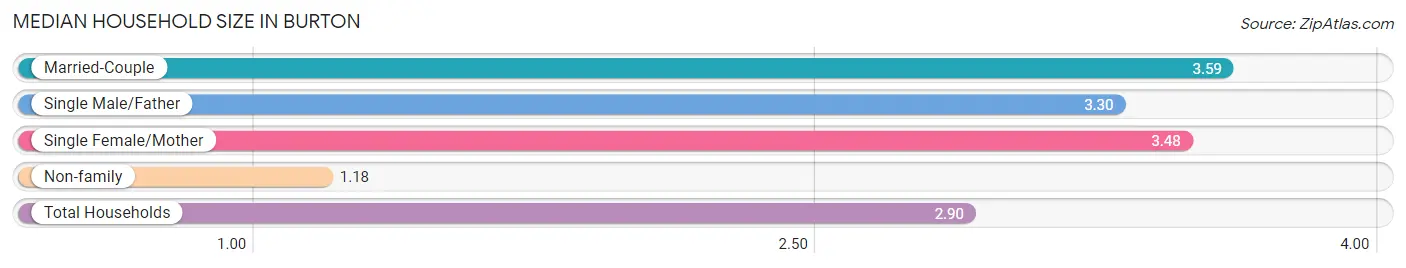
Median Household Size in Burton
The median household size in Burton is 2.90 persons per household, with married-couple households (1,155 | 44.1%) accounting for the largest median household size of 3.59 persons per household. non-family households (698 | 26.6%) represent the smallest median household size with 1.18 persons per household.
| Household Type | # Households | Household Size |
| Married-Couple | 1,155 (44.1%) | 3.59 |
| Single Male/Father | 214 (8.2%) | 3.30 |
| Single Female/Mother | 554 (21.1%) | 3.48 |
| Non-family | 698 (26.6%) | 1.18 |
| Total Households | 2,621 (100.0%) | 2.90 |
Household Size by Marriage Status in Burton
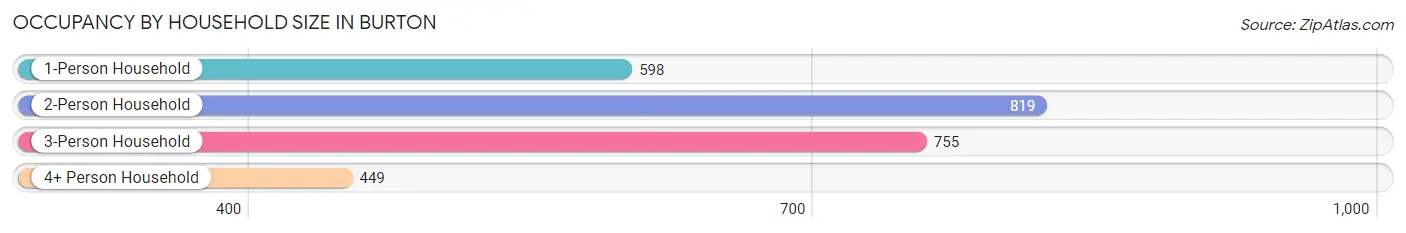
Out of a total of 2,621 households in Burton, 1,923 (73.4%) are family households, while 698 (26.6%) are nonfamily households. The most numerous type of family households are 3-person households, comprising 755, and the most common type of nonfamily households are 1-person households, comprising 598.
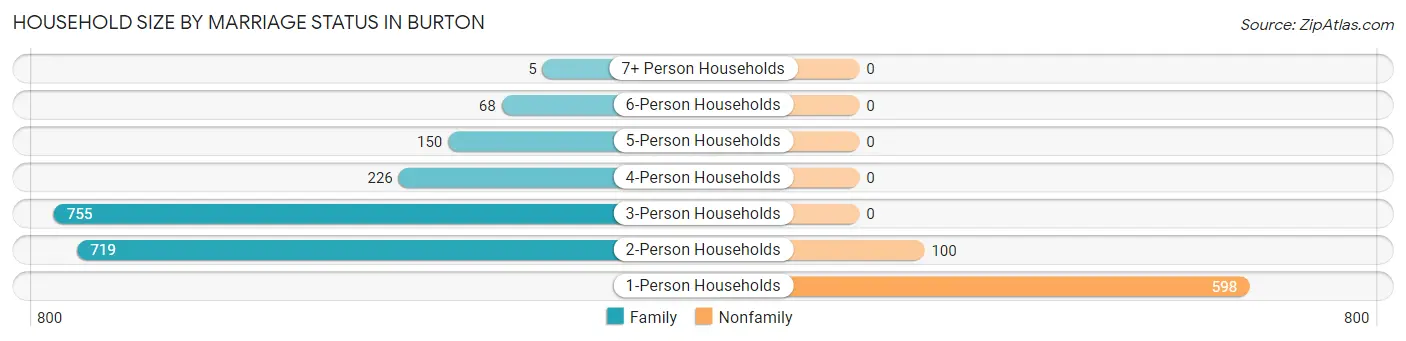
| Household Size | Family Households | Nonfamily Households |
| 1-Person Households | - | 598 (22.8%) |
| 2-Person Households | 719 (27.4%) | 100 (3.8%) |
| 3-Person Households | 755 (28.8%) | 0 (0.0%) |
| 4-Person Households | 226 (8.6%) | 0 (0.0%) |
| 5-Person Households | 150 (5.7%) | 0 (0.0%) |
| 6-Person Households | 68 (2.6%) | 0 (0.0%) |
| 7+ Person Households | 5 (0.2%) | 0 (0.0%) |
| Total | 1,923 (73.4%) | 698 (26.6%) |
Female Fertility in Burton
Fertility by Age in Burton
Average fertility rate in Burton is 49.0 births per 1,000 women. Women in the age bracket of 20 to 34 years have the highest fertility rate with 121.0 births per 1,000 women. Women in the age bracket of 20 to 34 years acount for 100.0% of all women with births.
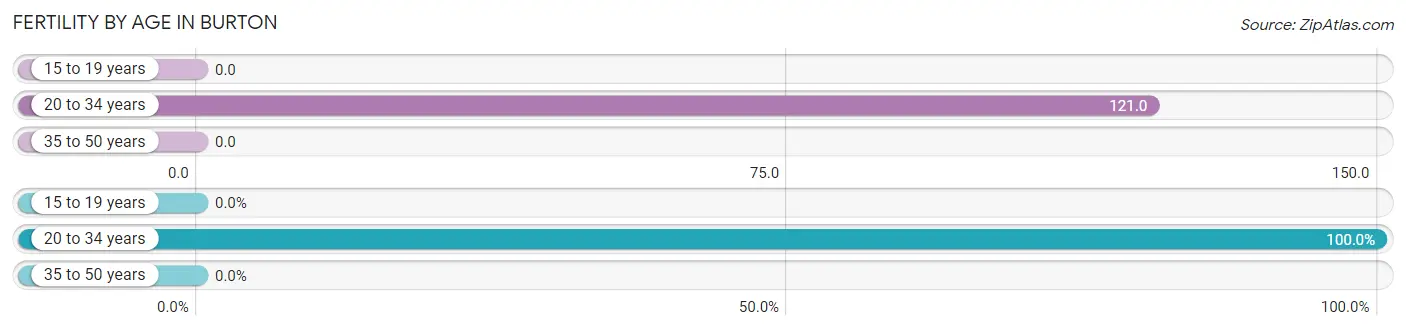
| Age Bracket | Women with Births | Births / 1,000 Women |
| 15 to 19 years | 0 (0.0%) | 0.0 |
| 20 to 34 years | 110 (100.0%) | 121.0 |
| 35 to 50 years | 0 (0.0%) | 0.0 |
| Total | 110 (100.0%) | 49.0 |
Fertility by Age by Marriage Status in Burton
86.4% of women with births (110) in Burton are married. The highest percentage of unmarried women with births falls into 20 to 34 years age bracket with 13.6% of them unmarried at the time of birth, while the lowest percentage of unmarried women with births belong to 20 to 34 years age bracket with 13.6% of them unmarried.
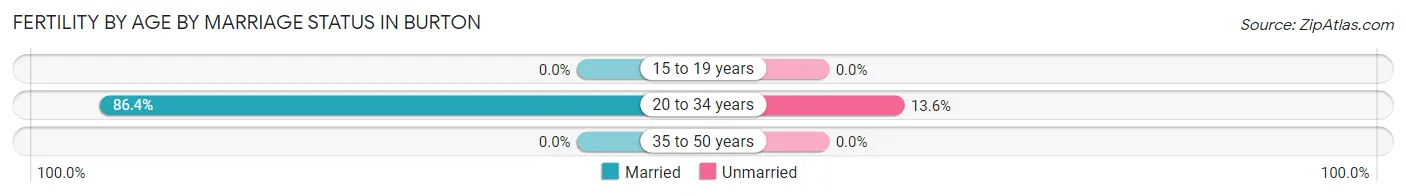
| Age Bracket | Married | Unmarried |
| 15 to 19 years | 0 (0.0%) | 0 (0.0%) |
| 20 to 34 years | 95 (86.4%) | 15 (13.6%) |
| 35 to 50 years | 0 (0.0%) | 0 (0.0%) |
| Total | 95 (86.4%) | 15 (13.6%) |
Fertility by Education in Burton
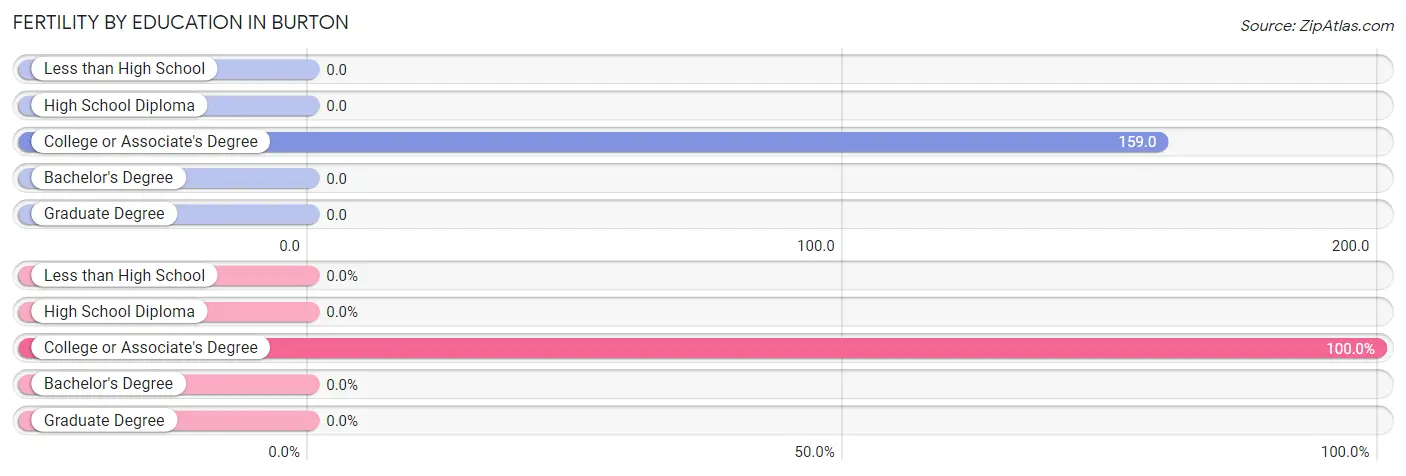
| Educational Attainment | Women with Births | Births / 1,000 Women |
| Less than High School | 0 (0.0%) | 0.0 |
| High School Diploma | 0 (0.0%) | 0.0 |
| College or Associate's Degree | 110 (100.0%) | 159.0 |
| Bachelor's Degree | 0 (0.0%) | 0.0 |
| Graduate Degree | 0 (0.0%) | 0.0 |
| Total | 110 (100.0%) | 49.0 |
Fertility by Education by Marriage Status in Burton
13.6% of women with births in Burton are unmarried. Women with the educational attainment of college or associate's degree are most likely to be married with 86.4% of them married at childbirth, while women with the educational attainment of college or associate's degree are least likely to be married with 13.6% of them unmarried at childbirth.
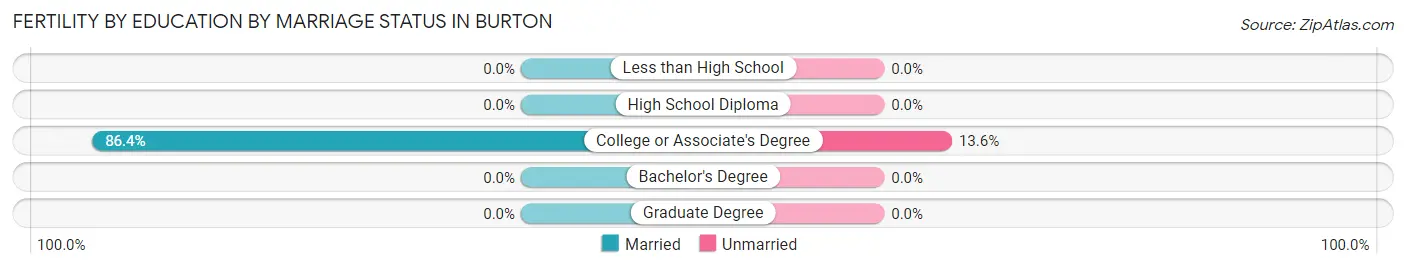
| Educational Attainment | Married | Unmarried |
| Less than High School | 0 (0.0%) | 0 (0.0%) |
| High School Diploma | 0 (0.0%) | 0 (0.0%) |
| College or Associate's Degree | 95 (86.4%) | 15 (13.6%) |
| Bachelor's Degree | 0 (0.0%) | 0 (0.0%) |
| Graduate Degree | 0 (0.0%) | 0 (0.0%) |
| Total | 95 (86.4%) | 15 (13.6%) |
Employment Characteristics in Burton
Employment by Class of Employer in Burton
Among the 3,538 employed individuals in Burton, private company employees (2,111 | 59.7%), not-for-profit organizations (289 | 8.2%), and self-employed (incorporated) (264 | 7.5%) make up the most common classes of employment.
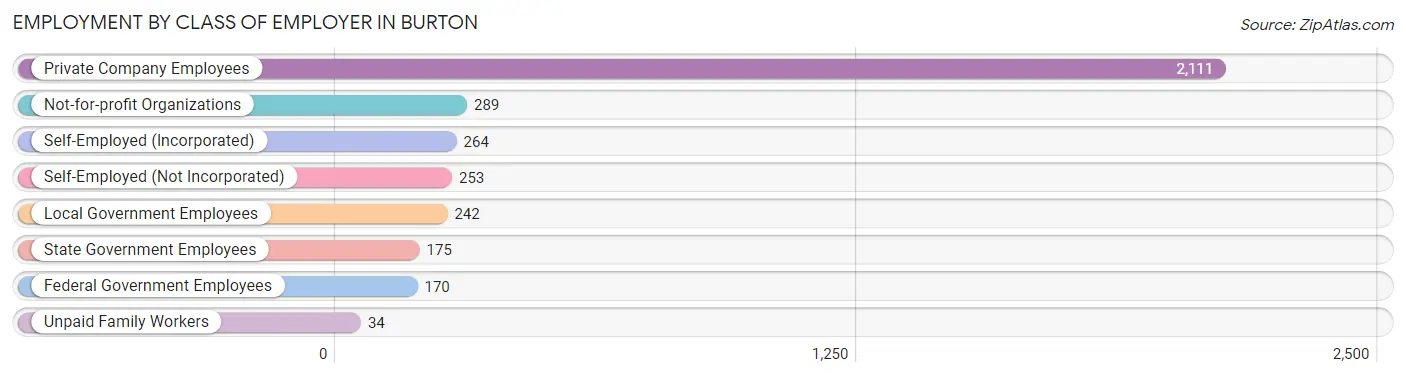
| Employer Class | # Employees | % Employees |
| Private Company Employees | 2,111 | 59.7% |
| Self-Employed (Incorporated) | 264 | 7.5% |
| Self-Employed (Not Incorporated) | 253 | 7.1% |
| Not-for-profit Organizations | 289 | 8.2% |
| Local Government Employees | 242 | 6.8% |
| State Government Employees | 175 | 5.0% |
| Federal Government Employees | 170 | 4.8% |
| Unpaid Family Workers | 34 | 1.0% |
| Total | 3,538 | 100.0% |
Employment Status by Age in Burton
According to the labor force statistics for Burton, out of the total population over 16 years of age (6,121), 60.5% or 3,703 individuals are in the labor force, with 1.4% or 52 of them unemployed. The age group with the highest labor force participation rate is 20 to 24 years, with 84.8% or 620 individuals in the labor force. Within the labor force, the 16 to 19 years age range has the highest percentage of unemployed individuals, with 24.5% or 50 of them being unemployed.
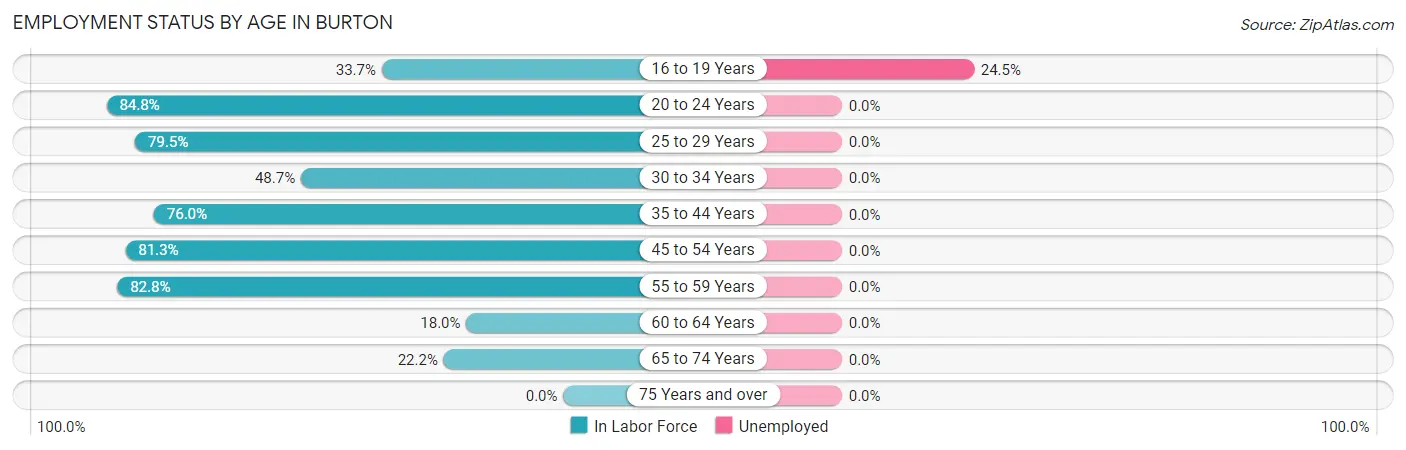
| Age Bracket | In Labor Force | Unemployed |
| 16 to 19 Years | 204 (33.7%) | 50 (24.5%) |
| 20 to 24 Years | 620 (84.8%) | 0 (0.0%) |
| 25 to 29 Years | 499 (79.5%) | 0 (0.0%) |
| 30 to 34 Years | 249 (48.7%) | 0 (0.0%) |
| 35 to 44 Years | 492 (76.0%) | 0 (0.0%) |
| 45 to 54 Years | 874 (81.3%) | 0 (0.0%) |
| 55 to 59 Years | 557 (82.8%) | 0 (0.0%) |
| 60 to 64 Years | 46 (18.0%) | 0 (0.0%) |
| 65 to 74 Years | 161 (22.2%) | 0 (0.0%) |
| 75 Years and over | 0 (0.0%) | 0 (0.0%) |
| Total | 3,703 (60.5%) | 52 (1.4%) |
Employment Status by Educational Attainment in Burton
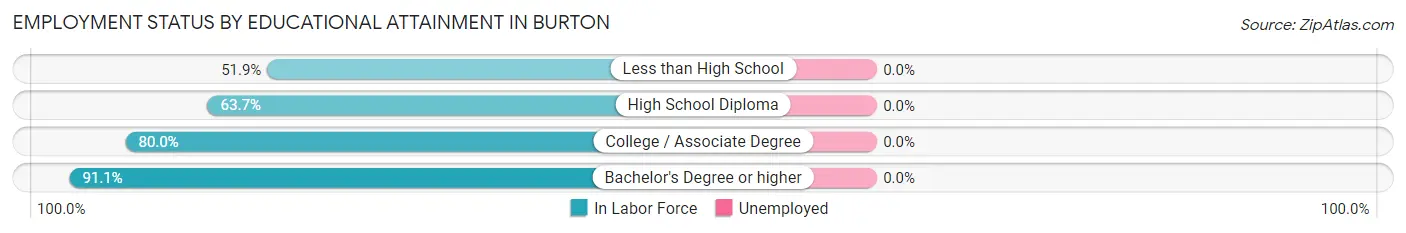
| Educational Attainment | In Labor Force | Unemployed |
| Less than High School | 175 (51.9%) | 0 (0.0%) |
| High School Diploma | 1,070 (63.7%) | 0 (0.0%) |
| College / Associate Degree | 1,033 (80.0%) | 0 (0.0%) |
| Bachelor's Degree or higher | 440 (91.1%) | 0 (0.0%) |
| Total | 2,717 (71.7%) | 0 (0.0%) |
Employment Occupations by Sex in Burton
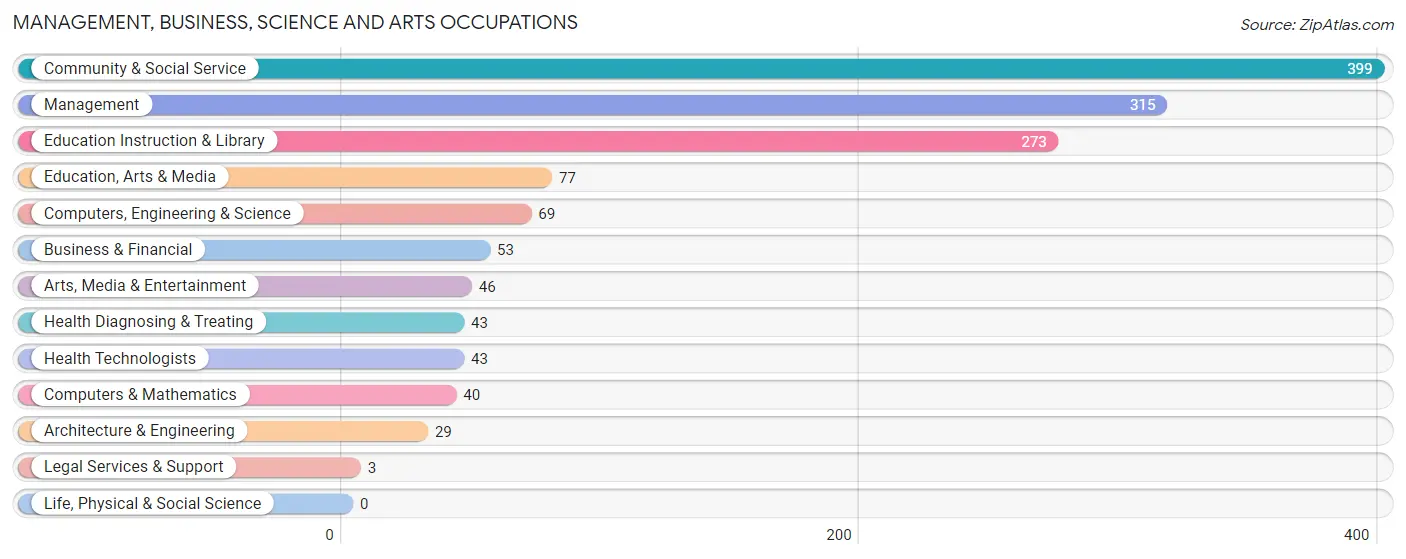
Management, Business, Science and Arts Occupations
The most common Management, Business, Science and Arts occupations in Burton are Community & Social Service (399 | 11.2%), Management (315 | 8.8%), Education Instruction & Library (273 | 7.6%), Education, Arts & Media (77 | 2.2%), and Computers, Engineering & Science (69 | 1.9%).
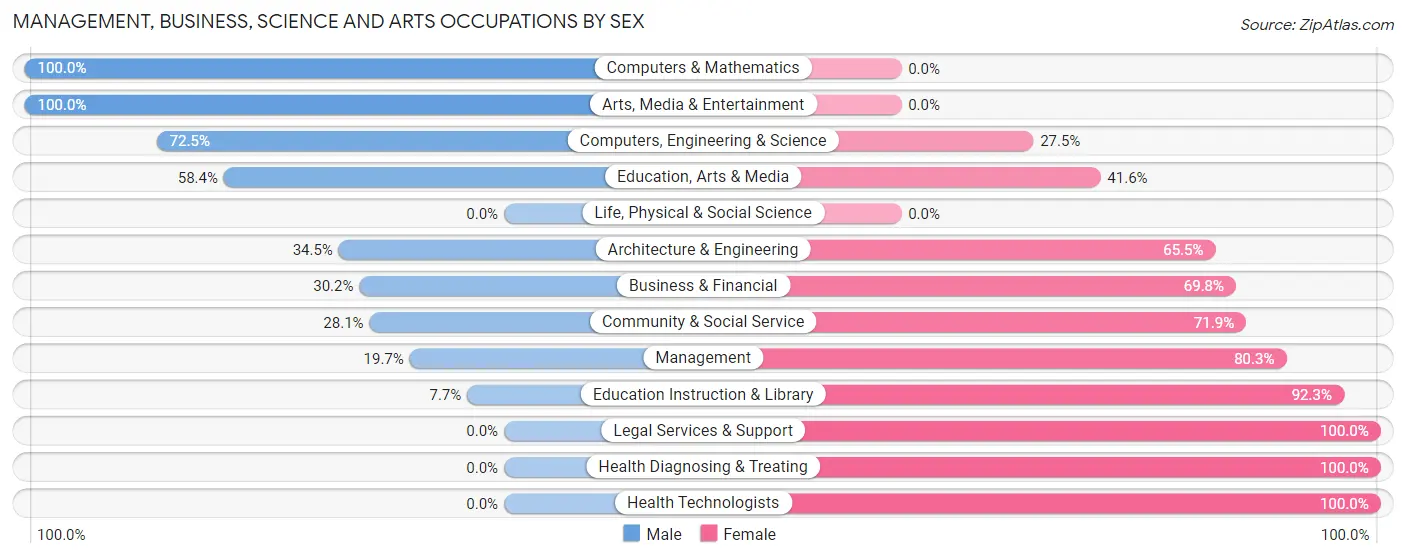
Management, Business, Science and Arts Occupations by Sex
Within the Management, Business, Science and Arts occupations in Burton, the most male-oriented occupations are Computers & Mathematics (100.0%), Arts, Media & Entertainment (100.0%), and Computers, Engineering & Science (72.5%), while the most female-oriented occupations are Legal Services & Support (100.0%), Health Diagnosing & Treating (100.0%), and Health Technologists (100.0%).
| Occupation | Male | Female |
| Management | 62 (19.7%) | 253 (80.3%) |
| Business & Financial | 16 (30.2%) | 37 (69.8%) |
| Computers, Engineering & Science | 50 (72.5%) | 19 (27.5%) |
| Computers & Mathematics | 40 (100.0%) | 0 (0.0%) |
| Architecture & Engineering | 10 (34.5%) | 19 (65.5%) |
| Life, Physical & Social Science | 0 (0.0%) | 0 (0.0%) |
| Community & Social Service | 112 (28.1%) | 287 (71.9%) |
| Education, Arts & Media | 45 (58.4%) | 32 (41.6%) |
| Legal Services & Support | 0 (0.0%) | 3 (100.0%) |
| Education Instruction & Library | 21 (7.7%) | 252 (92.3%) |
| Arts, Media & Entertainment | 46 (100.0%) | 0 (0.0%) |
| Health Diagnosing & Treating | 0 (0.0%) | 43 (100.0%) |
| Health Technologists | 0 (0.0%) | 43 (100.0%) |
| Total (Category) | 240 (27.3%) | 639 (72.7%) |
| Total (Overall) | 1,760 (49.3%) | 1,811 (50.7%) |
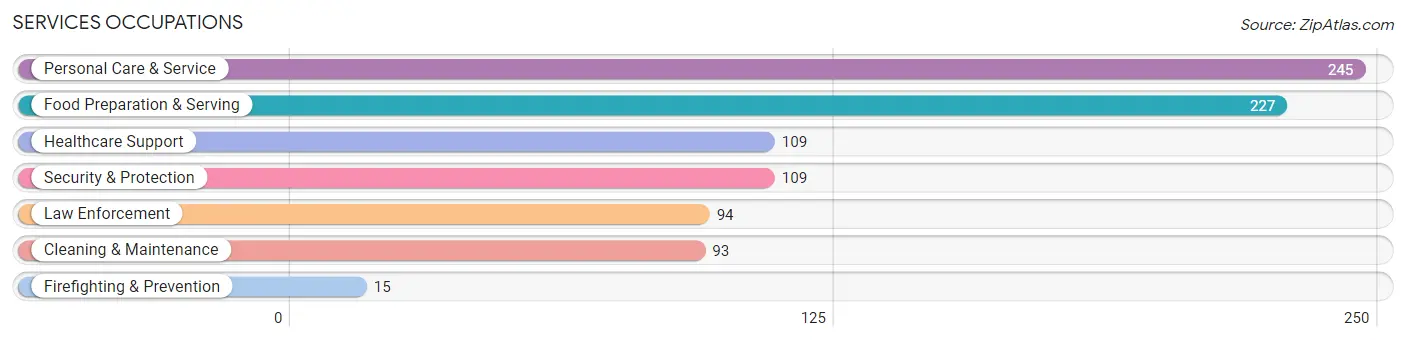
Services Occupations
The most common Services occupations in Burton are Personal Care & Service (245 | 6.9%), Food Preparation & Serving (227 | 6.4%), Healthcare Support (109 | 3.0%), Security & Protection (109 | 3.0%), and Law Enforcement (94 | 2.6%).
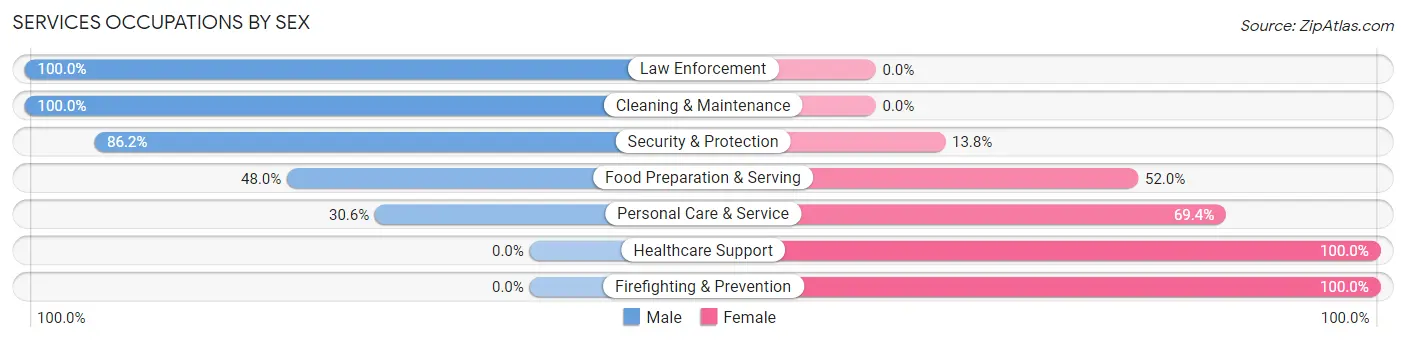
Services Occupations by Sex
Within the Services occupations in Burton, the most male-oriented occupations are Law Enforcement (100.0%), Cleaning & Maintenance (100.0%), and Security & Protection (86.2%), while the most female-oriented occupations are Healthcare Support (100.0%), Firefighting & Prevention (100.0%), and Personal Care & Service (69.4%).
| Occupation | Male | Female |
| Healthcare Support | 0 (0.0%) | 109 (100.0%) |
| Security & Protection | 94 (86.2%) | 15 (13.8%) |
| Firefighting & Prevention | 0 (0.0%) | 15 (100.0%) |
| Law Enforcement | 94 (100.0%) | 0 (0.0%) |
| Food Preparation & Serving | 109 (48.0%) | 118 (52.0%) |
| Cleaning & Maintenance | 93 (100.0%) | 0 (0.0%) |
| Personal Care & Service | 75 (30.6%) | 170 (69.4%) |
| Total (Category) | 371 (47.4%) | 412 (52.6%) |
| Total (Overall) | 1,760 (49.3%) | 1,811 (50.7%) |
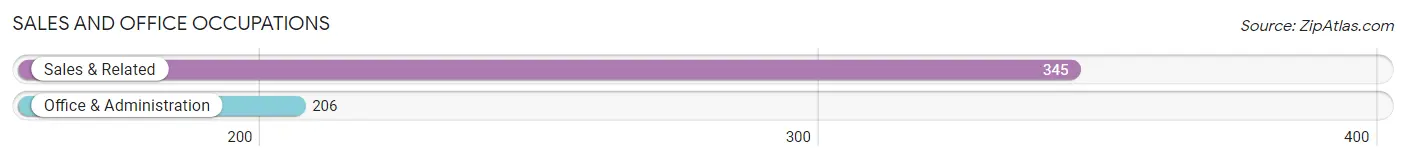
Sales and Office Occupations
The most common Sales and Office occupations in Burton are Sales & Related (345 | 9.7%), and Office & Administration (206 | 5.8%).
Sales and Office Occupations by Sex
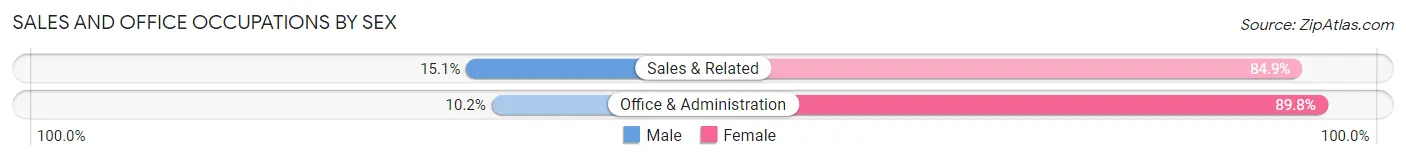
| Occupation | Male | Female |
| Sales & Related | 52 (15.1%) | 293 (84.9%) |
| Office & Administration | 21 (10.2%) | 185 (89.8%) |
| Total (Category) | 73 (13.3%) | 478 (86.8%) |
| Total (Overall) | 1,760 (49.3%) | 1,811 (50.7%) |
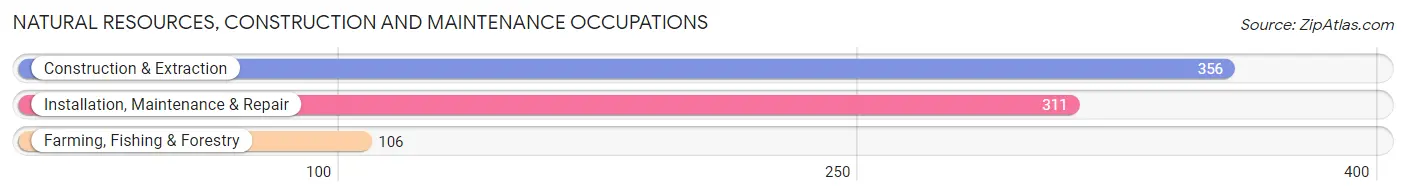
Natural Resources, Construction and Maintenance Occupations
The most common Natural Resources, Construction and Maintenance occupations in Burton are Construction & Extraction (356 | 10.0%), Installation, Maintenance & Repair (311 | 8.7%), and Farming, Fishing & Forestry (106 | 3.0%).
Natural Resources, Construction and Maintenance Occupations by Sex
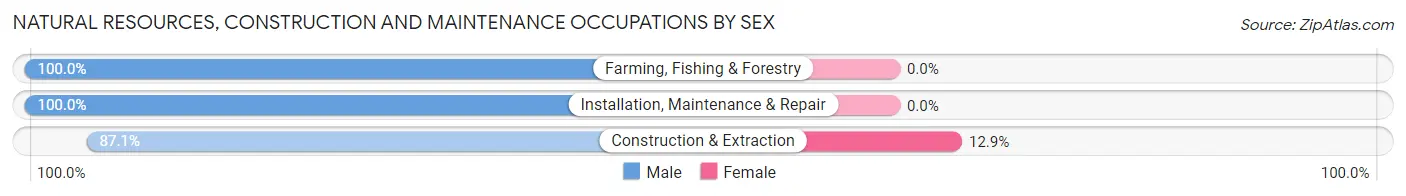
| Occupation | Male | Female |
| Farming, Fishing & Forestry | 106 (100.0%) | 0 (0.0%) |
| Construction & Extraction | 310 (87.1%) | 46 (12.9%) |
| Installation, Maintenance & Repair | 311 (100.0%) | 0 (0.0%) |
| Total (Category) | 727 (94.1%) | 46 (5.9%) |
| Total (Overall) | 1,760 (49.3%) | 1,811 (50.7%) |
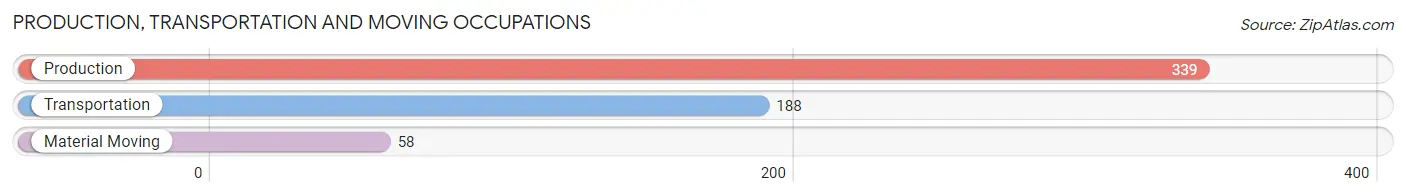
Production, Transportation and Moving Occupations
The most common Production, Transportation and Moving occupations in Burton are Production (339 | 9.5%), Transportation (188 | 5.3%), and Material Moving (58 | 1.6%).
Production, Transportation and Moving Occupations by Sex
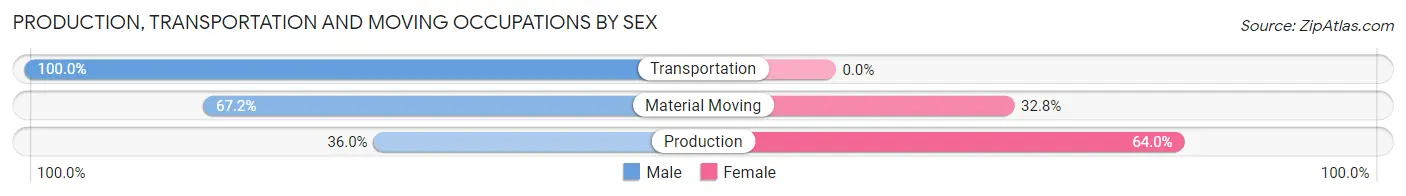
| Occupation | Male | Female |
| Production | 122 (36.0%) | 217 (64.0%) |
| Transportation | 188 (100.0%) | 0 (0.0%) |
| Material Moving | 39 (67.2%) | 19 (32.8%) |
| Total (Category) | 349 (59.7%) | 236 (40.3%) |
| Total (Overall) | 1,760 (49.3%) | 1,811 (50.7%) |
Employment Industries by Sex in Burton
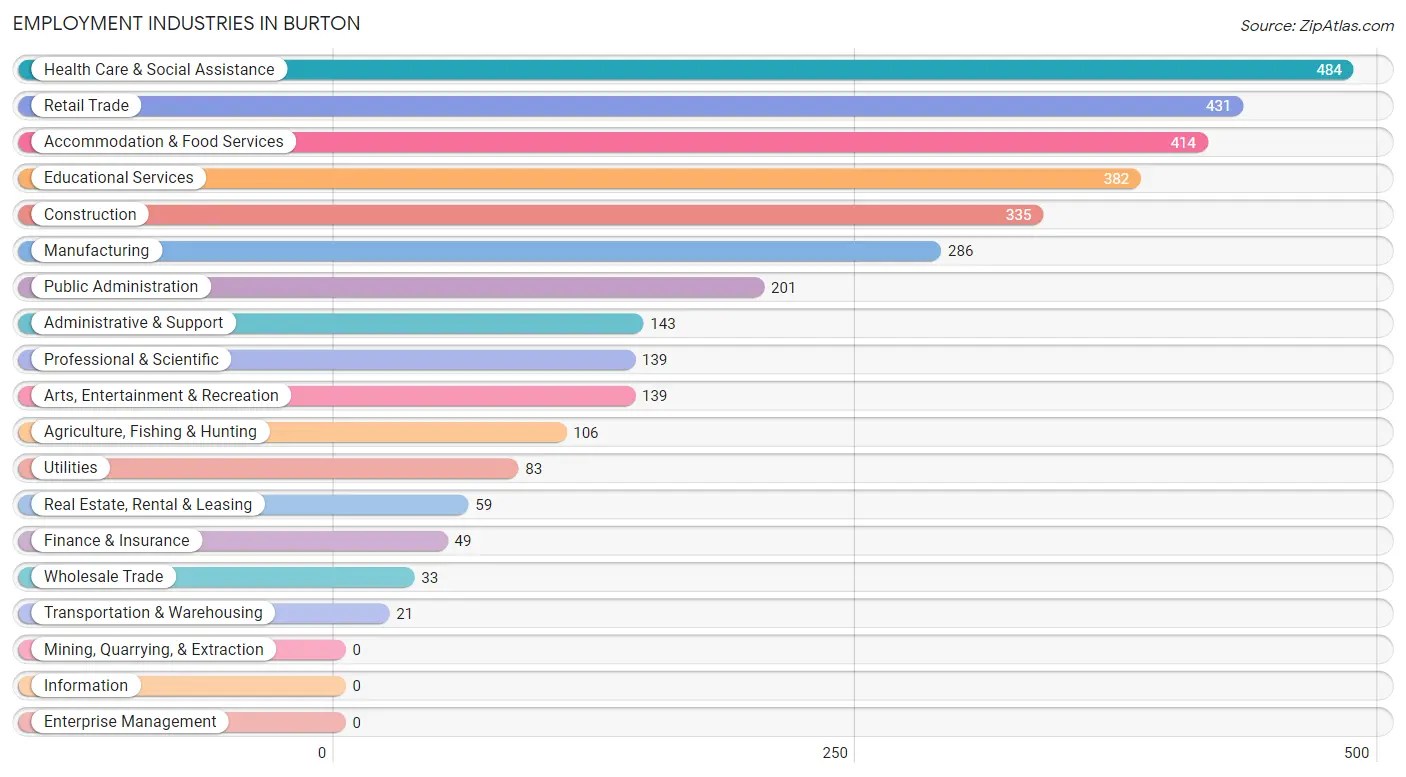
Employment Industries in Burton
The major employment industries in Burton include Health Care & Social Assistance (484 | 13.6%), Retail Trade (431 | 12.1%), Accommodation & Food Services (414 | 11.6%), Educational Services (382 | 10.7%), and Construction (335 | 9.4%).
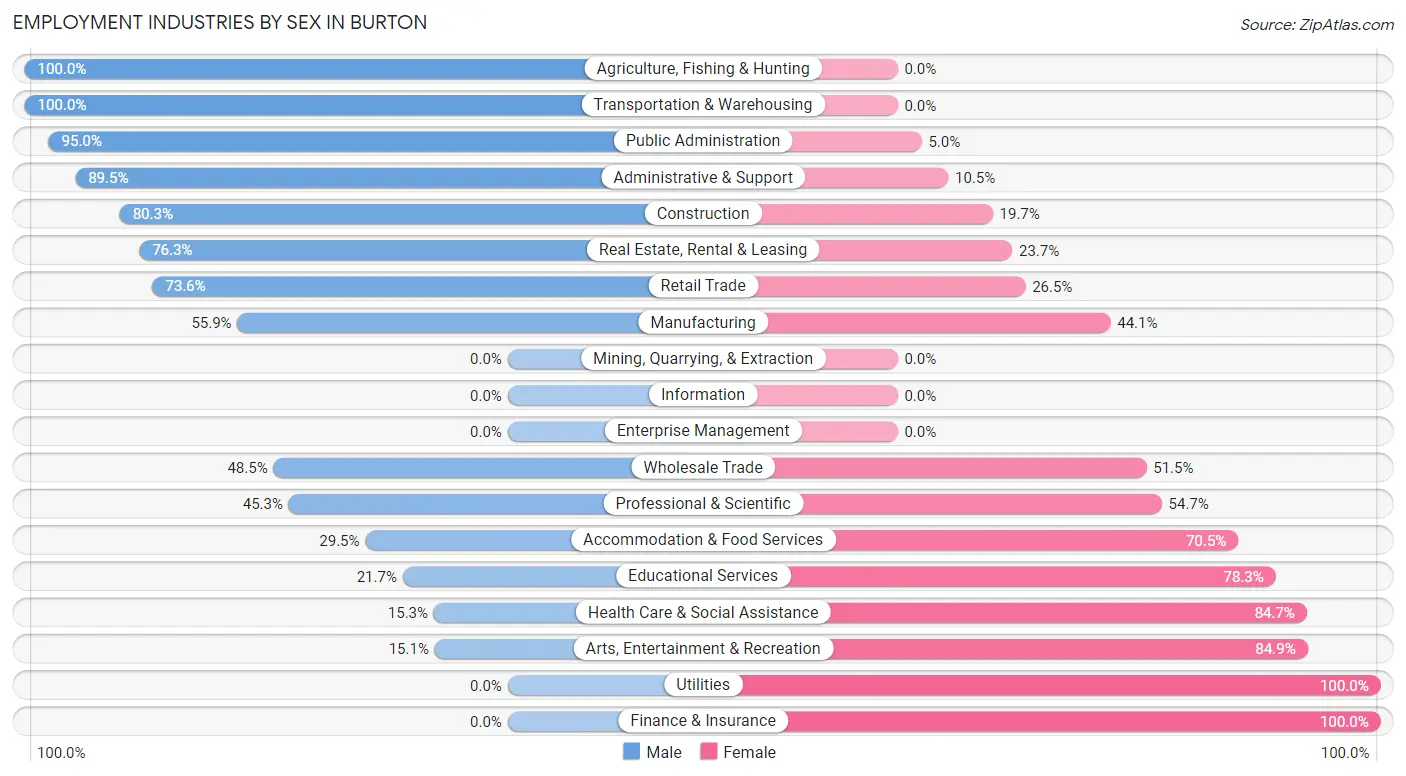
Employment Industries by Sex in Burton
The Burton industries that see more men than women are Agriculture, Fishing & Hunting (100.0%), Transportation & Warehousing (100.0%), and Public Administration (95.0%), whereas the industries that tend to have a higher number of women are Utilities (100.0%), Finance & Insurance (100.0%), and Arts, Entertainment & Recreation (84.9%).
| Industry | Male | Female |
| Agriculture, Fishing & Hunting | 106 (100.0%) | 0 (0.0%) |
| Mining, Quarrying, & Extraction | 0 (0.0%) | 0 (0.0%) |
| Construction | 269 (80.3%) | 66 (19.7%) |
| Manufacturing | 160 (55.9%) | 126 (44.1%) |
| Wholesale Trade | 16 (48.5%) | 17 (51.5%) |
| Retail Trade | 317 (73.6%) | 114 (26.5%) |
| Transportation & Warehousing | 21 (100.0%) | 0 (0.0%) |
| Utilities | 0 (0.0%) | 83 (100.0%) |
| Information | 0 (0.0%) | 0 (0.0%) |
| Finance & Insurance | 0 (0.0%) | 49 (100.0%) |
| Real Estate, Rental & Leasing | 45 (76.3%) | 14 (23.7%) |
| Professional & Scientific | 63 (45.3%) | 76 (54.7%) |
| Enterprise Management | 0 (0.0%) | 0 (0.0%) |
| Administrative & Support | 128 (89.5%) | 15 (10.5%) |
| Educational Services | 83 (21.7%) | 299 (78.3%) |
| Health Care & Social Assistance | 74 (15.3%) | 410 (84.7%) |
| Arts, Entertainment & Recreation | 21 (15.1%) | 118 (84.9%) |
| Accommodation & Food Services | 122 (29.5%) | 292 (70.5%) |
| Public Administration | 191 (95.0%) | 10 (5.0%) |
| Total | 1,760 (49.3%) | 1,811 (50.7%) |
Education in Burton
School Enrollment in Burton
The most common levels of schooling among the 1,521 students in Burton are elementary school (447 | 29.4%), high school (366 | 24.1%), and college / undergraduate (294 | 19.3%).
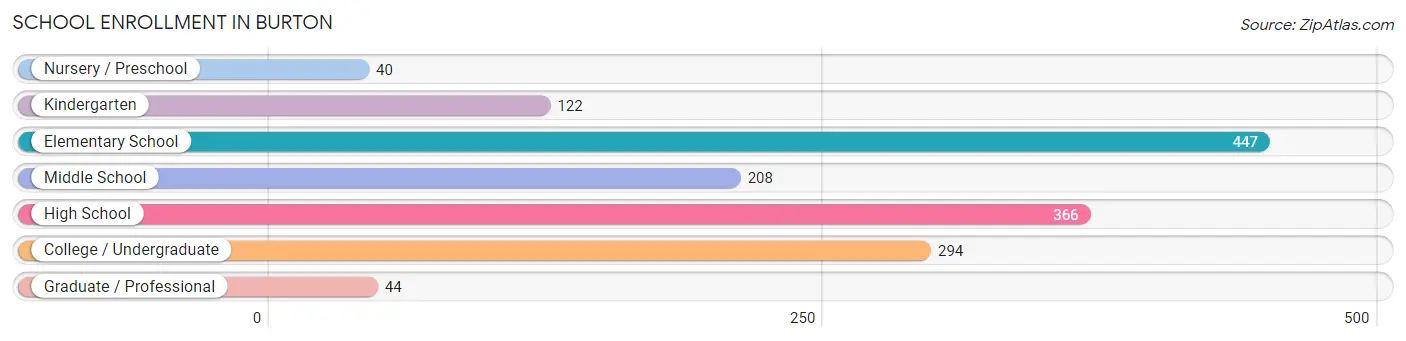
| School Level | # Students | % Students |
| Nursery / Preschool | 40 | 2.6% |
| Kindergarten | 122 | 8.0% |
| Elementary School | 447 | 29.4% |
| Middle School | 208 | 13.7% |
| High School | 366 | 24.1% |
| College / Undergraduate | 294 | 19.3% |
| Graduate / Professional | 44 | 2.9% |
| Total | 1,521 | 100.0% |
School Enrollment by Age by Funding Source in Burton
Out of a total of 1,521 students who are enrolled in schools in Burton, 316 (20.8%) attend a private institution, while the remaining 1,205 (79.2%) are enrolled in public schools. The age group of 25 to 34 year olds has the highest likelihood of being enrolled in private schools, with 165 (91.7% in the age bracket) enrolled. Conversely, the age group of 3 to 4 year olds has the lowest likelihood of being enrolled in a private school, with 40 (100.0% in the age bracket) attending a public institution.
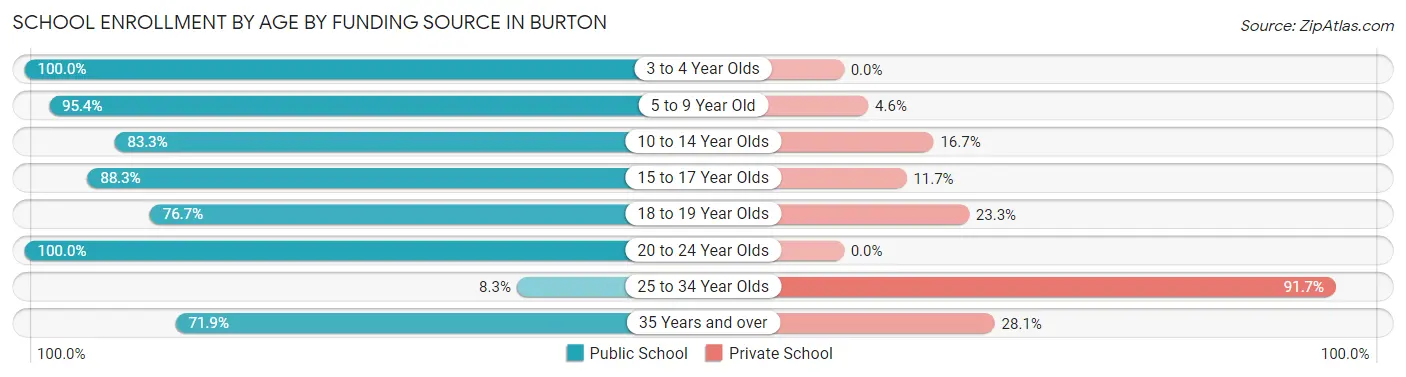
| Age Bracket | Public School | Private School |
| 3 to 4 Year Olds | 40 (100.0%) | 0 (0.0%) |
| 5 to 9 Year Old | 523 (95.4%) | 25 (4.6%) |
| 10 to 14 Year Olds | 204 (83.3%) | 41 (16.7%) |
| 15 to 17 Year Olds | 204 (88.3%) | 27 (11.7%) |
| 18 to 19 Year Olds | 161 (76.7%) | 49 (23.3%) |
| 20 to 24 Year Olds | 35 (100.0%) | 0 (0.0%) |
| 25 to 34 Year Olds | 15 (8.3%) | 165 (91.7%) |
| 35 Years and over | 23 (71.9%) | 9 (28.1%) |
| Total | 1,205 (79.2%) | 316 (20.8%) |
Educational Attainment by Field of Study in Burton
Business (158 | 21.8%), education (118 | 16.3%), science & technology (98 | 13.5%), arts & humanities (96 | 13.2%), and psychology (69 | 9.5%) are the most common fields of study among 725 individuals in Burton who have obtained a bachelor's degree or higher.
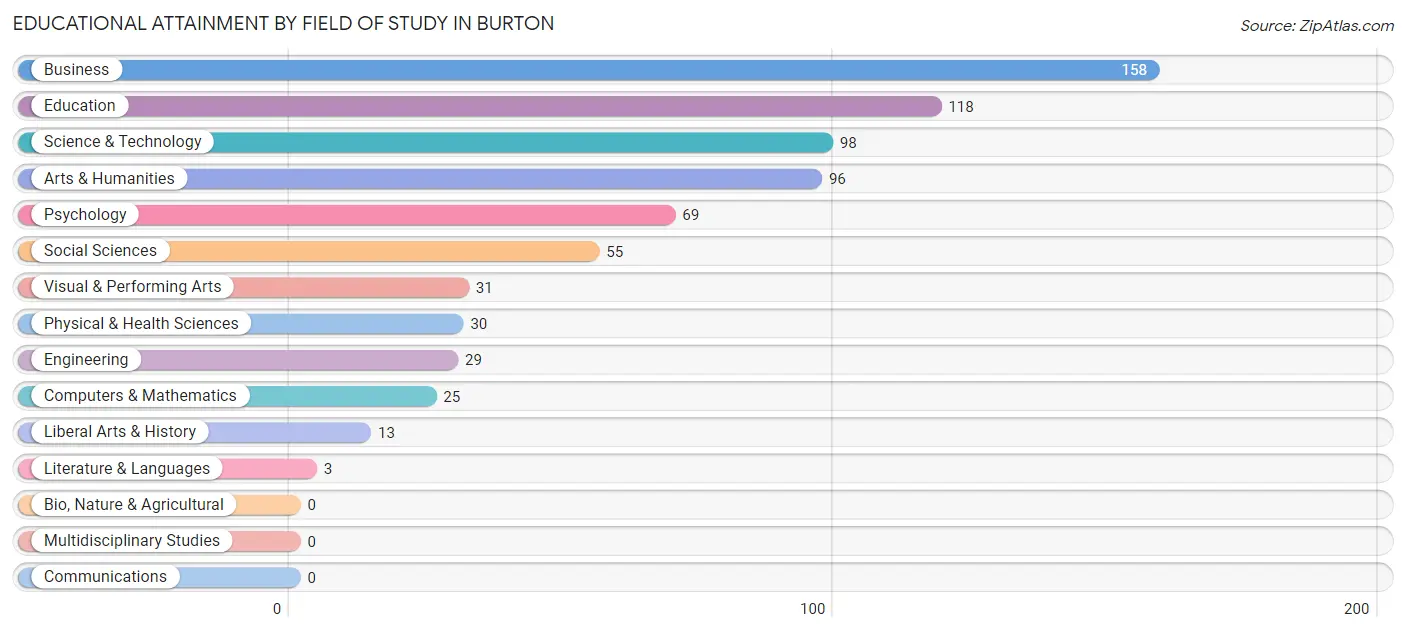
| Field of Study | # Graduates | % Graduates |
| Computers & Mathematics | 25 | 3.5% |
| Bio, Nature & Agricultural | 0 | 0.0% |
| Physical & Health Sciences | 30 | 4.1% |
| Psychology | 69 | 9.5% |
| Social Sciences | 55 | 7.6% |
| Engineering | 29 | 4.0% |
| Multidisciplinary Studies | 0 | 0.0% |
| Science & Technology | 98 | 13.5% |
| Business | 158 | 21.8% |
| Education | 118 | 16.3% |
| Literature & Languages | 3 | 0.4% |
| Liberal Arts & History | 13 | 1.8% |
| Visual & Performing Arts | 31 | 4.3% |
| Communications | 0 | 0.0% |
| Arts & Humanities | 96 | 13.2% |
| Total | 725 | 100.0% |
Transportation & Commute in Burton
Vehicle Availability by Sex in Burton
The most prevalent vehicle ownership categories in Burton are males with 2 vehicles (823, accounting for 45.6%) and females with 2 vehicles (551, making up 47.5%).
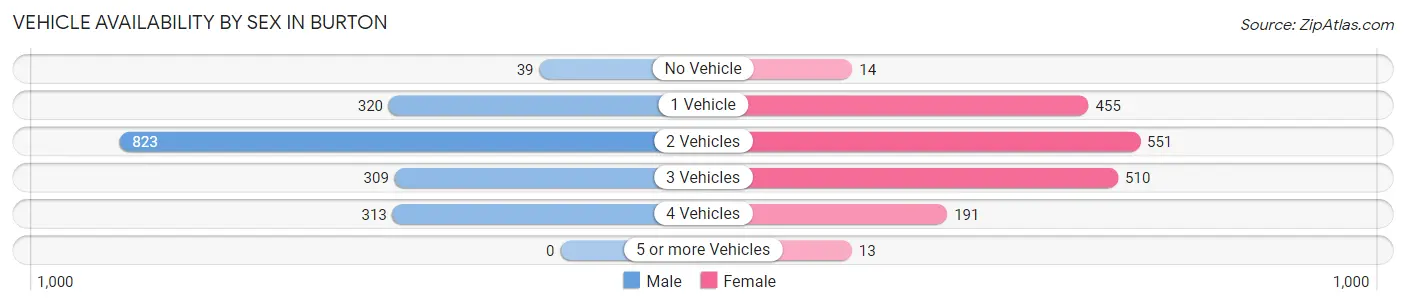
| Vehicles Available | Male | Female |
| No Vehicle | 39 (2.2%) | 14 (0.8%) |
| 1 Vehicle | 320 (17.7%) | 455 (26.2%) |
| 2 Vehicles | 823 (45.6%) | 551 (31.8%) |
| 3 Vehicles | 309 (17.1%) | 510 (29.4%) |
| 4 Vehicles | 313 (17.3%) | 191 (11.0%) |
| 5 or more Vehicles | 0 (0.0%) | 13 (0.7%) |
| Total | 1,804 (100.0%) | 1,734 (100.0%) |
Commute Time in Burton
The most frequently occuring commute durations in Burton are 15 to 19 minutes (873 commuters, 25.8%), 30 to 34 minutes (771 commuters, 22.8%), and 20 to 24 minutes (417 commuters, 12.3%).
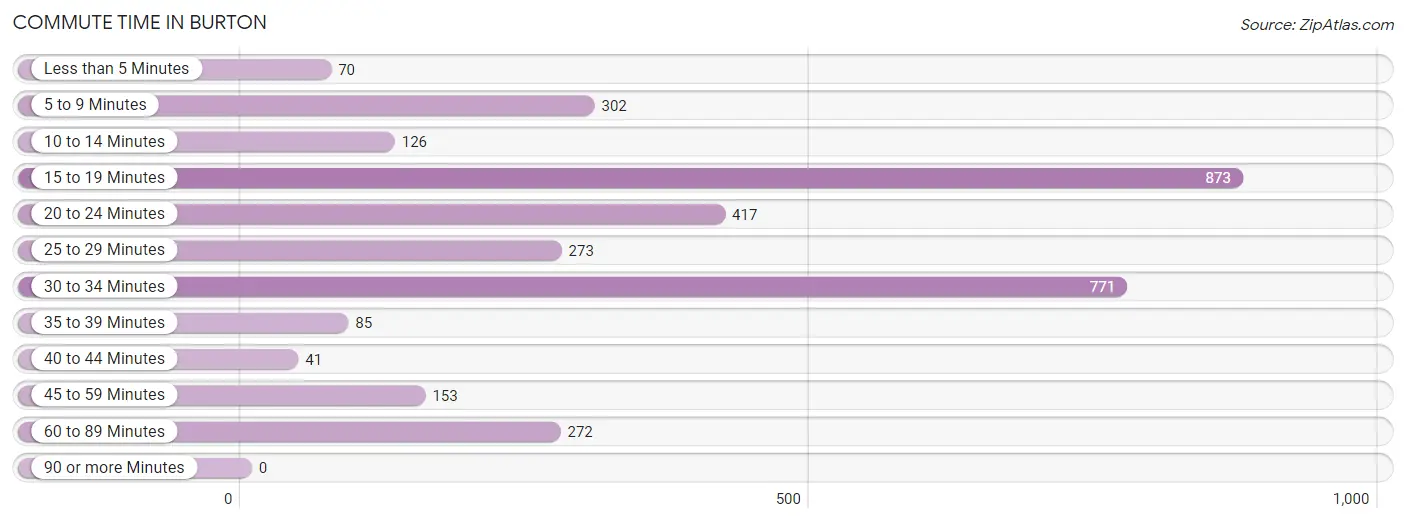
| Commute Time | # Commuters | % Commuters |
| Less than 5 Minutes | 70 | 2.1% |
| 5 to 9 Minutes | 302 | 8.9% |
| 10 to 14 Minutes | 126 | 3.7% |
| 15 to 19 Minutes | 873 | 25.8% |
| 20 to 24 Minutes | 417 | 12.3% |
| 25 to 29 Minutes | 273 | 8.1% |
| 30 to 34 Minutes | 771 | 22.8% |
| 35 to 39 Minutes | 85 | 2.5% |
| 40 to 44 Minutes | 41 | 1.2% |
| 45 to 59 Minutes | 153 | 4.5% |
| 60 to 89 Minutes | 272 | 8.0% |
| 90 or more Minutes | 0 | 0.0% |
Commute Time by Sex in Burton
The most common commute times in Burton are 30 to 34 minutes (497 commuters, 28.3%) for males and 15 to 19 minutes (443 commuters, 27.2%) for females.
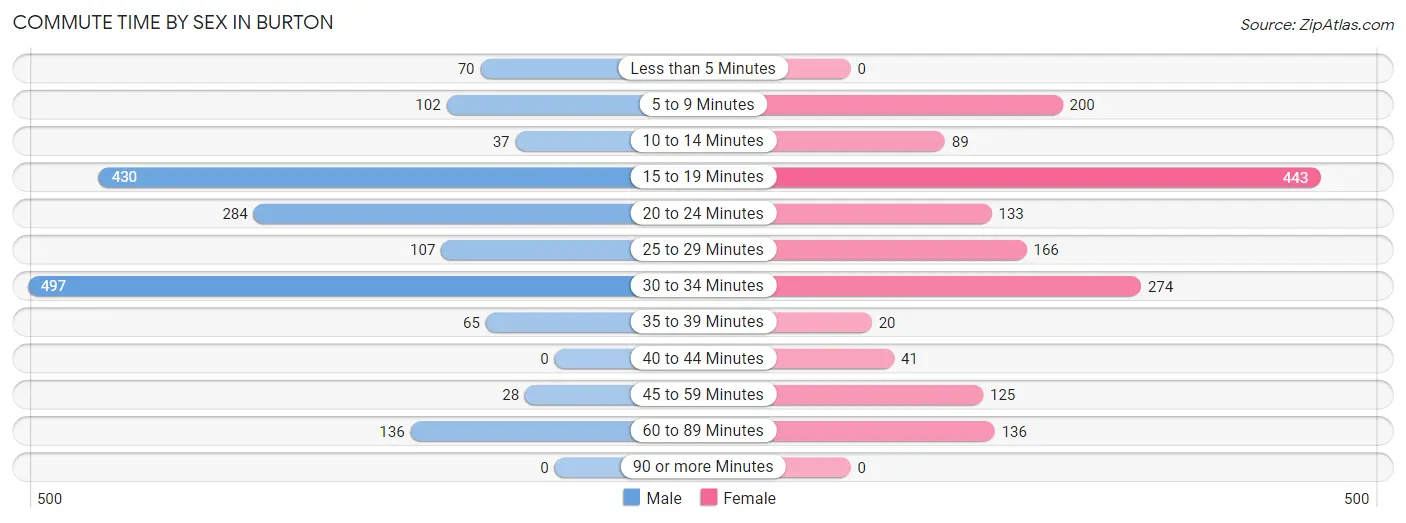
| Commute Time | Male | Female |
| Less than 5 Minutes | 70 (4.0%) | 0 (0.0%) |
| 5 to 9 Minutes | 102 (5.8%) | 200 (12.3%) |
| 10 to 14 Minutes | 37 (2.1%) | 89 (5.5%) |
| 15 to 19 Minutes | 430 (24.5%) | 443 (27.2%) |
| 20 to 24 Minutes | 284 (16.2%) | 133 (8.2%) |
| 25 to 29 Minutes | 107 (6.1%) | 166 (10.2%) |
| 30 to 34 Minutes | 497 (28.3%) | 274 (16.8%) |
| 35 to 39 Minutes | 65 (3.7%) | 20 (1.2%) |
| 40 to 44 Minutes | 0 (0.0%) | 41 (2.5%) |
| 45 to 59 Minutes | 28 (1.6%) | 125 (7.7%) |
| 60 to 89 Minutes | 136 (7.7%) | 136 (8.4%) |
| 90 or more Minutes | 0 (0.0%) | 0 (0.0%) |
Time of Departure to Work by Sex in Burton
The most frequent times of departure to work in Burton are 6:30 AM to 6:59 AM (672, 38.3%) for males and 7:00 AM to 7:29 AM (338, 20.8%) for females.
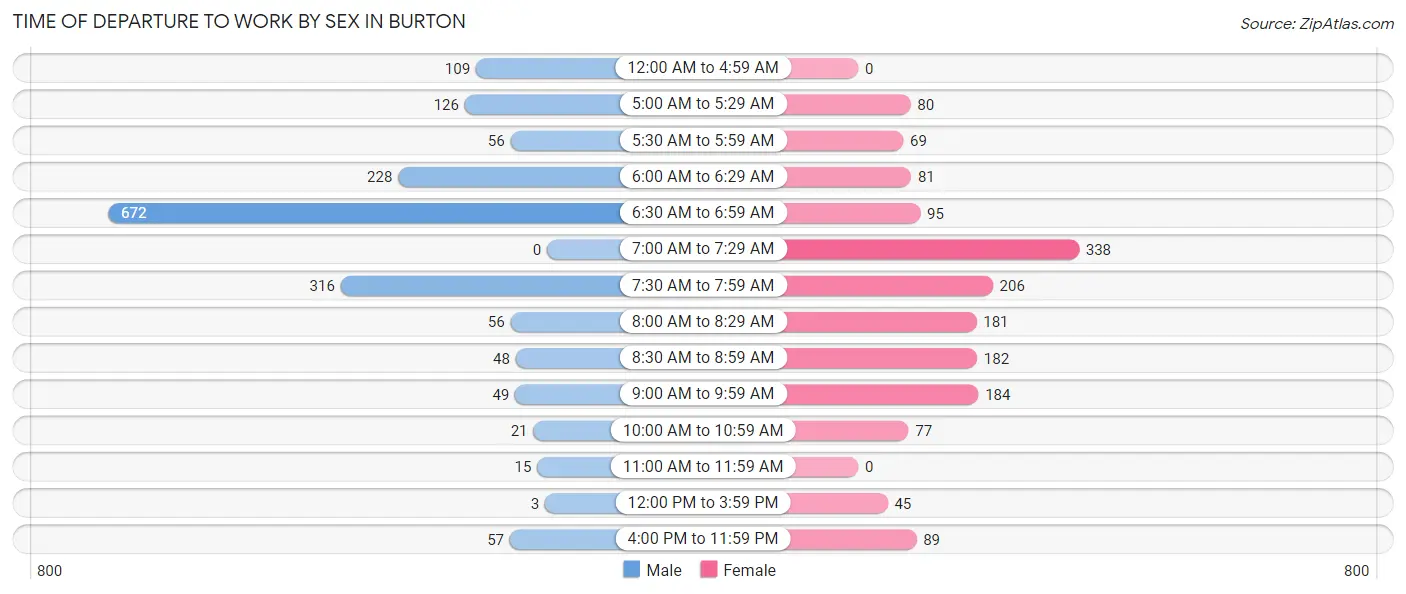
| Time of Departure | Male | Female |
| 12:00 AM to 4:59 AM | 109 (6.2%) | 0 (0.0%) |
| 5:00 AM to 5:29 AM | 126 (7.2%) | 80 (4.9%) |
| 5:30 AM to 5:59 AM | 56 (3.2%) | 69 (4.2%) |
| 6:00 AM to 6:29 AM | 228 (13.0%) | 81 (5.0%) |
| 6:30 AM to 6:59 AM | 672 (38.3%) | 95 (5.8%) |
| 7:00 AM to 7:29 AM | 0 (0.0%) | 338 (20.8%) |
| 7:30 AM to 7:59 AM | 316 (18.0%) | 206 (12.7%) |
| 8:00 AM to 8:29 AM | 56 (3.2%) | 181 (11.1%) |
| 8:30 AM to 8:59 AM | 48 (2.7%) | 182 (11.2%) |
| 9:00 AM to 9:59 AM | 49 (2.8%) | 184 (11.3%) |
| 10:00 AM to 10:59 AM | 21 (1.2%) | 77 (4.7%) |
| 11:00 AM to 11:59 AM | 15 (0.9%) | 0 (0.0%) |
| 12:00 PM to 3:59 PM | 3 (0.2%) | 45 (2.8%) |
| 4:00 PM to 11:59 PM | 57 (3.3%) | 89 (5.5%) |
| Total | 1,756 (100.0%) | 1,627 (100.0%) |
Housing Occupancy in Burton
Occupancy by Ownership in Burton
Of the total 2,621 dwellings in Burton, owner-occupied units account for 1,413 (53.9%), while renter-occupied units make up 1,208 (46.1%).
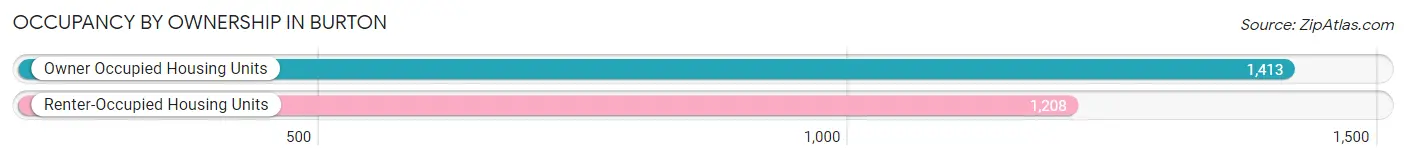
| Occupancy | # Housing Units | % Housing Units |
| Owner Occupied Housing Units | 1,413 | 53.9% |
| Renter-Occupied Housing Units | 1,208 | 46.1% |
| Total Occupied Housing Units | 2,621 | 100.0% |
Occupancy by Household Size in Burton
| Household Size | # Housing Units | % Housing Units |
| 1-Person Household | 598 | 22.8% |
| 2-Person Household | 819 | 31.2% |
| 3-Person Household | 755 | 28.8% |
| 4+ Person Household | 449 | 17.1% |
| Total Housing Units | 2,621 | 100.0% |
Occupancy by Ownership by Household Size in Burton
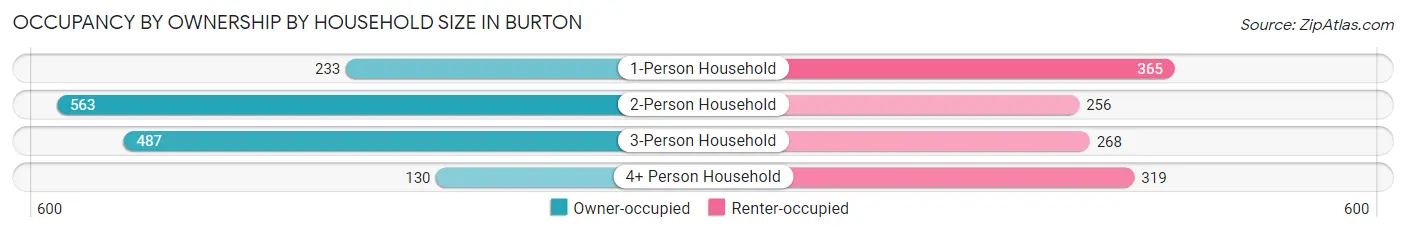
| Household Size | Owner-occupied | Renter-occupied |
| 1-Person Household | 233 (39.0%) | 365 (61.0%) |
| 2-Person Household | 563 (68.7%) | 256 (31.3%) |
| 3-Person Household | 487 (64.5%) | 268 (35.5%) |
| 4+ Person Household | 130 (28.9%) | 319 (71.1%) |
| Total Housing Units | 1,413 (53.9%) | 1,208 (46.1%) |
Occupancy by Educational Attainment in Burton
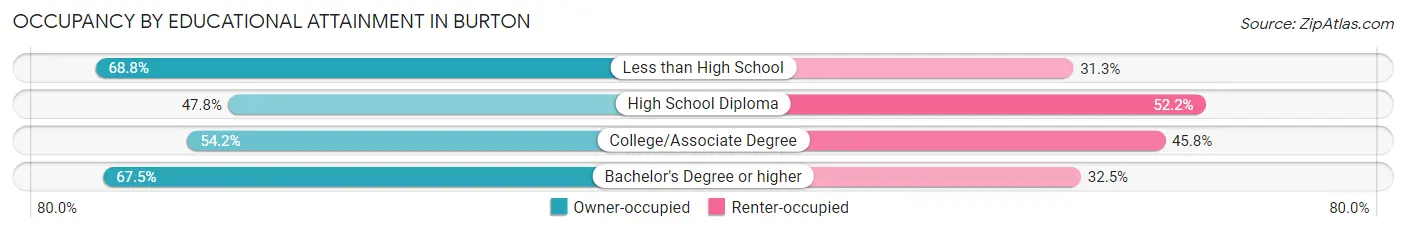
| Household Size | Owner-occupied | Renter-occupied |
| Less than High School | 121 (68.8%) | 55 (31.2%) |
| High School Diploma | 591 (47.8%) | 646 (52.2%) |
| College/Associate Degree | 466 (54.2%) | 394 (45.8%) |
| Bachelor's Degree or higher | 235 (67.5%) | 113 (32.5%) |
Occupancy by Age of Householder in Burton
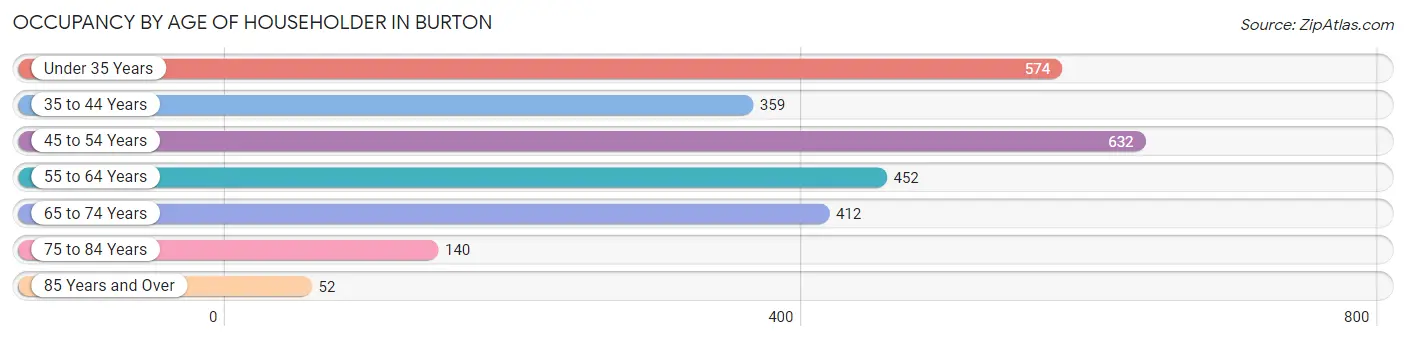
| Age Bracket | # Households | % Households |
| Under 35 Years | 574 | 21.9% |
| 35 to 44 Years | 359 | 13.7% |
| 45 to 54 Years | 632 | 24.1% |
| 55 to 64 Years | 452 | 17.2% |
| 65 to 74 Years | 412 | 15.7% |
| 75 to 84 Years | 140 | 5.3% |
| 85 Years and Over | 52 | 2.0% |
| Total | 2,621 | 100.0% |
Housing Finances in Burton
Median Income by Occupancy in Burton
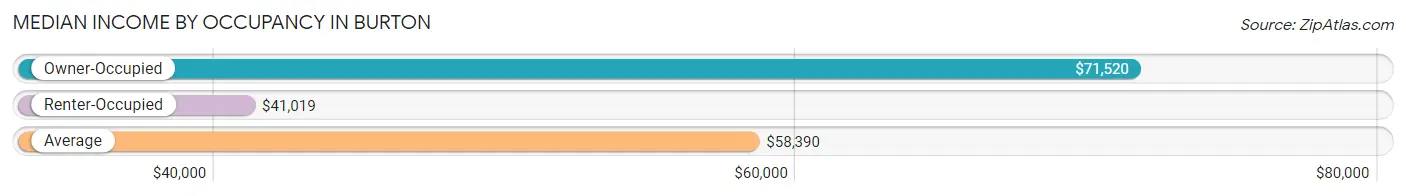
| Occupancy Type | # Households | Median Income |
| Owner-Occupied | 1,413 (53.9%) | $71,520 |
| Renter-Occupied | 1,208 (46.1%) | $41,019 |
| Average | 2,621 (100.0%) | $58,390 |
Occupancy by Householder Income Bracket in Burton
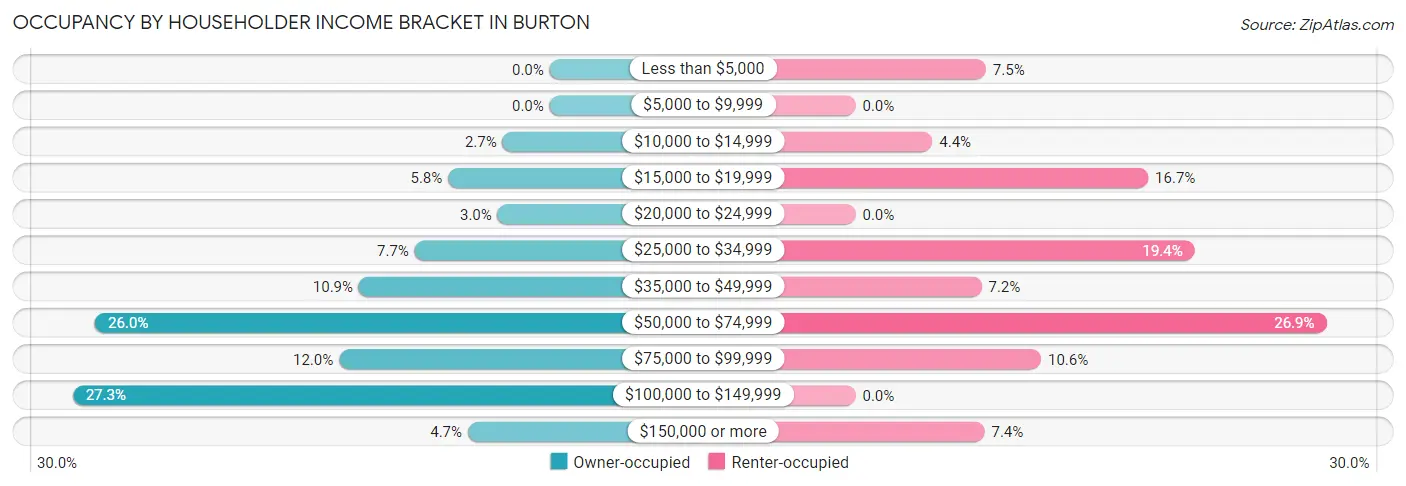
| Income Bracket | Owner-occupied | Renter-occupied |
| Less than $5,000 | 0 (0.0%) | 90 (7.4%) |
| $5,000 to $9,999 | 0 (0.0%) | 0 (0.0%) |
| $10,000 to $14,999 | 38 (2.7%) | 53 (4.4%) |
| $15,000 to $19,999 | 82 (5.8%) | 202 (16.7%) |
| $20,000 to $24,999 | 42 (3.0%) | 0 (0.0%) |
| $25,000 to $34,999 | 109 (7.7%) | 234 (19.4%) |
| $35,000 to $49,999 | 154 (10.9%) | 87 (7.2%) |
| $50,000 to $74,999 | 367 (26.0%) | 325 (26.9%) |
| $75,000 to $99,999 | 170 (12.0%) | 128 (10.6%) |
| $100,000 to $149,999 | 385 (27.3%) | 0 (0.0%) |
| $150,000 or more | 66 (4.7%) | 89 (7.4%) |
| Total | 1,413 (100.0%) | 1,208 (100.0%) |
Monthly Housing Cost Tiers in Burton
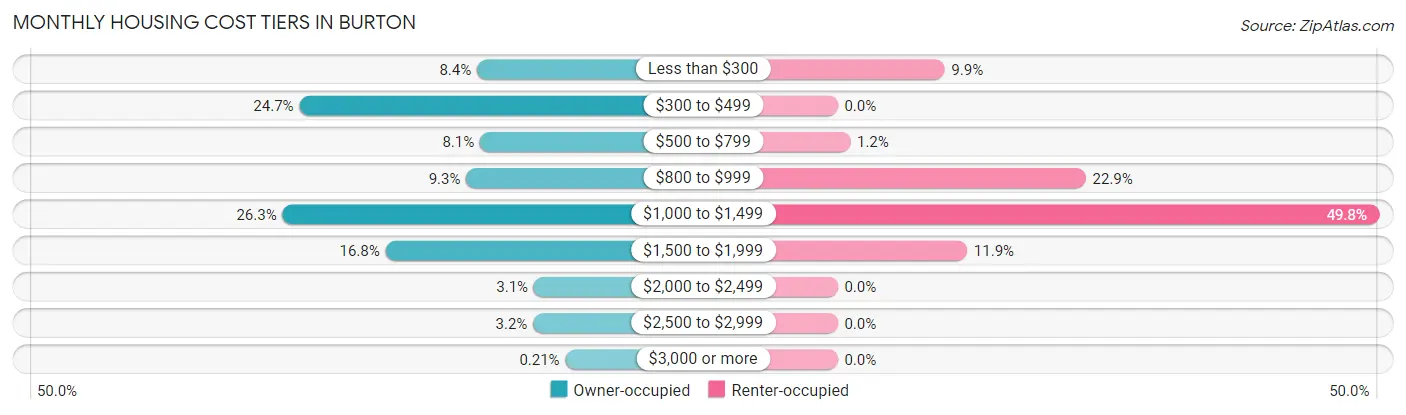
| Monthly Cost | Owner-occupied | Renter-occupied |
| Less than $300 | 118 (8.4%) | 119 (9.9%) |
| $300 to $499 | 349 (24.7%) | 0 (0.0%) |
| $500 to $799 | 114 (8.1%) | 14 (1.2%) |
| $800 to $999 | 132 (9.3%) | 276 (22.9%) |
| $1,000 to $1,499 | 371 (26.3%) | 602 (49.8%) |
| $1,500 to $1,999 | 237 (16.8%) | 144 (11.9%) |
| $2,000 to $2,499 | 44 (3.1%) | 0 (0.0%) |
| $2,500 to $2,999 | 45 (3.2%) | 0 (0.0%) |
| $3,000 or more | 3 (0.2%) | 0 (0.0%) |
| Total | 1,413 (100.0%) | 1,208 (100.0%) |
Physical Housing Characteristics in Burton
Housing Structures in Burton
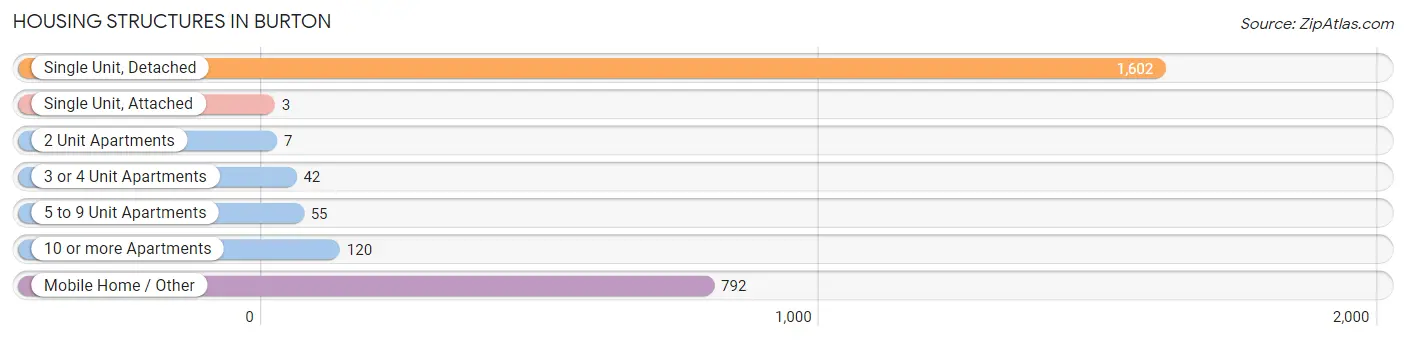
| Structure Type | # Housing Units | % Housing Units |
| Single Unit, Detached | 1,602 | 61.1% |
| Single Unit, Attached | 3 | 0.1% |
| 2 Unit Apartments | 7 | 0.3% |
| 3 or 4 Unit Apartments | 42 | 1.6% |
| 5 to 9 Unit Apartments | 55 | 2.1% |
| 10 or more Apartments | 120 | 4.6% |
| Mobile Home / Other | 792 | 30.2% |
| Total | 2,621 | 100.0% |
Housing Structures by Occupancy in Burton
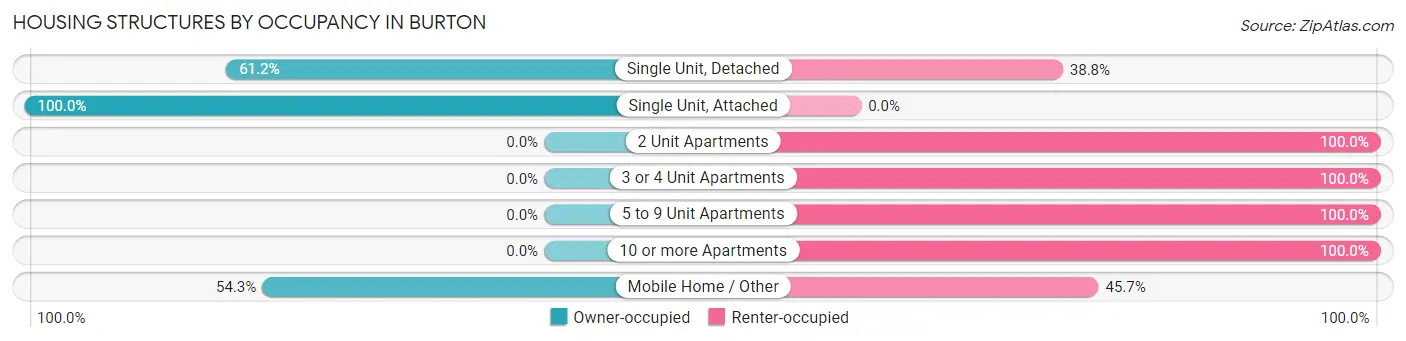
| Structure Type | Owner-occupied | Renter-occupied |
| Single Unit, Detached | 980 (61.2%) | 622 (38.8%) |
| Single Unit, Attached | 3 (100.0%) | 0 (0.0%) |
| 2 Unit Apartments | 0 (0.0%) | 7 (100.0%) |
| 3 or 4 Unit Apartments | 0 (0.0%) | 42 (100.0%) |
| 5 to 9 Unit Apartments | 0 (0.0%) | 55 (100.0%) |
| 10 or more Apartments | 0 (0.0%) | 120 (100.0%) |
| Mobile Home / Other | 430 (54.3%) | 362 (45.7%) |
| Total | 1,413 (53.9%) | 1,208 (46.1%) |
Housing Structures by Number of Rooms in Burton
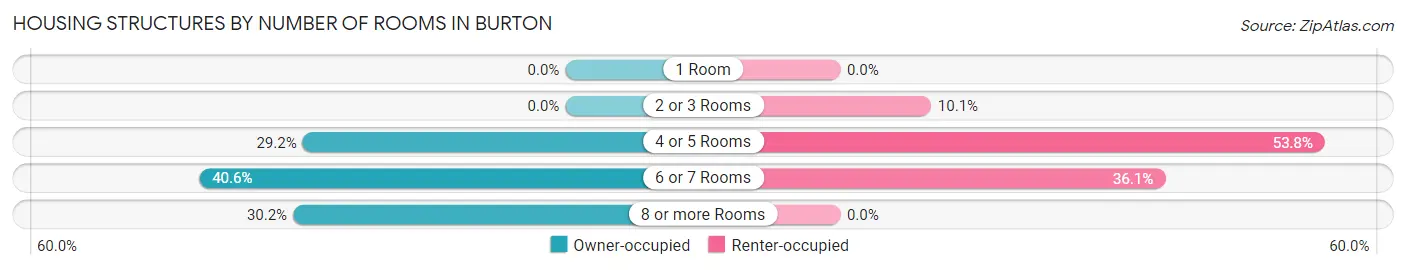
| Number of Rooms | Owner-occupied | Renter-occupied |
| 1 Room | 0 (0.0%) | 0 (0.0%) |
| 2 or 3 Rooms | 0 (0.0%) | 122 (10.1%) |
| 4 or 5 Rooms | 412 (29.2%) | 650 (53.8%) |
| 6 or 7 Rooms | 574 (40.6%) | 436 (36.1%) |
| 8 or more Rooms | 427 (30.2%) | 0 (0.0%) |
| Total | 1,413 (100.0%) | 1,208 (100.0%) |
Housing Structure by Heating Type in Burton
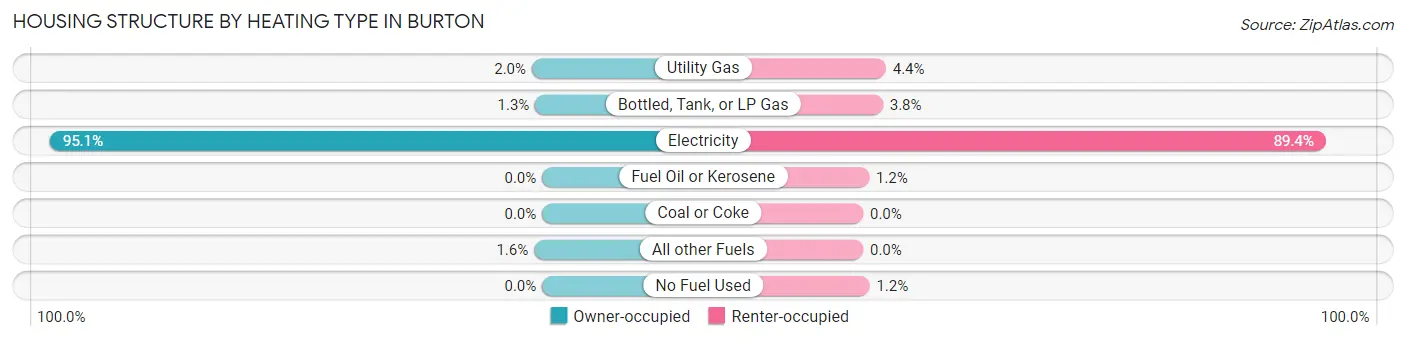
| Heating Type | Owner-occupied | Renter-occupied |
| Utility Gas | 28 (2.0%) | 53 (4.4%) |
| Bottled, Tank, or LP Gas | 19 (1.3%) | 46 (3.8%) |
| Electricity | 1,344 (95.1%) | 1,080 (89.4%) |
| Fuel Oil or Kerosene | 0 (0.0%) | 14 (1.2%) |
| Coal or Coke | 0 (0.0%) | 0 (0.0%) |
| All other Fuels | 22 (1.6%) | 0 (0.0%) |
| No Fuel Used | 0 (0.0%) | 15 (1.2%) |
| Total | 1,413 (100.0%) | 1,208 (100.0%) |
Household Vehicle Usage in Burton
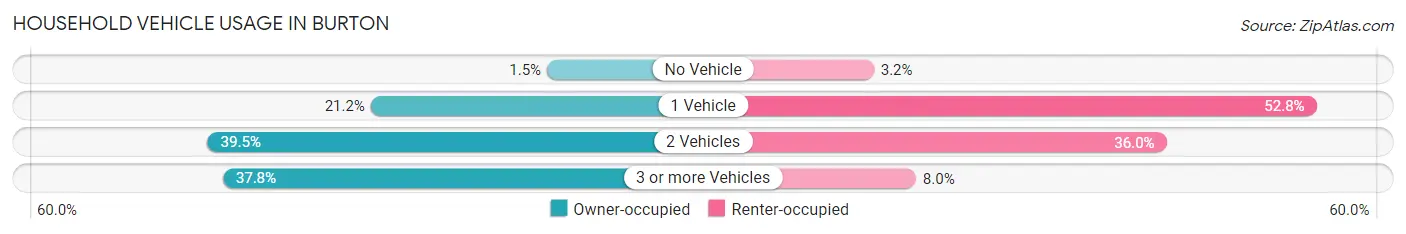
| Vehicles per Household | Owner-occupied | Renter-occupied |
| No Vehicle | 21 (1.5%) | 39 (3.2%) |
| 1 Vehicle | 300 (21.2%) | 638 (52.8%) |
| 2 Vehicles | 558 (39.5%) | 435 (36.0%) |
| 3 or more Vehicles | 534 (37.8%) | 96 (8.0%) |
| Total | 1,413 (100.0%) | 1,208 (100.0%) |
Real Estate & Mortgages in Burton
Real Estate and Mortgage Overview in Burton
| Characteristic | Without Mortgage | With Mortgage |
| Housing Units | 540 | 873 |
| Median Property Value | $165,700 | $192,300 |
| Median Household Income | $57,381 | $66 |
| Monthly Housing Costs | $378 | $3 |
| Real Estate Taxes | $857 | $26 |
Property Value by Mortgage Status in Burton
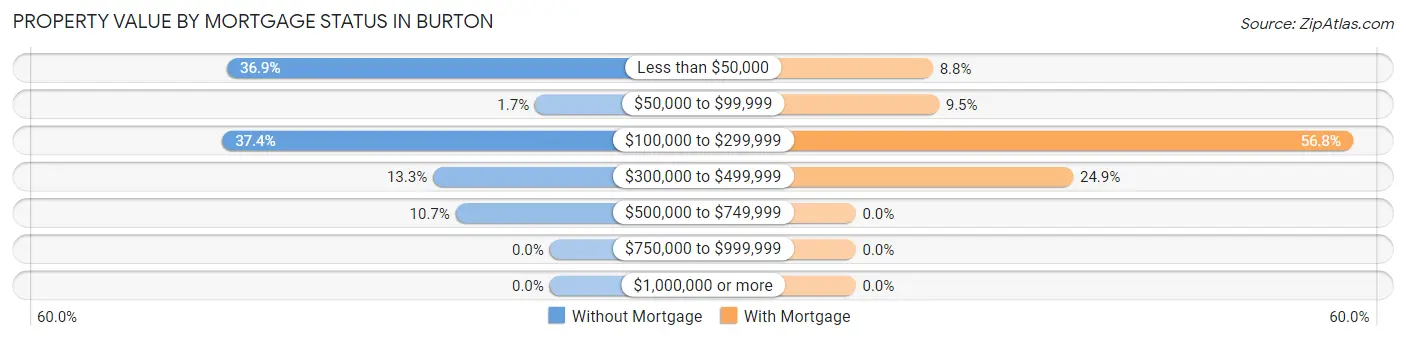
| Property Value | Without Mortgage | With Mortgage |
| Less than $50,000 | 199 (36.8%) | 77 (8.8%) |
| $50,000 to $99,999 | 9 (1.7%) | 83 (9.5%) |
| $100,000 to $299,999 | 202 (37.4%) | 496 (56.8%) |
| $300,000 to $499,999 | 72 (13.3%) | 217 (24.9%) |
| $500,000 to $749,999 | 58 (10.7%) | 0 (0.0%) |
| $750,000 to $999,999 | 0 (0.0%) | 0 (0.0%) |
| $1,000,000 or more | 0 (0.0%) | 0 (0.0%) |
| Total | 540 (100.0%) | 873 (100.0%) |
Household Income by Mortgage Status in Burton
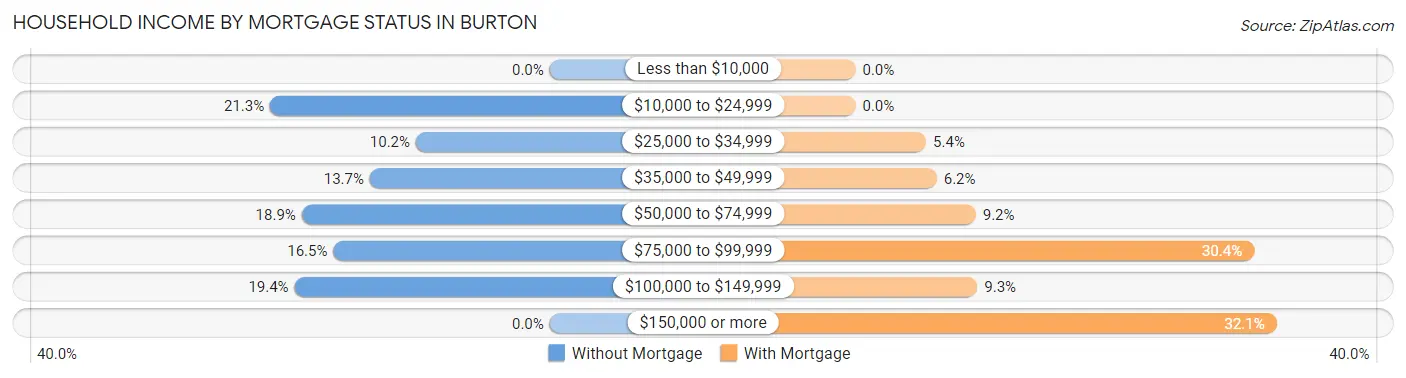
| Household Income | Without Mortgage | With Mortgage |
| Less than $10,000 | 0 (0.0%) | 0 (0.0%) |
| $10,000 to $24,999 | 115 (21.3%) | 0 (0.0%) |
| $25,000 to $34,999 | 55 (10.2%) | 47 (5.4%) |
| $35,000 to $49,999 | 74 (13.7%) | 54 (6.2%) |
| $50,000 to $74,999 | 102 (18.9%) | 80 (9.2%) |
| $75,000 to $99,999 | 89 (16.5%) | 265 (30.4%) |
| $100,000 to $149,999 | 105 (19.4%) | 81 (9.3%) |
| $150,000 or more | 0 (0.0%) | 280 (32.1%) |
| Total | 540 (100.0%) | 873 (100.0%) |
Property Value to Household Income Ratio in Burton
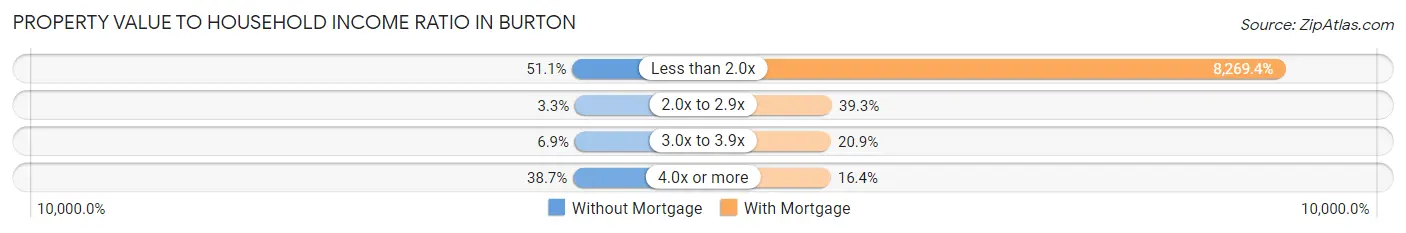
| Value-to-Income Ratio | Without Mortgage | With Mortgage |
| Less than 2.0x | 276 (51.1%) | 72,192 (8,269.4%) |
| 2.0x to 2.9x | 18 (3.3%) | 343 (39.3%) |
| 3.0x to 3.9x | 37 (6.9%) | 182 (20.8%) |
| 4.0x or more | 209 (38.7%) | 143 (16.4%) |
| Total | 540 (100.0%) | 873 (100.0%) |
Real Estate Taxes by Mortgage Status in Burton
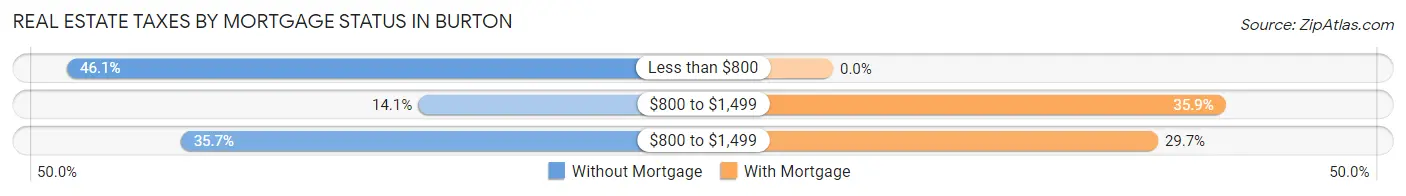
| Property Taxes | Without Mortgage | With Mortgage |
| Less than $800 | 249 (46.1%) | 0 (0.0%) |
| $800 to $1,499 | 76 (14.1%) | 313 (35.8%) |
| $800 to $1,499 | 193 (35.7%) | 259 (29.7%) |
| Total | 540 (100.0%) | 873 (100.0%) |
Health & Disability in Burton
Health Insurance Coverage by Age in Burton
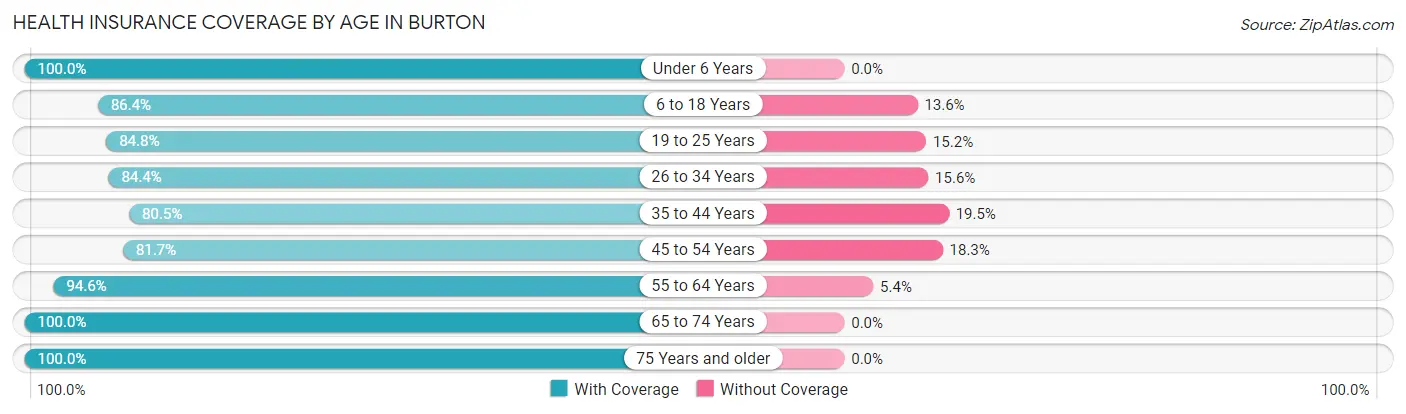
| Age Bracket | With Coverage | Without Coverage |
| Under 6 Years | 623 (100.0%) | 0 (0.0%) |
| 6 to 18 Years | 1,108 (86.4%) | 175 (13.6%) |
| 19 to 25 Years | 885 (84.8%) | 159 (15.2%) |
| 26 to 34 Years | 782 (84.4%) | 145 (15.6%) |
| 35 to 44 Years | 521 (80.5%) | 126 (19.5%) |
| 45 to 54 Years | 878 (81.7%) | 197 (18.3%) |
| 55 to 64 Years | 879 (94.6%) | 50 (5.4%) |
| 65 to 74 Years | 725 (100.0%) | 0 (0.0%) |
| 75 Years and older | 269 (100.0%) | 0 (0.0%) |
| Total | 6,670 (88.7%) | 852 (11.3%) |
Health Insurance Coverage by Citizenship Status in Burton
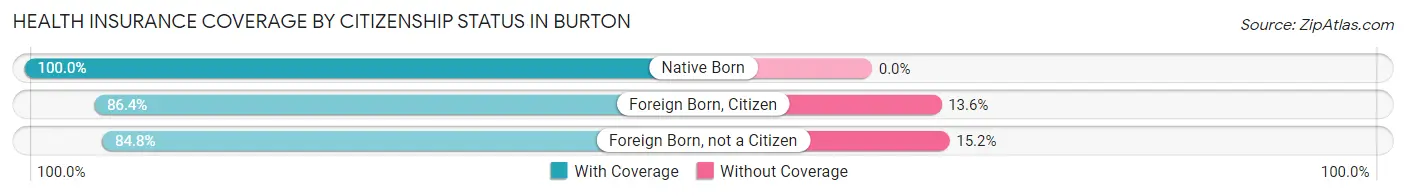
| Citizenship Status | With Coverage | Without Coverage |
| Native Born | 623 (100.0%) | 0 (0.0%) |
| Foreign Born, Citizen | 1,108 (86.4%) | 175 (13.6%) |
| Foreign Born, not a Citizen | 885 (84.8%) | 159 (15.2%) |
Health Insurance Coverage by Household Income in Burton
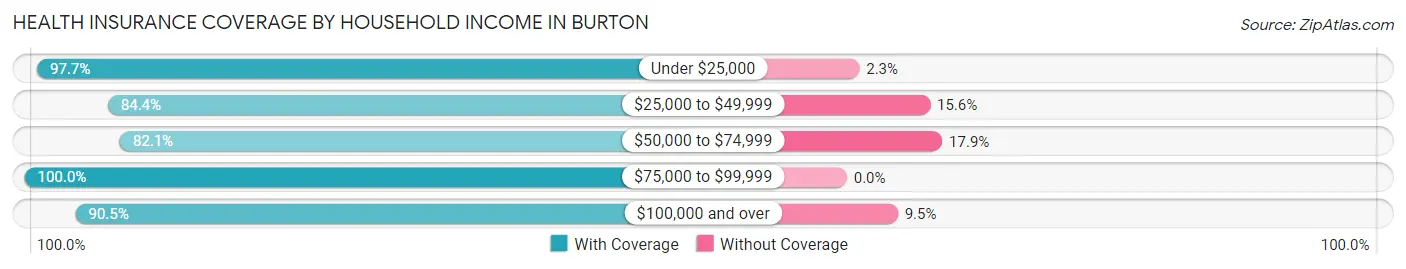
| Household Income | With Coverage | Without Coverage |
| Under $25,000 | 1,000 (97.7%) | 24 (2.3%) |
| $25,000 to $49,999 | 1,423 (84.4%) | 263 (15.6%) |
| $50,000 to $74,999 | 1,880 (82.1%) | 409 (17.9%) |
| $75,000 to $99,999 | 884 (100.0%) | 0 (0.0%) |
| $100,000 and over | 1,480 (90.5%) | 156 (9.5%) |
Public vs Private Health Insurance Coverage by Age in Burton
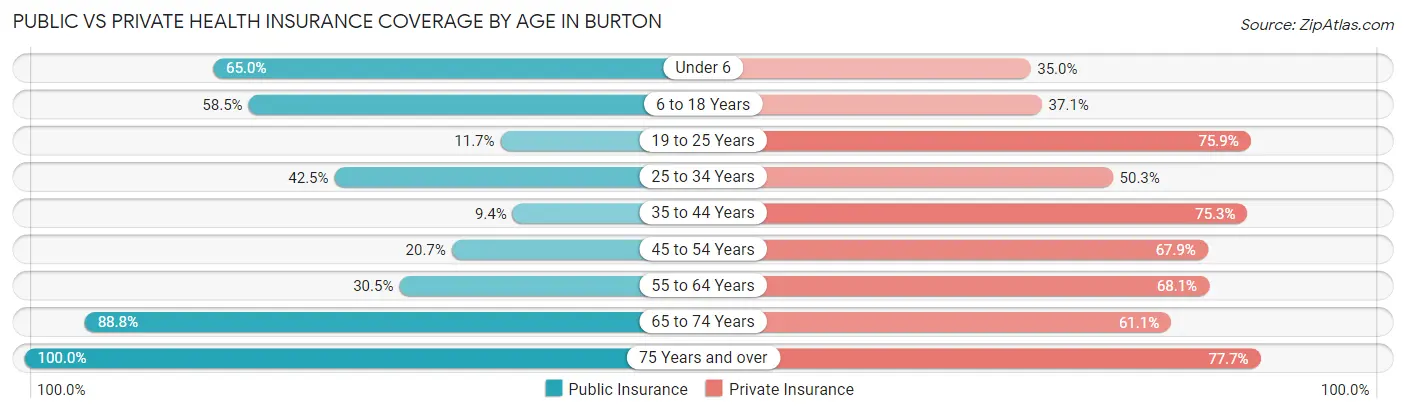
| Age Bracket | Public Insurance | Private Insurance |
| Under 6 | 405 (65.0%) | 218 (35.0%) |
| 6 to 18 Years | 750 (58.5%) | 476 (37.1%) |
| 19 to 25 Years | 122 (11.7%) | 792 (75.9%) |
| 25 to 34 Years | 394 (42.5%) | 466 (50.3%) |
| 35 to 44 Years | 61 (9.4%) | 487 (75.3%) |
| 45 to 54 Years | 223 (20.7%) | 730 (67.9%) |
| 55 to 64 Years | 283 (30.5%) | 633 (68.1%) |
| 65 to 74 Years | 644 (88.8%) | 443 (61.1%) |
| 75 Years and over | 269 (100.0%) | 209 (77.7%) |
| Total | 3,151 (41.9%) | 4,454 (59.2%) |
Disability Status by Sex by Age in Burton
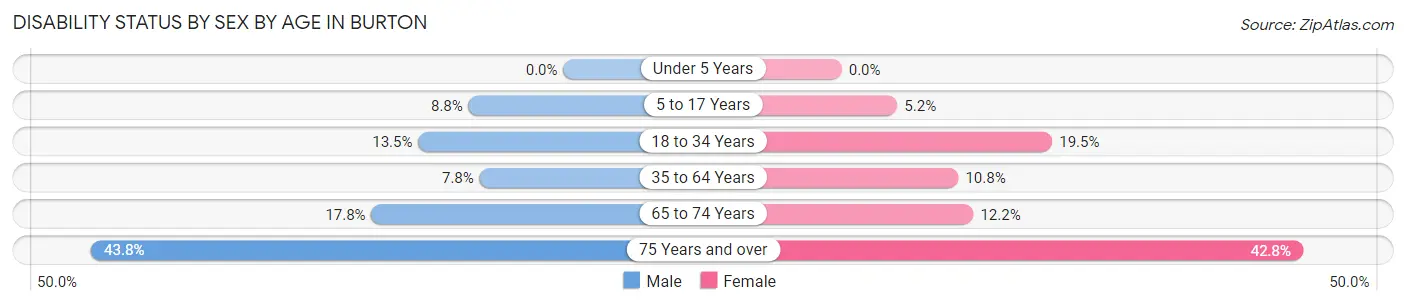
| Age Bracket | Male | Female |
| Under 5 Years | 0 (0.0%) | 0 (0.0%) |
| 5 to 17 Years | 67 (8.8%) | 21 (5.2%) |
| 18 to 34 Years | 131 (13.5%) | 228 (19.5%) |
| 35 to 64 Years | 84 (7.8%) | 170 (10.8%) |
| 65 to 74 Years | 65 (17.8%) | 44 (12.2%) |
| 75 Years and over | 39 (43.8%) | 77 (42.8%) |
Disability Class by Sex by Age in Burton
Disability Class: Hearing Difficulty
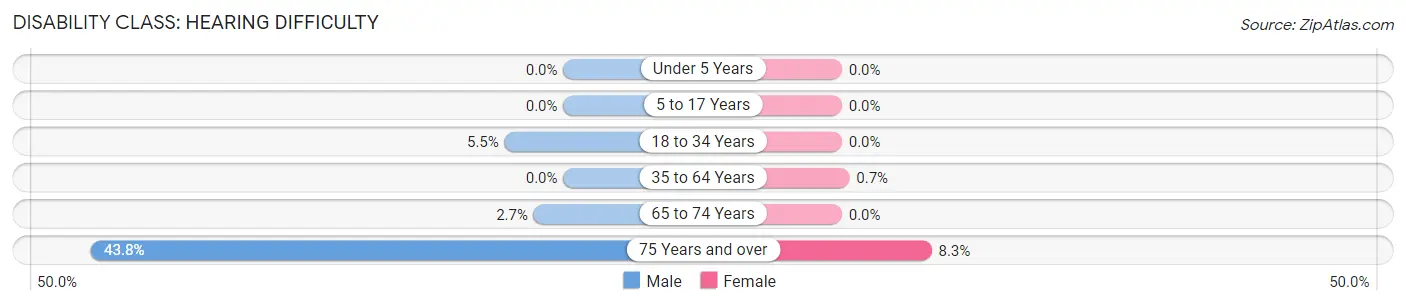
| Age Bracket | Male | Female |
| Under 5 Years | 0 (0.0%) | 0 (0.0%) |
| 5 to 17 Years | 0 (0.0%) | 0 (0.0%) |
| 18 to 34 Years | 53 (5.4%) | 0 (0.0%) |
| 35 to 64 Years | 0 (0.0%) | 11 (0.7%) |
| 65 to 74 Years | 10 (2.7%) | 0 (0.0%) |
| 75 Years and over | 39 (43.8%) | 15 (8.3%) |
Disability Class: Vision Difficulty
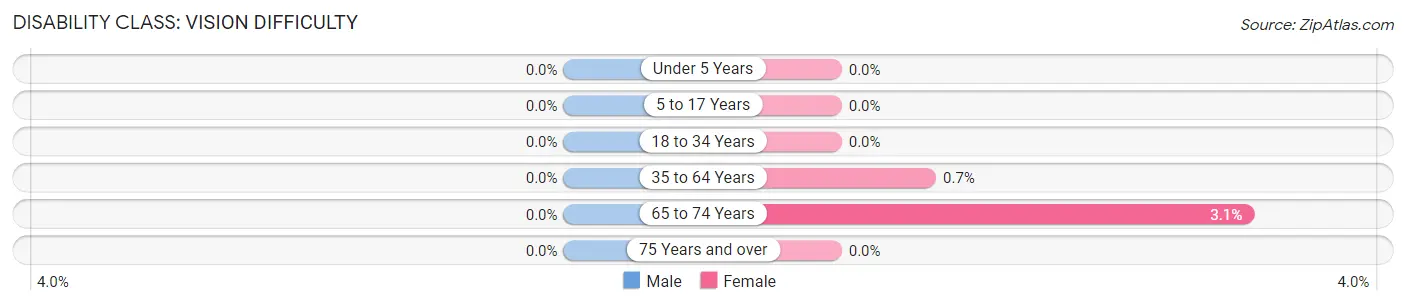
| Age Bracket | Male | Female |
| Under 5 Years | 0 (0.0%) | 0 (0.0%) |
| 5 to 17 Years | 0 (0.0%) | 0 (0.0%) |
| 18 to 34 Years | 0 (0.0%) | 0 (0.0%) |
| 35 to 64 Years | 0 (0.0%) | 11 (0.7%) |
| 65 to 74 Years | 0 (0.0%) | 11 (3.1%) |
| 75 Years and over | 0 (0.0%) | 0 (0.0%) |
Disability Class: Cognitive Difficulty
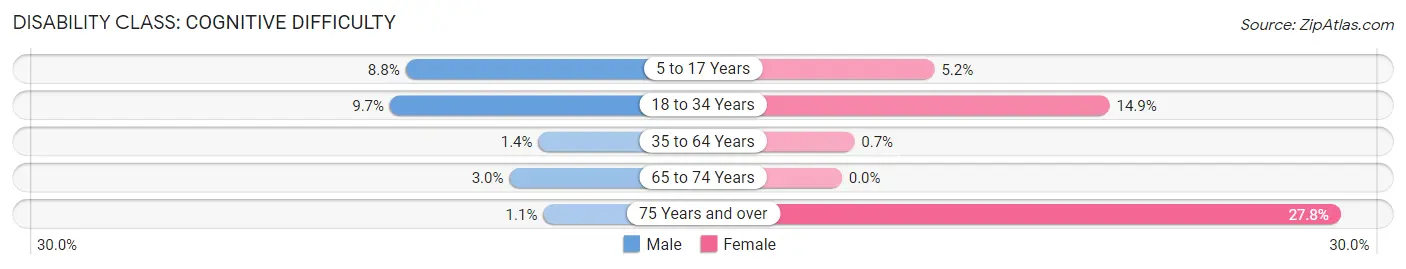
| Age Bracket | Male | Female |
| 5 to 17 Years | 67 (8.8%) | 21 (5.2%) |
| 18 to 34 Years | 94 (9.7%) | 174 (14.9%) |
| 35 to 64 Years | 15 (1.4%) | 11 (0.7%) |
| 65 to 74 Years | 11 (3.0%) | 0 (0.0%) |
| 75 Years and over | 1 (1.1%) | 50 (27.8%) |
Disability Class: Ambulatory Difficulty
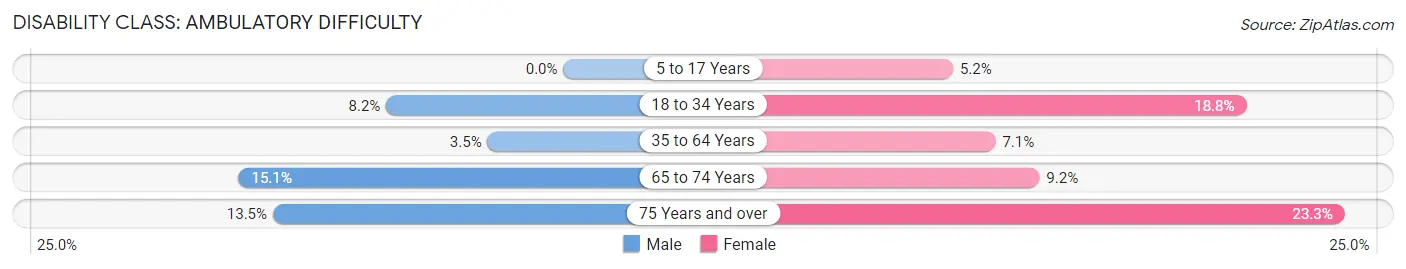
| Age Bracket | Male | Female |
| 5 to 17 Years | 0 (0.0%) | 21 (5.2%) |
| 18 to 34 Years | 80 (8.2%) | 219 (18.8%) |
| 35 to 64 Years | 38 (3.5%) | 112 (7.1%) |
| 65 to 74 Years | 55 (15.1%) | 33 (9.2%) |
| 75 Years and over | 12 (13.5%) | 42 (23.3%) |
Disability Class: Self-Care Difficulty
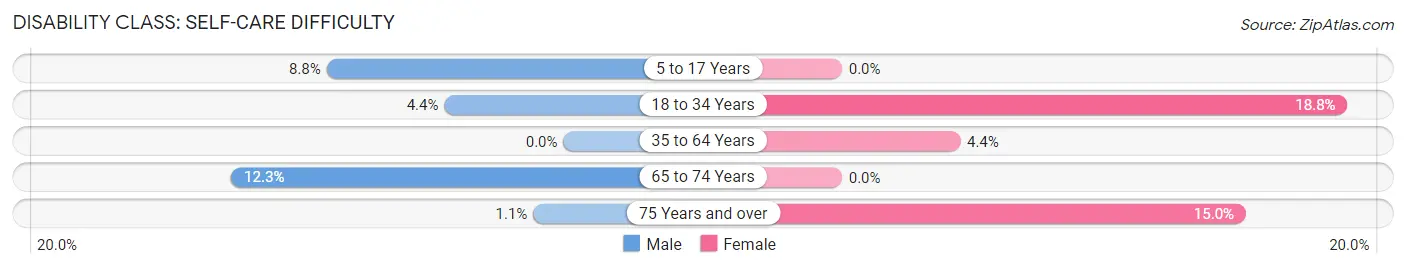
| Age Bracket | Male | Female |
| 5 to 17 Years | 67 (8.8%) | 0 (0.0%) |
| 18 to 34 Years | 43 (4.4%) | 219 (18.8%) |
| 35 to 64 Years | 0 (0.0%) | 69 (4.4%) |
| 65 to 74 Years | 45 (12.3%) | 0 (0.0%) |
| 75 Years and over | 1 (1.1%) | 27 (15.0%) |
Technology Access in Burton
Computing Device Access in Burton
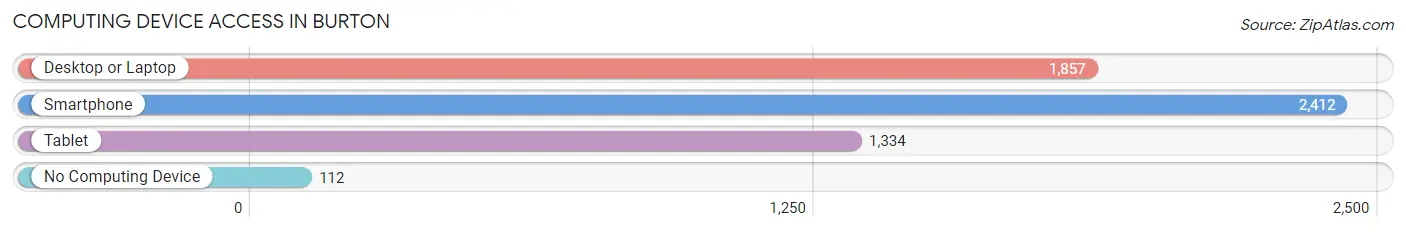
| Device Type | # Households | % Households |
| Desktop or Laptop | 1,857 | 70.9% |
| Smartphone | 2,412 | 92.0% |
| Tablet | 1,334 | 50.9% |
| No Computing Device | 112 | 4.3% |
| Total | 2,621 | 100.0% |
Internet Access in Burton
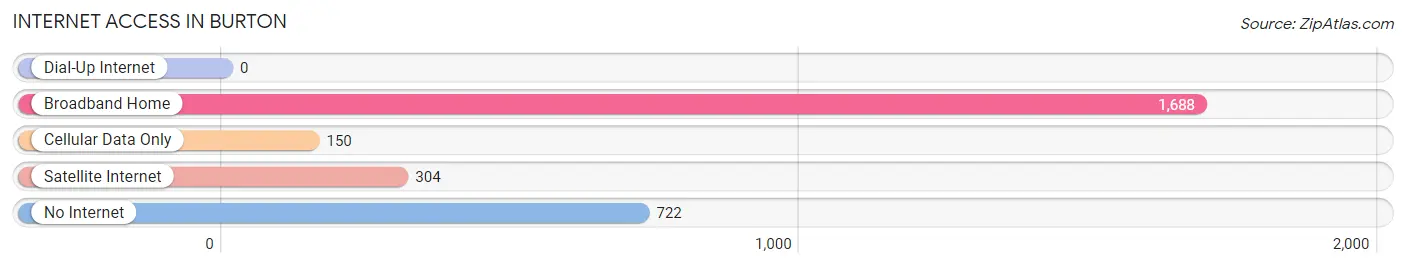
| Internet Type | # Households | % Households |
| Dial-Up Internet | 0 | 0.0% |
| Broadband Home | 1,688 | 64.4% |
| Cellular Data Only | 150 | 5.7% |
| Satellite Internet | 304 | 11.6% |
| No Internet | 722 | 27.6% |
| Total | 2,621 | 100.0% |
Burton Summary
Burton is a small town located in the Lowcountry region of South Carolina. It is situated in Beaufort County, approximately 20 miles east of Beaufort and 30 miles west of Hilton Head Island. The town is bordered by the Broad River to the north and the Chechessee River to the south.
History
Burton was first settled in the early 1700s by a group of French Huguenots. The town was named after the Burton family, who were among the first settlers. The town was officially incorporated in 1891.
In the late 1800s, Burton was a thriving agricultural community. The town was known for its production of cotton, rice, and indigo. In the early 1900s, the town began to experience a decline in its agricultural industry. This decline was due to the introduction of new farming technologies and the Great Depression.
In the mid-1900s, Burton began to experience a resurgence in its economy. This was due to the development of the nearby Marine Corps Air Station Beaufort. The air station brought new jobs and economic growth to the area.
Geography
Burton is located in the Lowcountry region of South Carolina. The town is situated in Beaufort County, approximately 20 miles east of Beaufort and 30 miles west of Hilton Head Island. The town is bordered by the Broad River to the north and the Chechessee River to the south.
The town has a total area of 4.2 square miles, all of which is land. The terrain is mostly flat, with some rolling hills. The climate is humid subtropical, with hot, humid summers and mild winters.
Economy
The economy of Burton is largely based on the nearby Marine Corps Air Station Beaufort. The air station provides jobs for many of the town’s residents. Other major employers in the area include the Beaufort County School District, Beaufort Memorial Hospital, and the Beaufort County government.
The town also has a thriving tourism industry. The nearby beaches and historic sites attract many visitors to the area. There are also several restaurants, shops, and other businesses in the town.
Demographics
As of the 2010 census, the population of Burton was 1,845. The racial makeup of the town was 79.3% White, 15.2% African American, 0.7% Native American, 0.7% Asian, 0.1% Pacific Islander, and 3.9% from other races.
The median household income in Burton was $41,250, and the median family income was $50,000. The per capita income was $20,845. About 11.2% of the population was below the poverty line.
Burton is a small town with a rich history and a bright future. The town has a diverse economy and a growing population. With its close proximity to the beach and other attractions, Burton is an ideal place to live and work.
Common Questions
What is Per Capita Income in Burton?
Per Capita income in Burton is $25,594.
What is the Median Family Income in Burton?
Median Family Income in Burton is $65,765.
What is the Median Household income in Burton?
Median Household Income in Burton is $58,390.
What is Income or Wage Gap in Burton?
Income or Wage Gap in Burton is 27.6%.
Women in Burton earn 72.4 cents for every dollar earned by a man.
What is Inequality or Gini Index in Burton?
Inequality or Gini Index in Burton is 0.38.
What is the Total Population of Burton?
Total Population of Burton is 7,603.
What is the Total Male Population of Burton?
Total Male Population of Burton is 3,568.
What is the Total Female Population of Burton?
Total Female Population of Burton is 4,035.
What is the Ratio of Males per 100 Females in Burton?
There are 88.43 Males per 100 Females in Burton.
What is the Ratio of Females per 100 Males in Burton?
There are 113.09 Females per 100 Males in Burton.
What is the Median Population Age in Burton?
Median Population Age in Burton is 32.4 Years.
What is the Average Family Size in Burton
Average Family Size in Burton is 3.4 People.
What is the Average Household Size in Burton
Average Household Size in Burton is 2.9 People.
How Large is the Labor Force in Burton?
There are 3,703 People in the Labor Forcein in Burton.
What is the Percentage of People in the Labor Force in Burton?
60.5% of People are in the Labor Force in Burton.
What is the Unemployment Rate in Burton?
Unemployment Rate in Burton is 1.4%.