Summit, SC Map & Demographics
Summit Map
Summit Overview
$34,258
PER CAPITA INCOME
$76,250
AVG FAMILY INCOME
$72,250
AVG HOUSEHOLD INCOME
24.5%
WAGE / INCOME GAP [ % ]
75.5¢/ $1
WAGE / INCOME GAP [ $ ]
0.37
INEQUALITY / GINI INDEX
539
TOTAL POPULATION
262
MALE POPULATION
277
FEMALE POPULATION
94.58
MALES / 100 FEMALES
105.73
FEMALES / 100 MALES
50.0
MEDIAN AGE
2.7
AVG FAMILY SIZE
2.5
AVG HOUSEHOLD SIZE
315
LABOR FORCE [ PEOPLE ]
64.7%
PERCENT IN LABOR FORCE
1.6%
UNEMPLOYMENT RATE
Income in Summit
Income Overview in Summit
Per Capita Income in Summit is $34,258, while median incomes of families and households are $76,250 and $72,250 respectively.
| Characteristic | Number | Measure |
| Per Capita Income | 539 | $34,258 |
| Median Family Income | 184 | $76,250 |
| Mean Family Income | 184 | $95,199 |
| Median Household Income | 213 | $72,250 |
| Mean Household Income | 213 | $87,038 |
| Income Deficit | 184 | $0 |
| Wage / Income Gap (%) | 539 | 24.46% |
| Wage / Income Gap ($) | 539 | 75.54¢ per $1 |
| Gini / Inequality Index | 539 | 0.37 |
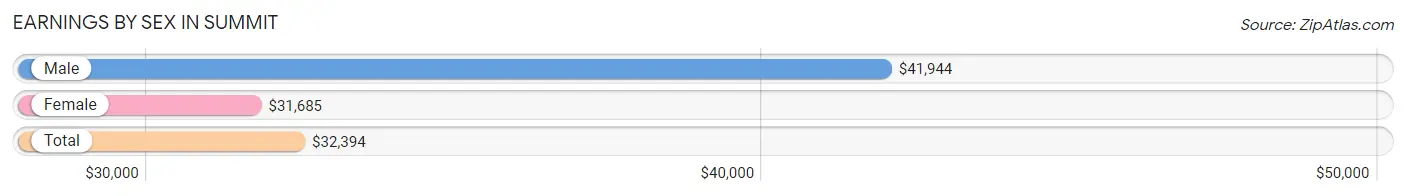
Earnings by Sex in Summit
Average Earnings in Summit are $32,394, $41,944 for men and $31,685 for women, a difference of 24.5%.
| Sex | Number | Average Earnings |
| Male | 158 (49.7%) | $41,944 |
| Female | 160 (50.3%) | $31,685 |
| Total | 318 (100.0%) | $32,394 |
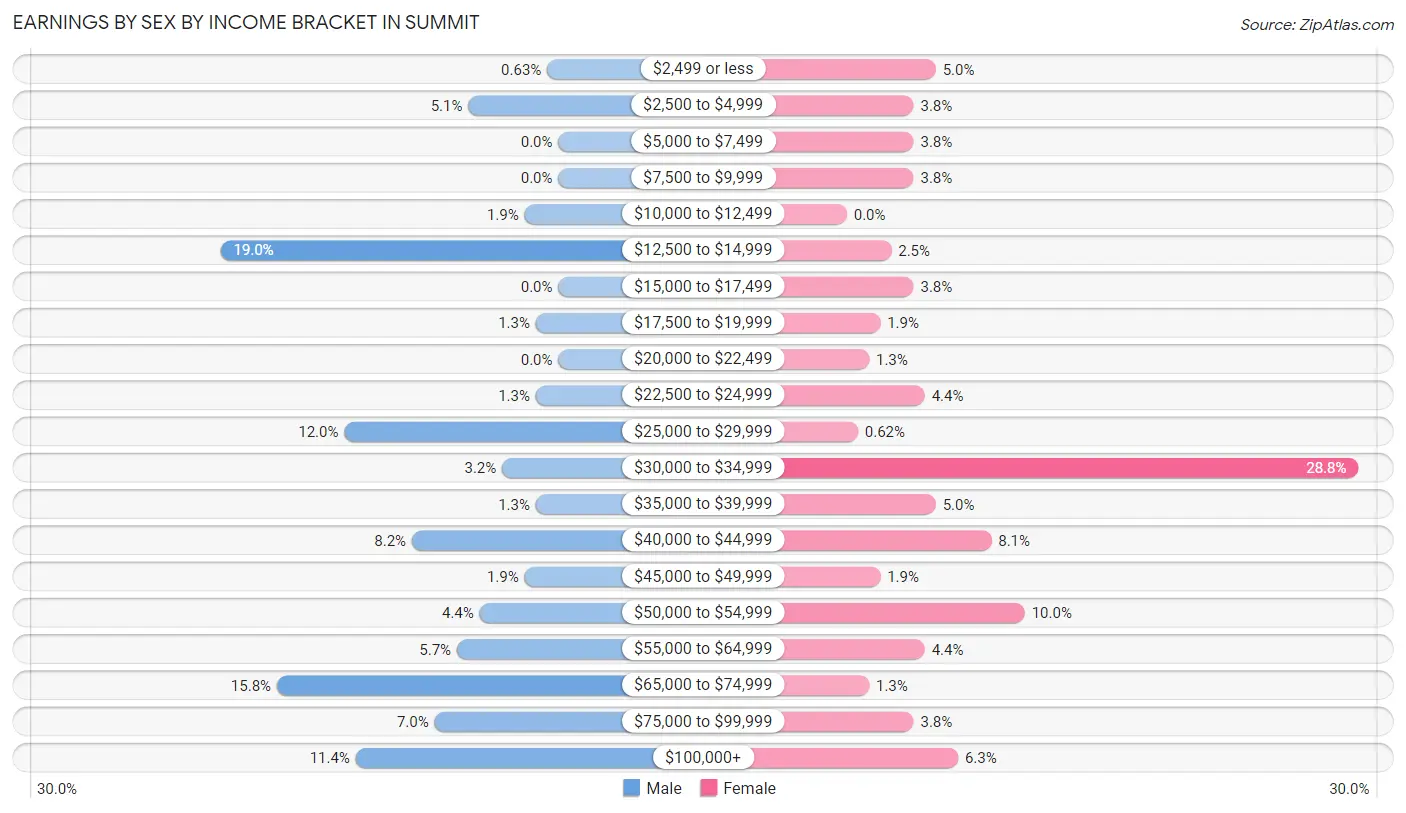
Earnings by Sex by Income Bracket in Summit
The most common earnings brackets in Summit are $12,500 to $14,999 for men (30 | 19.0%) and $30,000 to $34,999 for women (46 | 28.7%).
| Income | Male | Female |
| $2,499 or less | 1 (0.6%) | 8 (5.0%) |
| $2,500 to $4,999 | 8 (5.1%) | 6 (3.7%) |
| $5,000 to $7,499 | 0 (0.0%) | 6 (3.7%) |
| $7,500 to $9,999 | 0 (0.0%) | 6 (3.7%) |
| $10,000 to $12,499 | 3 (1.9%) | 0 (0.0%) |
| $12,500 to $14,999 | 30 (19.0%) | 4 (2.5%) |
| $15,000 to $17,499 | 0 (0.0%) | 6 (3.7%) |
| $17,500 to $19,999 | 2 (1.3%) | 3 (1.9%) |
| $20,000 to $22,499 | 0 (0.0%) | 2 (1.3%) |
| $22,500 to $24,999 | 2 (1.3%) | 7 (4.4%) |
| $25,000 to $29,999 | 19 (12.0%) | 1 (0.6%) |
| $30,000 to $34,999 | 5 (3.2%) | 46 (28.7%) |
| $35,000 to $39,999 | 2 (1.3%) | 8 (5.0%) |
| $40,000 to $44,999 | 13 (8.2%) | 13 (8.1%) |
| $45,000 to $49,999 | 3 (1.9%) | 3 (1.9%) |
| $50,000 to $54,999 | 7 (4.4%) | 16 (10.0%) |
| $55,000 to $64,999 | 9 (5.7%) | 7 (4.4%) |
| $65,000 to $74,999 | 25 (15.8%) | 2 (1.3%) |
| $75,000 to $99,999 | 11 (7.0%) | 6 (3.7%) |
| $100,000+ | 18 (11.4%) | 10 (6.2%) |
| Total | 158 (100.0%) | 160 (100.0%) |
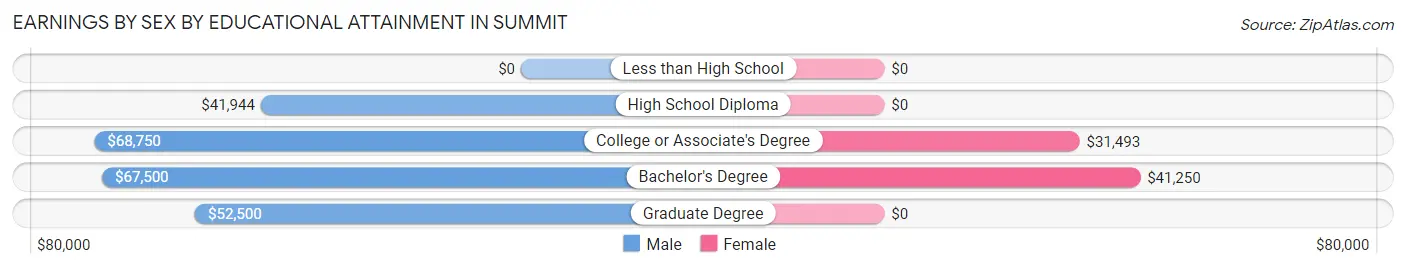
Earnings by Sex by Educational Attainment in Summit
Average earnings in Summit are $54,750 for men and $32,361 for women, a difference of 40.9%. Men with an educational attainment of college or associate's degree enjoy the highest average annual earnings of $68,750, while those with high school diploma education earn the least with $41,944. Women with an educational attainment of bachelor's degree earn the most with the average annual earnings of $41,250, while those with college or associate's degree education have the smallest earnings of $31,493.
| Educational Attainment | Male Income | Female Income |
| Less than High School | - | - |
| High School Diploma | $41,944 | $0 |
| College or Associate's Degree | $68,750 | $31,493 |
| Bachelor's Degree | $67,500 | $41,250 |
| Graduate Degree | $52,500 | $0 |
| Total | $54,750 | $32,361 |
Family Income in Summit
Family Income Brackets in Summit
According to the Summit family income data, there are 46 families falling into the $50,000 to $74,999 income range, which is the most common income bracket and makes up 25.0% of all families.
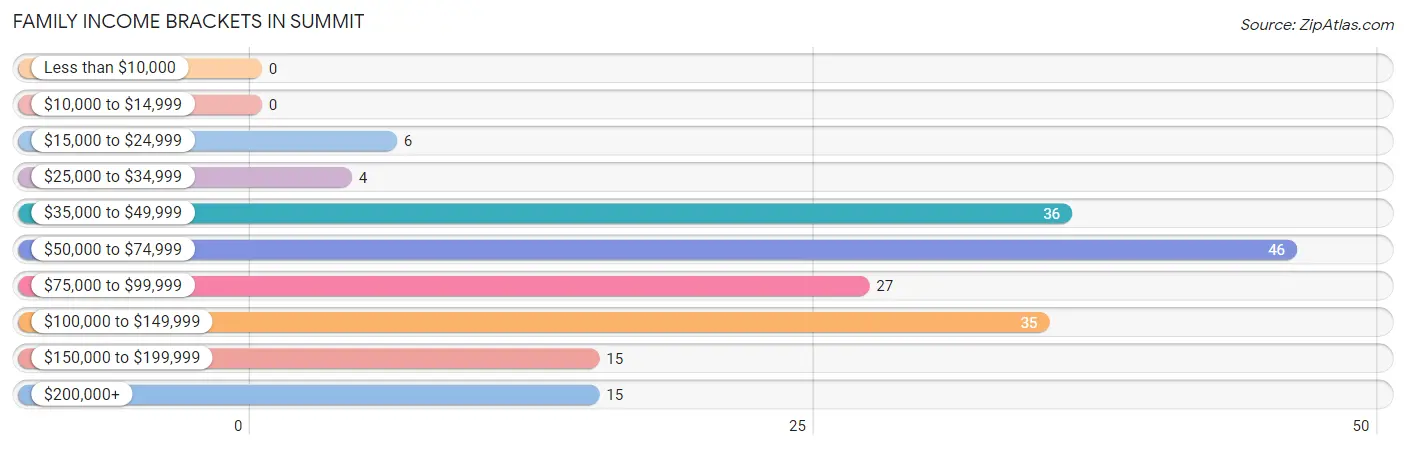
| Income Bracket | # Families | % Families |
| Less than $10,000 | 0 | 0.0% |
| $10,000 to $14,999 | 0 | 0.0% |
| $15,000 to $24,999 | 6 | 3.3% |
| $25,000 to $34,999 | 4 | 2.2% |
| $35,000 to $49,999 | 36 | 19.6% |
| $50,000 to $74,999 | 46 | 25.0% |
| $75,000 to $99,999 | 27 | 14.7% |
| $100,000 to $149,999 | 35 | 19.0% |
| $150,000 to $199,999 | 15 | 8.2% |
| $200,000+ | 15 | 8.2% |
Family Income by Famaliy Size in Summit
6-person families (19 | 10.3%) account for the highest median family income in Summit with $145,125 per family, while 4-person families (24 | 13.0%) have the highest median income of $32,750 per family member.
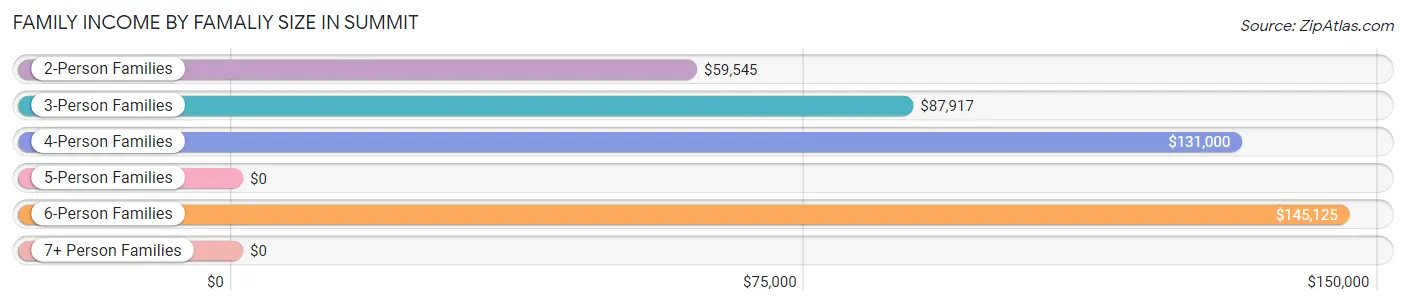
| Income Bracket | # Families | Median Income |
| 2-Person Families | 122 (66.3%) | $59,545 |
| 3-Person Families | 15 (8.2%) | $87,917 |
| 4-Person Families | 24 (13.0%) | $131,000 |
| 5-Person Families | 4 (2.2%) | $0 |
| 6-Person Families | 19 (10.3%) | $145,125 |
| 7+ Person Families | 0 (0.0%) | $0 |
| Total | 184 (100.0%) | $76,250 |
Family Income by Number of Earners in Summit
The median family income in Summit is $76,250, with families comprising 3+ earners (28) having the highest median family income of $146,000, while families with 1 earner (103) have the lowest median family income of $58,011, accounting for 15.2% and 56.0% of families, respectively.
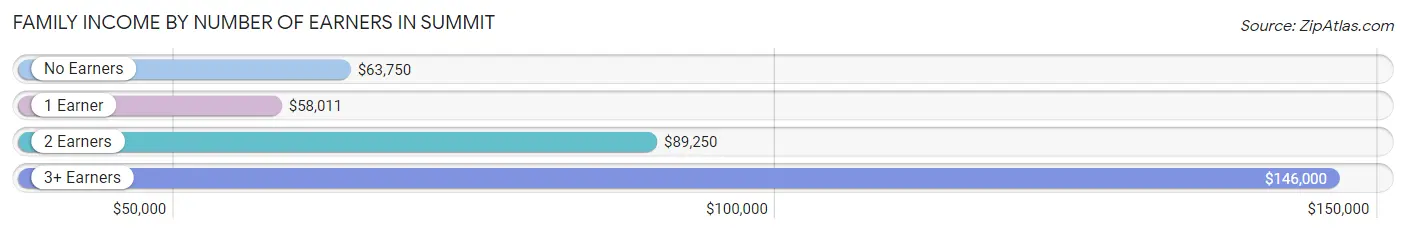
| Number of Earners | # Families | Median Income |
| No Earners | 4 (2.2%) | $63,750 |
| 1 Earner | 103 (56.0%) | $58,011 |
| 2 Earners | 49 (26.6%) | $89,250 |
| 3+ Earners | 28 (15.2%) | $146,000 |
| Total | 184 (100.0%) | $76,250 |
Household Income in Summit
Household Income Brackets in Summit
With 47 households falling in the category, the $50,000 to $74,999 income range is the most frequent in Summit, accounting for 22.1% of all households. In contrast, only 3 households (1.4%) fall into the less than $10,000 income bracket, making it the least populous group.
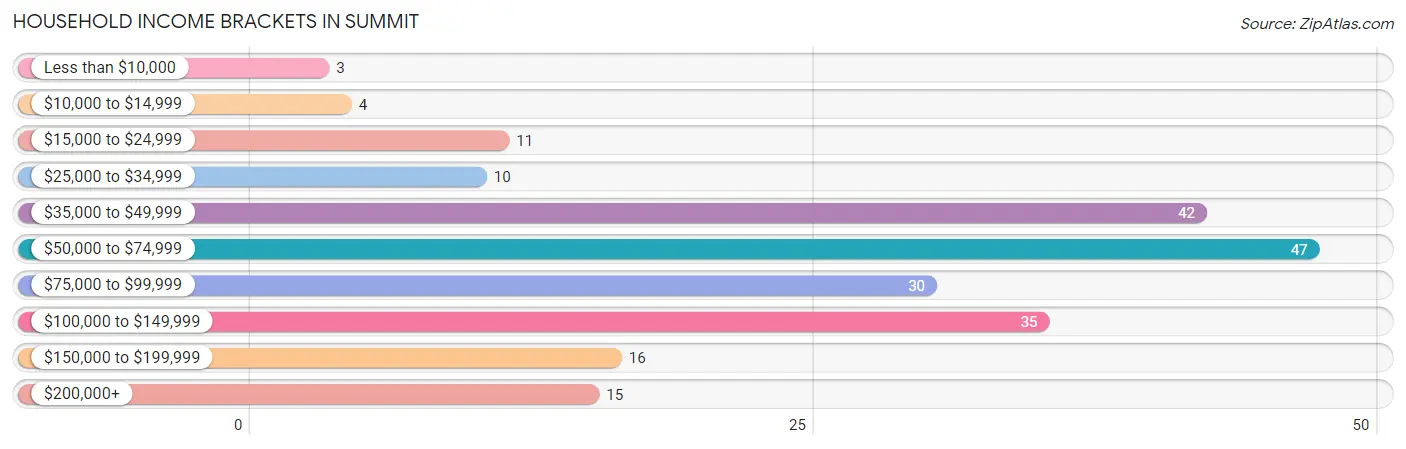
| Income Bracket | # Households | % Households |
| Less than $10,000 | 3 | 1.4% |
| $10,000 to $14,999 | 4 | 1.9% |
| $15,000 to $24,999 | 11 | 5.2% |
| $25,000 to $34,999 | 10 | 4.7% |
| $35,000 to $49,999 | 42 | 19.7% |
| $50,000 to $74,999 | 47 | 22.1% |
| $75,000 to $99,999 | 30 | 14.1% |
| $100,000 to $149,999 | 35 | 16.4% |
| $150,000 to $199,999 | 16 | 7.5% |
| $200,000+ | 15 | 7.0% |
Household Income by Householder Age in Summit
The median household income in Summit is $72,250, with the highest median household income of $103,750 found in the 25 to 44 years age bracket for the primary householder. A total of 38 households (17.8%) fall into this category. Meanwhile, the 15 to 24 years age bracket for the primary householder has the lowest median household income of $0, with 10 households (4.7%) in this group.
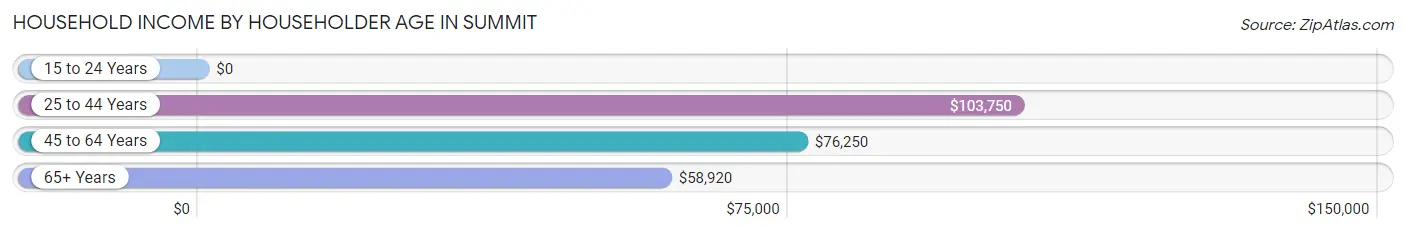
| Income Bracket | # Households | Median Income |
| 15 to 24 Years | 10 (4.7%) | $0 |
| 25 to 44 Years | 38 (17.8%) | $103,750 |
| 45 to 64 Years | 116 (54.5%) | $76,250 |
| 65+ Years | 49 (23.0%) | $58,920 |
| Total | 213 (100.0%) | $72,250 |
Poverty in Summit
Income Below Poverty by Sex and Age in Summit
With 5.0% poverty level for males and 8.3% for females among the residents of Summit, 6 to 11 year old males and under 5 year old females are the most vulnerable to poverty, with 5 males (50.0%) and 1 females (100.0%) in their respective age groups living below the poverty level.
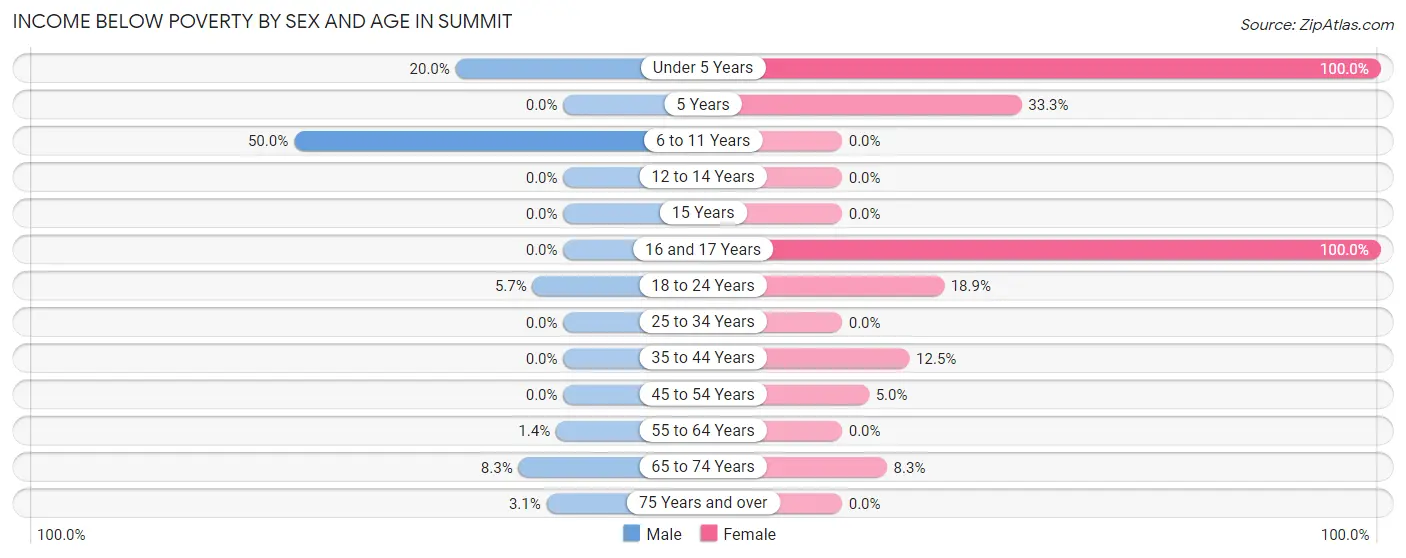
| Age Bracket | Male | Female |
| Under 5 Years | 2 (20.0%) | 1 (100.0%) |
| 5 Years | 0 (0.0%) | 1 (33.3%) |
| 6 to 11 Years | 5 (50.0%) | 0 (0.0%) |
| 12 to 14 Years | 0 (0.0%) | 0 (0.0%) |
| 15 Years | 0 (0.0%) | 0 (0.0%) |
| 16 and 17 Years | 0 (0.0%) | 4 (100.0%) |
| 18 to 24 Years | 2 (5.7%) | 7 (18.9%) |
| 25 to 34 Years | 0 (0.0%) | 0 (0.0%) |
| 35 to 44 Years | 0 (0.0%) | 4 (12.5%) |
| 45 to 54 Years | 0 (0.0%) | 2 (5.0%) |
| 55 to 64 Years | 1 (1.4%) | 0 (0.0%) |
| 65 to 74 Years | 2 (8.3%) | 4 (8.3%) |
| 75 Years and over | 1 (3.1%) | 0 (0.0%) |
| Total | 13 (5.0%) | 23 (8.3%) |
Income Above Poverty by Sex and Age in Summit
According to the poverty statistics in Summit, males aged 15 years and females aged 6 to 11 years are the age groups that are most secure financially, with 100.0% of males and 100.0% of females in these age groups living above the poverty line.
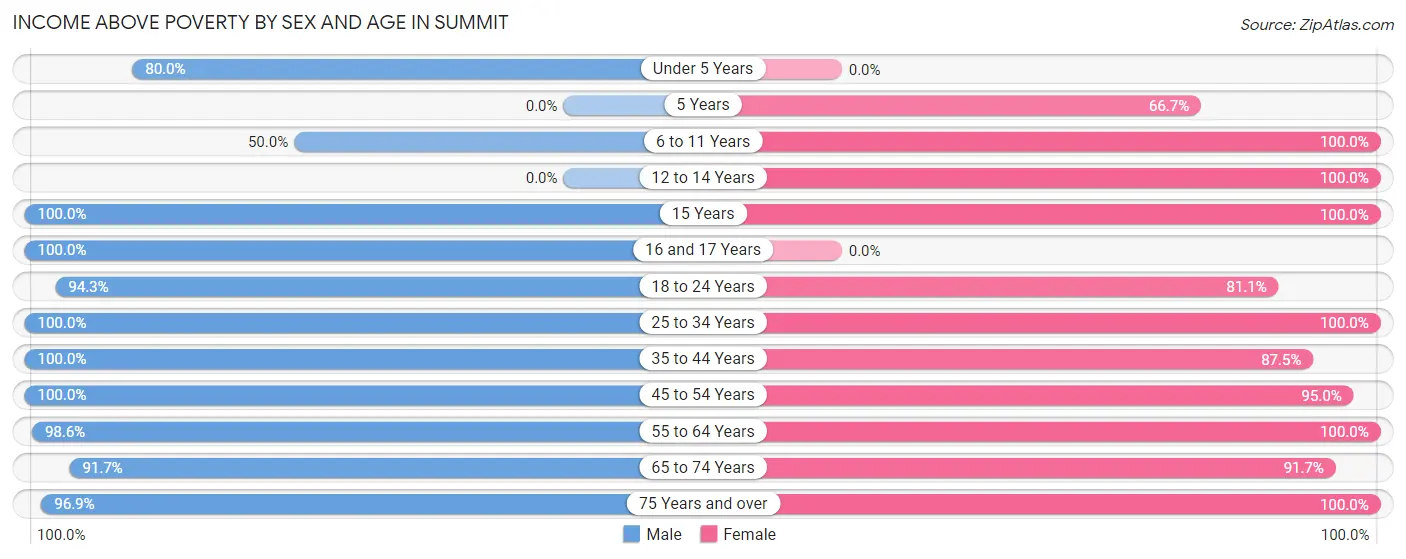
| Age Bracket | Male | Female |
| Under 5 Years | 8 (80.0%) | 0 (0.0%) |
| 5 Years | 0 (0.0%) | 2 (66.7%) |
| 6 to 11 Years | 5 (50.0%) | 7 (100.0%) |
| 12 to 14 Years | 0 (0.0%) | 12 (100.0%) |
| 15 Years | 2 (100.0%) | 6 (100.0%) |
| 16 and 17 Years | 18 (100.0%) | 0 (0.0%) |
| 18 to 24 Years | 33 (94.3%) | 30 (81.1%) |
| 25 to 34 Years | 13 (100.0%) | 17 (100.0%) |
| 35 to 44 Years | 24 (100.0%) | 28 (87.5%) |
| 45 to 54 Years | 21 (100.0%) | 38 (95.0%) |
| 55 to 64 Years | 72 (98.6%) | 67 (100.0%) |
| 65 to 74 Years | 22 (91.7%) | 44 (91.7%) |
| 75 Years and over | 31 (96.9%) | 2 (100.0%) |
| Total | 249 (95.0%) | 253 (91.7%) |
Income Below Poverty Among Married-Couple Families in Summit
The poverty statistics for married-couple families in Summit show that 1.3% or 2 of the total 159 families live below the poverty line. Families with 3 or 4 children have the highest poverty rate of 66.7%, comprising of 2 families. On the other hand, families with no children have the lowest poverty rate of 0.0%, which includes 0 families.
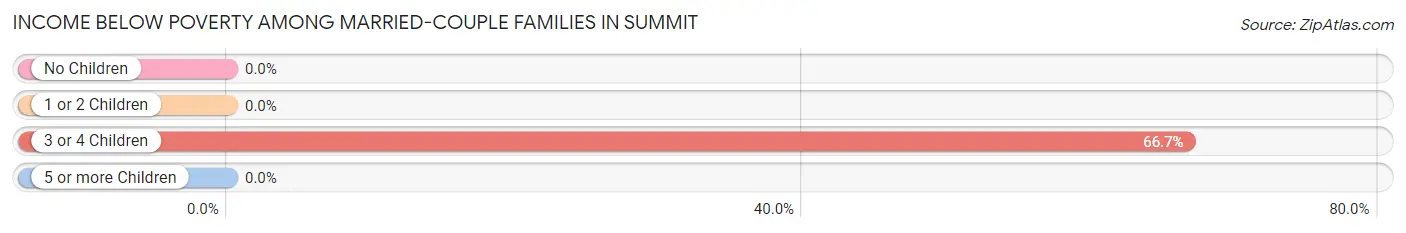
| Children | Above Poverty | Below Poverty |
| No Children | 122 (100.0%) | 0 (0.0%) |
| 1 or 2 Children | 34 (100.0%) | 0 (0.0%) |
| 3 or 4 Children | 1 (33.3%) | 2 (66.7%) |
| 5 or more Children | 0 (0.0%) | 0 (0.0%) |
| Total | 157 (98.7%) | 2 (1.3%) |
Income Below Poverty Among Single-Parent Households in Summit
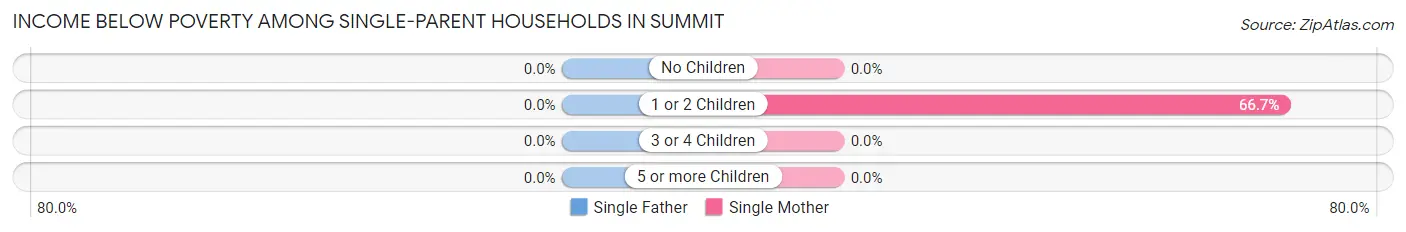
| Children | Single Father | Single Mother |
| No Children | 0 (0.0%) | 0 (0.0%) |
| 1 or 2 Children | 0 (0.0%) | 4 (66.7%) |
| 3 or 4 Children | 0 (0.0%) | 0 (0.0%) |
| 5 or more Children | 0 (0.0%) | 0 (0.0%) |
| Total | 0 (0.0%) | 4 (18.2%) |
Income Below Poverty Among Married-Couple vs Single-Parent Households in Summit
The poverty data for Summit shows that 2 of the married-couple family households (1.3%) and 4 of the single-parent households (16.0%) are living below the poverty level. Within the married-couple family households, those with 3 or 4 children have the highest poverty rate, with 2 households (66.7%) falling below the poverty line. Among the single-parent households, those with 1 or 2 children have the highest poverty rate, with 4 household (57.1%) living below poverty.
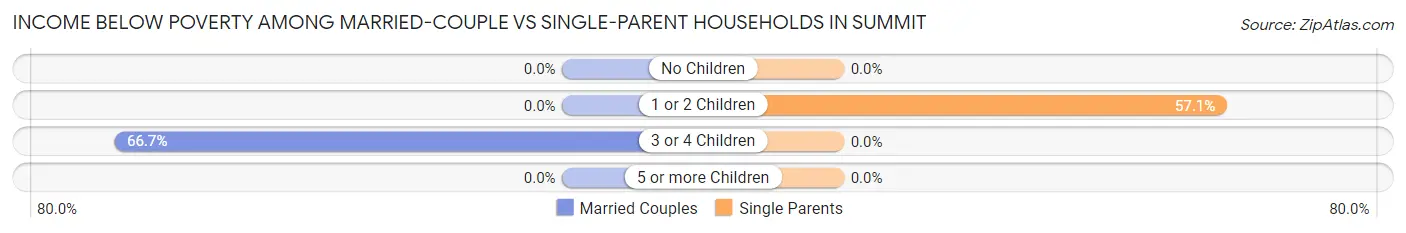
| Children | Married-Couple Families | Single-Parent Households |
| No Children | 0 (0.0%) | 0 (0.0%) |
| 1 or 2 Children | 0 (0.0%) | 4 (57.1%) |
| 3 or 4 Children | 2 (66.7%) | 0 (0.0%) |
| 5 or more Children | 0 (0.0%) | 0 (0.0%) |
| Total | 2 (1.3%) | 4 (16.0%) |
Race in Summit
The most populous races in Summit are White / Caucasian (466 | 86.5%), Black / African American (59 | 11.0%), and Two or more Races (14 | 2.6%).
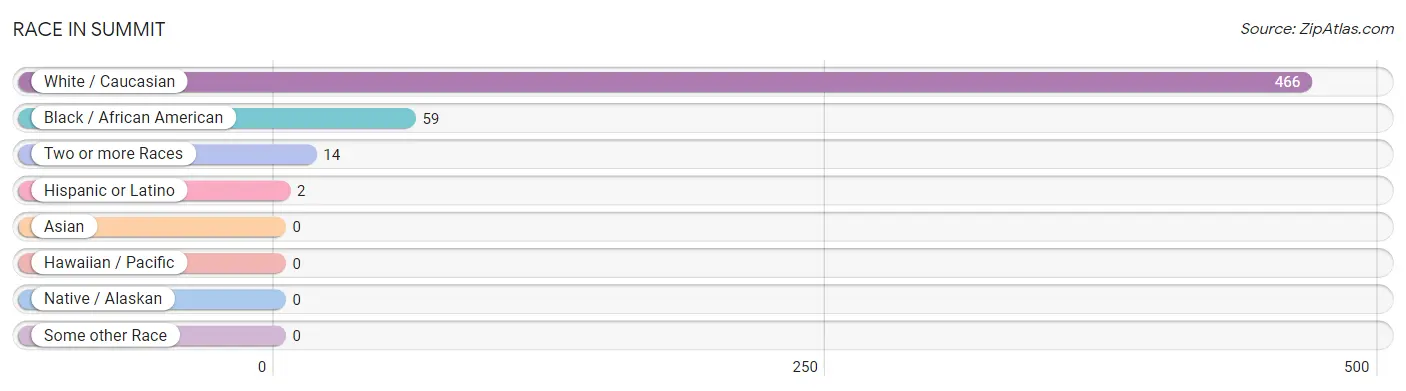
| Race | # Population | % Population |
| Asian | 0 | 0.0% |
| Black / African American | 59 | 11.0% |
| Hawaiian / Pacific | 0 | 0.0% |
| Hispanic or Latino | 2 | 0.4% |
| Native / Alaskan | 0 | 0.0% |
| White / Caucasian | 466 | 86.5% |
| Two or more Races | 14 | 2.6% |
| Some other Race | 0 | 0.0% |
| Total | 539 | 100.0% |
Ancestry in Summit
The most populous ancestries reported in Summit are American (135 | 25.1%), English (36 | 6.7%), German (33 | 6.1%), Irish (33 | 6.1%), and African (30 | 5.6%), together accounting for 49.5% of all Summit residents.
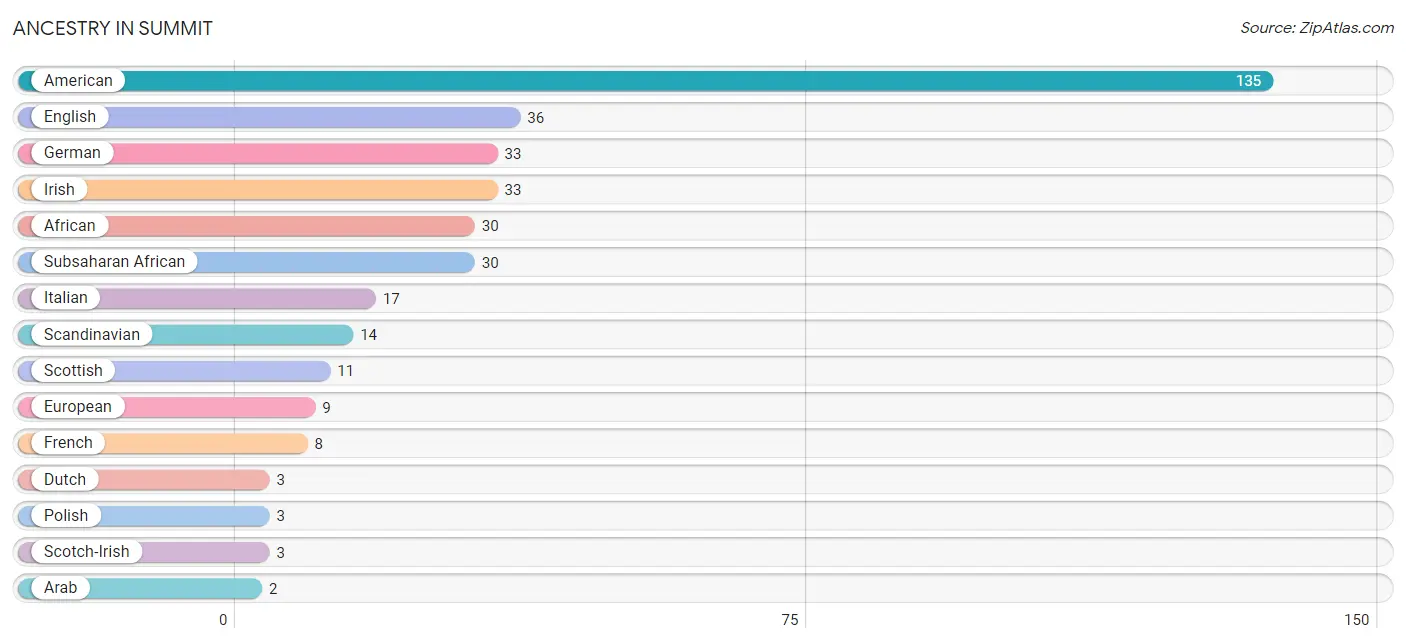
| Ancestry | # Population | % Population |
| African | 30 | 5.6% |
| American | 135 | 25.1% |
| Arab | 2 | 0.4% |
| British | 2 | 0.4% |
| Cherokee | 1 | 0.2% |
| Colombian | 2 | 0.4% |
| Croatian | 2 | 0.4% |
| Dutch | 3 | 0.6% |
| English | 36 | 6.7% |
| European | 9 | 1.7% |
| Finnish | 1 | 0.2% |
| French | 8 | 1.5% |
| German | 33 | 6.1% |
| Greek | 1 | 0.2% |
| Haitian | 2 | 0.4% |
| Irish | 33 | 6.1% |
| Italian | 17 | 3.2% |
| Polish | 3 | 0.6% |
| Scandinavian | 14 | 2.6% |
| Scotch-Irish | 3 | 0.6% |
| Scottish | 11 | 2.0% |
| South American | 2 | 0.4% |
| Subsaharan African | 30 | 5.6% |
| Swedish | 1 | 0.2% | View All 24 Rows |
Immigrants in Summit
The most numerous immigrant groups reported in Summit came from Africa (7 | 1.3%), South Africa (7 | 1.3%), Caribbean (2 | 0.4%), Haiti (2 | 0.4%), and Latin America (2 | 0.4%), together accounting for 3.7% of all Summit residents.
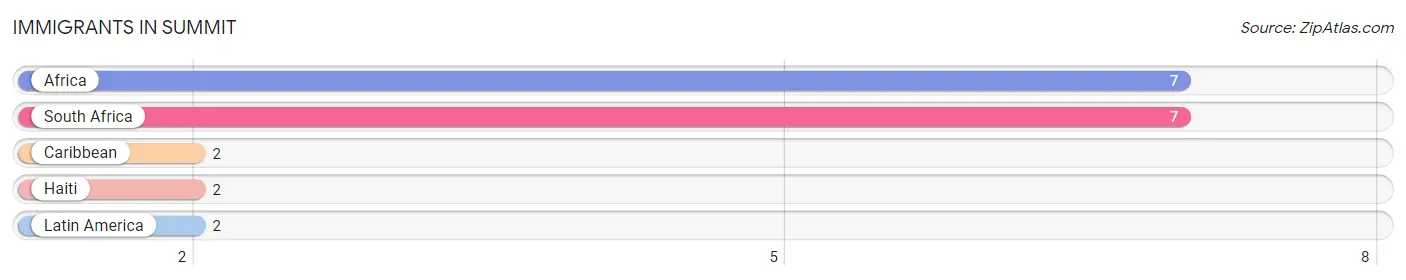
| Immigration Origin | # Population | % Population |
| Africa | 7 | 1.3% |
| Caribbean | 2 | 0.4% |
| Haiti | 2 | 0.4% |
| Latin America | 2 | 0.4% |
| South Africa | 7 | 1.3% | View All 5 Rows |
Sex and Age in Summit
Sex and Age in Summit
The most populous age groups in Summit are 60 to 64 Years (52 | 19.9%) for men and 55 to 59 Years (48 | 17.3%) for women.
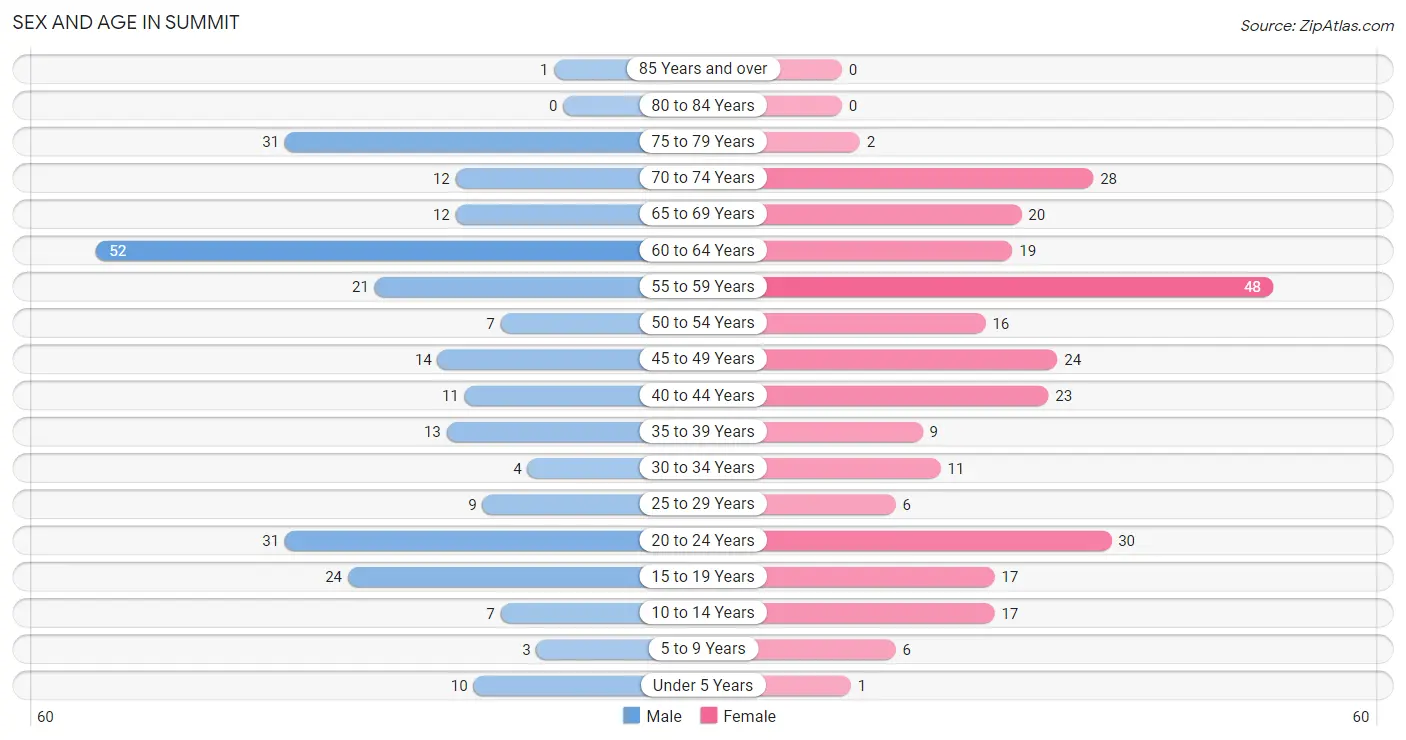
| Age Bracket | Male | Female |
| Under 5 Years | 10 (3.8%) | 1 (0.4%) |
| 5 to 9 Years | 3 (1.1%) | 6 (2.2%) |
| 10 to 14 Years | 7 (2.7%) | 17 (6.1%) |
| 15 to 19 Years | 24 (9.2%) | 17 (6.1%) |
| 20 to 24 Years | 31 (11.8%) | 30 (10.8%) |
| 25 to 29 Years | 9 (3.4%) | 6 (2.2%) |
| 30 to 34 Years | 4 (1.5%) | 11 (4.0%) |
| 35 to 39 Years | 13 (5.0%) | 9 (3.3%) |
| 40 to 44 Years | 11 (4.2%) | 23 (8.3%) |
| 45 to 49 Years | 14 (5.3%) | 24 (8.7%) |
| 50 to 54 Years | 7 (2.7%) | 16 (5.8%) |
| 55 to 59 Years | 21 (8.0%) | 48 (17.3%) |
| 60 to 64 Years | 52 (19.9%) | 19 (6.9%) |
| 65 to 69 Years | 12 (4.6%) | 20 (7.2%) |
| 70 to 74 Years | 12 (4.6%) | 28 (10.1%) |
| 75 to 79 Years | 31 (11.8%) | 2 (0.7%) |
| 80 to 84 Years | 0 (0.0%) | 0 (0.0%) |
| 85 Years and over | 1 (0.4%) | 0 (0.0%) |
| Total | 262 (100.0%) | 277 (100.0%) |
Families and Households in Summit
Median Family Size in Summit
The median family size in Summit is 2.74 persons per family, with married-couple families (159 | 86.4%) accounting for the largest median family size of 2.79 persons per family. On the other hand, single male/father families (3 | 1.6%) represent the smallest median family size with 2.00 persons per family.
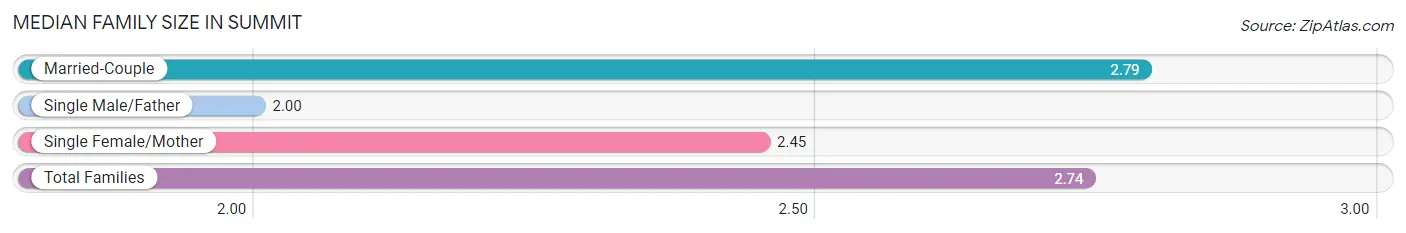
| Family Type | # Families | Family Size |
| Married-Couple | 159 (86.4%) | 2.79 |
| Single Male/Father | 3 (1.6%) | 2.00 |
| Single Female/Mother | 22 (12.0%) | 2.45 |
| Total Families | 184 (100.0%) | 2.74 |
Median Household Size in Summit
The median household size in Summit is 2.53 persons per household, with married-couple households (159 | 74.7%) accounting for the largest median household size of 2.8 persons per household. non-family households (29 | 13.6%) represent the smallest median household size with 1.17 persons per household.
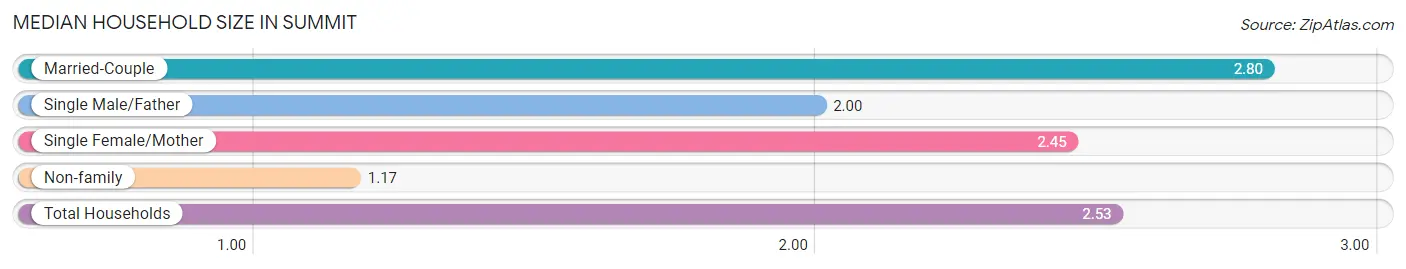
| Household Type | # Households | Household Size |
| Married-Couple | 159 (74.7%) | 2.80 |
| Single Male/Father | 3 (1.4%) | 2.00 |
| Single Female/Mother | 22 (10.3%) | 2.45 |
| Non-family | 29 (13.6%) | 1.17 |
| Total Households | 213 (100.0%) | 2.53 |
Household Size by Marriage Status in Summit
Out of a total of 213 households in Summit, 184 (86.4%) are family households, while 29 (13.6%) are nonfamily households. The most numerous type of family households are 2-person households, comprising 122, and the most common type of nonfamily households are 1-person households, comprising 25.
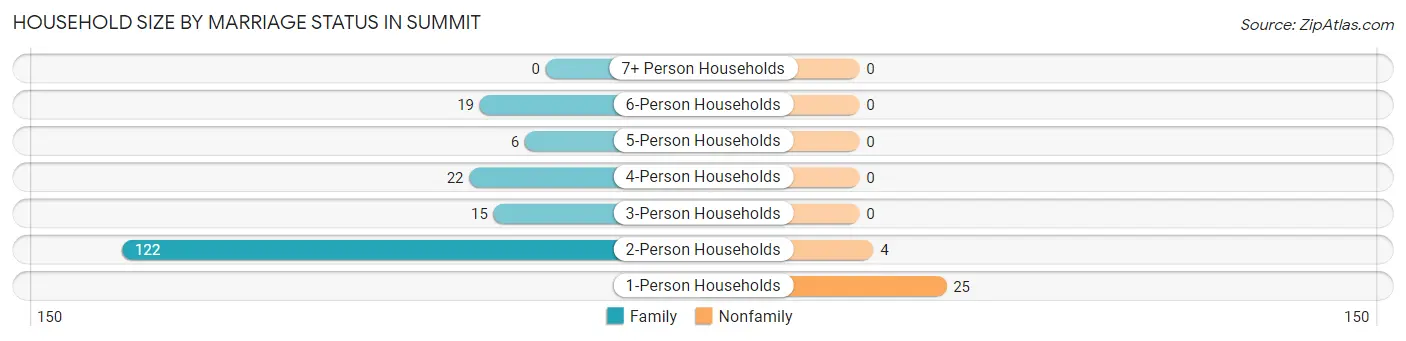
| Household Size | Family Households | Nonfamily Households |
| 1-Person Households | - | 25 (11.7%) |
| 2-Person Households | 122 (57.3%) | 4 (1.9%) |
| 3-Person Households | 15 (7.0%) | 0 (0.0%) |
| 4-Person Households | 22 (10.3%) | 0 (0.0%) |
| 5-Person Households | 6 (2.8%) | 0 (0.0%) |
| 6-Person Households | 19 (8.9%) | 0 (0.0%) |
| 7+ Person Households | 0 (0.0%) | 0 (0.0%) |
| Total | 184 (86.4%) | 29 (13.6%) |
Female Fertility in Summit
Fertility by Age in Summit
Average fertility rate in Summit is 33.0 births per 1,000 women. Women in the age bracket of 20 to 34 years have the highest fertility rate with 85.0 births per 1,000 women. Women in the age bracket of 20 to 34 years acount for 100.0% of all women with births.
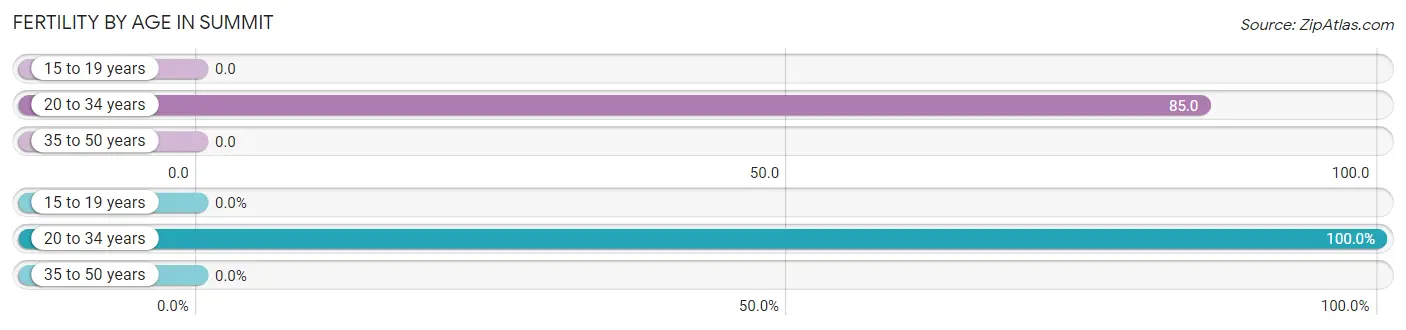
| Age Bracket | Women with Births | Births / 1,000 Women |
| 15 to 19 years | 0 (0.0%) | 0.0 |
| 20 to 34 years | 4 (100.0%) | 85.0 |
| 35 to 50 years | 0 (0.0%) | 0.0 |
| Total | 4 (100.0%) | 33.0 |
Fertility by Age by Marriage Status in Summit
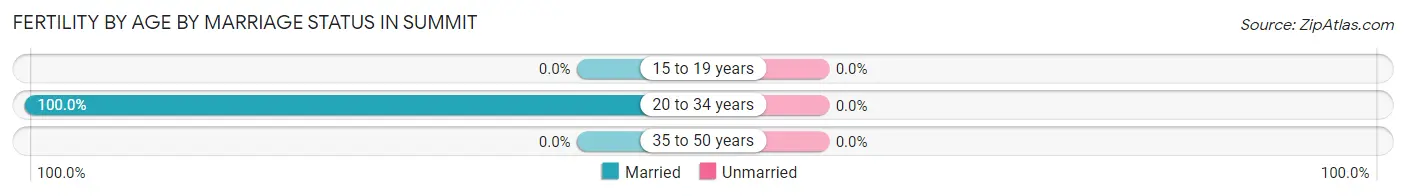
| Age Bracket | Married | Unmarried |
| 15 to 19 years | 0 (0.0%) | 0 (0.0%) |
| 20 to 34 years | 4 (100.0%) | 0 (0.0%) |
| 35 to 50 years | 0 (0.0%) | 0 (0.0%) |
| Total | 4 (100.0%) | 0 (0.0%) |
Fertility by Education in Summit
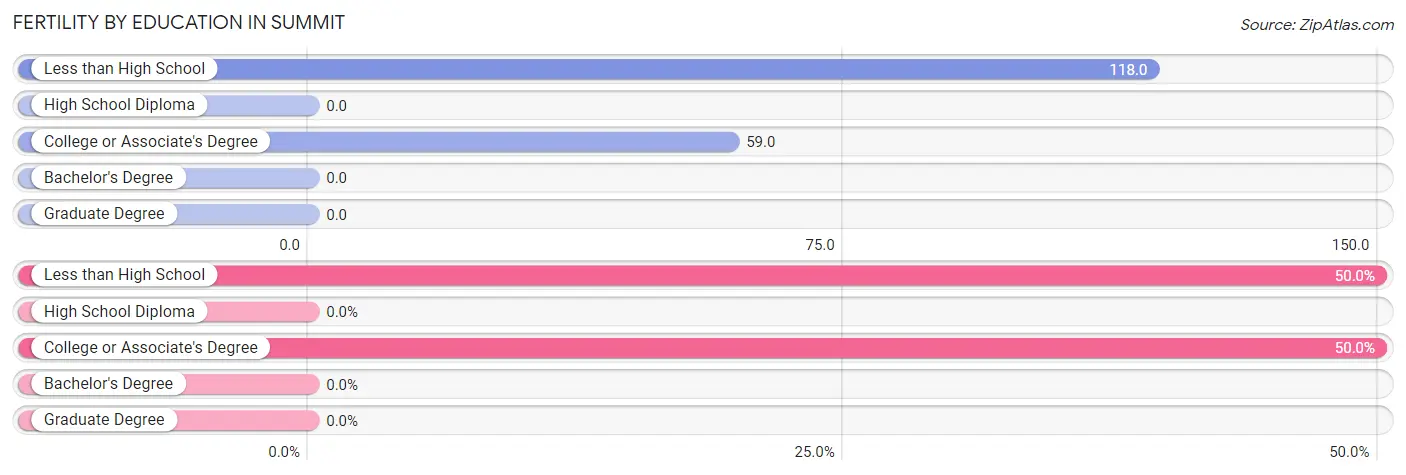
| Educational Attainment | Women with Births | Births / 1,000 Women |
| Less than High School | 2 (50.0%) | 118.0 |
| High School Diploma | 0 (0.0%) | 0.0 |
| College or Associate's Degree | 2 (50.0%) | 59.0 |
| Bachelor's Degree | 0 (0.0%) | 0.0 |
| Graduate Degree | 0 (0.0%) | 0.0 |
| Total | 4 (100.0%) | 33.0 |
Fertility by Education by Marriage Status in Summit
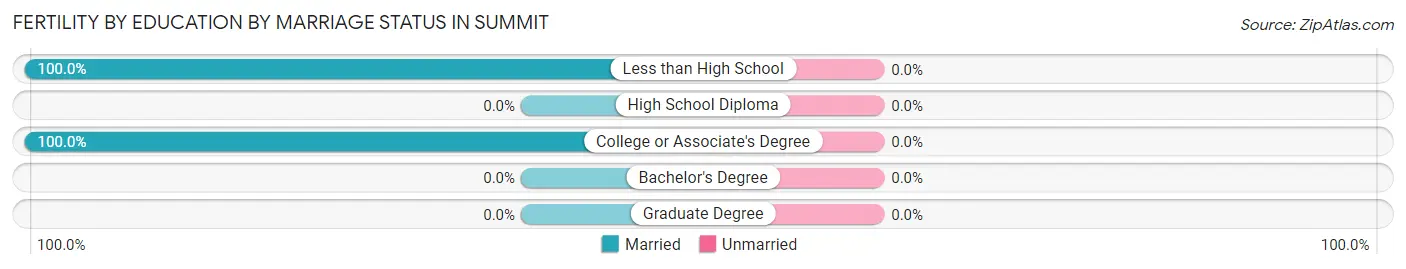
| Educational Attainment | Married | Unmarried |
| Less than High School | 2 (100.0%) | 0 (0.0%) |
| High School Diploma | 0 (0.0%) | 0 (0.0%) |
| College or Associate's Degree | 2 (100.0%) | 0 (0.0%) |
| Bachelor's Degree | 0 (0.0%) | 0 (0.0%) |
| Graduate Degree | 0 (0.0%) | 0 (0.0%) |
| Total | 4 (100.0%) | 0 (0.0%) |
Employment Characteristics in Summit
Employment by Class of Employer in Summit
Among the 304 employed individuals in Summit, private company employees (231 | 76.0%), state government employees (26 | 8.6%), and not-for-profit organizations (15 | 4.9%) make up the most common classes of employment.
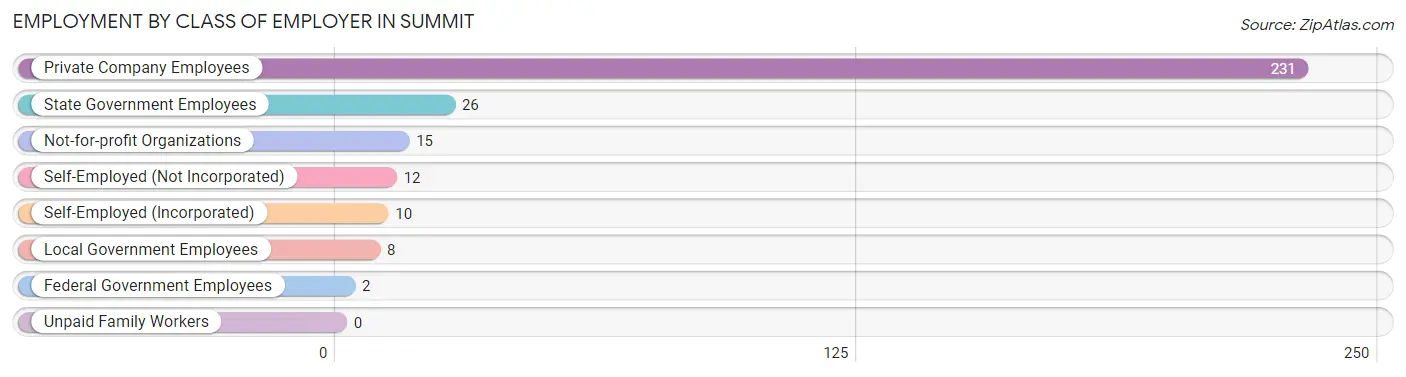
| Employer Class | # Employees | % Employees |
| Private Company Employees | 231 | 76.0% |
| Self-Employed (Incorporated) | 10 | 3.3% |
| Self-Employed (Not Incorporated) | 12 | 4.0% |
| Not-for-profit Organizations | 15 | 4.9% |
| Local Government Employees | 8 | 2.6% |
| State Government Employees | 26 | 8.6% |
| Federal Government Employees | 2 | 0.7% |
| Unpaid Family Workers | 0 | 0.0% |
| Total | 304 | 100.0% |
Employment Status by Age in Summit
According to the labor force statistics for Summit, out of the total population over 16 years of age (487), 64.7% or 315 individuals are in the labor force, with 1.6% or 5 of them unemployed. The age group with the highest labor force participation rate is 35 to 44 years, with 96.4% or 54 individuals in the labor force. Within the labor force, the 25 to 29 years age range has the highest percentage of unemployed individuals, with 16.7% or 2 of them being unemployed.
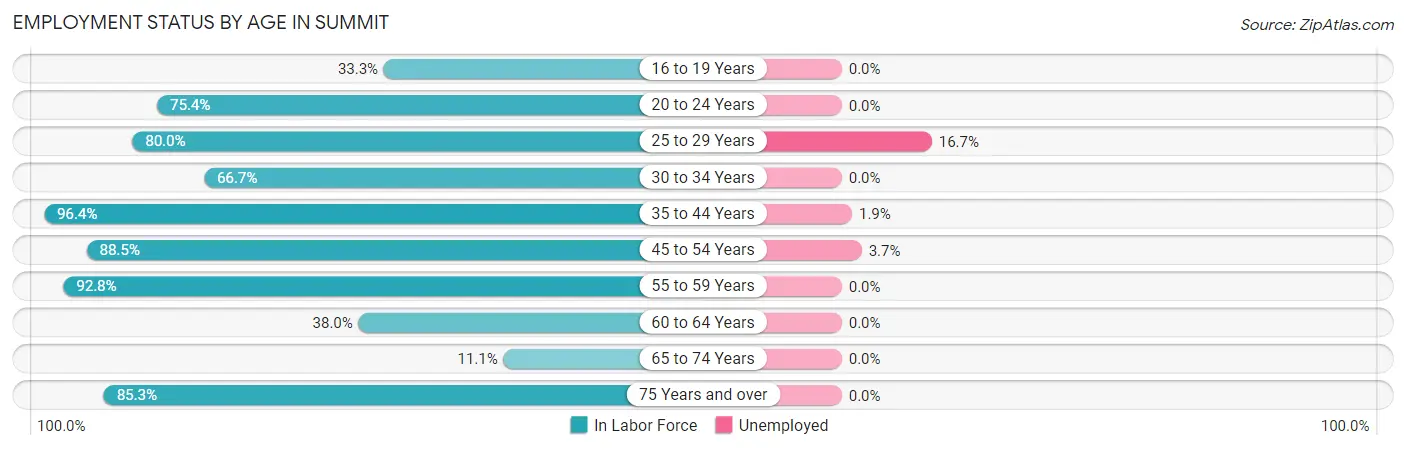
| Age Bracket | In Labor Force | Unemployed |
| 16 to 19 Years | 11 (33.3%) | 0 (0.0%) |
| 20 to 24 Years | 46 (75.4%) | 0 (0.0%) |
| 25 to 29 Years | 12 (80.0%) | 2 (16.7%) |
| 30 to 34 Years | 10 (66.7%) | 0 (0.0%) |
| 35 to 44 Years | 54 (96.4%) | 1 (1.9%) |
| 45 to 54 Years | 54 (88.5%) | 2 (3.7%) |
| 55 to 59 Years | 64 (92.8%) | 0 (0.0%) |
| 60 to 64 Years | 27 (38.0%) | 0 (0.0%) |
| 65 to 74 Years | 8 (11.1%) | 0 (0.0%) |
| 75 Years and over | 29 (85.3%) | 0 (0.0%) |
| Total | 315 (64.7%) | 5 (1.6%) |
Employment Status by Educational Attainment in Summit
According to labor force statistics for Summit, 77.0% of individuals (221) out of the total population between 25 and 64 years of age (287) are in the labor force, with 2.3% or 5 of them being unemployed. The group with the highest labor force participation rate are those with the educational attainment of college / associate degree, with 95.9% or 118 individuals in the labor force. Within the labor force, individuals with bachelor's degree or higher education have the highest percentage of unemployment, with 5.0% or 2 of them being unemployed.
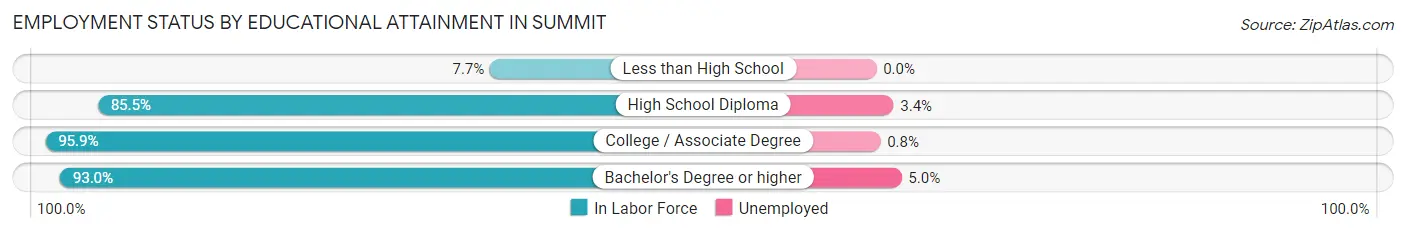
| Educational Attainment | In Labor Force | Unemployed |
| Less than High School | 4 (7.7%) | 0 (0.0%) |
| High School Diploma | 59 (85.5%) | 2 (3.4%) |
| College / Associate Degree | 118 (95.9%) | 1 (0.8%) |
| Bachelor's Degree or higher | 40 (93.0%) | 2 (5.0%) |
| Total | 221 (77.0%) | 7 (2.3%) |
Employment Occupations by Sex in Summit
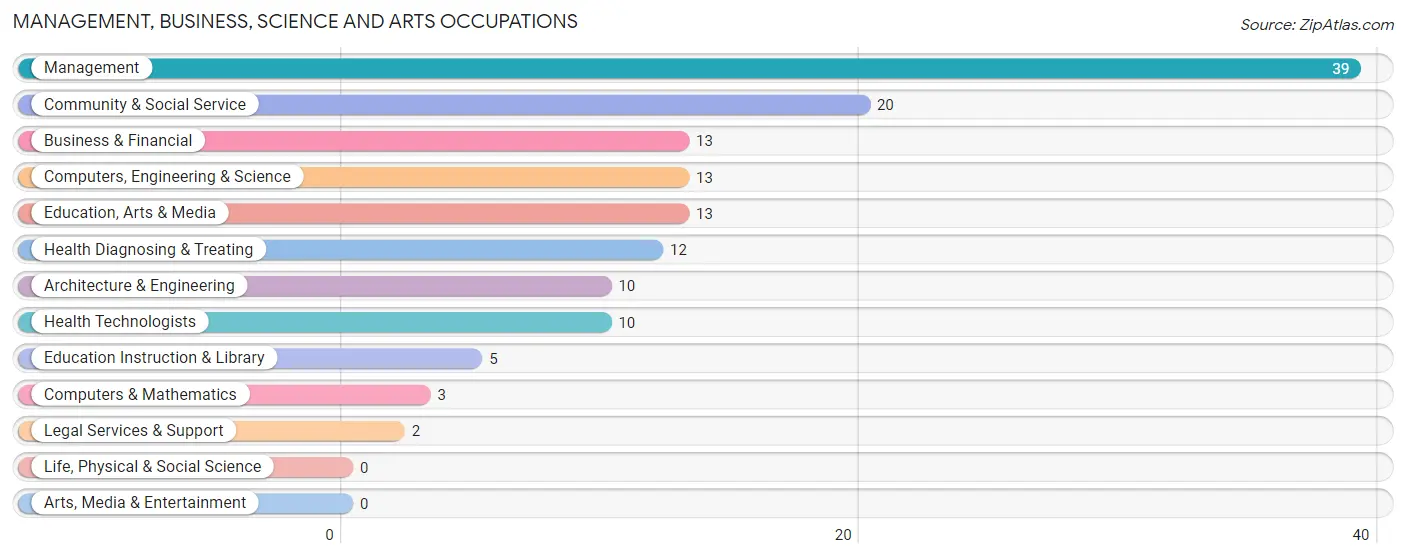
Management, Business, Science and Arts Occupations
The most common Management, Business, Science and Arts occupations in Summit are Management (39 | 12.6%), Community & Social Service (20 | 6.5%), Business & Financial (13 | 4.2%), Computers, Engineering & Science (13 | 4.2%), and Education, Arts & Media (13 | 4.2%).
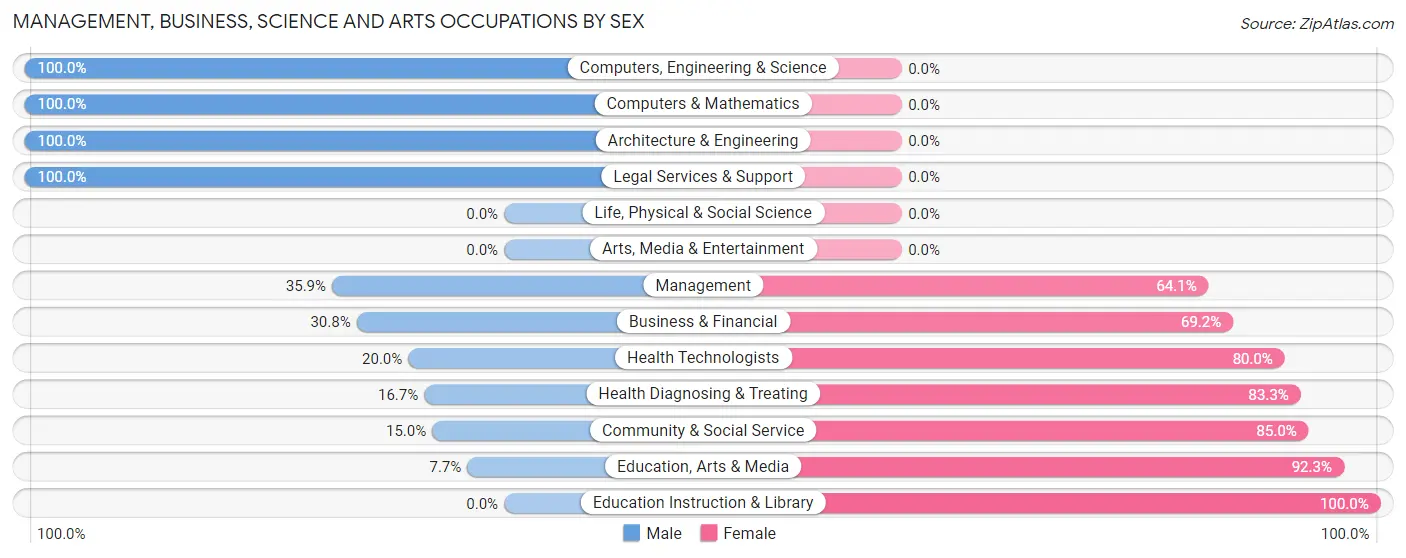
Management, Business, Science and Arts Occupations by Sex
Within the Management, Business, Science and Arts occupations in Summit, the most male-oriented occupations are Computers, Engineering & Science (100.0%), Computers & Mathematics (100.0%), and Architecture & Engineering (100.0%), while the most female-oriented occupations are Education Instruction & Library (100.0%), Education, Arts & Media (92.3%), and Community & Social Service (85.0%).
| Occupation | Male | Female |
| Management | 14 (35.9%) | 25 (64.1%) |
| Business & Financial | 4 (30.8%) | 9 (69.2%) |
| Computers, Engineering & Science | 13 (100.0%) | 0 (0.0%) |
| Computers & Mathematics | 3 (100.0%) | 0 (0.0%) |
| Architecture & Engineering | 10 (100.0%) | 0 (0.0%) |
| Life, Physical & Social Science | 0 (0.0%) | 0 (0.0%) |
| Community & Social Service | 3 (15.0%) | 17 (85.0%) |
| Education, Arts & Media | 1 (7.7%) | 12 (92.3%) |
| Legal Services & Support | 2 (100.0%) | 0 (0.0%) |
| Education Instruction & Library | 0 (0.0%) | 5 (100.0%) |
| Arts, Media & Entertainment | 0 (0.0%) | 0 (0.0%) |
| Health Diagnosing & Treating | 2 (16.7%) | 10 (83.3%) |
| Health Technologists | 2 (20.0%) | 8 (80.0%) |
| Total (Category) | 36 (37.1%) | 61 (62.9%) |
| Total (Overall) | 153 (49.3%) | 157 (50.6%) |
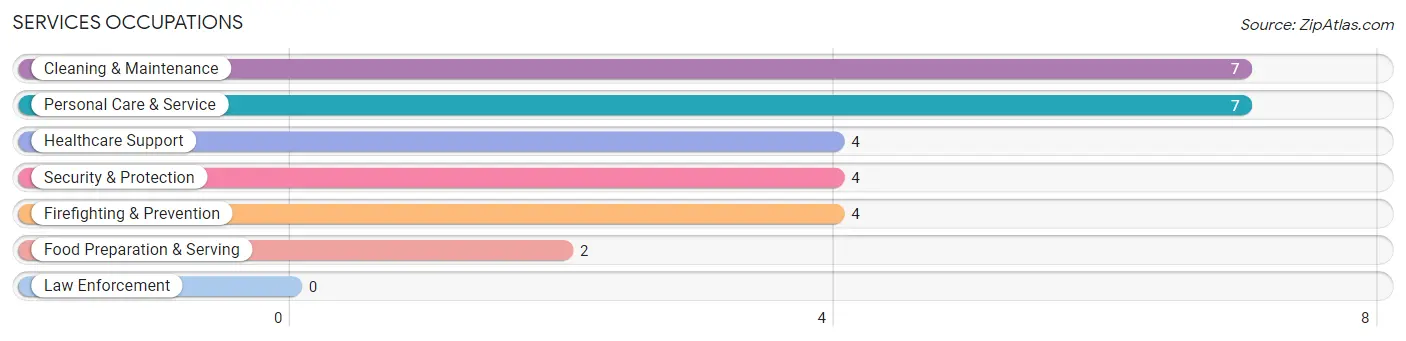
Services Occupations
The most common Services occupations in Summit are Cleaning & Maintenance (7 | 2.3%), Personal Care & Service (7 | 2.3%), Healthcare Support (4 | 1.3%), Security & Protection (4 | 1.3%), and Firefighting & Prevention (4 | 1.3%).
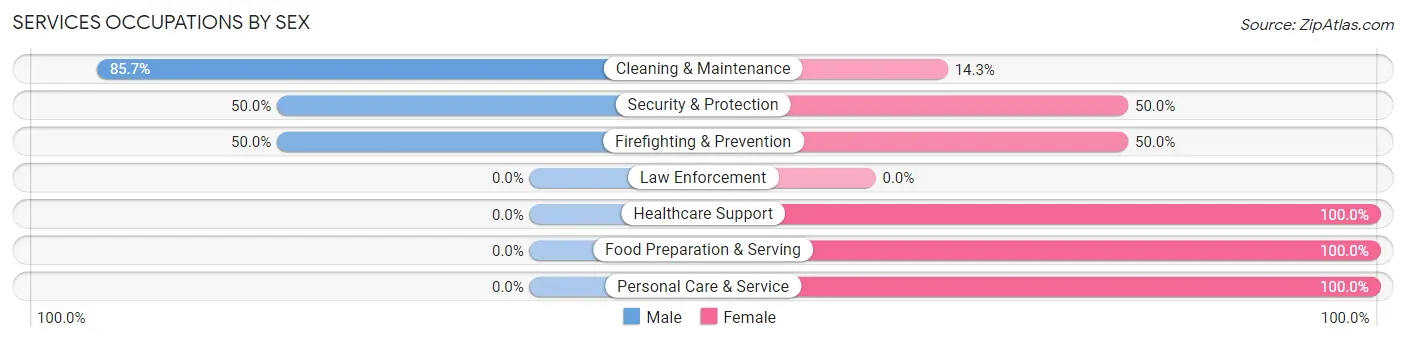
Services Occupations by Sex
Within the Services occupations in Summit, the most male-oriented occupations are Cleaning & Maintenance (85.7%), Security & Protection (50.0%), and Firefighting & Prevention (50.0%), while the most female-oriented occupations are Healthcare Support (100.0%), Food Preparation & Serving (100.0%), and Personal Care & Service (100.0%).
| Occupation | Male | Female |
| Healthcare Support | 0 (0.0%) | 4 (100.0%) |
| Security & Protection | 2 (50.0%) | 2 (50.0%) |
| Firefighting & Prevention | 2 (50.0%) | 2 (50.0%) |
| Law Enforcement | 0 (0.0%) | 0 (0.0%) |
| Food Preparation & Serving | 0 (0.0%) | 2 (100.0%) |
| Cleaning & Maintenance | 6 (85.7%) | 1 (14.3%) |
| Personal Care & Service | 0 (0.0%) | 7 (100.0%) |
| Total (Category) | 8 (33.3%) | 16 (66.7%) |
| Total (Overall) | 153 (49.3%) | 157 (50.6%) |
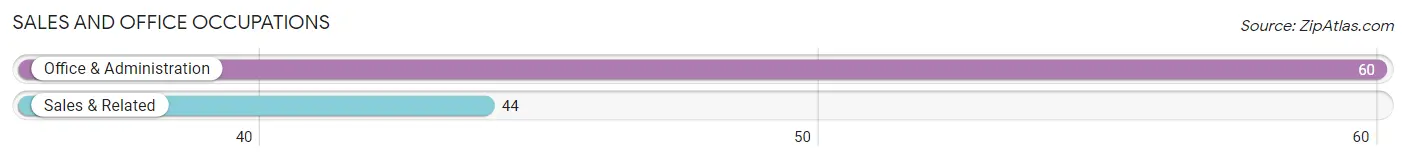
Sales and Office Occupations
The most common Sales and Office occupations in Summit are Office & Administration (60 | 19.4%), and Sales & Related (44 | 14.2%).
Sales and Office Occupations by Sex
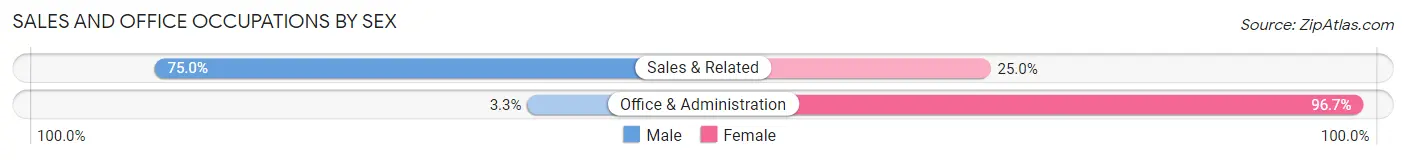
| Occupation | Male | Female |
| Sales & Related | 33 (75.0%) | 11 (25.0%) |
| Office & Administration | 2 (3.3%) | 58 (96.7%) |
| Total (Category) | 35 (33.7%) | 69 (66.3%) |
| Total (Overall) | 153 (49.3%) | 157 (50.6%) |
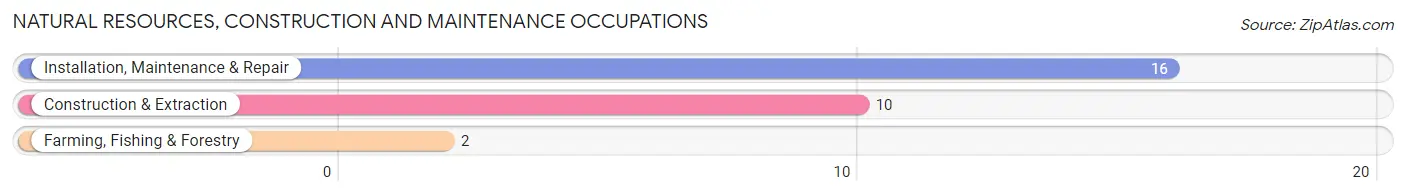
Natural Resources, Construction and Maintenance Occupations
The most common Natural Resources, Construction and Maintenance occupations in Summit are Installation, Maintenance & Repair (16 | 5.2%), Construction & Extraction (10 | 3.2%), and Farming, Fishing & Forestry (2 | 0.6%).
Natural Resources, Construction and Maintenance Occupations by Sex
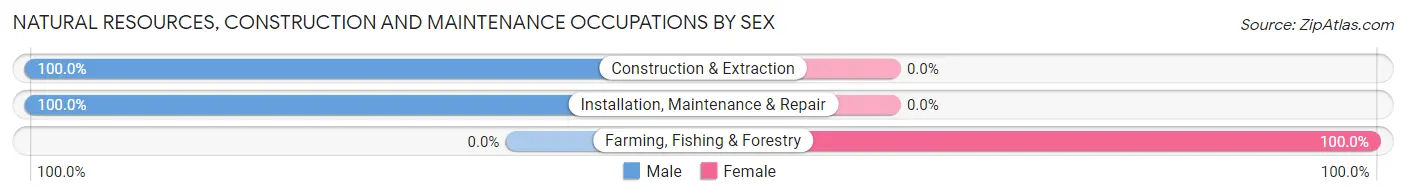
| Occupation | Male | Female |
| Farming, Fishing & Forestry | 0 (0.0%) | 2 (100.0%) |
| Construction & Extraction | 10 (100.0%) | 0 (0.0%) |
| Installation, Maintenance & Repair | 16 (100.0%) | 0 (0.0%) |
| Total (Category) | 26 (92.9%) | 2 (7.1%) |
| Total (Overall) | 153 (49.3%) | 157 (50.6%) |
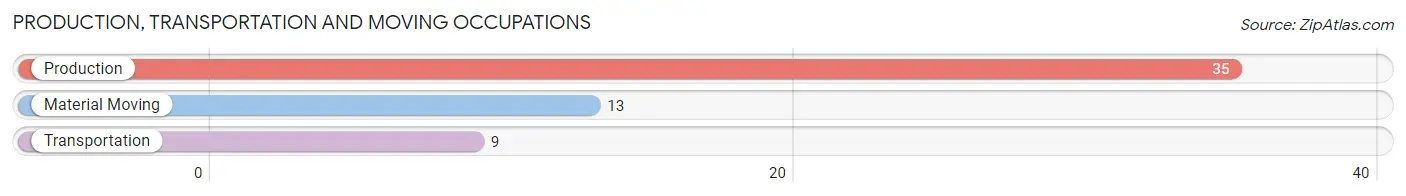
Production, Transportation and Moving Occupations
The most common Production, Transportation and Moving occupations in Summit are Production (35 | 11.3%), Material Moving (13 | 4.2%), and Transportation (9 | 2.9%).
Production, Transportation and Moving Occupations by Sex
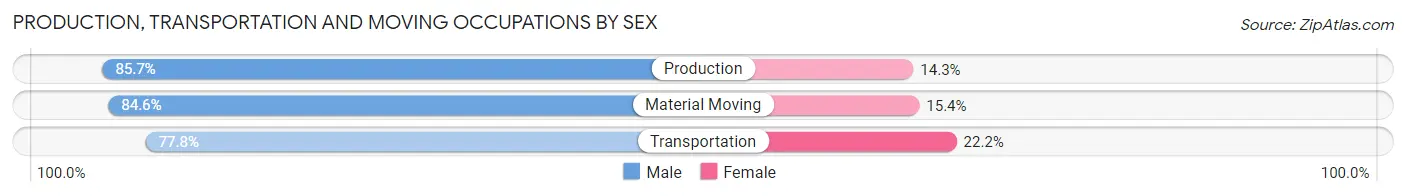
| Occupation | Male | Female |
| Production | 30 (85.7%) | 5 (14.3%) |
| Transportation | 7 (77.8%) | 2 (22.2%) |
| Material Moving | 11 (84.6%) | 2 (15.4%) |
| Total (Category) | 48 (84.2%) | 9 (15.8%) |
| Total (Overall) | 153 (49.3%) | 157 (50.6%) |
Employment Industries by Sex in Summit
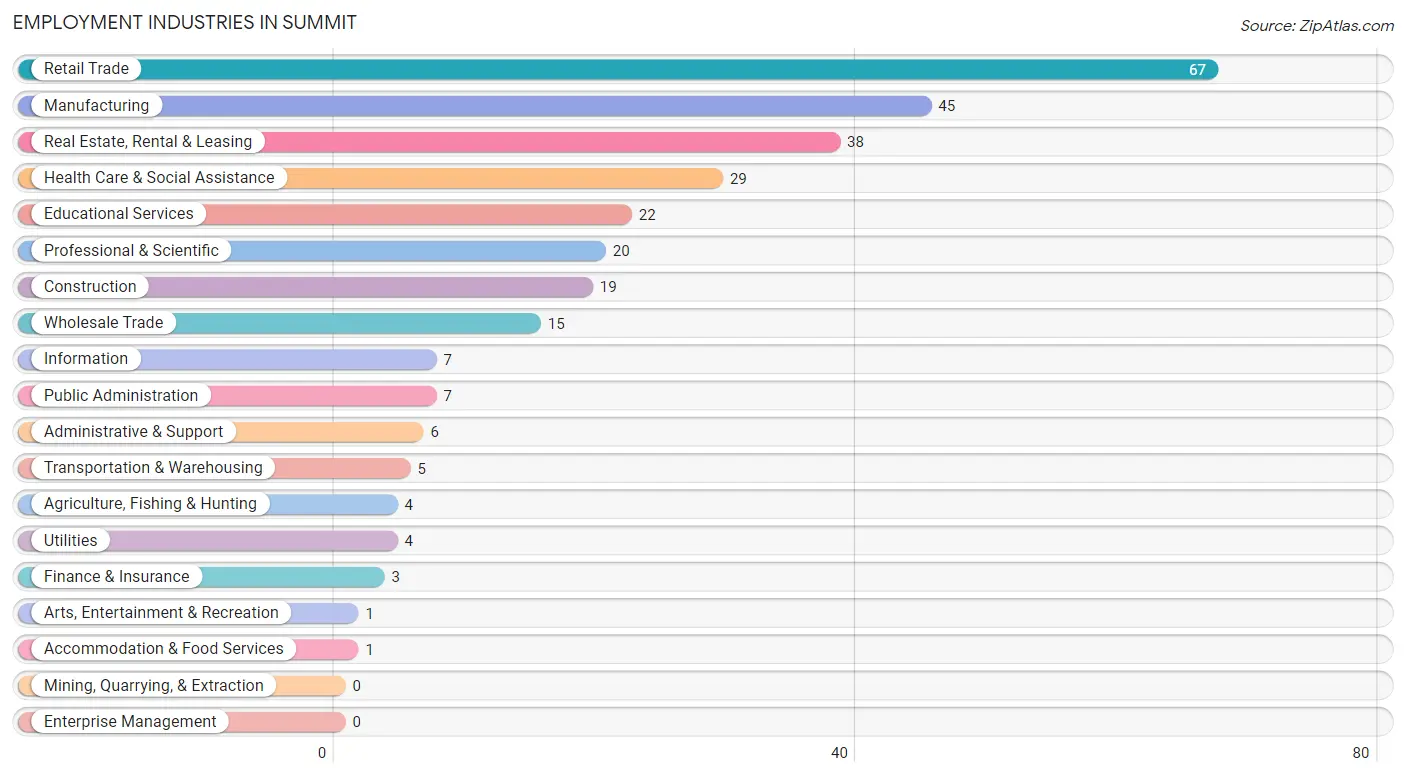
Employment Industries in Summit
The major employment industries in Summit include Retail Trade (67 | 21.6%), Manufacturing (45 | 14.5%), Real Estate, Rental & Leasing (38 | 12.3%), Health Care & Social Assistance (29 | 9.3%), and Educational Services (22 | 7.1%).
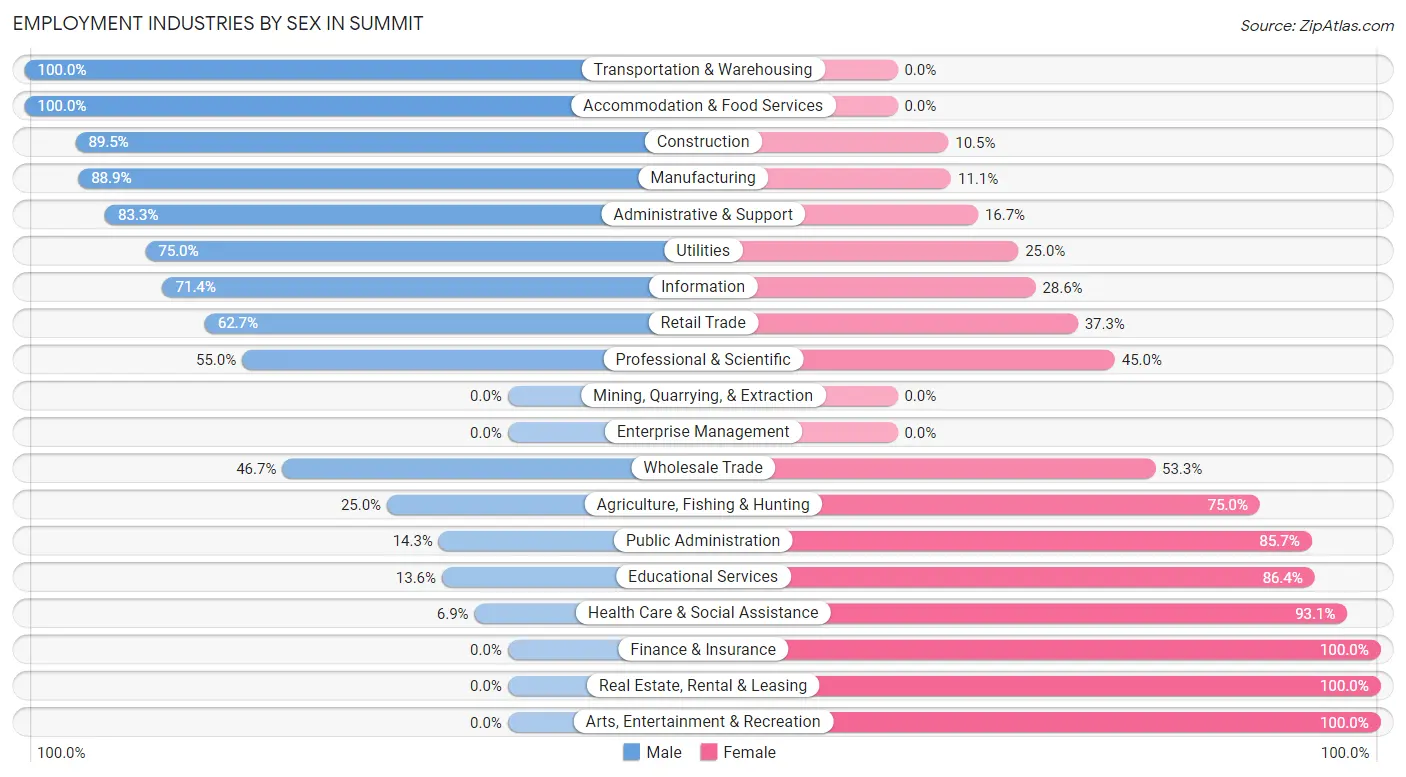
Employment Industries by Sex in Summit
The Summit industries that see more men than women are Transportation & Warehousing (100.0%), Accommodation & Food Services (100.0%), and Construction (89.5%), whereas the industries that tend to have a higher number of women are Finance & Insurance (100.0%), Real Estate, Rental & Leasing (100.0%), and Arts, Entertainment & Recreation (100.0%).
| Industry | Male | Female |
| Agriculture, Fishing & Hunting | 1 (25.0%) | 3 (75.0%) |
| Mining, Quarrying, & Extraction | 0 (0.0%) | 0 (0.0%) |
| Construction | 17 (89.5%) | 2 (10.5%) |
| Manufacturing | 40 (88.9%) | 5 (11.1%) |
| Wholesale Trade | 7 (46.7%) | 8 (53.3%) |
| Retail Trade | 42 (62.7%) | 25 (37.3%) |
| Transportation & Warehousing | 5 (100.0%) | 0 (0.0%) |
| Utilities | 3 (75.0%) | 1 (25.0%) |
| Information | 5 (71.4%) | 2 (28.6%) |
| Finance & Insurance | 0 (0.0%) | 3 (100.0%) |
| Real Estate, Rental & Leasing | 0 (0.0%) | 38 (100.0%) |
| Professional & Scientific | 11 (55.0%) | 9 (45.0%) |
| Enterprise Management | 0 (0.0%) | 0 (0.0%) |
| Administrative & Support | 5 (83.3%) | 1 (16.7%) |
| Educational Services | 3 (13.6%) | 19 (86.4%) |
| Health Care & Social Assistance | 2 (6.9%) | 27 (93.1%) |
| Arts, Entertainment & Recreation | 0 (0.0%) | 1 (100.0%) |
| Accommodation & Food Services | 1 (100.0%) | 0 (0.0%) |
| Public Administration | 1 (14.3%) | 6 (85.7%) |
| Total | 153 (49.3%) | 157 (50.6%) |
Education in Summit
School Enrollment in Summit
The most common levels of schooling among the 79 students in Summit are high school (48 | 60.8%), elementary school (11 | 13.9%), and middle school (9 | 11.4%).
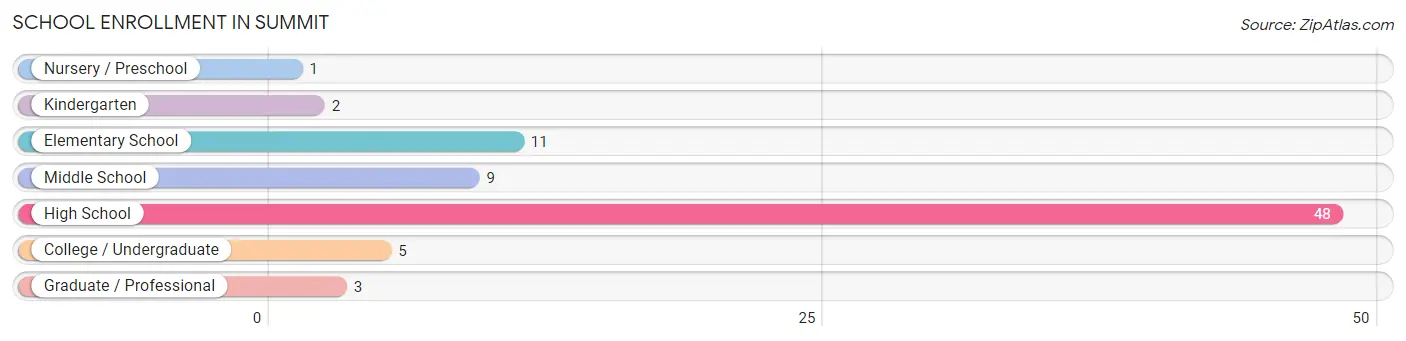
| School Level | # Students | % Students |
| Nursery / Preschool | 1 | 1.3% |
| Kindergarten | 2 | 2.5% |
| Elementary School | 11 | 13.9% |
| Middle School | 9 | 11.4% |
| High School | 48 | 60.8% |
| College / Undergraduate | 5 | 6.3% |
| Graduate / Professional | 3 | 3.8% |
| Total | 79 | 100.0% |
School Enrollment by Age by Funding Source in Summit
Out of a total of 79 students who are enrolled in schools in Summit, 6 (7.6%) attend a private institution, while the remaining 73 (92.4%) are enrolled in public schools. The age group of 10 to 14 year olds has the highest likelihood of being enrolled in private schools, with 6 (26.1% in the age bracket) enrolled. Conversely, the age group of 3 to 4 year olds has the lowest likelihood of being enrolled in a private school, with 1 (100.0% in the age bracket) attending a public institution.
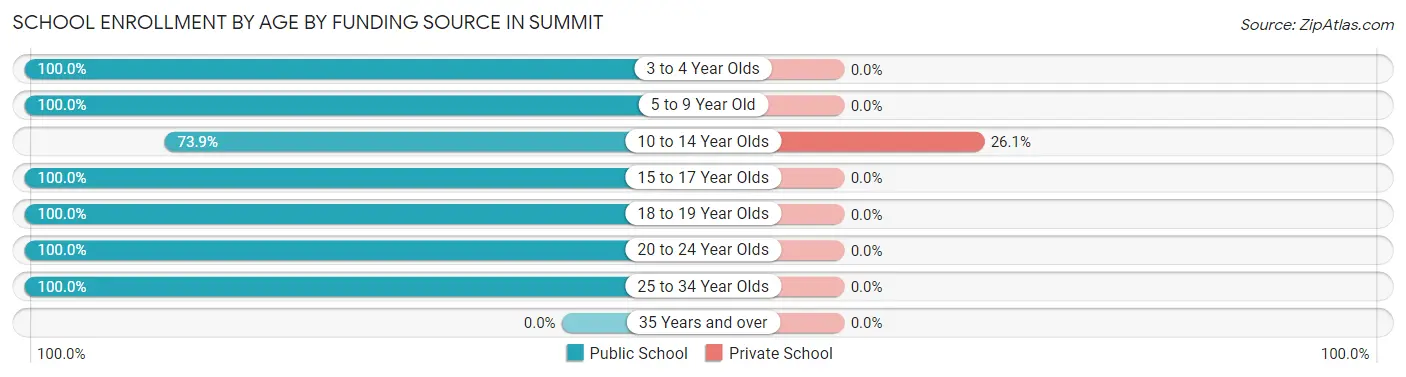
| Age Bracket | Public School | Private School |
| 3 to 4 Year Olds | 1 (100.0%) | 0 (0.0%) |
| 5 to 9 Year Old | 6 (100.0%) | 0 (0.0%) |
| 10 to 14 Year Olds | 17 (73.9%) | 6 (26.1%) |
| 15 to 17 Year Olds | 30 (100.0%) | 0 (0.0%) |
| 18 to 19 Year Olds | 2 (100.0%) | 0 (0.0%) |
| 20 to 24 Year Olds | 14 (100.0%) | 0 (0.0%) |
| 25 to 34 Year Olds | 3 (100.0%) | 0 (0.0%) |
| 35 Years and over | 0 (0.0%) | 0 (0.0%) |
| Total | 73 (92.4%) | 6 (7.6%) |
Educational Attainment by Field of Study in Summit
Business (14 | 24.6%), arts & humanities (10 | 17.5%), science & technology (8 | 14.0%), psychology (5 | 8.8%), and social sciences (5 | 8.8%) are the most common fields of study among 57 individuals in Summit who have obtained a bachelor's degree or higher.
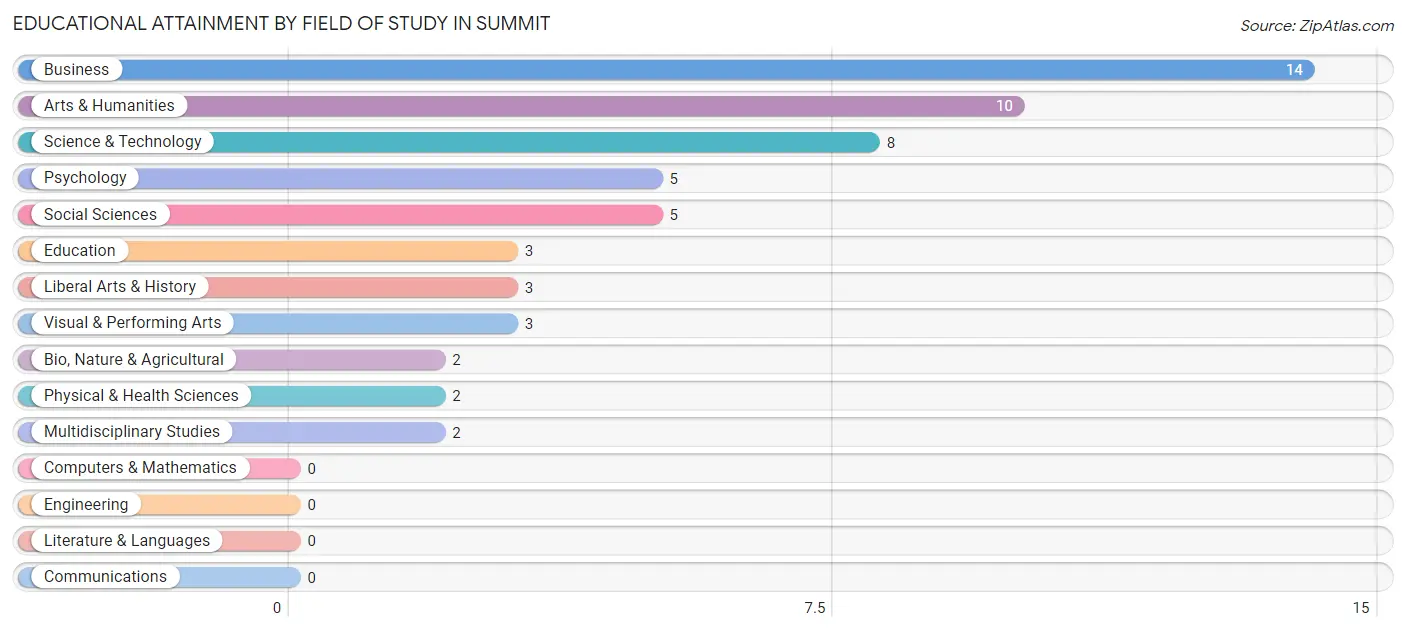
| Field of Study | # Graduates | % Graduates |
| Computers & Mathematics | 0 | 0.0% |
| Bio, Nature & Agricultural | 2 | 3.5% |
| Physical & Health Sciences | 2 | 3.5% |
| Psychology | 5 | 8.8% |
| Social Sciences | 5 | 8.8% |
| Engineering | 0 | 0.0% |
| Multidisciplinary Studies | 2 | 3.5% |
| Science & Technology | 8 | 14.0% |
| Business | 14 | 24.6% |
| Education | 3 | 5.3% |
| Literature & Languages | 0 | 0.0% |
| Liberal Arts & History | 3 | 5.3% |
| Visual & Performing Arts | 3 | 5.3% |
| Communications | 0 | 0.0% |
| Arts & Humanities | 10 | 17.5% |
| Total | 57 | 100.0% |
Transportation & Commute in Summit
Vehicle Availability by Sex in Summit
The most prevalent vehicle ownership categories in Summit are males with 2 vehicles (63, accounting for 41.2%) and females with 2 vehicles (84, making up 41.7%).
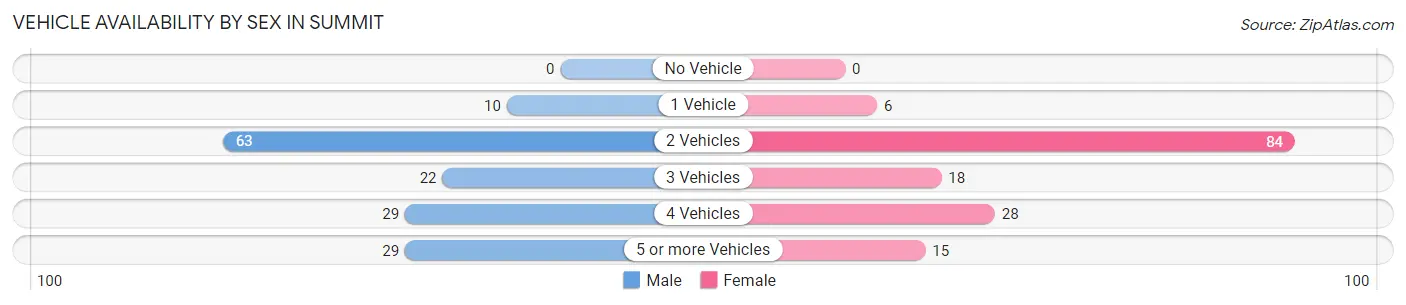
| Vehicles Available | Male | Female |
| No Vehicle | 0 (0.0%) | 0 (0.0%) |
| 1 Vehicle | 10 (6.5%) | 6 (4.0%) |
| 2 Vehicles | 63 (41.2%) | 84 (55.6%) |
| 3 Vehicles | 22 (14.4%) | 18 (11.9%) |
| 4 Vehicles | 29 (19.0%) | 28 (18.5%) |
| 5 or more Vehicles | 29 (19.0%) | 15 (9.9%) |
| Total | 153 (100.0%) | 151 (100.0%) |
Commute Time in Summit
The most frequently occuring commute durations in Summit are 45 to 59 minutes (56 commuters, 18.6%), 35 to 39 minutes (48 commuters, 16.0%), and 15 to 19 minutes (37 commuters, 12.3%).
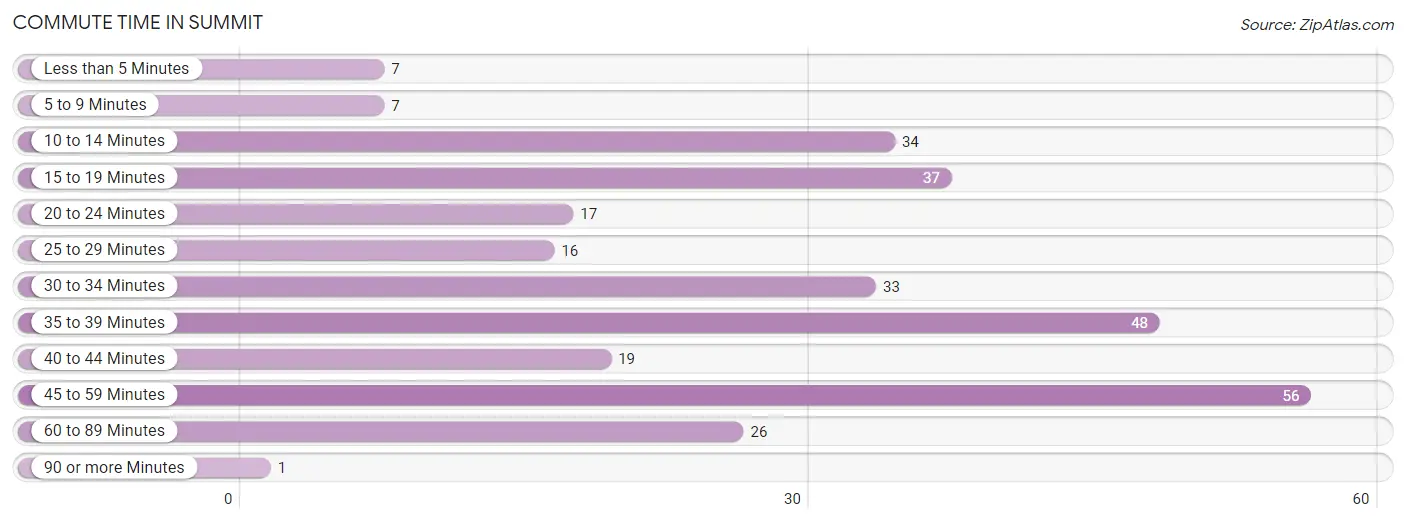
| Commute Time | # Commuters | % Commuters |
| Less than 5 Minutes | 7 | 2.3% |
| 5 to 9 Minutes | 7 | 2.3% |
| 10 to 14 Minutes | 34 | 11.3% |
| 15 to 19 Minutes | 37 | 12.3% |
| 20 to 24 Minutes | 17 | 5.7% |
| 25 to 29 Minutes | 16 | 5.3% |
| 30 to 34 Minutes | 33 | 11.0% |
| 35 to 39 Minutes | 48 | 16.0% |
| 40 to 44 Minutes | 19 | 6.3% |
| 45 to 59 Minutes | 56 | 18.6% |
| 60 to 89 Minutes | 26 | 8.6% |
| 90 or more Minutes | 1 | 0.3% |
Commute Time by Sex in Summit
The most common commute times in Summit are 35 to 39 minutes (33 commuters, 21.6%) for males and 45 to 59 minutes (49 commuters, 33.1%) for females.
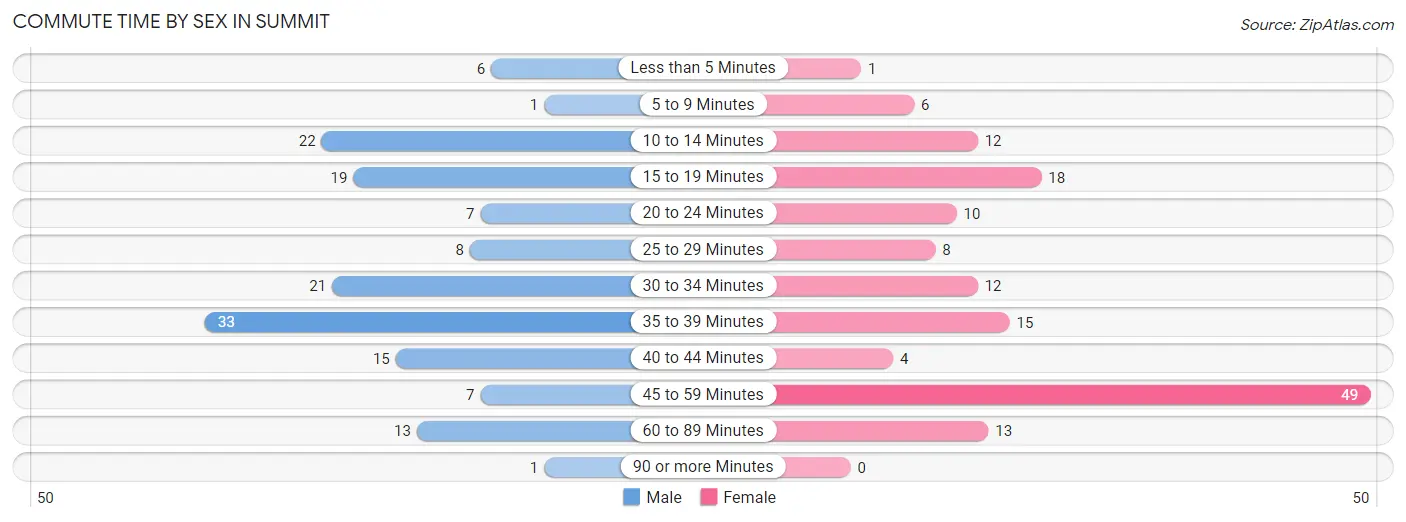
| Commute Time | Male | Female |
| Less than 5 Minutes | 6 (3.9%) | 1 (0.7%) |
| 5 to 9 Minutes | 1 (0.6%) | 6 (4.1%) |
| 10 to 14 Minutes | 22 (14.4%) | 12 (8.1%) |
| 15 to 19 Minutes | 19 (12.4%) | 18 (12.2%) |
| 20 to 24 Minutes | 7 (4.6%) | 10 (6.8%) |
| 25 to 29 Minutes | 8 (5.2%) | 8 (5.4%) |
| 30 to 34 Minutes | 21 (13.7%) | 12 (8.1%) |
| 35 to 39 Minutes | 33 (21.6%) | 15 (10.1%) |
| 40 to 44 Minutes | 15 (9.8%) | 4 (2.7%) |
| 45 to 59 Minutes | 7 (4.6%) | 49 (33.1%) |
| 60 to 89 Minutes | 13 (8.5%) | 13 (8.8%) |
| 90 or more Minutes | 1 (0.6%) | 0 (0.0%) |
Time of Departure to Work by Sex in Summit
The most frequent times of departure to work in Summit are 6:30 AM to 6:59 AM (58, 37.9%) for males and 6:00 AM to 6:29 AM (42, 28.4%) for females.
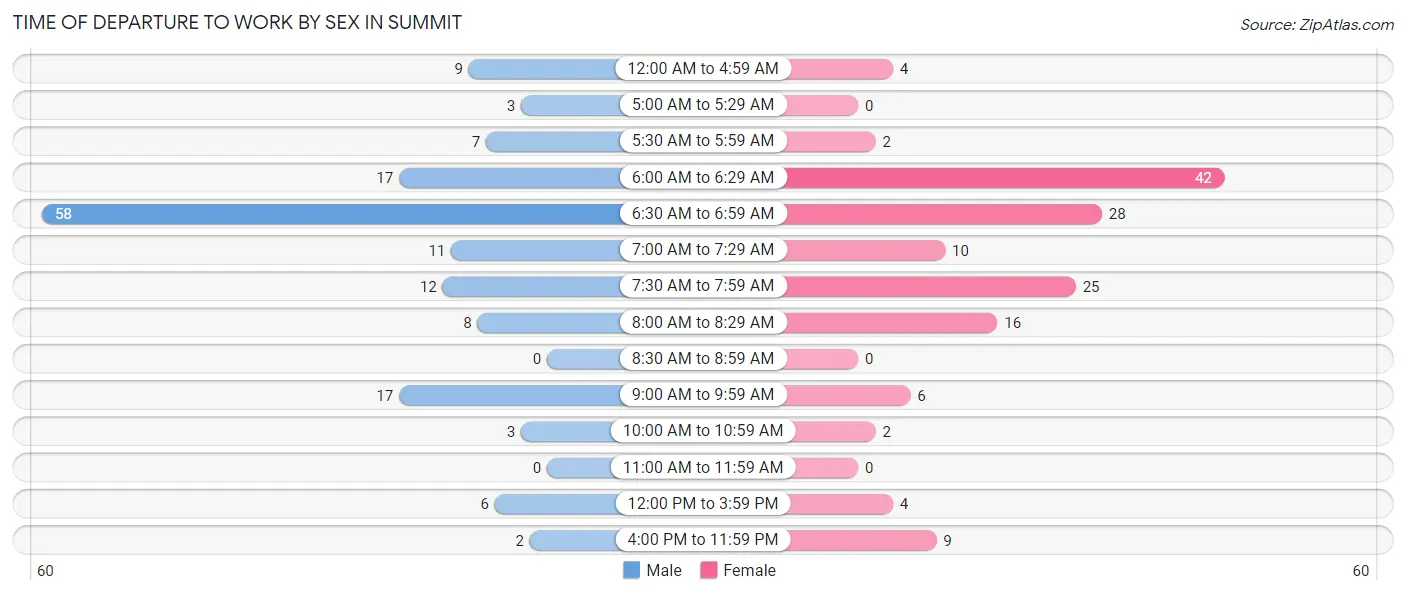
| Time of Departure | Male | Female |
| 12:00 AM to 4:59 AM | 9 (5.9%) | 4 (2.7%) |
| 5:00 AM to 5:29 AM | 3 (2.0%) | 0 (0.0%) |
| 5:30 AM to 5:59 AM | 7 (4.6%) | 2 (1.3%) |
| 6:00 AM to 6:29 AM | 17 (11.1%) | 42 (28.4%) |
| 6:30 AM to 6:59 AM | 58 (37.9%) | 28 (18.9%) |
| 7:00 AM to 7:29 AM | 11 (7.2%) | 10 (6.8%) |
| 7:30 AM to 7:59 AM | 12 (7.8%) | 25 (16.9%) |
| 8:00 AM to 8:29 AM | 8 (5.2%) | 16 (10.8%) |
| 8:30 AM to 8:59 AM | 0 (0.0%) | 0 (0.0%) |
| 9:00 AM to 9:59 AM | 17 (11.1%) | 6 (4.1%) |
| 10:00 AM to 10:59 AM | 3 (2.0%) | 2 (1.3%) |
| 11:00 AM to 11:59 AM | 0 (0.0%) | 0 (0.0%) |
| 12:00 PM to 3:59 PM | 6 (3.9%) | 4 (2.7%) |
| 4:00 PM to 11:59 PM | 2 (1.3%) | 9 (6.1%) |
| Total | 153 (100.0%) | 148 (100.0%) |
Housing Occupancy in Summit
Occupancy by Ownership in Summit
Of the total 213 dwellings in Summit, owner-occupied units account for 178 (83.6%), while renter-occupied units make up 35 (16.4%).
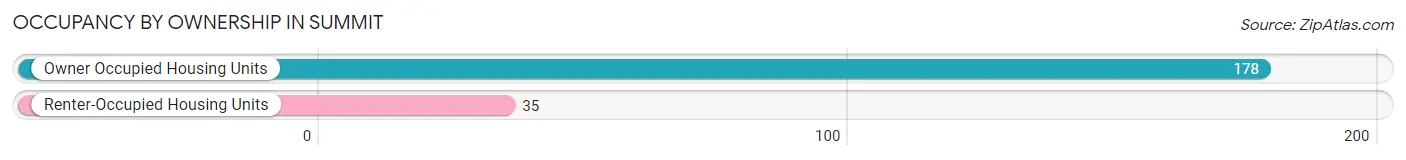
| Occupancy | # Housing Units | % Housing Units |
| Owner Occupied Housing Units | 178 | 83.6% |
| Renter-Occupied Housing Units | 35 | 16.4% |
| Total Occupied Housing Units | 213 | 100.0% |
Occupancy by Household Size in Summit
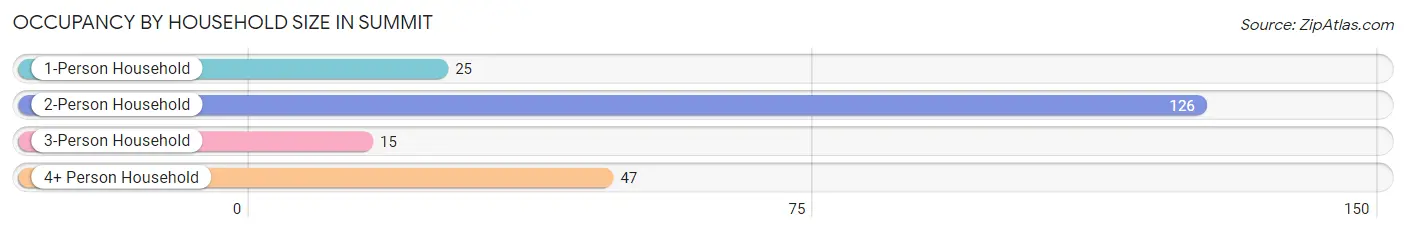
| Household Size | # Housing Units | % Housing Units |
| 1-Person Household | 25 | 11.7% |
| 2-Person Household | 126 | 59.2% |
| 3-Person Household | 15 | 7.0% |
| 4+ Person Household | 47 | 22.1% |
| Total Housing Units | 213 | 100.0% |
Occupancy by Ownership by Household Size in Summit
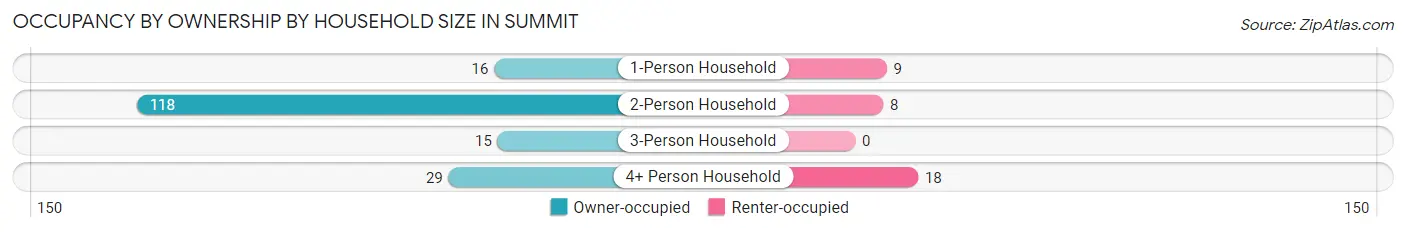
| Household Size | Owner-occupied | Renter-occupied |
| 1-Person Household | 16 (64.0%) | 9 (36.0%) |
| 2-Person Household | 118 (93.6%) | 8 (6.4%) |
| 3-Person Household | 15 (100.0%) | 0 (0.0%) |
| 4+ Person Household | 29 (61.7%) | 18 (38.3%) |
| Total Housing Units | 178 (83.6%) | 35 (16.4%) |
Occupancy by Educational Attainment in Summit
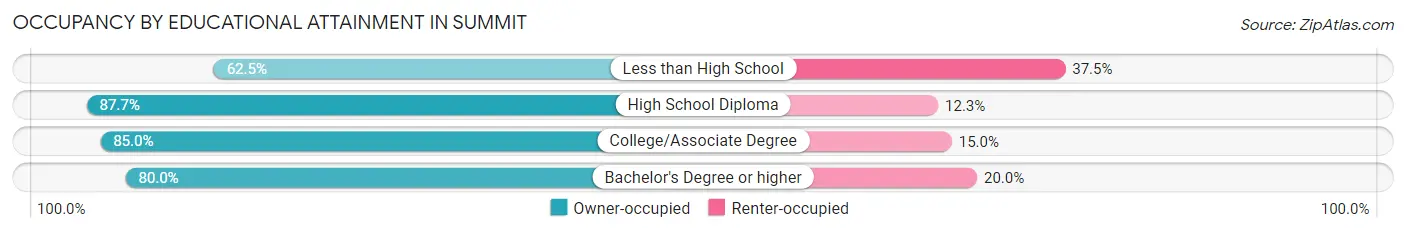
| Household Size | Owner-occupied | Renter-occupied |
| Less than High School | 10 (62.5%) | 6 (37.5%) |
| High School Diploma | 50 (87.7%) | 7 (12.3%) |
| College/Associate Degree | 102 (85.0%) | 18 (15.0%) |
| Bachelor's Degree or higher | 16 (80.0%) | 4 (20.0%) |
Occupancy by Age of Householder in Summit
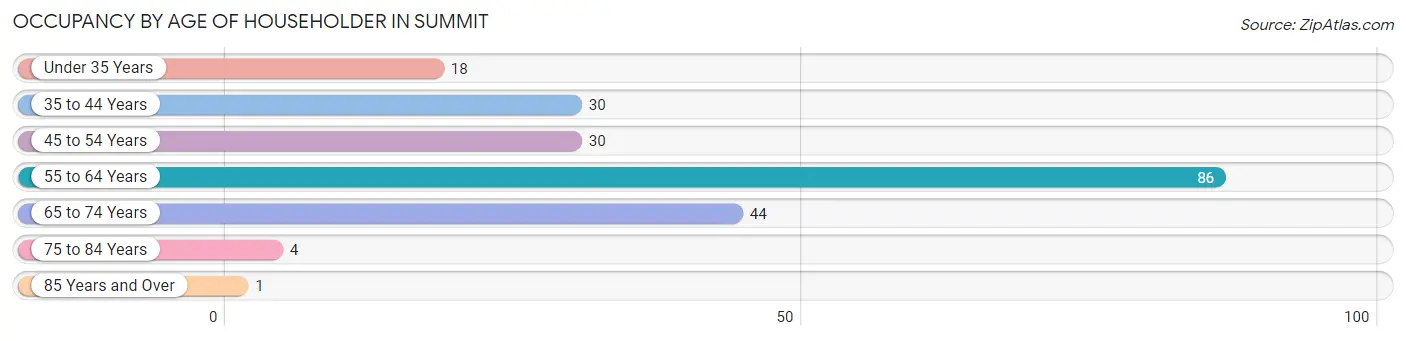
| Age Bracket | # Households | % Households |
| Under 35 Years | 18 | 8.5% |
| 35 to 44 Years | 30 | 14.1% |
| 45 to 54 Years | 30 | 14.1% |
| 55 to 64 Years | 86 | 40.4% |
| 65 to 74 Years | 44 | 20.7% |
| 75 to 84 Years | 4 | 1.9% |
| 85 Years and Over | 1 | 0.5% |
| Total | 213 | 100.0% |
Housing Finances in Summit
Median Income by Occupancy in Summit
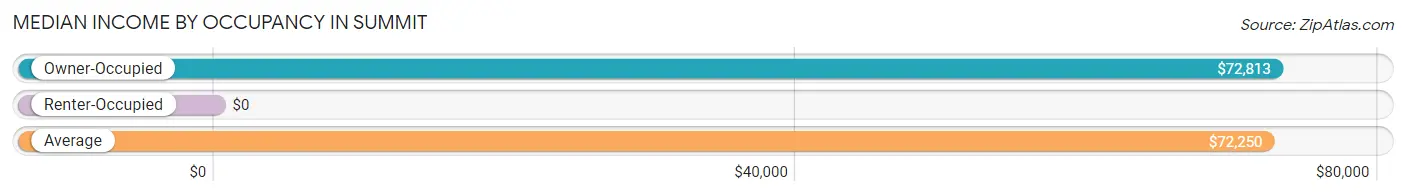
| Occupancy Type | # Households | Median Income |
| Owner-Occupied | 178 (83.6%) | $72,813 |
| Renter-Occupied | 35 (16.4%) | $0 |
| Average | 213 (100.0%) | $72,250 |
Occupancy by Householder Income Bracket in Summit
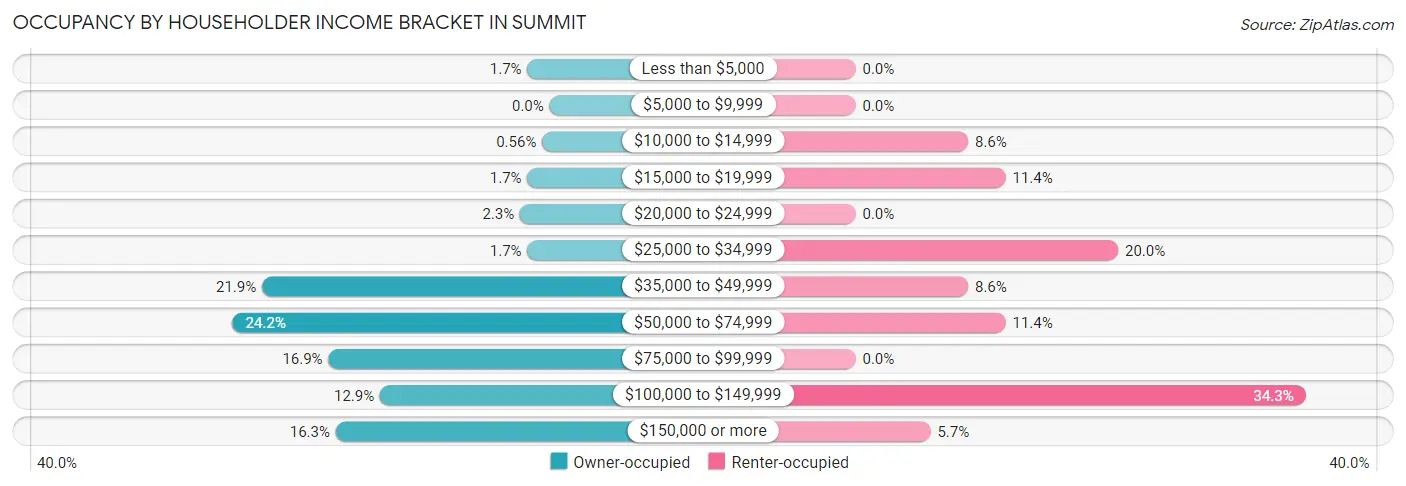
| Income Bracket | Owner-occupied | Renter-occupied |
| Less than $5,000 | 3 (1.7%) | 0 (0.0%) |
| $5,000 to $9,999 | 0 (0.0%) | 0 (0.0%) |
| $10,000 to $14,999 | 1 (0.6%) | 3 (8.6%) |
| $15,000 to $19,999 | 3 (1.7%) | 4 (11.4%) |
| $20,000 to $24,999 | 4 (2.2%) | 0 (0.0%) |
| $25,000 to $34,999 | 3 (1.7%) | 7 (20.0%) |
| $35,000 to $49,999 | 39 (21.9%) | 3 (8.6%) |
| $50,000 to $74,999 | 43 (24.2%) | 4 (11.4%) |
| $75,000 to $99,999 | 30 (16.9%) | 0 (0.0%) |
| $100,000 to $149,999 | 23 (12.9%) | 12 (34.3%) |
| $150,000 or more | 29 (16.3%) | 2 (5.7%) |
| Total | 178 (100.0%) | 35 (100.0%) |
Monthly Housing Cost Tiers in Summit
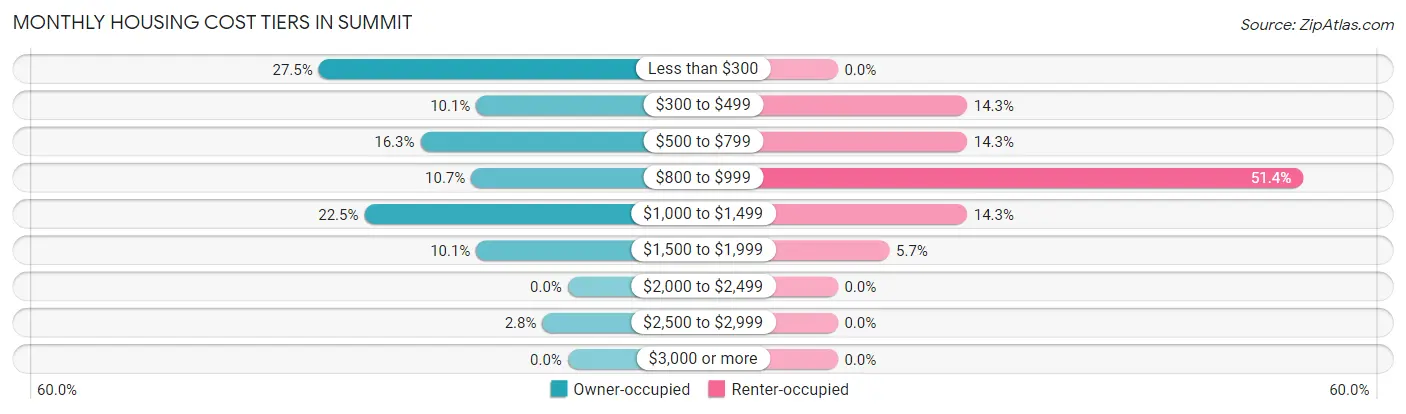
| Monthly Cost | Owner-occupied | Renter-occupied |
| Less than $300 | 49 (27.5%) | 0 (0.0%) |
| $300 to $499 | 18 (10.1%) | 5 (14.3%) |
| $500 to $799 | 29 (16.3%) | 5 (14.3%) |
| $800 to $999 | 19 (10.7%) | 18 (51.4%) |
| $1,000 to $1,499 | 40 (22.5%) | 5 (14.3%) |
| $1,500 to $1,999 | 18 (10.1%) | 2 (5.7%) |
| $2,000 to $2,499 | 0 (0.0%) | 0 (0.0%) |
| $2,500 to $2,999 | 5 (2.8%) | 0 (0.0%) |
| $3,000 or more | 0 (0.0%) | 0 (0.0%) |
| Total | 178 (100.0%) | 35 (100.0%) |
Physical Housing Characteristics in Summit
Housing Structures in Summit
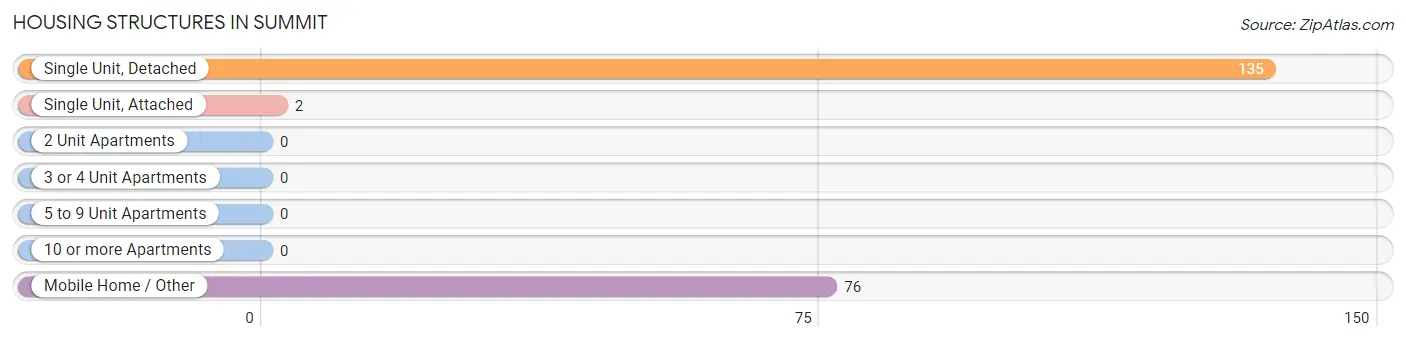
| Structure Type | # Housing Units | % Housing Units |
| Single Unit, Detached | 135 | 63.4% |
| Single Unit, Attached | 2 | 0.9% |
| 2 Unit Apartments | 0 | 0.0% |
| 3 or 4 Unit Apartments | 0 | 0.0% |
| 5 to 9 Unit Apartments | 0 | 0.0% |
| 10 or more Apartments | 0 | 0.0% |
| Mobile Home / Other | 76 | 35.7% |
| Total | 213 | 100.0% |
Housing Structures by Occupancy in Summit
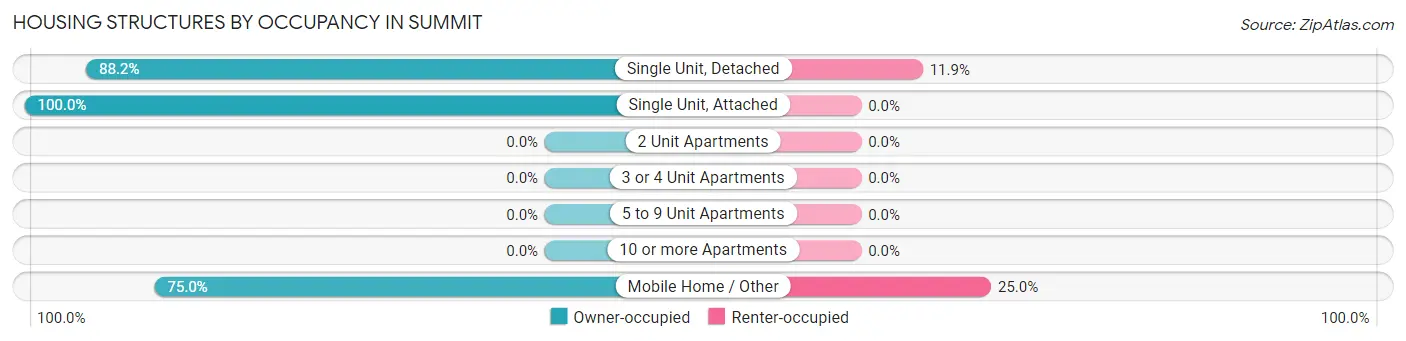
| Structure Type | Owner-occupied | Renter-occupied |
| Single Unit, Detached | 119 (88.1%) | 16 (11.8%) |
| Single Unit, Attached | 2 (100.0%) | 0 (0.0%) |
| 2 Unit Apartments | 0 (0.0%) | 0 (0.0%) |
| 3 or 4 Unit Apartments | 0 (0.0%) | 0 (0.0%) |
| 5 to 9 Unit Apartments | 0 (0.0%) | 0 (0.0%) |
| 10 or more Apartments | 0 (0.0%) | 0 (0.0%) |
| Mobile Home / Other | 57 (75.0%) | 19 (25.0%) |
| Total | 178 (83.6%) | 35 (16.4%) |
Housing Structures by Number of Rooms in Summit
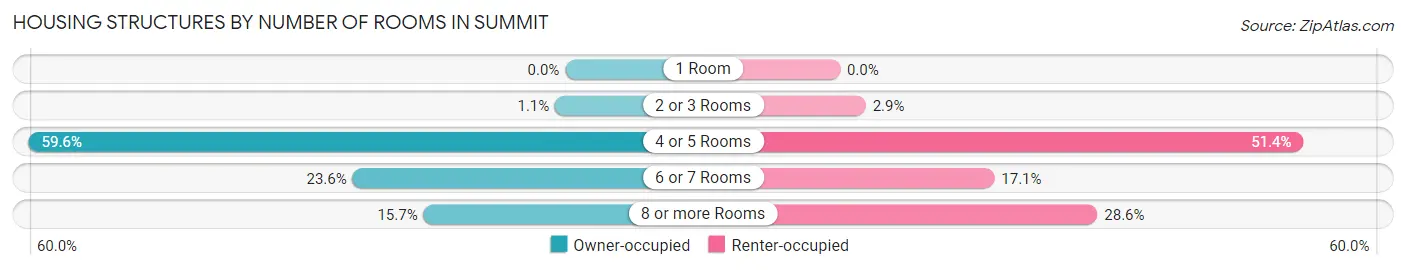
| Number of Rooms | Owner-occupied | Renter-occupied |
| 1 Room | 0 (0.0%) | 0 (0.0%) |
| 2 or 3 Rooms | 2 (1.1%) | 1 (2.9%) |
| 4 or 5 Rooms | 106 (59.6%) | 18 (51.4%) |
| 6 or 7 Rooms | 42 (23.6%) | 6 (17.1%) |
| 8 or more Rooms | 28 (15.7%) | 10 (28.6%) |
| Total | 178 (100.0%) | 35 (100.0%) |
Housing Structure by Heating Type in Summit
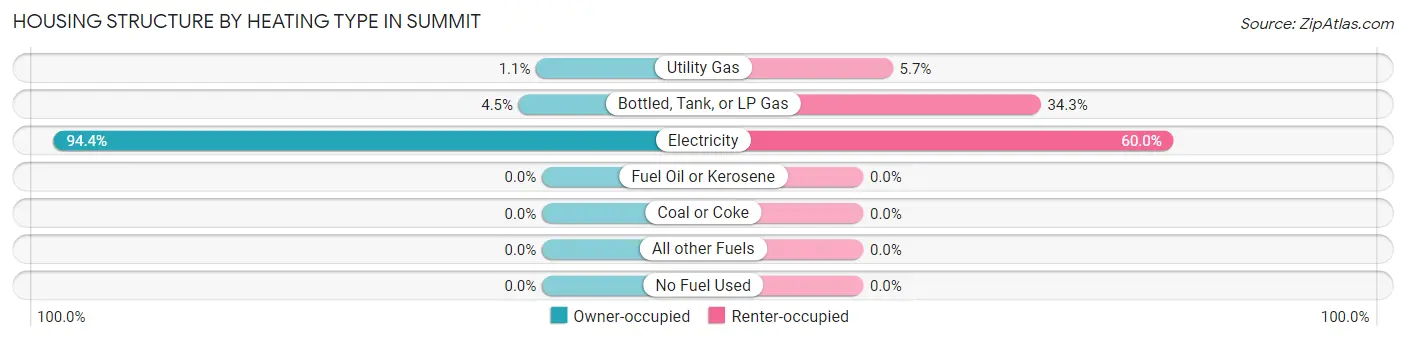
| Heating Type | Owner-occupied | Renter-occupied |
| Utility Gas | 2 (1.1%) | 2 (5.7%) |
| Bottled, Tank, or LP Gas | 8 (4.5%) | 12 (34.3%) |
| Electricity | 168 (94.4%) | 21 (60.0%) |
| Fuel Oil or Kerosene | 0 (0.0%) | 0 (0.0%) |
| Coal or Coke | 0 (0.0%) | 0 (0.0%) |
| All other Fuels | 0 (0.0%) | 0 (0.0%) |
| No Fuel Used | 0 (0.0%) | 0 (0.0%) |
| Total | 178 (100.0%) | 35 (100.0%) |
Household Vehicle Usage in Summit
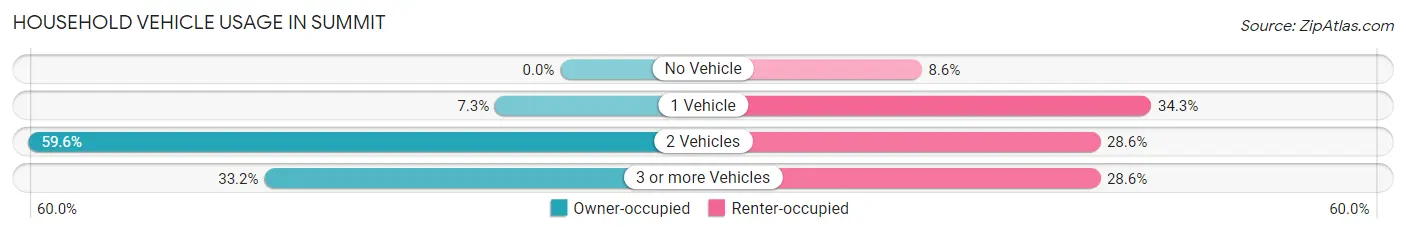
| Vehicles per Household | Owner-occupied | Renter-occupied |
| No Vehicle | 0 (0.0%) | 3 (8.6%) |
| 1 Vehicle | 13 (7.3%) | 12 (34.3%) |
| 2 Vehicles | 106 (59.6%) | 10 (28.6%) |
| 3 or more Vehicles | 59 (33.2%) | 10 (28.6%) |
| Total | 178 (100.0%) | 35 (100.0%) |
Real Estate & Mortgages in Summit
Real Estate and Mortgage Overview in Summit
| Characteristic | Without Mortgage | With Mortgage |
| Housing Units | 79 | 99 |
| Median Property Value | $214,400 | $149,300 |
| Median Household Income | - | - |
| Monthly Housing Costs | $245 | $0 |
| Real Estate Taxes | $362 | $5 |
Property Value by Mortgage Status in Summit
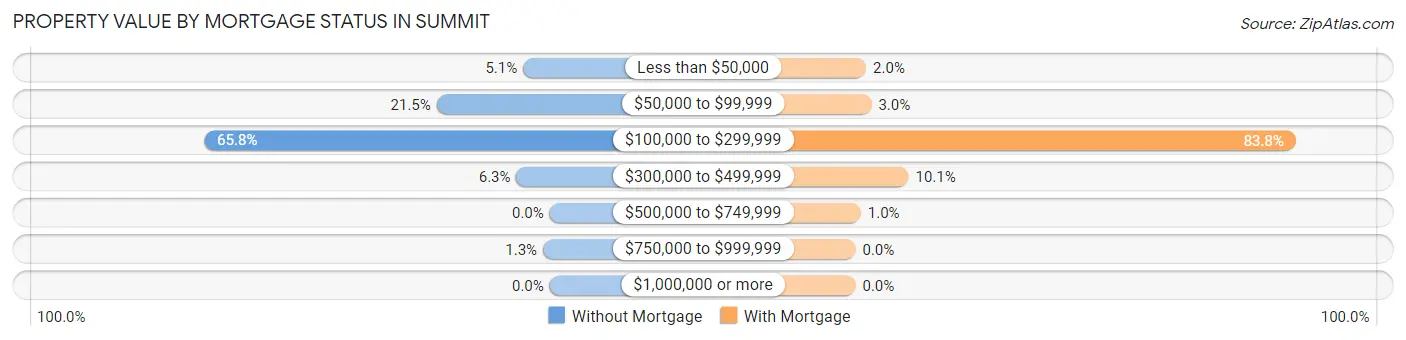
| Property Value | Without Mortgage | With Mortgage |
| Less than $50,000 | 4 (5.1%) | 2 (2.0%) |
| $50,000 to $99,999 | 17 (21.5%) | 3 (3.0%) |
| $100,000 to $299,999 | 52 (65.8%) | 83 (83.8%) |
| $300,000 to $499,999 | 5 (6.3%) | 10 (10.1%) |
| $500,000 to $749,999 | 0 (0.0%) | 1 (1.0%) |
| $750,000 to $999,999 | 1 (1.3%) | 0 (0.0%) |
| $1,000,000 or more | 0 (0.0%) | 0 (0.0%) |
| Total | 79 (100.0%) | 99 (100.0%) |
Household Income by Mortgage Status in Summit
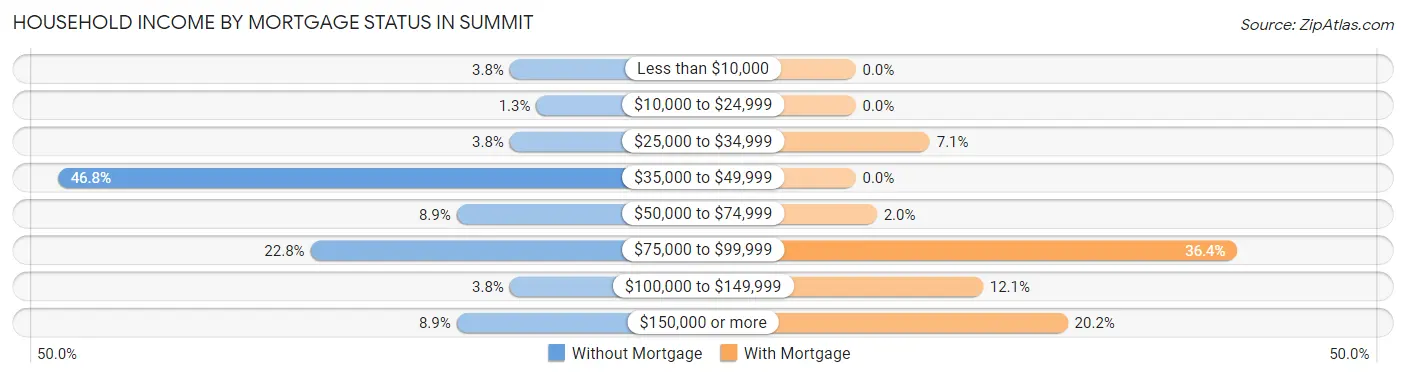
| Household Income | Without Mortgage | With Mortgage |
| Less than $10,000 | 3 (3.8%) | 0 (0.0%) |
| $10,000 to $24,999 | 1 (1.3%) | 0 (0.0%) |
| $25,000 to $34,999 | 3 (3.8%) | 7 (7.1%) |
| $35,000 to $49,999 | 37 (46.8%) | 0 (0.0%) |
| $50,000 to $74,999 | 7 (8.9%) | 2 (2.0%) |
| $75,000 to $99,999 | 18 (22.8%) | 36 (36.4%) |
| $100,000 to $149,999 | 3 (3.8%) | 12 (12.1%) |
| $150,000 or more | 7 (8.9%) | 20 (20.2%) |
| Total | 79 (100.0%) | 99 (100.0%) |
Property Value to Household Income Ratio in Summit
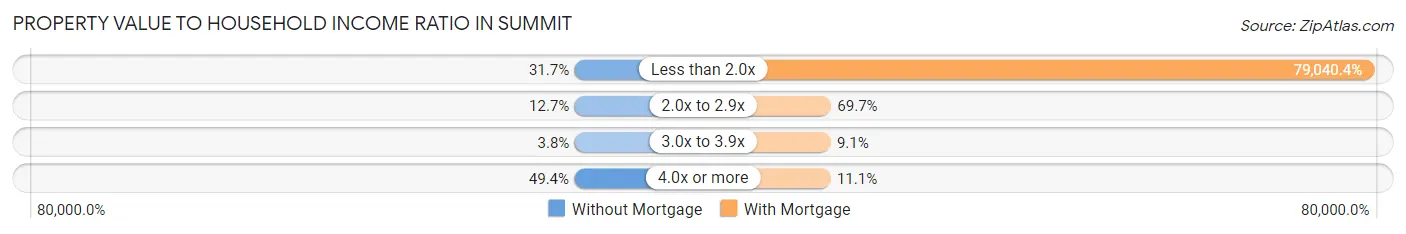
| Value-to-Income Ratio | Without Mortgage | With Mortgage |
| Less than 2.0x | 25 (31.7%) | 78,250 (79,040.4%) |
| 2.0x to 2.9x | 10 (12.7%) | 69 (69.7%) |
| 3.0x to 3.9x | 3 (3.8%) | 9 (9.1%) |
| 4.0x or more | 39 (49.4%) | 11 (11.1%) |
| Total | 79 (100.0%) | 99 (100.0%) |
Real Estate Taxes by Mortgage Status in Summit
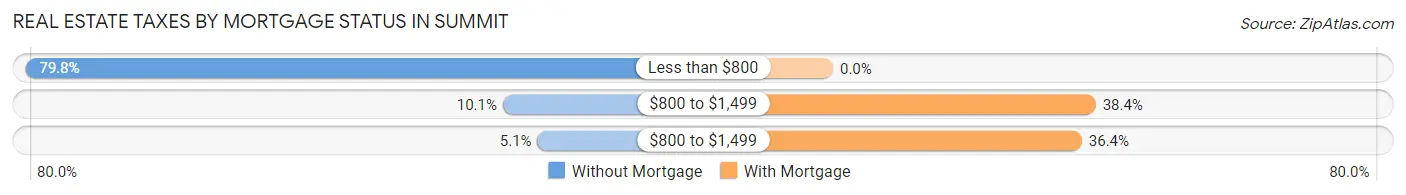
| Property Taxes | Without Mortgage | With Mortgage |
| Less than $800 | 63 (79.7%) | 0 (0.0%) |
| $800 to $1,499 | 8 (10.1%) | 38 (38.4%) |
| $800 to $1,499 | 4 (5.1%) | 36 (36.4%) |
| Total | 79 (100.0%) | 99 (100.0%) |
Health & Disability in Summit
Health Insurance Coverage by Age in Summit
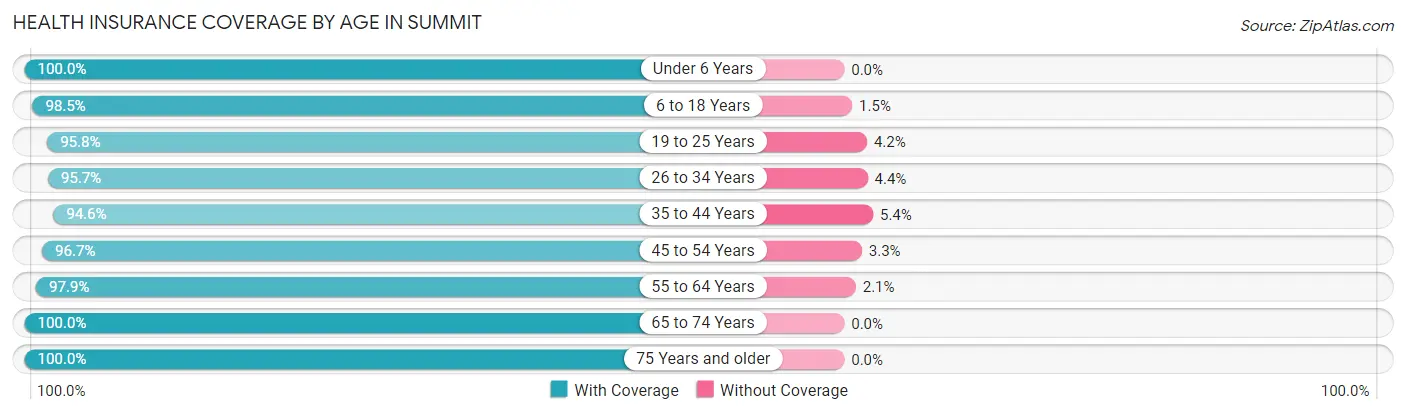
| Age Bracket | With Coverage | Without Coverage |
| Under 6 Years | 14 (100.0%) | 0 (0.0%) |
| 6 to 18 Years | 67 (98.5%) | 1 (1.5%) |
| 19 to 25 Years | 68 (95.8%) | 3 (4.2%) |
| 26 to 34 Years | 22 (95.7%) | 1 (4.3%) |
| 35 to 44 Years | 53 (94.6%) | 3 (5.4%) |
| 45 to 54 Years | 59 (96.7%) | 2 (3.3%) |
| 55 to 64 Years | 137 (97.9%) | 3 (2.1%) |
| 65 to 74 Years | 72 (100.0%) | 0 (0.0%) |
| 75 Years and older | 34 (100.0%) | 0 (0.0%) |
| Total | 526 (97.6%) | 13 (2.4%) |
Health Insurance Coverage by Citizenship Status in Summit
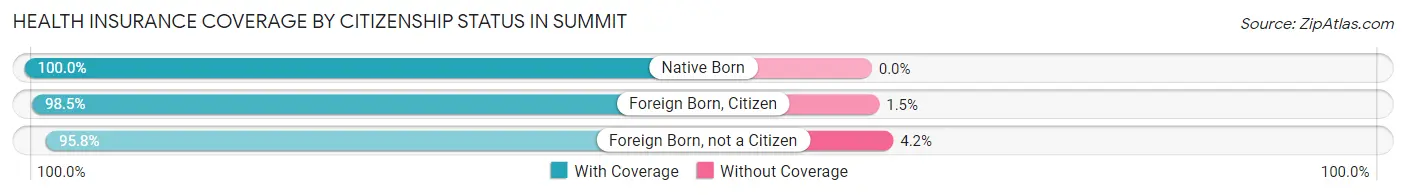
| Citizenship Status | With Coverage | Without Coverage |
| Native Born | 14 (100.0%) | 0 (0.0%) |
| Foreign Born, Citizen | 67 (98.5%) | 1 (1.5%) |
| Foreign Born, not a Citizen | 68 (95.8%) | 3 (4.2%) |
Health Insurance Coverage by Household Income in Summit
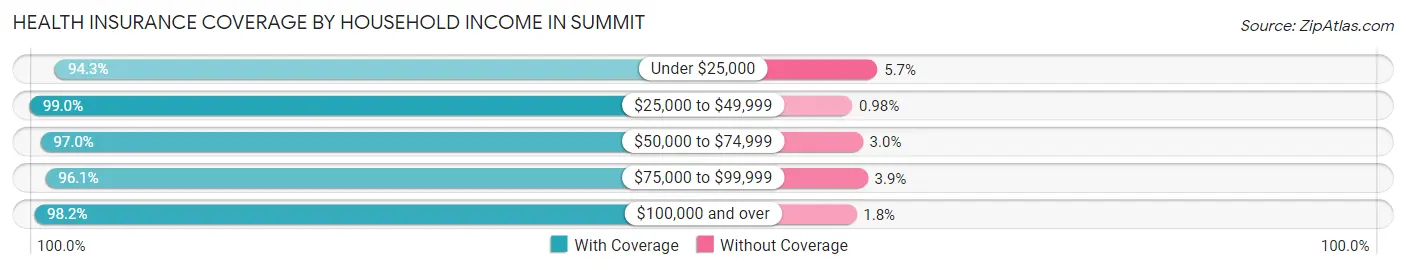
| Household Income | With Coverage | Without Coverage |
| Under $25,000 | 33 (94.3%) | 2 (5.7%) |
| $25,000 to $49,999 | 101 (99.0%) | 1 (1.0%) |
| $50,000 to $74,999 | 98 (97.0%) | 3 (3.0%) |
| $75,000 to $99,999 | 74 (96.1%) | 3 (3.9%) |
| $100,000 and over | 220 (98.2%) | 4 (1.8%) |
Public vs Private Health Insurance Coverage by Age in Summit
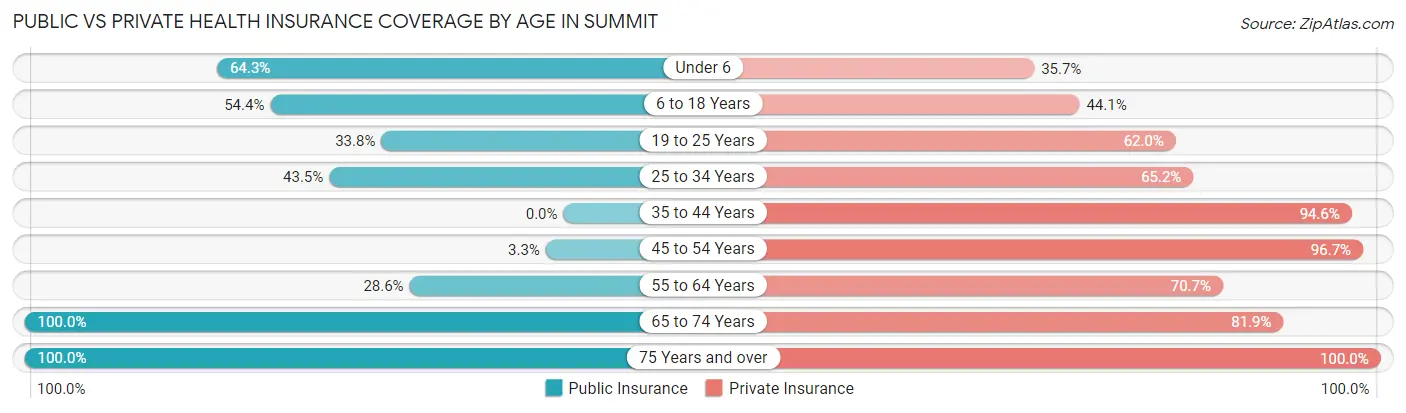
| Age Bracket | Public Insurance | Private Insurance |
| Under 6 | 9 (64.3%) | 5 (35.7%) |
| 6 to 18 Years | 37 (54.4%) | 30 (44.1%) |
| 19 to 25 Years | 24 (33.8%) | 44 (62.0%) |
| 25 to 34 Years | 10 (43.5%) | 15 (65.2%) |
| 35 to 44 Years | 0 (0.0%) | 53 (94.6%) |
| 45 to 54 Years | 2 (3.3%) | 59 (96.7%) |
| 55 to 64 Years | 40 (28.6%) | 99 (70.7%) |
| 65 to 74 Years | 72 (100.0%) | 59 (81.9%) |
| 75 Years and over | 34 (100.0%) | 34 (100.0%) |
| Total | 228 (42.3%) | 398 (73.8%) |
Disability Status by Sex by Age in Summit
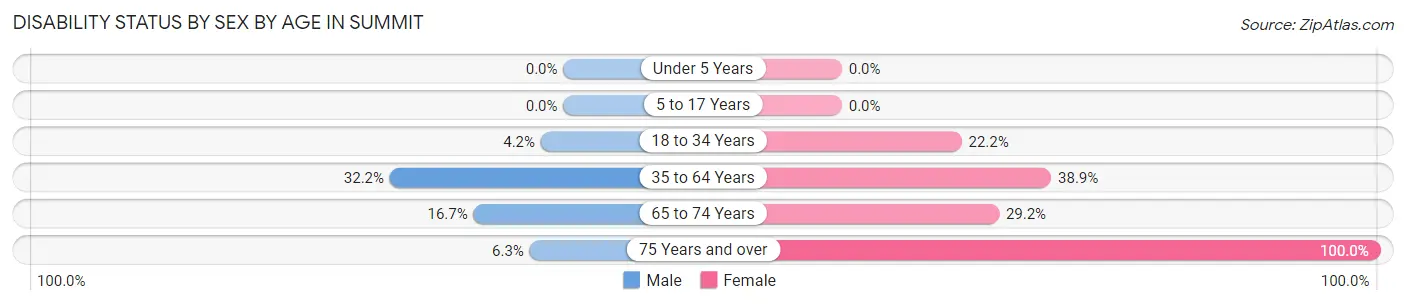
| Age Bracket | Male | Female |
| Under 5 Years | 0 (0.0%) | 0 (0.0%) |
| 5 to 17 Years | 0 (0.0%) | 0 (0.0%) |
| 18 to 34 Years | 2 (4.2%) | 12 (22.2%) |
| 35 to 64 Years | 38 (32.2%) | 54 (38.9%) |
| 65 to 74 Years | 4 (16.7%) | 14 (29.2%) |
| 75 Years and over | 2 (6.2%) | 2 (100.0%) |
Disability Class by Sex by Age in Summit
Disability Class: Hearing Difficulty
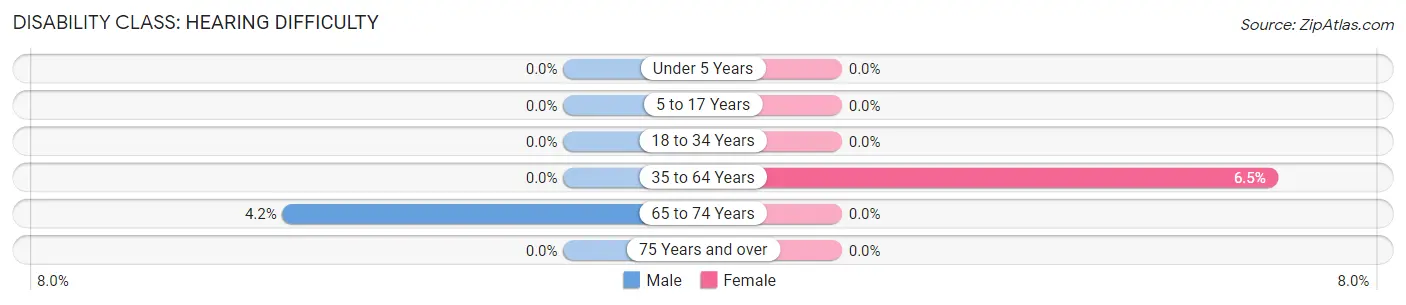
| Age Bracket | Male | Female |
| Under 5 Years | 0 (0.0%) | 0 (0.0%) |
| 5 to 17 Years | 0 (0.0%) | 0 (0.0%) |
| 18 to 34 Years | 0 (0.0%) | 0 (0.0%) |
| 35 to 64 Years | 0 (0.0%) | 9 (6.5%) |
| 65 to 74 Years | 1 (4.2%) | 0 (0.0%) |
| 75 Years and over | 0 (0.0%) | 0 (0.0%) |
Disability Class: Vision Difficulty
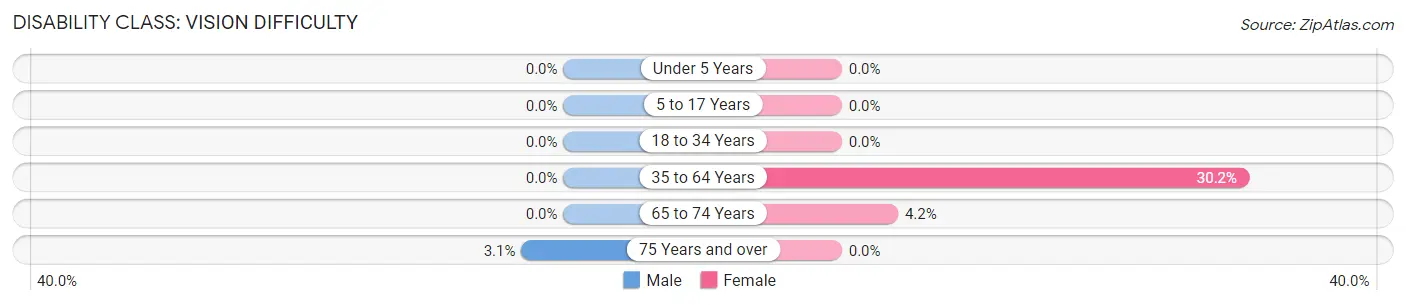
| Age Bracket | Male | Female |
| Under 5 Years | 0 (0.0%) | 0 (0.0%) |
| 5 to 17 Years | 0 (0.0%) | 0 (0.0%) |
| 18 to 34 Years | 0 (0.0%) | 0 (0.0%) |
| 35 to 64 Years | 0 (0.0%) | 42 (30.2%) |
| 65 to 74 Years | 0 (0.0%) | 2 (4.2%) |
| 75 Years and over | 1 (3.1%) | 0 (0.0%) |
Disability Class: Cognitive Difficulty
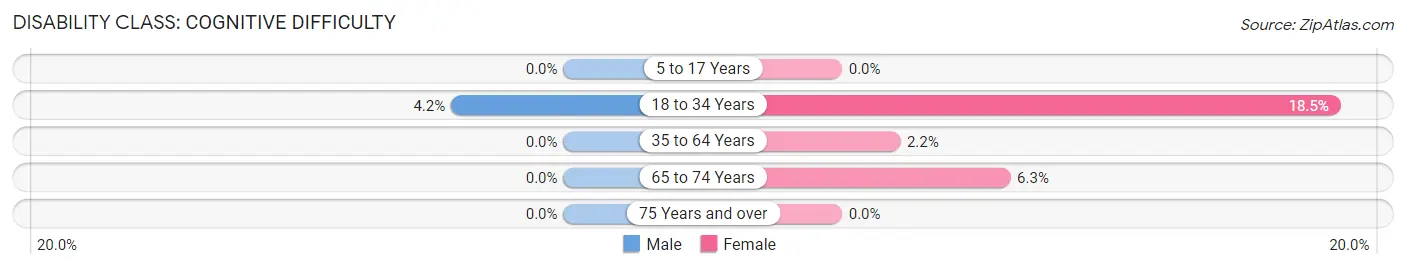
| Age Bracket | Male | Female |
| 5 to 17 Years | 0 (0.0%) | 0 (0.0%) |
| 18 to 34 Years | 2 (4.2%) | 10 (18.5%) |
| 35 to 64 Years | 0 (0.0%) | 3 (2.2%) |
| 65 to 74 Years | 0 (0.0%) | 3 (6.2%) |
| 75 Years and over | 0 (0.0%) | 0 (0.0%) |
Disability Class: Ambulatory Difficulty
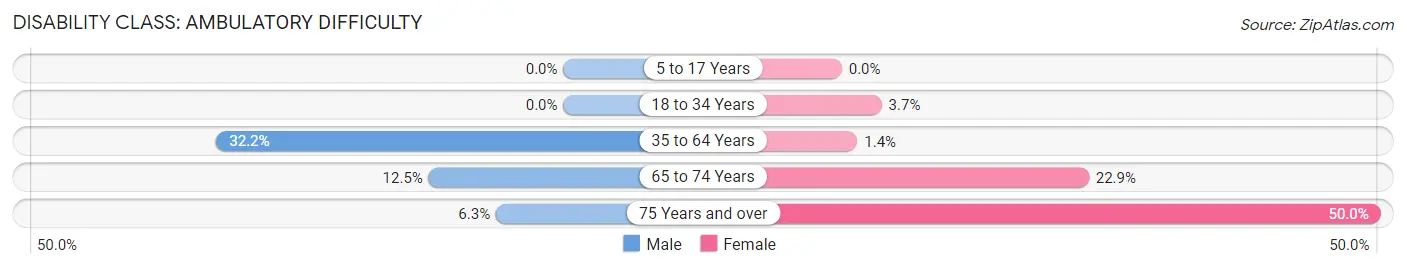
| Age Bracket | Male | Female |
| 5 to 17 Years | 0 (0.0%) | 0 (0.0%) |
| 18 to 34 Years | 0 (0.0%) | 2 (3.7%) |
| 35 to 64 Years | 38 (32.2%) | 2 (1.4%) |
| 65 to 74 Years | 3 (12.5%) | 11 (22.9%) |
| 75 Years and over | 2 (6.2%) | 1 (50.0%) |
Disability Class: Self-Care Difficulty
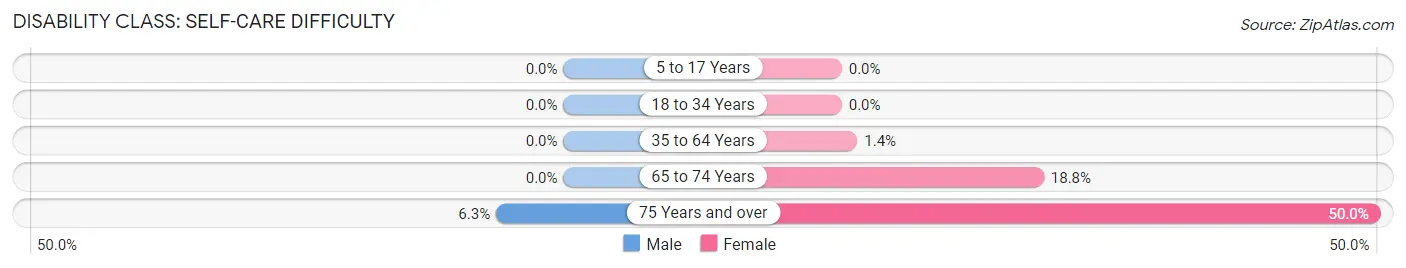
| Age Bracket | Male | Female |
| 5 to 17 Years | 0 (0.0%) | 0 (0.0%) |
| 18 to 34 Years | 0 (0.0%) | 0 (0.0%) |
| 35 to 64 Years | 0 (0.0%) | 2 (1.4%) |
| 65 to 74 Years | 0 (0.0%) | 9 (18.8%) |
| 75 Years and over | 2 (6.2%) | 1 (50.0%) |
Technology Access in Summit
Computing Device Access in Summit
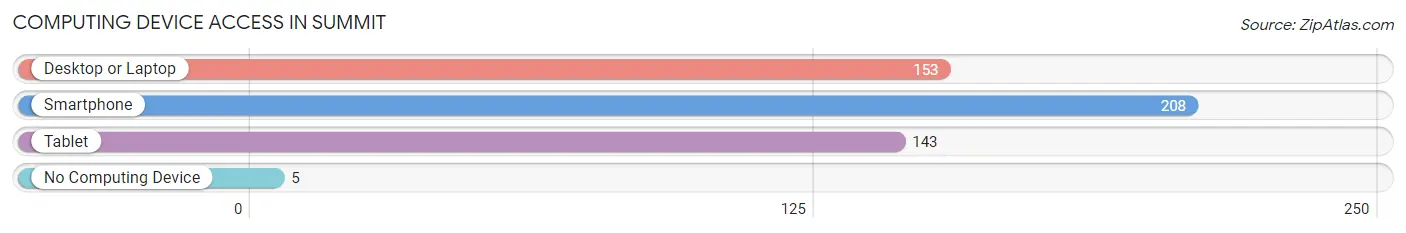
| Device Type | # Households | % Households |
| Desktop or Laptop | 153 | 71.8% |
| Smartphone | 208 | 97.7% |
| Tablet | 143 | 67.1% |
| No Computing Device | 5 | 2.4% |
| Total | 213 | 100.0% |
Internet Access in Summit
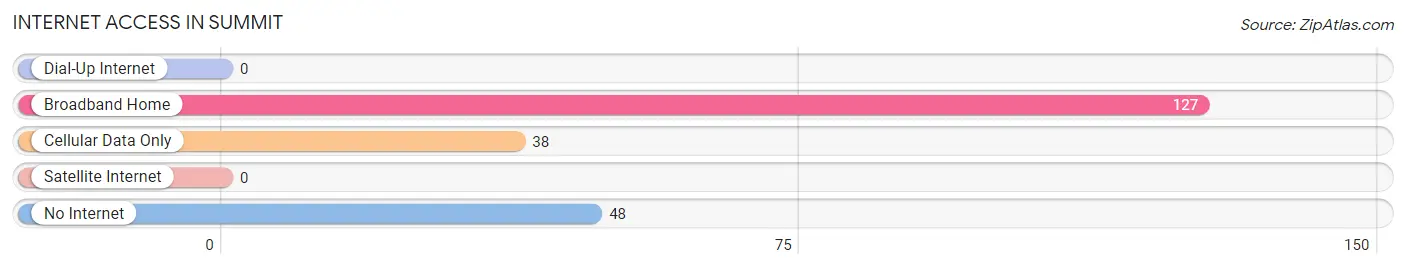
| Internet Type | # Households | % Households |
| Dial-Up Internet | 0 | 0.0% |
| Broadband Home | 127 | 59.6% |
| Cellular Data Only | 38 | 17.8% |
| Satellite Internet | 0 | 0.0% |
| No Internet | 48 | 22.5% |
| Total | 213 | 100.0% |
Summit Summary
Summit is a small town located in the northwestern corner of South Carolina, in Oconee County. It is situated on the banks of the Chattooga River, near the border of Georgia and North Carolina. The town was founded in 1820 and has a population of approximately 1,000 people.
History
The town of Summit was founded in 1820 by a group of settlers from North Carolina. The settlers were looking for a place to settle and start a new life. They chose the area because of its proximity to the Chattooga River, which provided a source of water and transportation. The town was originally called “Summitville”, but the name was changed to “Summit” in 1822.
The town grew slowly over the years, but it was not until the late 19th century that it began to experience significant growth. This was due to the construction of the Blue Ridge Railroad, which connected the town to the larger cities of the region. The railroad also brought new businesses and industries to the area, which helped to spur economic growth.
Geography
Summit is located in the northwestern corner of South Carolina, in Oconee County. It is situated on the banks of the Chattooga River, near the border of Georgia and North Carolina. The town is surrounded by the Blue Ridge Mountains, which provide a beautiful backdrop for the town. The town is also located close to several lakes, including Lake Jocassee and Lake Keowee.
The town has a total area of 1.2 square miles, all of which is land. The town is located at an elevation of 1,400 feet above sea level. The climate in Summit is mild, with temperatures ranging from the mid-50s in the winter to the mid-80s in the summer.
Economy
The economy of Summit is largely based on tourism and agriculture. The town is home to several tourist attractions, including the Chattooga River, which is popular for whitewater rafting and kayaking. The town also has several wineries and vineyards, which attract visitors from all over the region.
Agriculture is also an important part of the local economy. The town is home to several farms, which produce a variety of crops, including corn, soybeans, and wheat. The town also has several nurseries, which produce a variety of plants and flowers.
Demographics
As of the 2010 census, the population of Summit was 1,000 people. The racial makeup of the town was 97.2% White, 0.7% African American, 0.3% Native American, 0.3% Asian, and 1.5% from other races. The median household income was $37,500, and the median family income was $45,000.
The town is served by the Oconee County School District, which includes two elementary schools, one middle school, and one high school. The town also has several churches, including the Summit Baptist Church, the Summit Presbyterian Church, and the Summit United Methodist Church.
Summit is a small town with a rich history and a vibrant economy. It is a great place to live, work, and raise a family. The town is surrounded by beautiful scenery and offers a variety of activities for residents and visitors alike.
Common Questions
What is Per Capita Income in Summit?
Per Capita income in Summit is $34,258.
What is the Median Family Income in Summit?
Median Family Income in Summit is $76,250.
What is the Median Household income in Summit?
Median Household Income in Summit is $72,250.
What is Income or Wage Gap in Summit?
Income or Wage Gap in Summit is 24.5%.
Women in Summit earn 75.5 cents for every dollar earned by a man.
What is Inequality or Gini Index in Summit?
Inequality or Gini Index in Summit is 0.37.
What is the Total Population of Summit?
Total Population of Summit is 539.
What is the Total Male Population of Summit?
Total Male Population of Summit is 262.
What is the Total Female Population of Summit?
Total Female Population of Summit is 277.
What is the Ratio of Males per 100 Females in Summit?
There are 94.58 Males per 100 Females in Summit.
What is the Ratio of Females per 100 Males in Summit?
There are 105.73 Females per 100 Males in Summit.
What is the Median Population Age in Summit?
Median Population Age in Summit is 50.0 Years.
What is the Average Family Size in Summit
Average Family Size in Summit is 2.7 People.
What is the Average Household Size in Summit
Average Household Size in Summit is 2.5 People.
How Large is the Labor Force in Summit?
There are 315 People in the Labor Forcein in Summit.
What is the Percentage of People in the Labor Force in Summit?
64.7% of People are in the Labor Force in Summit.
What is the Unemployment Rate in Summit?
Unemployment Rate in Summit is 1.6%.