Clover, SC Map & Demographics
Clover Map
Clover Overview
$30,932
PER CAPITA INCOME
$77,771
AVG FAMILY INCOME
$63,649
AVG HOUSEHOLD INCOME
3.7%
WAGE / INCOME GAP [ % ]
96.3¢/ $1
WAGE / INCOME GAP [ $ ]
0.44
INEQUALITY / GINI INDEX
6,800
TOTAL POPULATION
3,507
MALE POPULATION
3,293
FEMALE POPULATION
106.50
MALES / 100 FEMALES
93.90
FEMALES / 100 MALES
36.5
MEDIAN AGE
3.0
AVG FAMILY SIZE
2.5
AVG HOUSEHOLD SIZE
3,318
LABOR FORCE [ PEOPLE ]
65.5%
PERCENT IN LABOR FORCE
8.9%
UNEMPLOYMENT RATE
Clover Zip Codes
Clover Area Codes
Income in Clover
Income Overview in Clover
Per Capita Income in Clover is $30,932, while median incomes of families and households are $77,771 and $63,649 respectively.
| Characteristic | Number | Measure |
| Per Capita Income | 6,800 | $30,932 |
| Median Family Income | 1,917 | $77,771 |
| Mean Family Income | 1,917 | $92,809 |
| Median Household Income | 2,656 | $63,649 |
| Mean Household Income | 2,656 | $79,785 |
| Income Deficit | 1,917 | $0 |
| Wage / Income Gap (%) | 6,800 | 3.72% |
| Wage / Income Gap ($) | 6,800 | 96.28¢ per $1 |
| Gini / Inequality Index | 6,800 | 0.44 |
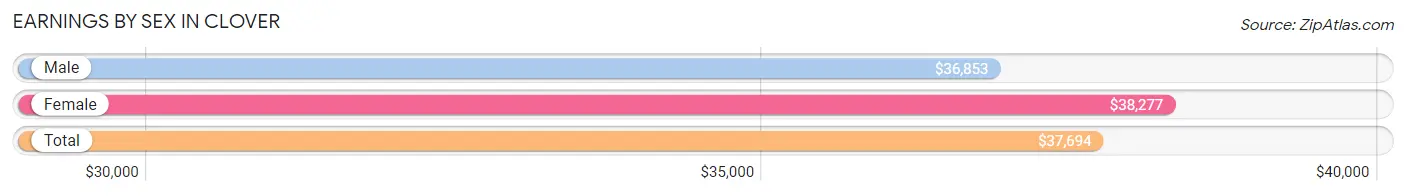
Earnings by Sex in Clover
Average Earnings in Clover are $37,694, $36,853 for men and $38,277 for women, a difference of 3.7%.
| Sex | Number | Average Earnings |
| Male | 1,868 (53.0%) | $36,853 |
| Female | 1,656 (47.0%) | $38,277 |
| Total | 3,524 (100.0%) | $37,694 |
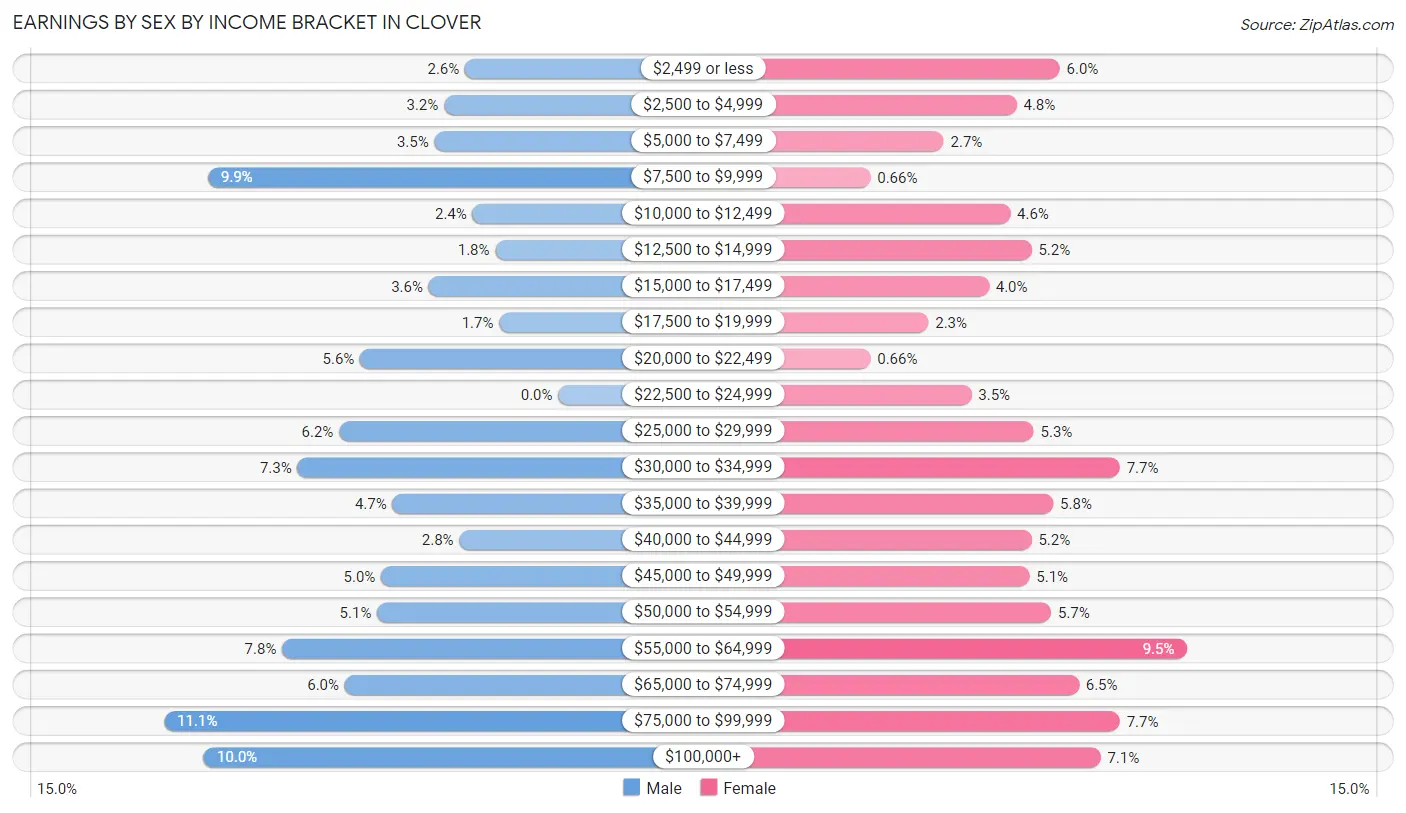
Earnings by Sex by Income Bracket in Clover
The most common earnings brackets in Clover are $75,000 to $99,999 for men (207 | 11.1%) and $55,000 to $64,999 for women (158 | 9.5%).
| Income | Male | Female |
| $2,499 or less | 49 (2.6%) | 99 (6.0%) |
| $2,500 to $4,999 | 60 (3.2%) | 79 (4.8%) |
| $5,000 to $7,499 | 65 (3.5%) | 45 (2.7%) |
| $7,500 to $9,999 | 184 (9.9%) | 11 (0.7%) |
| $10,000 to $12,499 | 45 (2.4%) | 76 (4.6%) |
| $12,500 to $14,999 | 33 (1.8%) | 86 (5.2%) |
| $15,000 to $17,499 | 68 (3.6%) | 66 (4.0%) |
| $17,500 to $19,999 | 31 (1.7%) | 38 (2.3%) |
| $20,000 to $22,499 | 104 (5.6%) | 11 (0.7%) |
| $22,500 to $24,999 | 0 (0.0%) | 58 (3.5%) |
| $25,000 to $29,999 | 115 (6.2%) | 87 (5.2%) |
| $30,000 to $34,999 | 137 (7.3%) | 127 (7.7%) |
| $35,000 to $39,999 | 87 (4.7%) | 96 (5.8%) |
| $40,000 to $44,999 | 52 (2.8%) | 86 (5.2%) |
| $45,000 to $49,999 | 93 (5.0%) | 85 (5.1%) |
| $50,000 to $54,999 | 95 (5.1%) | 95 (5.7%) |
| $55,000 to $64,999 | 145 (7.8%) | 158 (9.5%) |
| $65,000 to $74,999 | 112 (6.0%) | 108 (6.5%) |
| $75,000 to $99,999 | 207 (11.1%) | 127 (7.7%) |
| $100,000+ | 186 (10.0%) | 118 (7.1%) |
| Total | 1,868 (100.0%) | 1,656 (100.0%) |
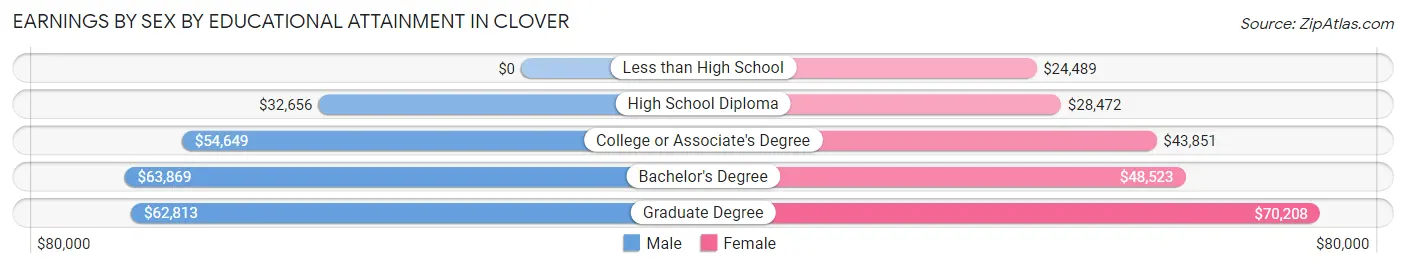
Earnings by Sex by Educational Attainment in Clover
Average earnings in Clover are $45,979 for men and $42,500 for women, a difference of 7.6%. Men with an educational attainment of bachelor's degree enjoy the highest average annual earnings of $63,869, while those with high school diploma education earn the least with $32,656. Women with an educational attainment of graduate degree earn the most with the average annual earnings of $70,208, while those with less than high school education have the smallest earnings of $24,489.
| Educational Attainment | Male Income | Female Income |
| Less than High School | - | - |
| High School Diploma | $32,656 | $28,472 |
| College or Associate's Degree | $54,649 | $43,851 |
| Bachelor's Degree | $63,869 | $48,523 |
| Graduate Degree | $62,813 | $70,208 |
| Total | $45,979 | $42,500 |
Family Income in Clover
Family Income Brackets in Clover
According to the Clover family income data, there are 468 families falling into the $100,000 to $149,999 income range, which is the most common income bracket and makes up 24.4% of all families. Conversely, the $10,000 to $14,999 income bracket is the least frequent group with only 33 families (1.7%) belonging to this category.
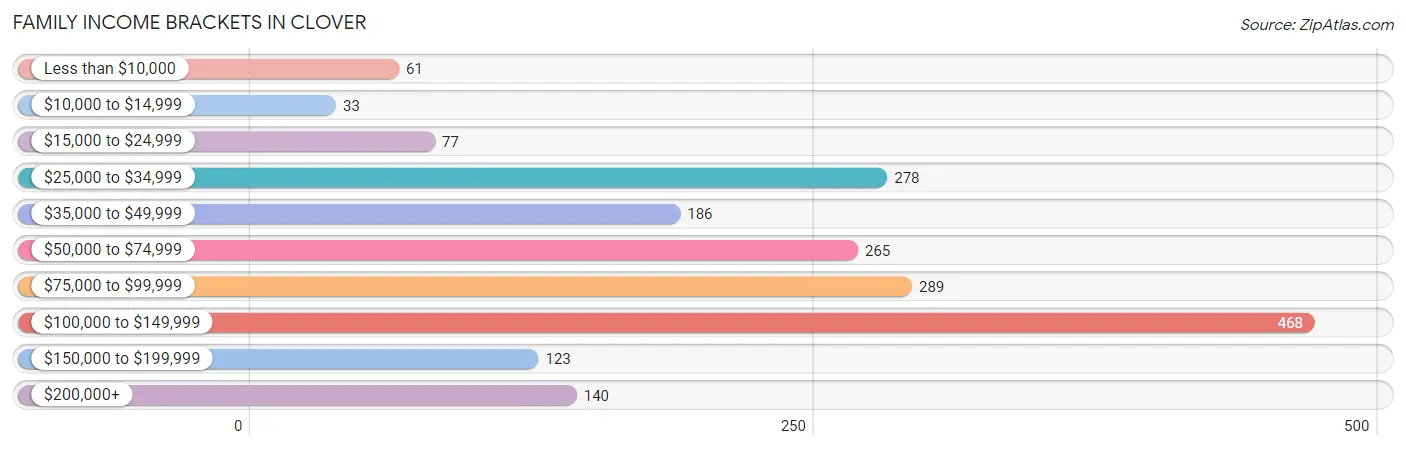
| Income Bracket | # Families | % Families |
| Less than $10,000 | 61 | 3.2% |
| $10,000 to $14,999 | 33 | 1.7% |
| $15,000 to $24,999 | 77 | 4.0% |
| $25,000 to $34,999 | 278 | 14.5% |
| $35,000 to $49,999 | 186 | 9.7% |
| $50,000 to $74,999 | 265 | 13.8% |
| $75,000 to $99,999 | 289 | 15.1% |
| $100,000 to $149,999 | 468 | 24.4% |
| $150,000 to $199,999 | 123 | 6.4% |
| $200,000+ | 140 | 7.3% |
Family Income by Famaliy Size in Clover
4-person families (544 | 28.4%) account for the highest median family income in Clover with $106,182 per family, while 3-person families (424 | 22.1%) have the highest median income of $28,306 per family member.
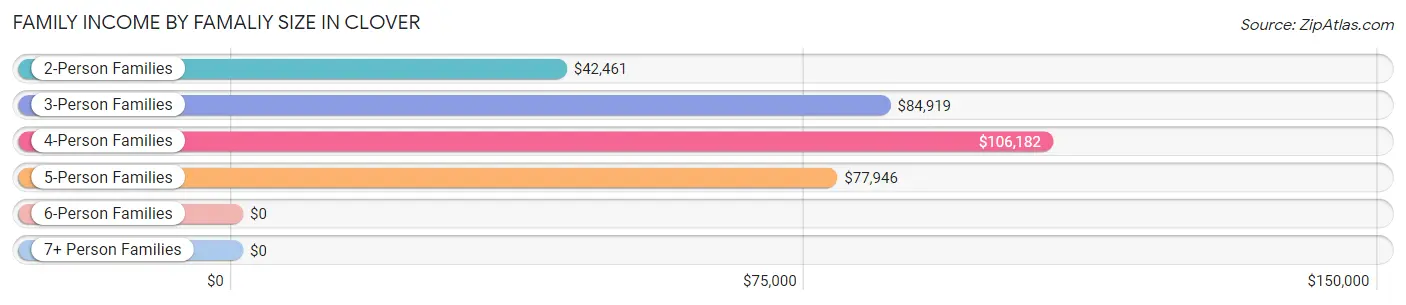
| Income Bracket | # Families | Median Income |
| 2-Person Families | 821 (42.8%) | $42,461 |
| 3-Person Families | 424 (22.1%) | $84,919 |
| 4-Person Families | 544 (28.4%) | $106,182 |
| 5-Person Families | 104 (5.4%) | $77,946 |
| 6-Person Families | 24 (1.3%) | $0 |
| 7+ Person Families | 0 (0.0%) | $0 |
| Total | 1,917 (100.0%) | $77,771 |
Family Income by Number of Earners in Clover
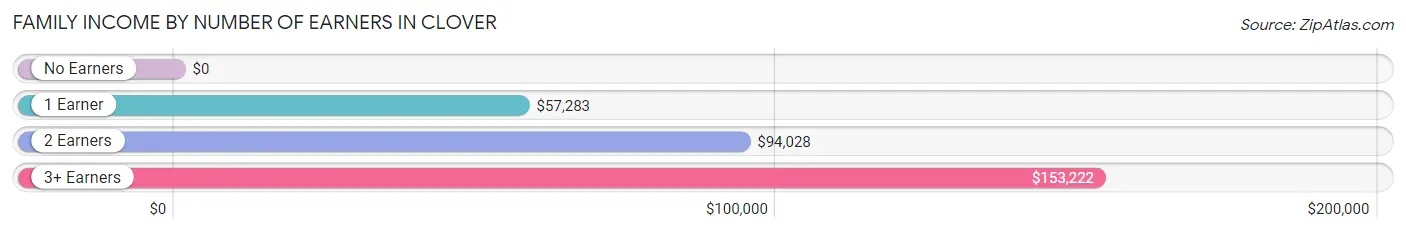
| Number of Earners | # Families | Median Income |
| No Earners | 190 (9.9%) | $0 |
| 1 Earner | 578 (30.1%) | $57,283 |
| 2 Earners | 991 (51.7%) | $94,028 |
| 3+ Earners | 158 (8.2%) | $153,222 |
| Total | 1,917 (100.0%) | $77,771 |
Household Income in Clover
Household Income Brackets in Clover
With 534 households falling in the category, the $100,000 to $149,999 income range is the most frequent in Clover, accounting for 20.1% of all households. In contrast, only 114 households (4.3%) fall into the $10,000 to $14,999 income bracket, making it the least populous group.
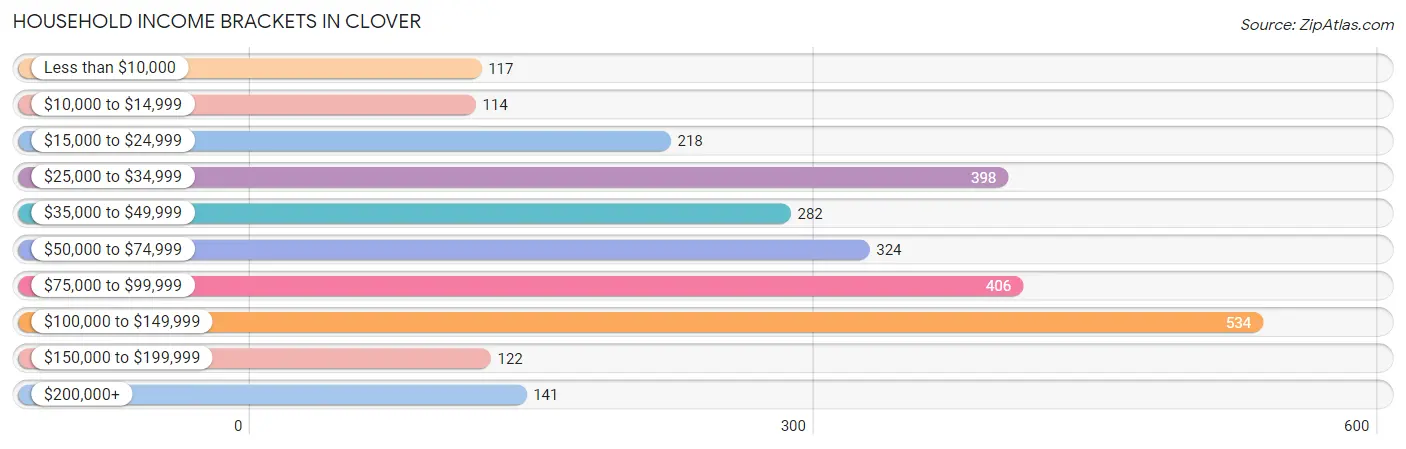
| Income Bracket | # Households | % Households |
| Less than $10,000 | 117 | 4.4% |
| $10,000 to $14,999 | 114 | 4.3% |
| $15,000 to $24,999 | 218 | 8.2% |
| $25,000 to $34,999 | 398 | 15.0% |
| $35,000 to $49,999 | 282 | 10.6% |
| $50,000 to $74,999 | 324 | 12.2% |
| $75,000 to $99,999 | 406 | 15.3% |
| $100,000 to $149,999 | 534 | 20.1% |
| $150,000 to $199,999 | 122 | 4.6% |
| $200,000+ | 141 | 5.3% |
Household Income by Householder Age in Clover
The median household income in Clover is $63,649, with the highest median household income of $84,813 found in the 25 to 44 years age bracket for the primary householder. A total of 1,084 households (40.8%) fall into this category. Meanwhile, the 15 to 24 years age bracket for the primary householder has the lowest median household income of $0, with 14 households (0.5%) in this group.
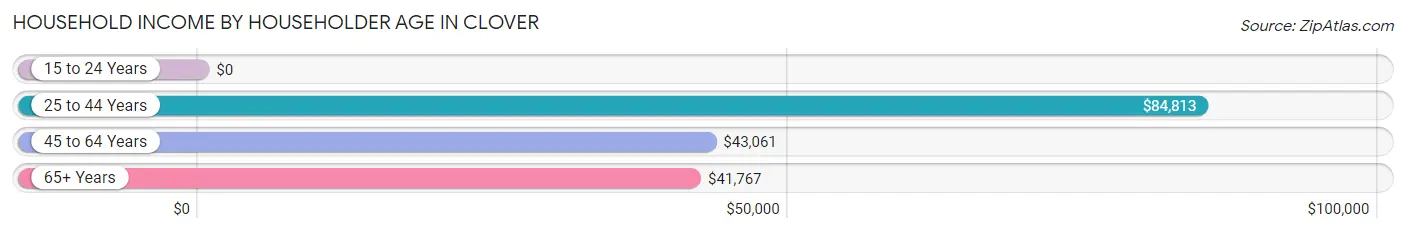
| Income Bracket | # Households | Median Income |
| 15 to 24 Years | 14 (0.5%) | $0 |
| 25 to 44 Years | 1,084 (40.8%) | $84,813 |
| 45 to 64 Years | 976 (36.7%) | $43,061 |
| 65+ Years | 582 (21.9%) | $41,767 |
| Total | 2,656 (100.0%) | $63,649 |
Poverty in Clover
Income Below Poverty by Sex and Age in Clover
With 10.4% poverty level for males and 13.7% for females among the residents of Clover, 5 year old males and 5 year old females are the most vulnerable to poverty, with 42 males (53.2%) and 29 females (100.0%) in their respective age groups living below the poverty level.
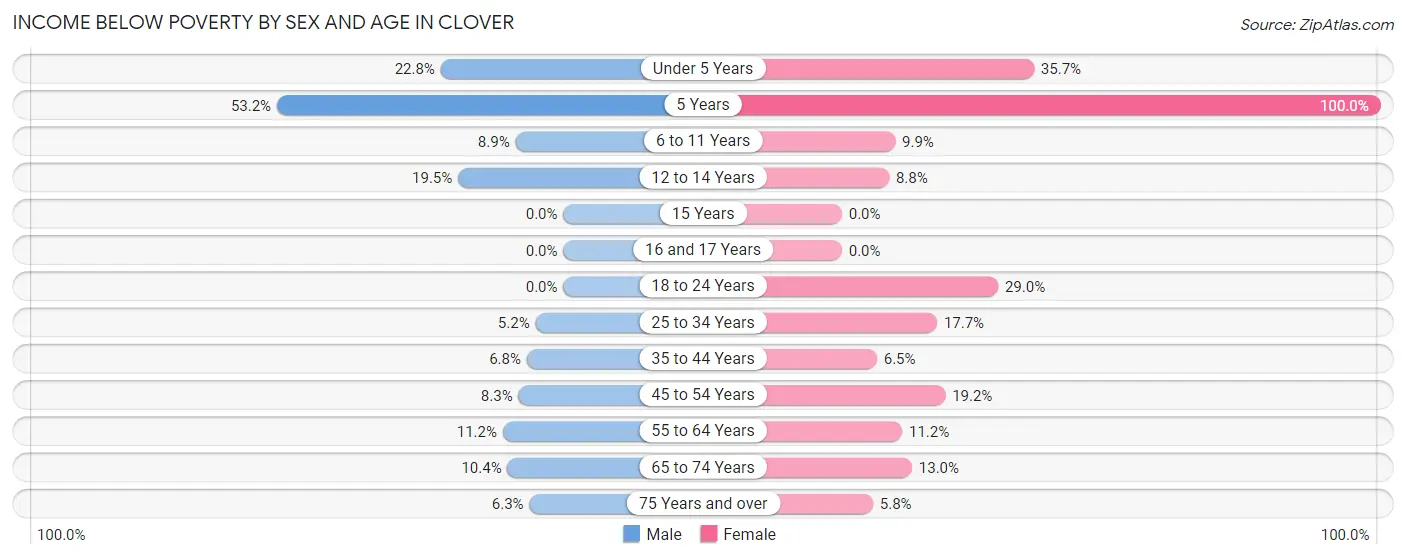
| Age Bracket | Male | Female |
| Under 5 Years | 92 (22.8%) | 46 (35.7%) |
| 5 Years | 42 (53.2%) | 29 (100.0%) |
| 6 to 11 Years | 38 (8.9%) | 29 (9.9%) |
| 12 to 14 Years | 17 (19.5%) | 12 (8.8%) |
| 15 Years | 0 (0.0%) | 0 (0.0%) |
| 16 and 17 Years | 0 (0.0%) | 0 (0.0%) |
| 18 to 24 Years | 0 (0.0%) | 49 (29.0%) |
| 25 to 34 Years | 20 (5.2%) | 68 (17.7%) |
| 35 to 44 Years | 46 (6.8%) | 43 (6.5%) |
| 45 to 54 Years | 19 (8.3%) | 76 (19.2%) |
| 55 to 64 Years | 57 (11.2%) | 47 (11.2%) |
| 65 to 74 Years | 17 (10.4%) | 45 (13.0%) |
| 75 Years and over | 8 (6.3%) | 8 (5.8%) |
| Total | 356 (10.4%) | 452 (13.7%) |
Income Above Poverty by Sex and Age in Clover
According to the poverty statistics in Clover, males aged 15 years and females aged 15 years are the age groups that are most secure financially, with 100.0% of males and 100.0% of females in these age groups living above the poverty line.
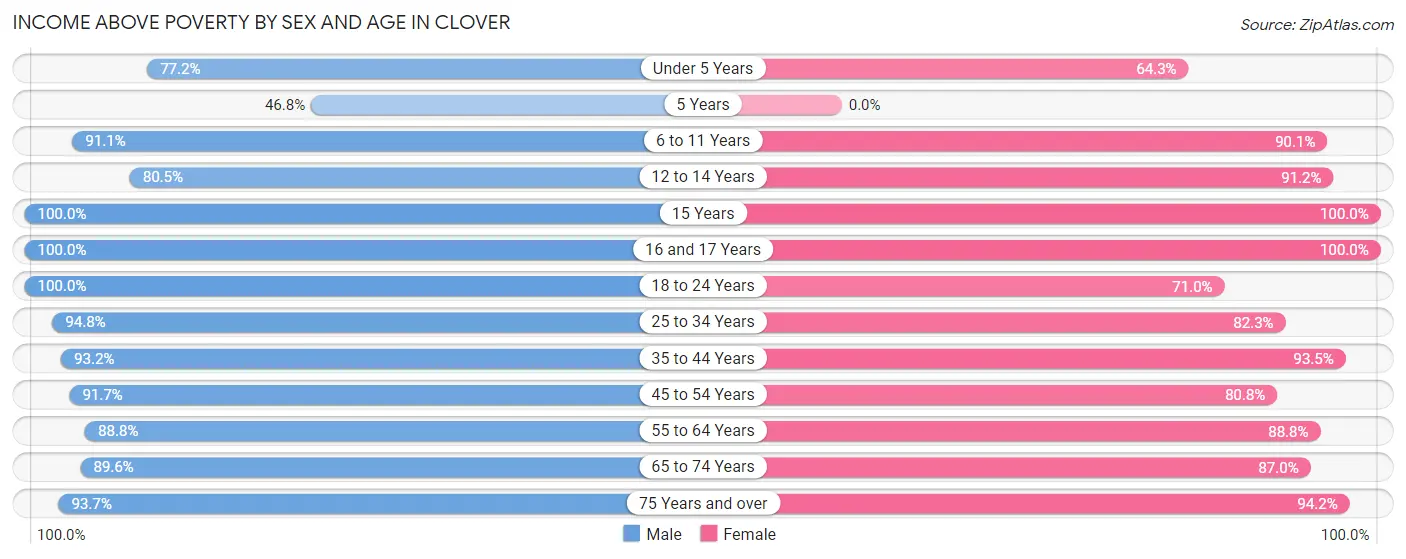
| Age Bracket | Male | Female |
| Under 5 Years | 312 (77.2%) | 83 (64.3%) |
| 5 Years | 37 (46.8%) | 0 (0.0%) |
| 6 to 11 Years | 390 (91.1%) | 264 (90.1%) |
| 12 to 14 Years | 70 (80.5%) | 125 (91.2%) |
| 15 Years | 43 (100.0%) | 24 (100.0%) |
| 16 and 17 Years | 74 (100.0%) | 163 (100.0%) |
| 18 to 24 Years | 221 (100.0%) | 120 (71.0%) |
| 25 to 34 Years | 367 (94.8%) | 317 (82.3%) |
| 35 to 44 Years | 631 (93.2%) | 620 (93.5%) |
| 45 to 54 Years | 209 (91.7%) | 320 (80.8%) |
| 55 to 64 Years | 450 (88.8%) | 373 (88.8%) |
| 65 to 74 Years | 147 (89.6%) | 301 (87.0%) |
| 75 Years and over | 119 (93.7%) | 131 (94.2%) |
| Total | 3,070 (89.6%) | 2,841 (86.3%) |
Income Below Poverty Among Married-Couple Families in Clover
The poverty statistics for married-couple families in Clover show that 0.9% or 9 of the total 1,014 families live below the poverty line. Families with no children have the highest poverty rate of 2.3%, comprising of 9 families. On the other hand, families with 1 or 2 children have the lowest poverty rate of 0.0%, which includes 0 families.
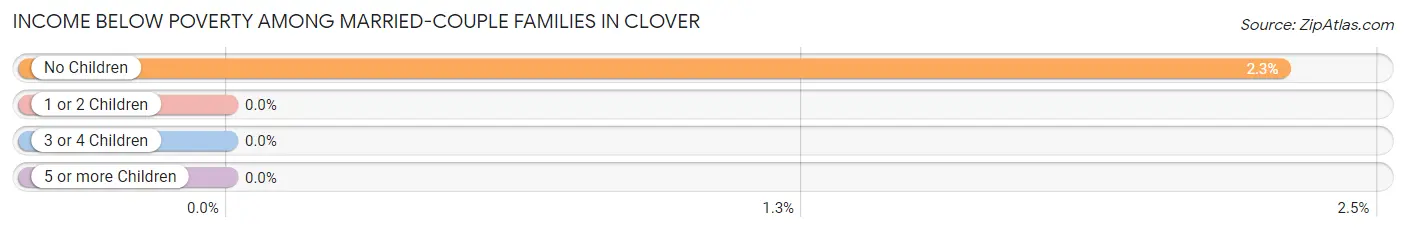
| Children | Above Poverty | Below Poverty |
| No Children | 384 (97.7%) | 9 (2.3%) |
| 1 or 2 Children | 548 (100.0%) | 0 (0.0%) |
| 3 or 4 Children | 73 (100.0%) | 0 (0.0%) |
| 5 or more Children | 0 (0.0%) | 0 (0.0%) |
| Total | 1,005 (99.1%) | 9 (0.9%) |
Income Below Poverty Among Single-Parent Households in Clover
According to the poverty data in Clover, 8.9% or 32 single-father households and 18.4% or 100 single-mother households are living below the poverty line. Among single-father households, those with 1 or 2 children have the highest poverty rate, with 32 households (28.1%) experiencing poverty. Likewise, among single-mother households, those with 5 or more children have the highest poverty rate, with 11 households (100.0%) falling below the poverty line.
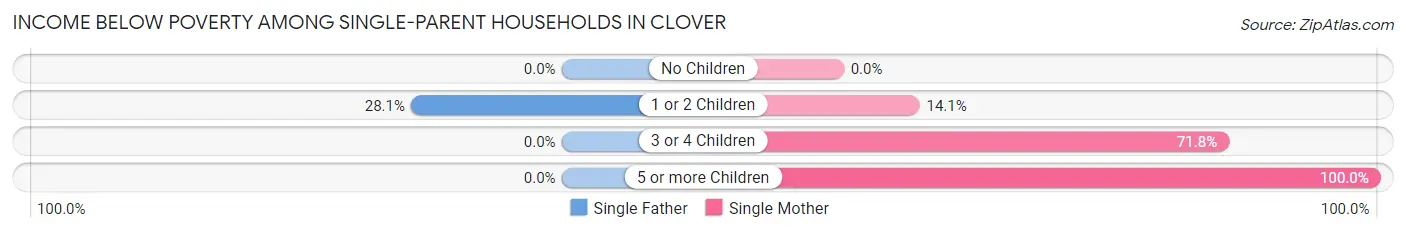
| Children | Single Father | Single Mother |
| No Children | 0 (0.0%) | 0 (0.0%) |
| 1 or 2 Children | 32 (28.1%) | 28 (14.1%) |
| 3 or 4 Children | 0 (0.0%) | 61 (71.8%) |
| 5 or more Children | 0 (0.0%) | 11 (100.0%) |
| Total | 32 (8.9%) | 100 (18.4%) |
Income Below Poverty Among Married-Couple vs Single-Parent Households in Clover
The poverty data for Clover shows that 9 of the married-couple family households (0.9%) and 132 of the single-parent households (14.6%) are living below the poverty level. Within the married-couple family households, those with no children have the highest poverty rate, with 9 households (2.3%) falling below the poverty line. Among the single-parent households, those with 5 or more children have the highest poverty rate, with 11 household (100.0%) living below poverty.
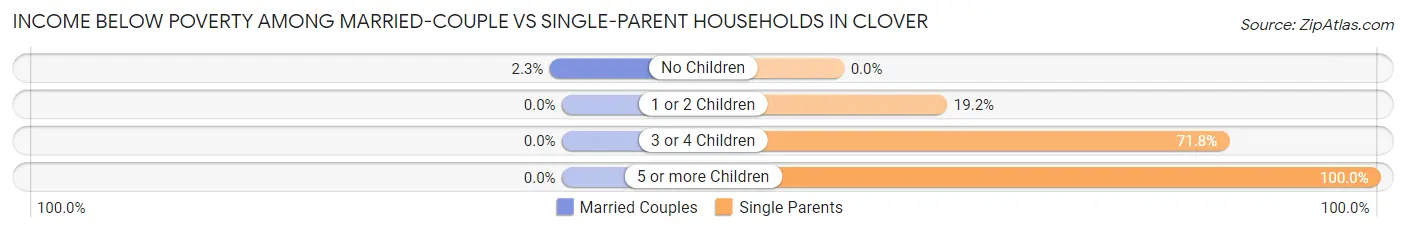
| Children | Married-Couple Families | Single-Parent Households |
| No Children | 9 (2.3%) | 0 (0.0%) |
| 1 or 2 Children | 0 (0.0%) | 60 (19.2%) |
| 3 or 4 Children | 0 (0.0%) | 61 (71.8%) |
| 5 or more Children | 0 (0.0%) | 11 (100.0%) |
| Total | 9 (0.9%) | 132 (14.6%) |
Race in Clover
The most populous races in Clover are White / Caucasian (4,957 | 72.9%), Black / African American (1,051 | 15.5%), and Hispanic or Latino (820 | 12.1%).
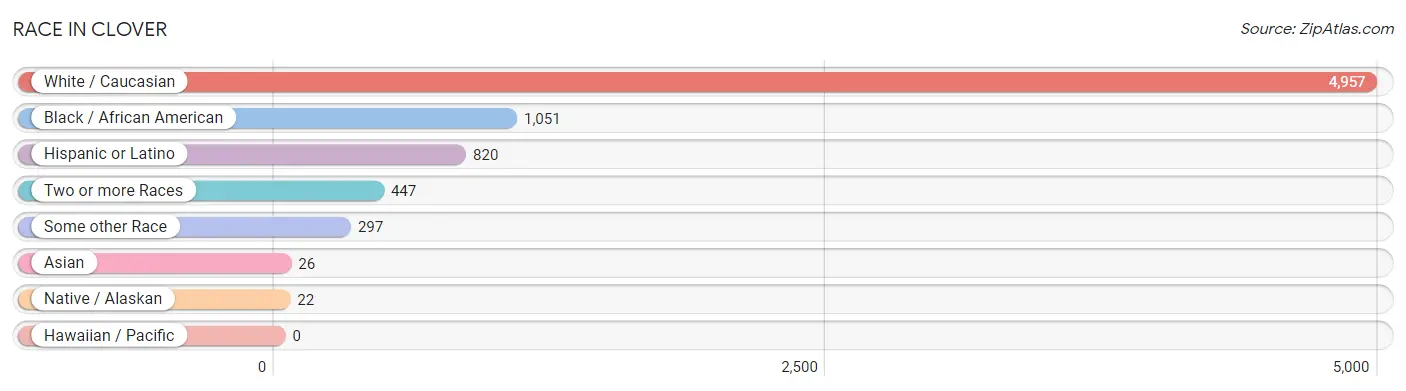
| Race | # Population | % Population |
| Asian | 26 | 0.4% |
| Black / African American | 1,051 | 15.5% |
| Hawaiian / Pacific | 0 | 0.0% |
| Hispanic or Latino | 820 | 12.1% |
| Native / Alaskan | 22 | 0.3% |
| White / Caucasian | 4,957 | 72.9% |
| Two or more Races | 447 | 6.6% |
| Some other Race | 297 | 4.4% |
| Total | 6,800 | 100.0% |
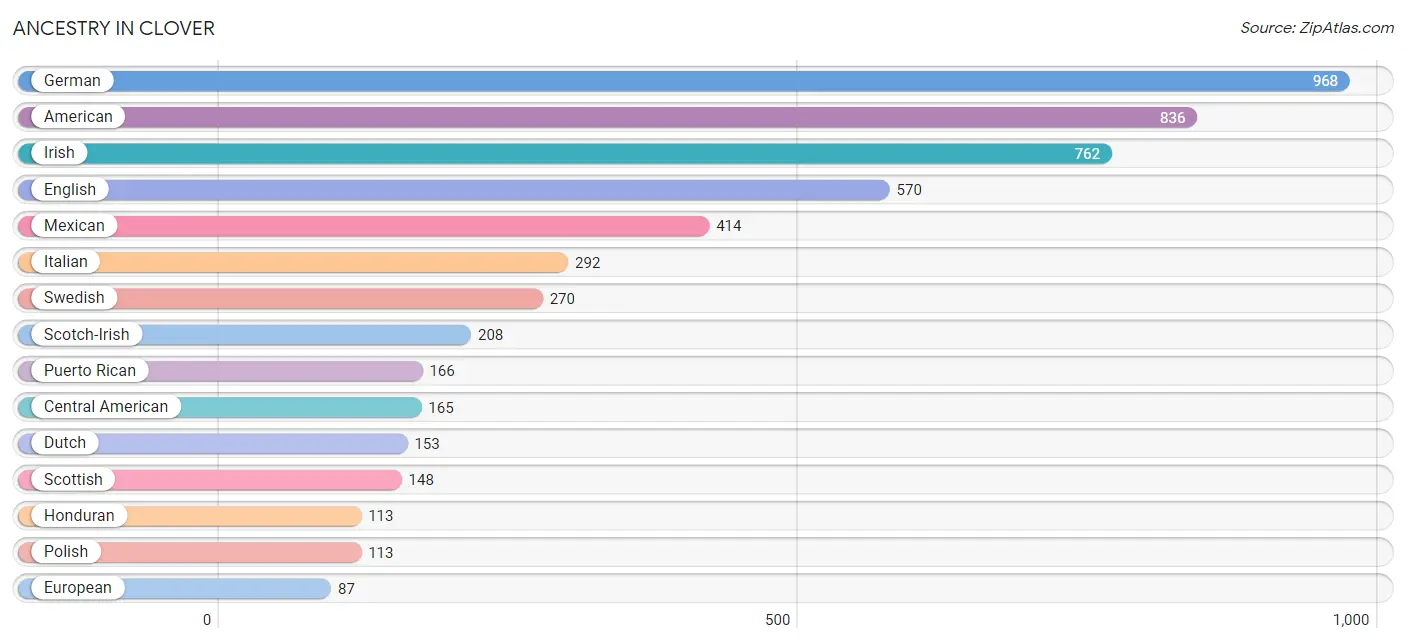
Ancestry in Clover
The most populous ancestries reported in Clover are German (968 | 14.2%), American (836 | 12.3%), Irish (762 | 11.2%), English (570 | 8.4%), and Mexican (414 | 6.1%), together accounting for 52.2% of all Clover residents.
| Ancestry | # Population | % Population |
| African | 11 | 0.2% |
| American | 836 | 12.3% |
| Bhutanese | 51 | 0.7% |
| British | 47 | 0.7% |
| Central American | 165 | 2.4% |
| Cherokee | 9 | 0.1% |
| Choctaw | 3 | 0.0% |
| Crow | 13 | 0.2% |
| Danish | 32 | 0.5% |
| Dominican | 9 | 0.1% |
| Dutch | 153 | 2.2% |
| Eastern European | 17 | 0.3% |
| Ecuadorian | 14 | 0.2% |
| English | 570 | 8.4% |
| European | 87 | 1.3% |
| Filipino | 10 | 0.2% |
| Finnish | 60 | 0.9% |
| French | 68 | 1.0% |
| German | 968 | 14.2% |
| Haitian | 61 | 0.9% |
| Honduran | 113 | 1.7% |
| Hungarian | 42 | 0.6% |
| Indian (Asian) | 11 | 0.2% |
| Irish | 762 | 11.2% |
| Israeli | 13 | 0.2% |
| Italian | 292 | 4.3% |
| Jamaican | 25 | 0.4% |
| Kiowa | 3 | 0.0% |
| Korean | 11 | 0.2% |
| Lithuanian | 34 | 0.5% |
| Lumbee | 31 | 0.5% |
| Mexican | 414 | 6.1% |
| Nicaraguan | 3 | 0.0% |
| Peruvian | 52 | 0.8% |
| Polish | 113 | 1.7% |
| Puerto Rican | 166 | 2.4% |
| Salvadoran | 49 | 0.7% |
| Scandinavian | 26 | 0.4% |
| Scotch-Irish | 208 | 3.1% |
| Scottish | 148 | 2.2% |
| Seminole | 9 | 0.1% |
| South American | 66 | 1.0% |
| Subsaharan African | 11 | 0.2% |
| Swedish | 270 | 4.0% |
| Ukrainian | 7 | 0.1% |
| Welsh | 14 | 0.2% | View All 46 Rows |
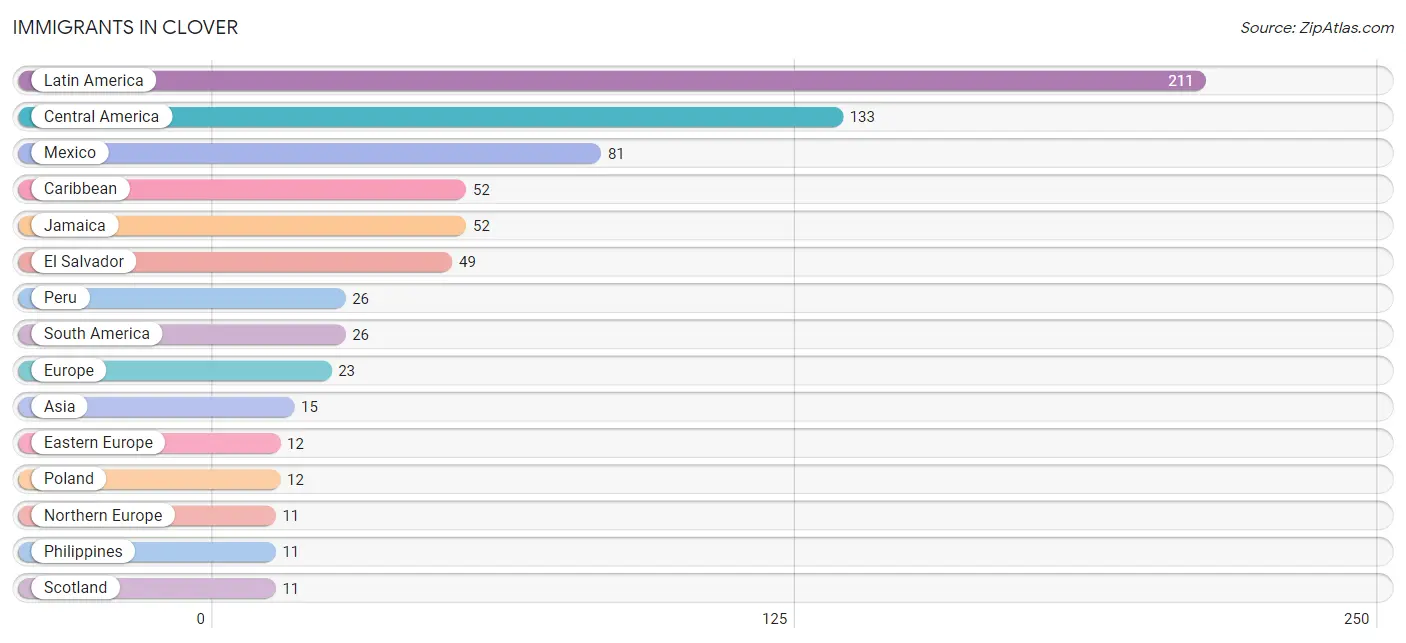
Immigrants in Clover
The most numerous immigrant groups reported in Clover came from Latin America (211 | 3.1%), Central America (133 | 2.0%), Mexico (81 | 1.2%), Caribbean (52 | 0.8%), and Jamaica (52 | 0.8%), together accounting for 7.8% of all Clover residents.
| Immigration Origin | # Population | % Population |
| Asia | 15 | 0.2% |
| Caribbean | 52 | 0.8% |
| Central America | 133 | 2.0% |
| China | 4 | 0.1% |
| Eastern Asia | 4 | 0.1% |
| Eastern Europe | 12 | 0.2% |
| El Salvador | 49 | 0.7% |
| Europe | 23 | 0.3% |
| Jamaica | 52 | 0.8% |
| Latin America | 211 | 3.1% |
| Mexico | 81 | 1.2% |
| Nicaragua | 3 | 0.0% |
| Northern Europe | 11 | 0.2% |
| Peru | 26 | 0.4% |
| Philippines | 11 | 0.2% |
| Poland | 12 | 0.2% |
| Scotland | 11 | 0.2% |
| South America | 26 | 0.4% |
| South Eastern Asia | 11 | 0.2% |
| Taiwan | 4 | 0.1% | View All 20 Rows |
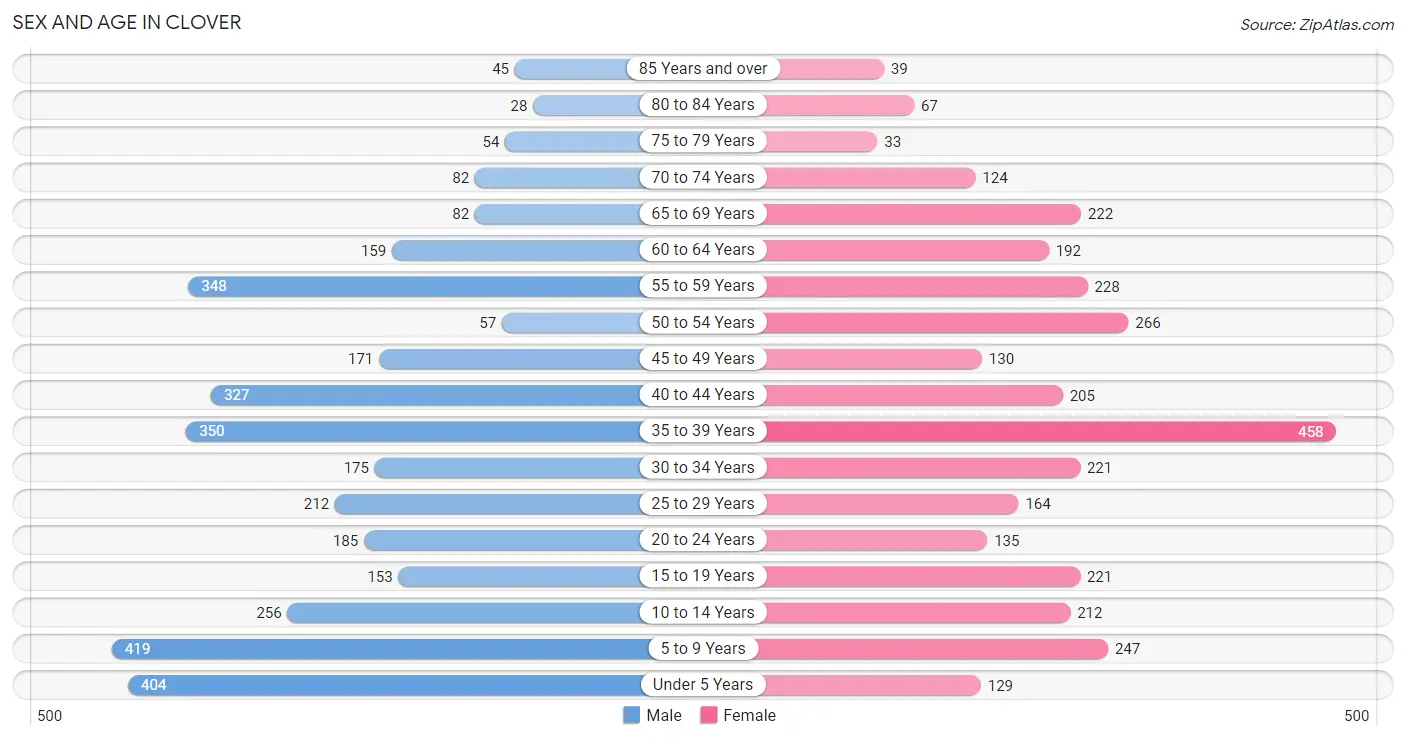
Sex and Age in Clover
Sex and Age in Clover
The most populous age groups in Clover are 5 to 9 Years (419 | 11.9%) for men and 35 to 39 Years (458 | 13.9%) for women.
| Age Bracket | Male | Female |
| Under 5 Years | 404 (11.5%) | 129 (3.9%) |
| 5 to 9 Years | 419 (11.9%) | 247 (7.5%) |
| 10 to 14 Years | 256 (7.3%) | 212 (6.4%) |
| 15 to 19 Years | 153 (4.4%) | 221 (6.7%) |
| 20 to 24 Years | 185 (5.3%) | 135 (4.1%) |
| 25 to 29 Years | 212 (6.0%) | 164 (5.0%) |
| 30 to 34 Years | 175 (5.0%) | 221 (6.7%) |
| 35 to 39 Years | 350 (10.0%) | 458 (13.9%) |
| 40 to 44 Years | 327 (9.3%) | 205 (6.2%) |
| 45 to 49 Years | 171 (4.9%) | 130 (4.0%) |
| 50 to 54 Years | 57 (1.6%) | 266 (8.1%) |
| 55 to 59 Years | 348 (9.9%) | 228 (6.9%) |
| 60 to 64 Years | 159 (4.5%) | 192 (5.8%) |
| 65 to 69 Years | 82 (2.3%) | 222 (6.7%) |
| 70 to 74 Years | 82 (2.3%) | 124 (3.8%) |
| 75 to 79 Years | 54 (1.5%) | 33 (1.0%) |
| 80 to 84 Years | 28 (0.8%) | 67 (2.0%) |
| 85 Years and over | 45 (1.3%) | 39 (1.2%) |
| Total | 3,507 (100.0%) | 3,293 (100.0%) |
Families and Households in Clover
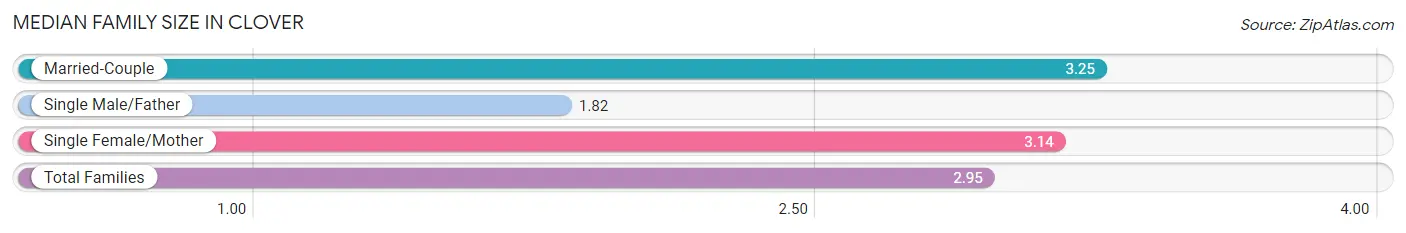
Median Family Size in Clover
The median family size in Clover is 2.95 persons per family, with married-couple families (1,014 | 52.9%) accounting for the largest median family size of 3.25 persons per family. On the other hand, single male/father families (359 | 18.7%) represent the smallest median family size with 1.82 persons per family.
| Family Type | # Families | Family Size |
| Married-Couple | 1,014 (52.9%) | 3.25 |
| Single Male/Father | 359 (18.7%) | 1.82 |
| Single Female/Mother | 544 (28.4%) | 3.14 |
| Total Families | 1,917 (100.0%) | 2.95 |
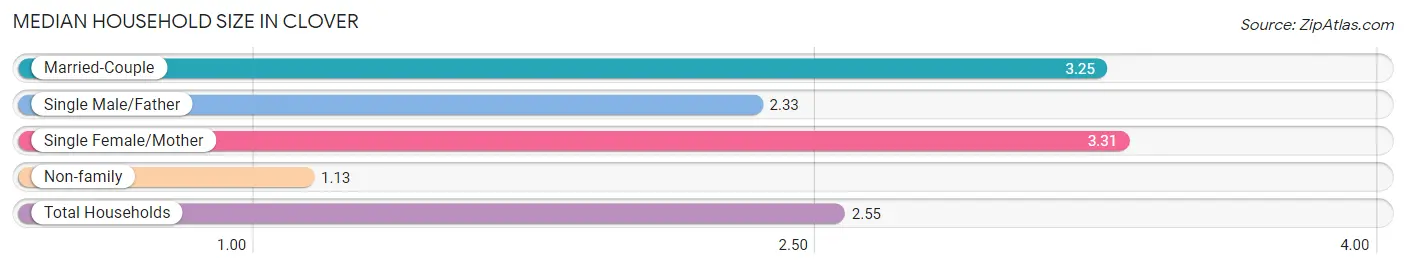
Median Household Size in Clover
The median household size in Clover is 2.55 persons per household, with single female/mother households (544 | 20.5%) accounting for the largest median household size of 3.31 persons per household. non-family households (739 | 27.8%) represent the smallest median household size with 1.13 persons per household.
| Household Type | # Households | Household Size |
| Married-Couple | 1,014 (38.2%) | 3.25 |
| Single Male/Father | 359 (13.5%) | 2.33 |
| Single Female/Mother | 544 (20.5%) | 3.31 |
| Non-family | 739 (27.8%) | 1.13 |
| Total Households | 2,656 (100.0%) | 2.55 |
Household Size by Marriage Status in Clover
Out of a total of 2,656 households in Clover, 1,917 (72.2%) are family households, while 739 (27.8%) are nonfamily households. The most numerous type of family households are 2-person households, comprising 753, and the most common type of nonfamily households are 1-person households, comprising 642.
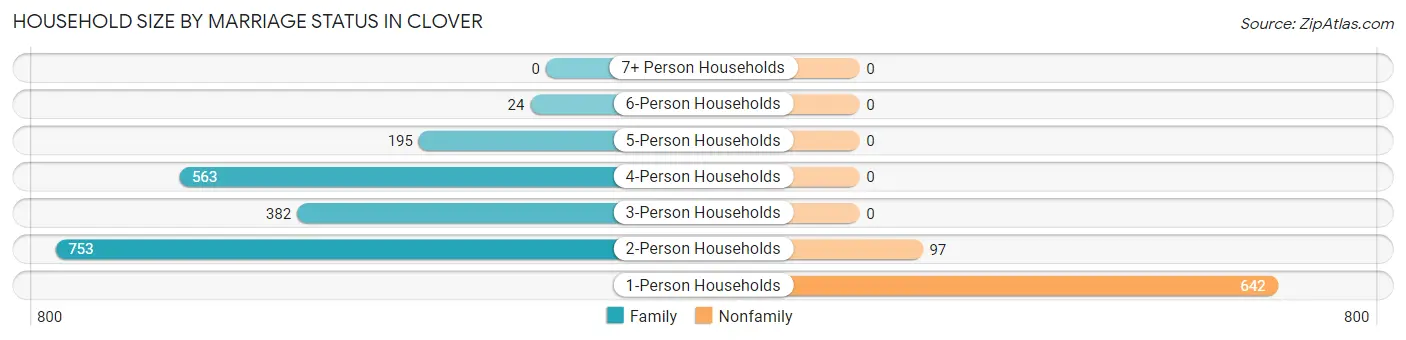
| Household Size | Family Households | Nonfamily Households |
| 1-Person Households | - | 642 (24.2%) |
| 2-Person Households | 753 (28.3%) | 97 (3.6%) |
| 3-Person Households | 382 (14.4%) | 0 (0.0%) |
| 4-Person Households | 563 (21.2%) | 0 (0.0%) |
| 5-Person Households | 195 (7.3%) | 0 (0.0%) |
| 6-Person Households | 24 (0.9%) | 0 (0.0%) |
| 7+ Person Households | 0 (0.0%) | 0 (0.0%) |
| Total | 1,917 (72.2%) | 739 (27.8%) |
Female Fertility in Clover
Fertility by Age in Clover
Average fertility rate in Clover is 98.0 births per 1,000 women. Women in the age bracket of 20 to 34 years have the highest fertility rate with 213.0 births per 1,000 women. Women in the age bracket of 20 to 34 years acount for 72.6% of all women with births.
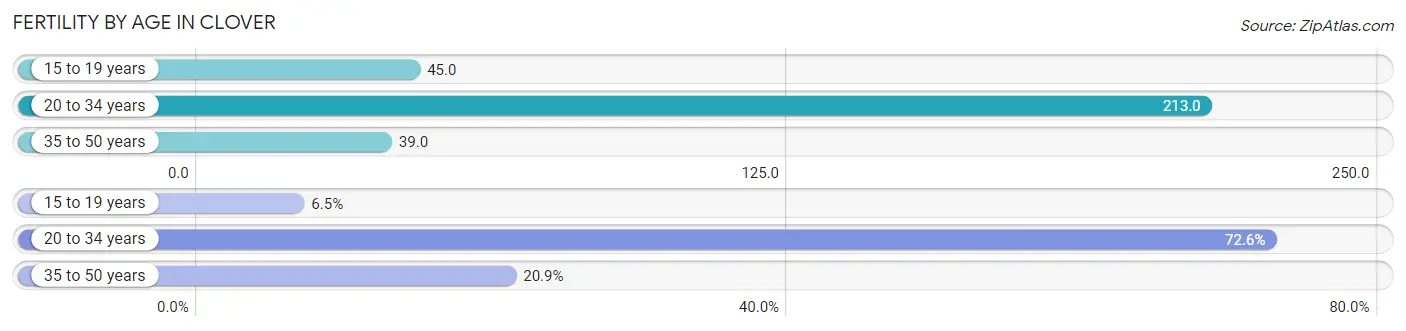
| Age Bracket | Women with Births | Births / 1,000 Women |
| 15 to 19 years | 10 (6.5%) | 45.0 |
| 20 to 34 years | 111 (72.6%) | 213.0 |
| 35 to 50 years | 32 (20.9%) | 39.0 |
| Total | 153 (100.0%) | 98.0 |
Fertility by Age by Marriage Status in Clover
58.8% of women with births (153) in Clover are married. The highest percentage of unmarried women with births falls into 15 to 19 years age bracket with 100.0% of them unmarried at the time of birth, while the lowest percentage of unmarried women with births belong to 35 to 50 years age bracket with 0.0% of them unmarried.
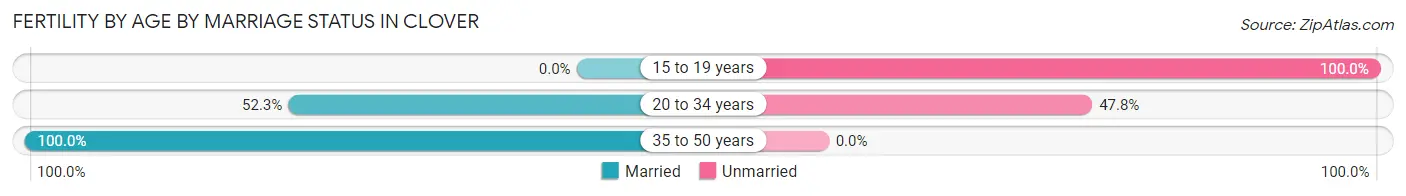
| Age Bracket | Married | Unmarried |
| 15 to 19 years | 0 (0.0%) | 10 (100.0%) |
| 20 to 34 years | 58 (52.2%) | 53 (47.7%) |
| 35 to 50 years | 32 (100.0%) | 0 (0.0%) |
| Total | 90 (58.8%) | 63 (41.2%) |
Fertility by Education in Clover
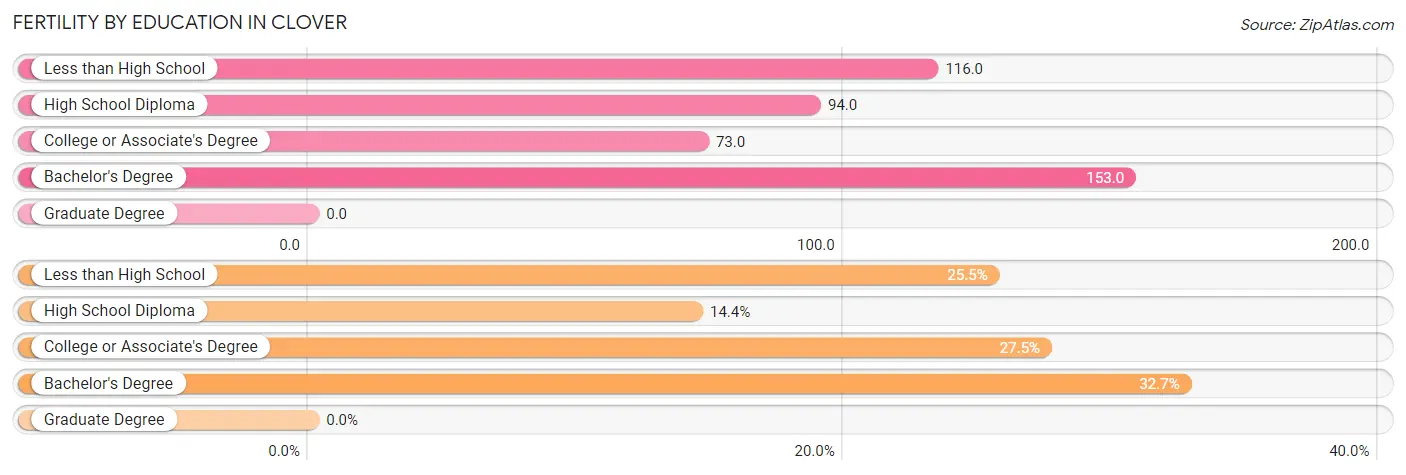
| Educational Attainment | Women with Births | Births / 1,000 Women |
| Less than High School | 39 (25.5%) | 116.0 |
| High School Diploma | 22 (14.4%) | 94.0 |
| College or Associate's Degree | 42 (27.5%) | 73.0 |
| Bachelor's Degree | 50 (32.7%) | 153.0 |
| Graduate Degree | 0 (0.0%) | 0.0 |
| Total | 153 (100.0%) | 98.0 |
Fertility by Education by Marriage Status in Clover
41.2% of women with births in Clover are unmarried. Women with the educational attainment of bachelor's degree are most likely to be married with 100.0% of them married at childbirth, while women with the educational attainment of less than high school are least likely to be married with 100.0% of them unmarried at childbirth.
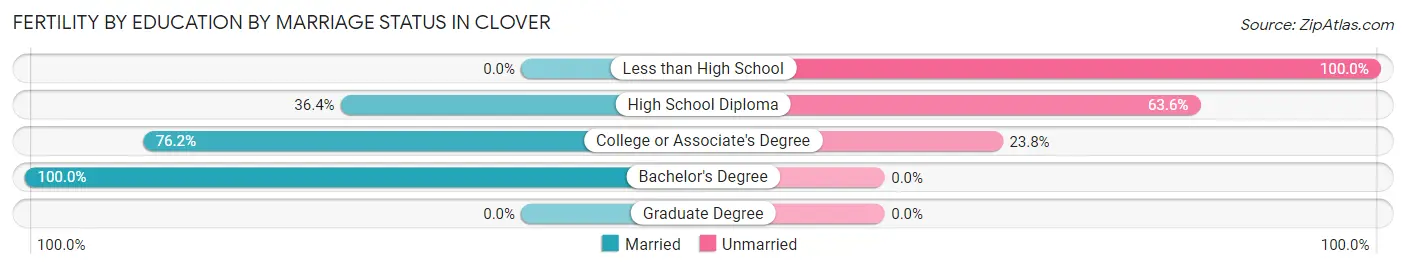
| Educational Attainment | Married | Unmarried |
| Less than High School | 0 (0.0%) | 39 (100.0%) |
| High School Diploma | 8 (36.4%) | 14 (63.6%) |
| College or Associate's Degree | 32 (76.2%) | 10 (23.8%) |
| Bachelor's Degree | 50 (100.0%) | 0 (0.0%) |
| Graduate Degree | 0 (0.0%) | 0 (0.0%) |
| Total | 90 (58.8%) | 63 (41.2%) |
Employment Characteristics in Clover
Employment by Class of Employer in Clover
Among the 2,982 employed individuals in Clover, private company employees (2,461 | 82.5%), state government employees (158 | 5.3%), and self-employed (incorporated) (116 | 3.9%) make up the most common classes of employment.
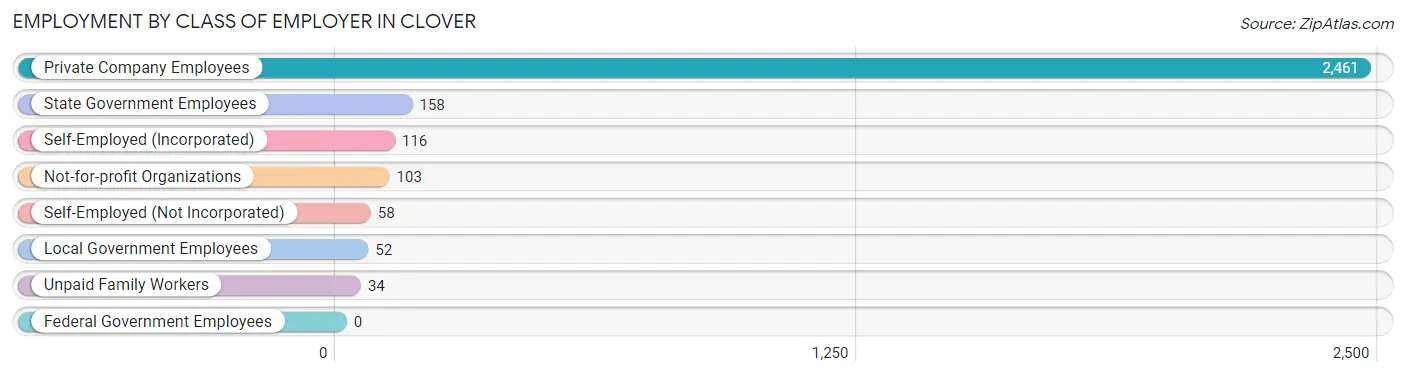
| Employer Class | # Employees | % Employees |
| Private Company Employees | 2,461 | 82.5% |
| Self-Employed (Incorporated) | 116 | 3.9% |
| Self-Employed (Not Incorporated) | 58 | 1.9% |
| Not-for-profit Organizations | 103 | 3.5% |
| Local Government Employees | 52 | 1.7% |
| State Government Employees | 158 | 5.3% |
| Federal Government Employees | 0 | 0.0% |
| Unpaid Family Workers | 34 | 1.1% |
| Total | 2,982 | 100.0% |
Employment Status by Age in Clover
According to the labor force statistics for Clover, out of the total population over 16 years of age (5,066), 65.5% or 3,318 individuals are in the labor force, with 8.9% or 295 of them unemployed. The age group with the highest labor force participation rate is 20 to 24 years, with 96.3% or 308 individuals in the labor force. Within the labor force, the 20 to 24 years age range has the highest percentage of unemployed individuals, with 33.8% or 104 of them being unemployed.
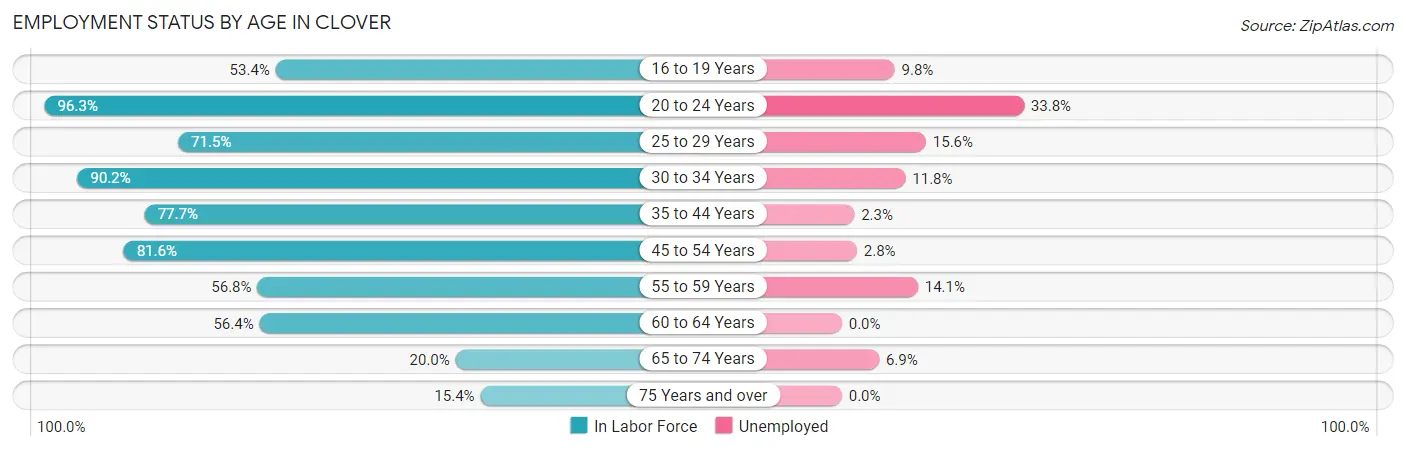
| Age Bracket | In Labor Force | Unemployed |
| 16 to 19 Years | 164 (53.4%) | 16 (9.8%) |
| 20 to 24 Years | 308 (96.3%) | 104 (33.8%) |
| 25 to 29 Years | 269 (71.5%) | 42 (15.6%) |
| 30 to 34 Years | 357 (90.2%) | 42 (11.8%) |
| 35 to 44 Years | 1,041 (77.7%) | 24 (2.3%) |
| 45 to 54 Years | 509 (81.6%) | 14 (2.8%) |
| 55 to 59 Years | 327 (56.8%) | 46 (14.1%) |
| 60 to 64 Years | 198 (56.4%) | 0 (0.0%) |
| 65 to 74 Years | 102 (20.0%) | 7 (6.9%) |
| 75 Years and over | 41 (15.4%) | 0 (0.0%) |
| Total | 3,318 (65.5%) | 295 (8.9%) |
Employment Status by Educational Attainment in Clover
According to labor force statistics for Clover, 73.7% of individuals (2,700) out of the total population between 25 and 64 years of age (3,663) are in the labor force, with 6.2% or 167 of them being unemployed. The group with the highest labor force participation rate are those with the educational attainment of bachelor's degree or higher, with 86.9% or 872 individuals in the labor force. Within the labor force, individuals with less than high school education have the highest percentage of unemployment, with 17.9% or 27 of them being unemployed.
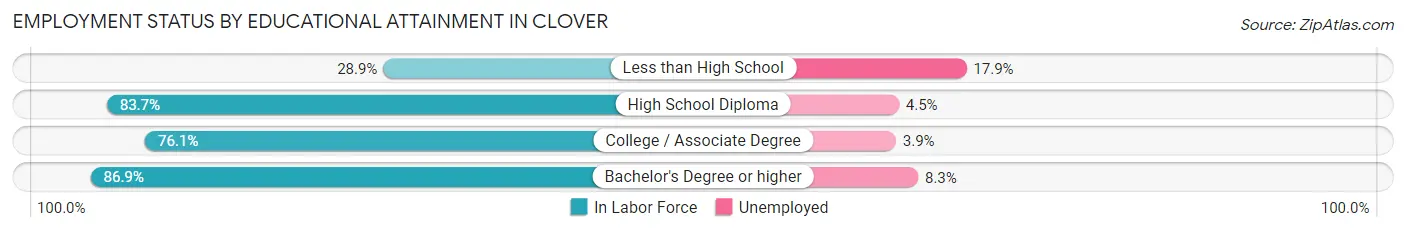
| Educational Attainment | In Labor Force | Unemployed |
| Less than High School | 151 (28.9%) | 94 (17.9%) |
| High School Diploma | 582 (83.7%) | 31 (4.5%) |
| College / Associate Degree | 1,097 (76.1%) | 56 (3.9%) |
| Bachelor's Degree or higher | 872 (86.9%) | 83 (8.3%) |
| Total | 2,700 (73.7%) | 227 (6.2%) |
Employment Occupations by Sex in Clover
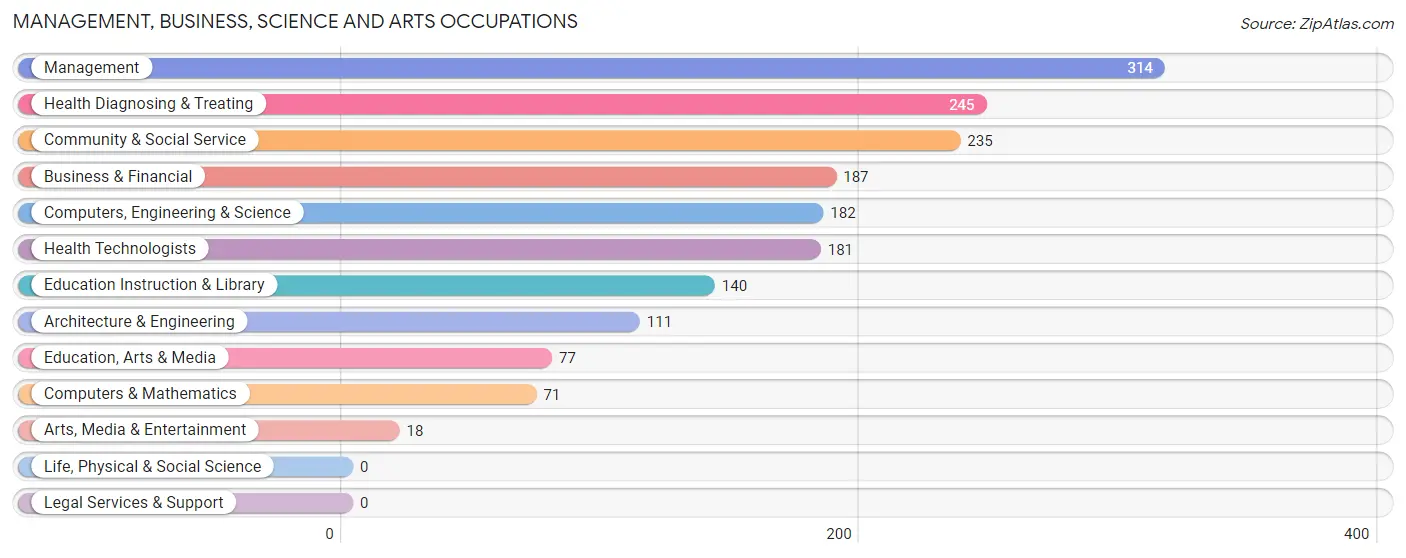
Management, Business, Science and Arts Occupations
The most common Management, Business, Science and Arts occupations in Clover are Management (314 | 10.4%), Health Diagnosing & Treating (245 | 8.1%), Community & Social Service (235 | 7.8%), Business & Financial (187 | 6.2%), and Computers, Engineering & Science (182 | 6.0%).
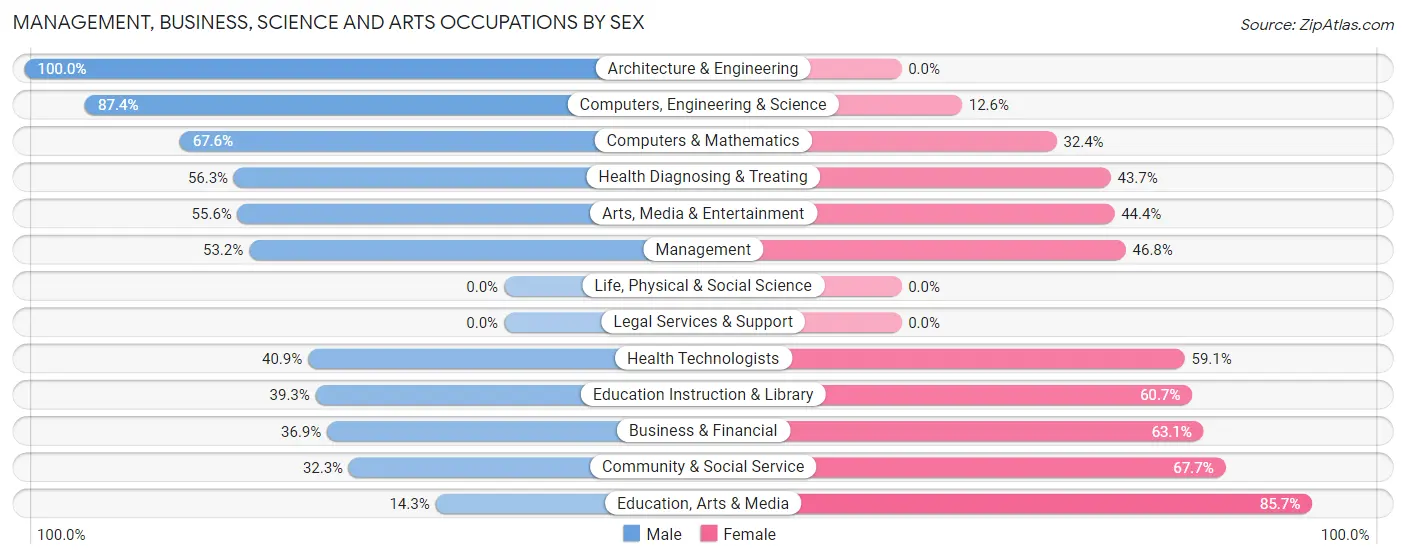
Management, Business, Science and Arts Occupations by Sex
Within the Management, Business, Science and Arts occupations in Clover, the most male-oriented occupations are Architecture & Engineering (100.0%), Computers, Engineering & Science (87.4%), and Computers & Mathematics (67.6%), while the most female-oriented occupations are Education, Arts & Media (85.7%), Community & Social Service (67.7%), and Business & Financial (63.1%).
| Occupation | Male | Female |
| Management | 167 (53.2%) | 147 (46.8%) |
| Business & Financial | 69 (36.9%) | 118 (63.1%) |
| Computers, Engineering & Science | 159 (87.4%) | 23 (12.6%) |
| Computers & Mathematics | 48 (67.6%) | 23 (32.4%) |
| Architecture & Engineering | 111 (100.0%) | 0 (0.0%) |
| Life, Physical & Social Science | 0 (0.0%) | 0 (0.0%) |
| Community & Social Service | 76 (32.3%) | 159 (67.7%) |
| Education, Arts & Media | 11 (14.3%) | 66 (85.7%) |
| Legal Services & Support | 0 (0.0%) | 0 (0.0%) |
| Education Instruction & Library | 55 (39.3%) | 85 (60.7%) |
| Arts, Media & Entertainment | 10 (55.6%) | 8 (44.4%) |
| Health Diagnosing & Treating | 138 (56.3%) | 107 (43.7%) |
| Health Technologists | 74 (40.9%) | 107 (59.1%) |
| Total (Category) | 609 (52.4%) | 554 (47.6%) |
| Total (Overall) | 1,586 (52.5%) | 1,435 (47.5%) |
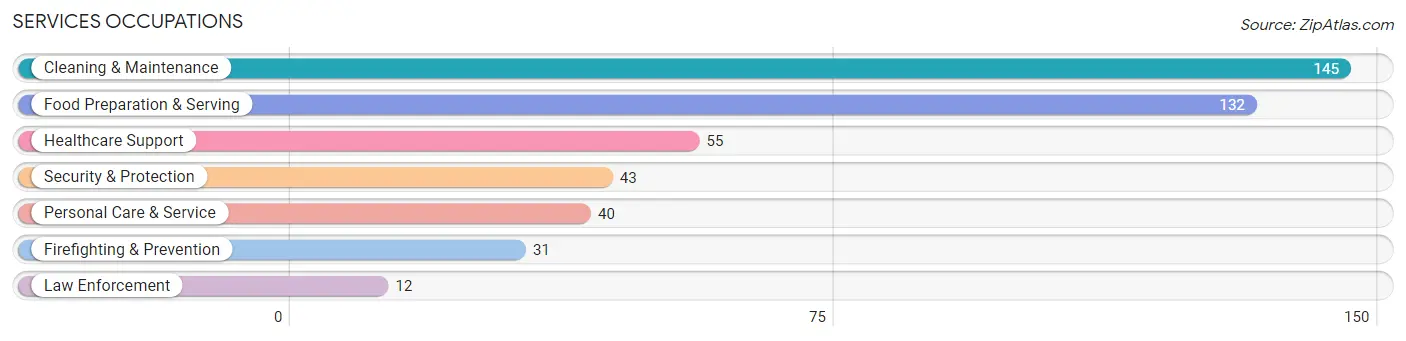
Services Occupations
The most common Services occupations in Clover are Cleaning & Maintenance (145 | 4.8%), Food Preparation & Serving (132 | 4.4%), Healthcare Support (55 | 1.8%), Security & Protection (43 | 1.4%), and Personal Care & Service (40 | 1.3%).
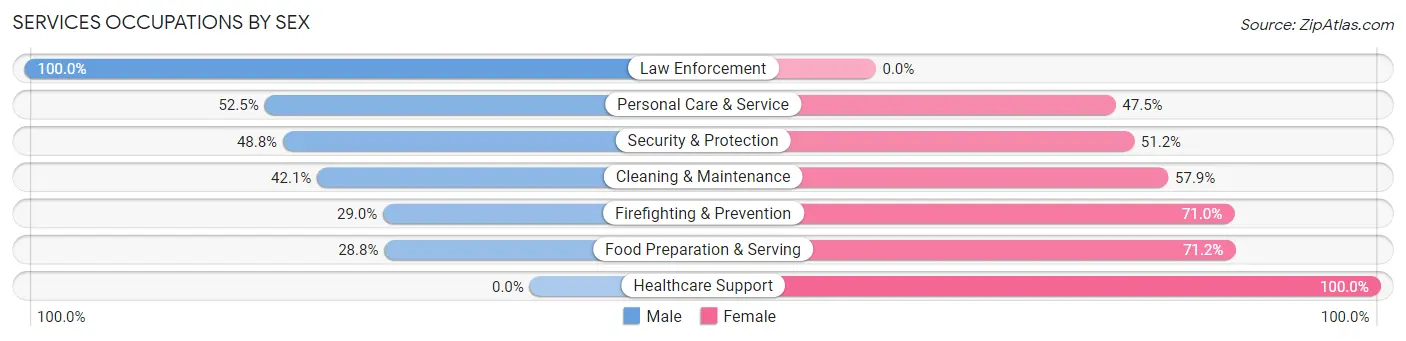
Services Occupations by Sex
Within the Services occupations in Clover, the most male-oriented occupations are Law Enforcement (100.0%), Personal Care & Service (52.5%), and Security & Protection (48.8%), while the most female-oriented occupations are Healthcare Support (100.0%), Food Preparation & Serving (71.2%), and Firefighting & Prevention (71.0%).
| Occupation | Male | Female |
| Healthcare Support | 0 (0.0%) | 55 (100.0%) |
| Security & Protection | 21 (48.8%) | 22 (51.2%) |
| Firefighting & Prevention | 9 (29.0%) | 22 (71.0%) |
| Law Enforcement | 12 (100.0%) | 0 (0.0%) |
| Food Preparation & Serving | 38 (28.8%) | 94 (71.2%) |
| Cleaning & Maintenance | 61 (42.1%) | 84 (57.9%) |
| Personal Care & Service | 21 (52.5%) | 19 (47.5%) |
| Total (Category) | 141 (34.0%) | 274 (66.0%) |
| Total (Overall) | 1,586 (52.5%) | 1,435 (47.5%) |
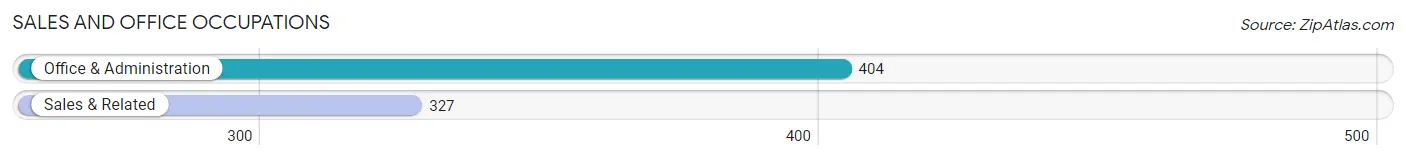
Sales and Office Occupations
The most common Sales and Office occupations in Clover are Office & Administration (404 | 13.4%), and Sales & Related (327 | 10.8%).
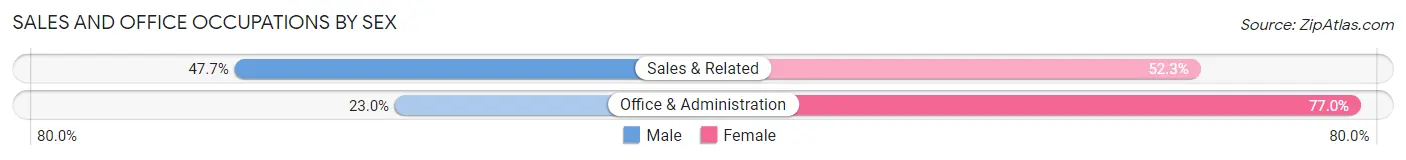
Sales and Office Occupations by Sex
| Occupation | Male | Female |
| Sales & Related | 156 (47.7%) | 171 (52.3%) |
| Office & Administration | 93 (23.0%) | 311 (77.0%) |
| Total (Category) | 249 (34.1%) | 482 (65.9%) |
| Total (Overall) | 1,586 (52.5%) | 1,435 (47.5%) |
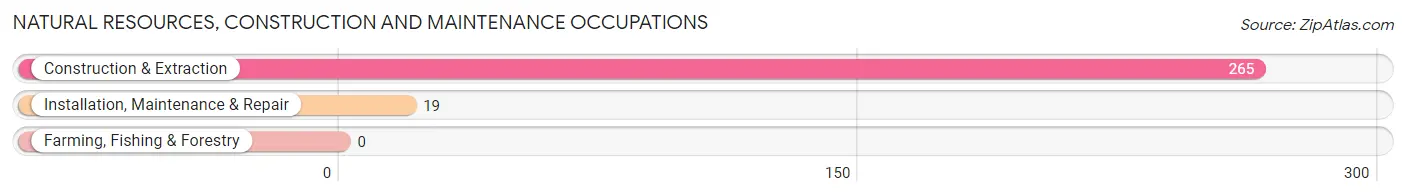
Natural Resources, Construction and Maintenance Occupations
The most common Natural Resources, Construction and Maintenance occupations in Clover are Construction & Extraction (265 | 8.8%), and Installation, Maintenance & Repair (19 | 0.6%).
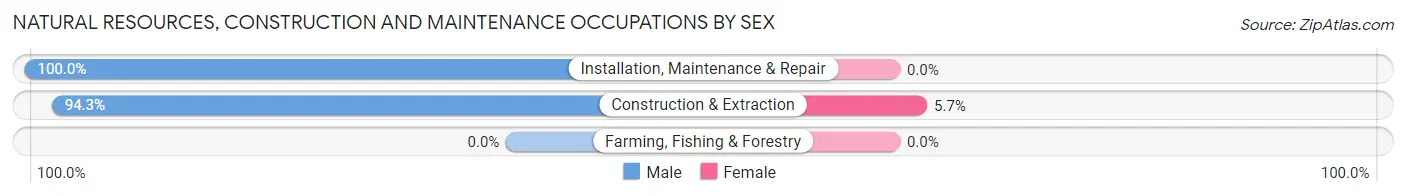
Natural Resources, Construction and Maintenance Occupations by Sex
| Occupation | Male | Female |
| Farming, Fishing & Forestry | 0 (0.0%) | 0 (0.0%) |
| Construction & Extraction | 250 (94.3%) | 15 (5.7%) |
| Installation, Maintenance & Repair | 19 (100.0%) | 0 (0.0%) |
| Total (Category) | 269 (94.7%) | 15 (5.3%) |
| Total (Overall) | 1,586 (52.5%) | 1,435 (47.5%) |
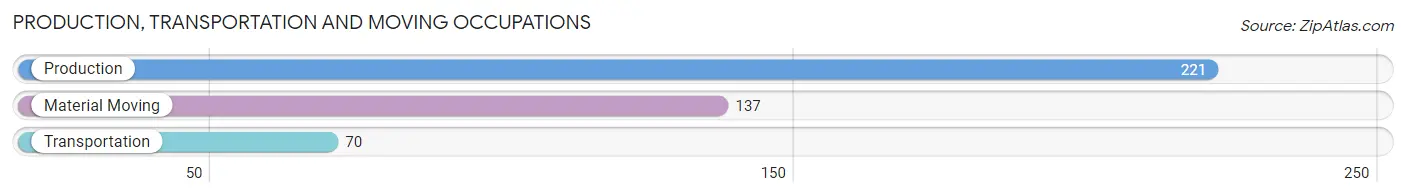
Production, Transportation and Moving Occupations
The most common Production, Transportation and Moving occupations in Clover are Production (221 | 7.3%), Material Moving (137 | 4.5%), and Transportation (70 | 2.3%).
Production, Transportation and Moving Occupations by Sex
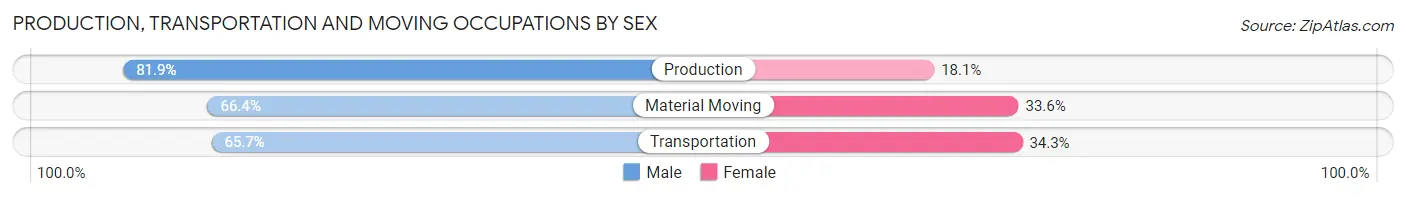
| Occupation | Male | Female |
| Production | 181 (81.9%) | 40 (18.1%) |
| Transportation | 46 (65.7%) | 24 (34.3%) |
| Material Moving | 91 (66.4%) | 46 (33.6%) |
| Total (Category) | 318 (74.3%) | 110 (25.7%) |
| Total (Overall) | 1,586 (52.5%) | 1,435 (47.5%) |
Employment Industries by Sex in Clover
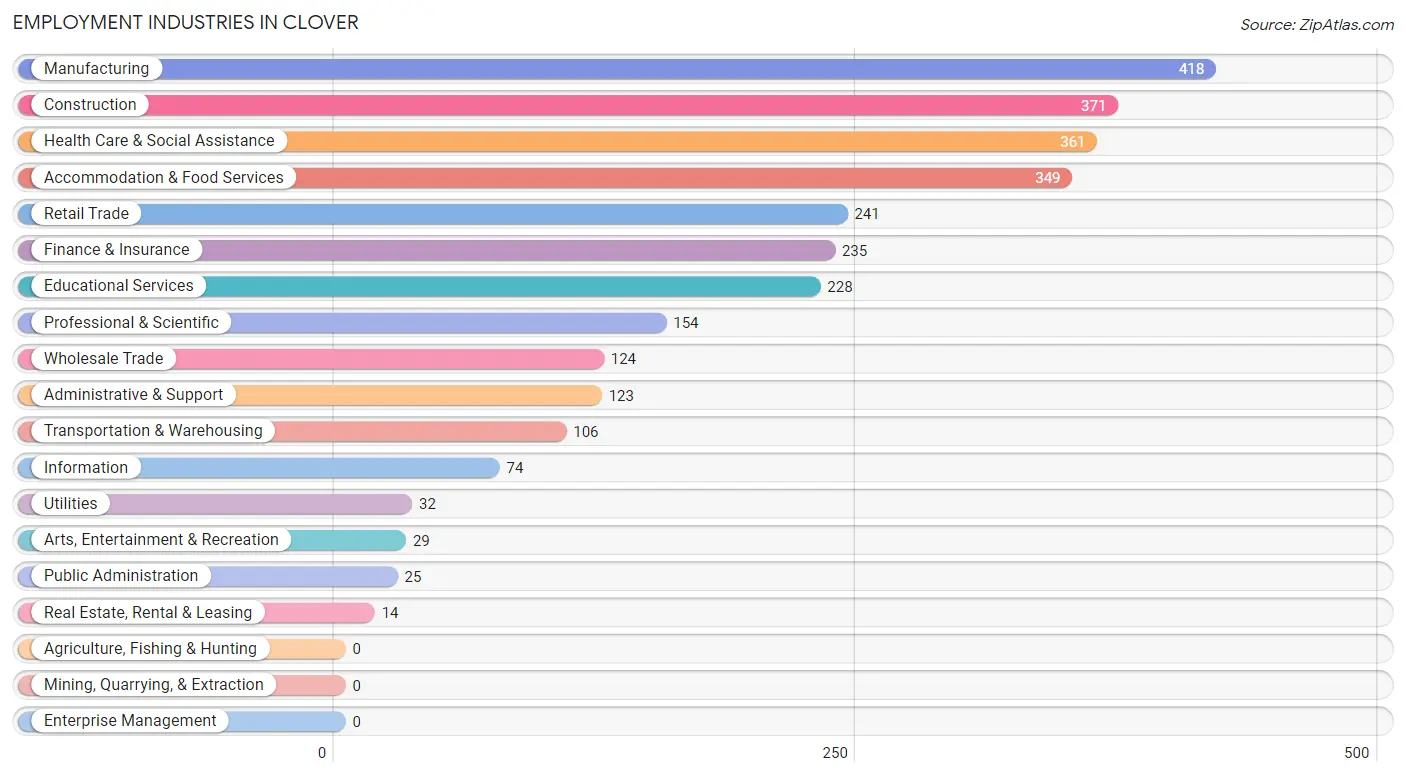
Employment Industries in Clover
The major employment industries in Clover include Manufacturing (418 | 13.8%), Construction (371 | 12.3%), Health Care & Social Assistance (361 | 11.9%), Accommodation & Food Services (349 | 11.6%), and Retail Trade (241 | 8.0%).
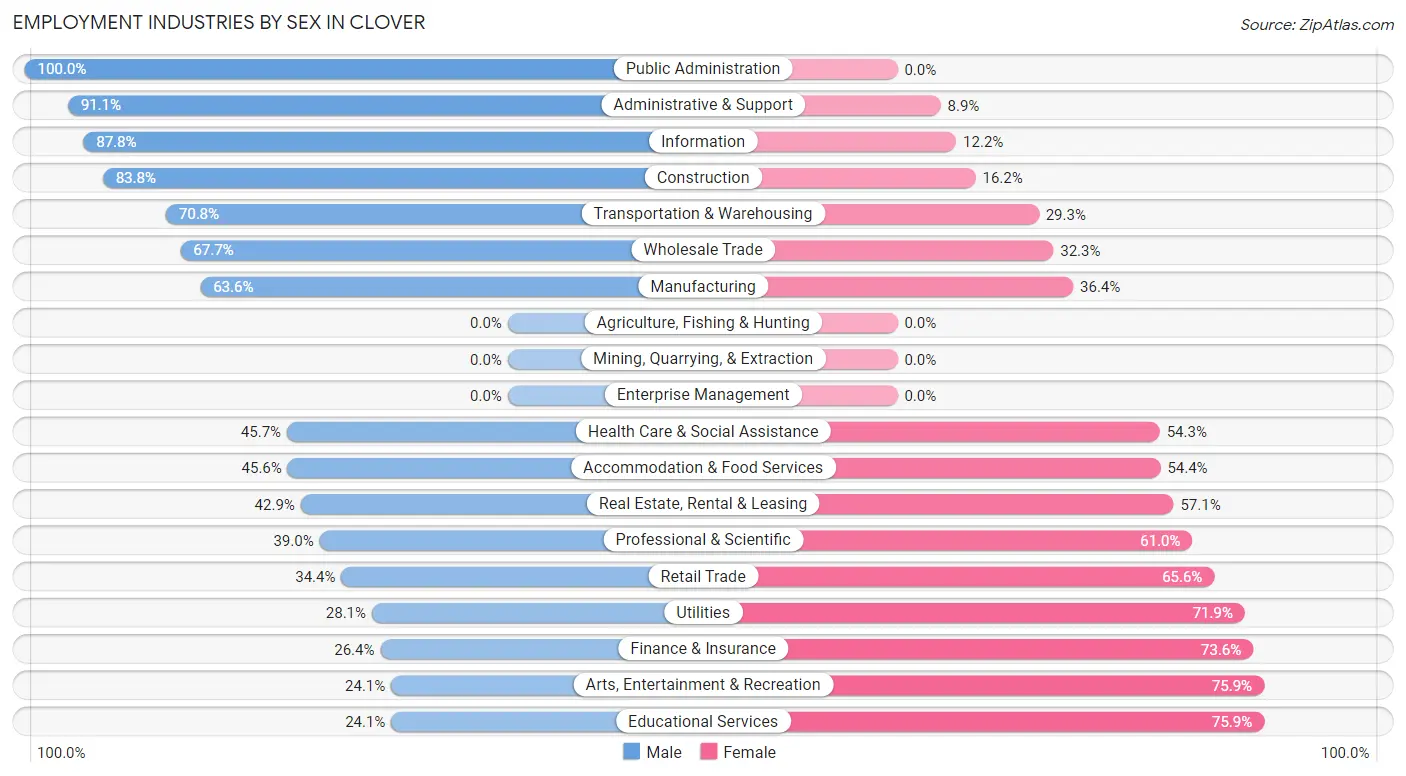
Employment Industries by Sex in Clover
The Clover industries that see more men than women are Public Administration (100.0%), Administrative & Support (91.1%), and Information (87.8%), whereas the industries that tend to have a higher number of women are Educational Services (75.9%), Arts, Entertainment & Recreation (75.9%), and Finance & Insurance (73.6%).
| Industry | Male | Female |
| Agriculture, Fishing & Hunting | 0 (0.0%) | 0 (0.0%) |
| Mining, Quarrying, & Extraction | 0 (0.0%) | 0 (0.0%) |
| Construction | 311 (83.8%) | 60 (16.2%) |
| Manufacturing | 266 (63.6%) | 152 (36.4%) |
| Wholesale Trade | 84 (67.7%) | 40 (32.3%) |
| Retail Trade | 83 (34.4%) | 158 (65.6%) |
| Transportation & Warehousing | 75 (70.8%) | 31 (29.2%) |
| Utilities | 9 (28.1%) | 23 (71.9%) |
| Information | 65 (87.8%) | 9 (12.2%) |
| Finance & Insurance | 62 (26.4%) | 173 (73.6%) |
| Real Estate, Rental & Leasing | 6 (42.9%) | 8 (57.1%) |
| Professional & Scientific | 60 (39.0%) | 94 (61.0%) |
| Enterprise Management | 0 (0.0%) | 0 (0.0%) |
| Administrative & Support | 112 (91.1%) | 11 (8.9%) |
| Educational Services | 55 (24.1%) | 173 (75.9%) |
| Health Care & Social Assistance | 165 (45.7%) | 196 (54.3%) |
| Arts, Entertainment & Recreation | 7 (24.1%) | 22 (75.9%) |
| Accommodation & Food Services | 159 (45.6%) | 190 (54.4%) |
| Public Administration | 25 (100.0%) | 0 (0.0%) |
| Total | 1,586 (52.5%) | 1,435 (47.5%) |
Education in Clover
School Enrollment in Clover
The most common levels of schooling among the 1,865 students in Clover are elementary school (572 | 30.7%), middle school (446 | 23.9%), and high school (374 | 20.1%).
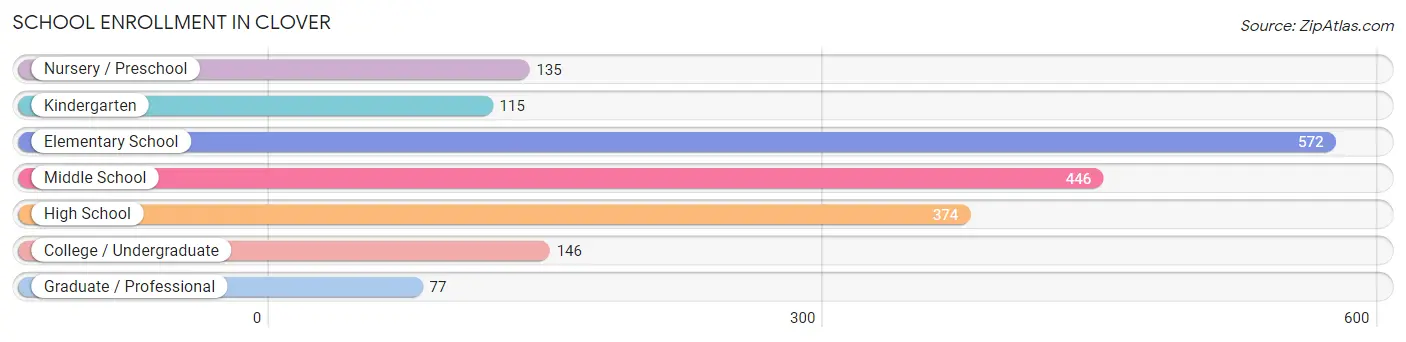
| School Level | # Students | % Students |
| Nursery / Preschool | 135 | 7.2% |
| Kindergarten | 115 | 6.2% |
| Elementary School | 572 | 30.7% |
| Middle School | 446 | 23.9% |
| High School | 374 | 20.1% |
| College / Undergraduate | 146 | 7.8% |
| Graduate / Professional | 77 | 4.1% |
| Total | 1,865 | 100.0% |
School Enrollment by Age by Funding Source in Clover
Out of a total of 1,865 students who are enrolled in schools in Clover, 157 (8.4%) attend a private institution, while the remaining 1,708 (91.6%) are enrolled in public schools. The age group of 3 to 4 year olds has the highest likelihood of being enrolled in private schools, with 35 (36.5% in the age bracket) enrolled. Conversely, the age group of 10 to 14 year olds has the lowest likelihood of being enrolled in a private school, with 468 (100.0% in the age bracket) attending a public institution.
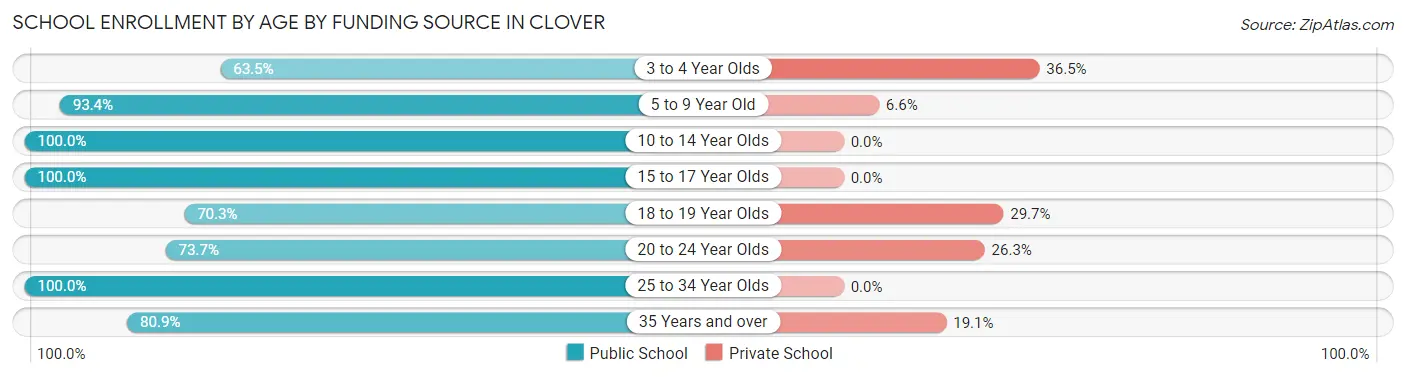
| Age Bracket | Public School | Private School |
| 3 to 4 Year Olds | 61 (63.5%) | 35 (36.5%) |
| 5 to 9 Year Old | 584 (93.4%) | 41 (6.6%) |
| 10 to 14 Year Olds | 468 (100.0%) | 0 (0.0%) |
| 15 to 17 Year Olds | 270 (100.0%) | 0 (0.0%) |
| 18 to 19 Year Olds | 26 (70.3%) | 11 (29.7%) |
| 20 to 24 Year Olds | 73 (73.7%) | 26 (26.3%) |
| 25 to 34 Year Olds | 45 (100.0%) | 0 (0.0%) |
| 35 Years and over | 182 (80.9%) | 43 (19.1%) |
| Total | 1,708 (91.6%) | 157 (8.4%) |
Educational Attainment by Field of Study in Clover
Business (341 | 28.3%), science & technology (172 | 14.3%), education (169 | 14.0%), arts & humanities (135 | 11.2%), and engineering (82 | 6.8%) are the most common fields of study among 1,206 individuals in Clover who have obtained a bachelor's degree or higher.
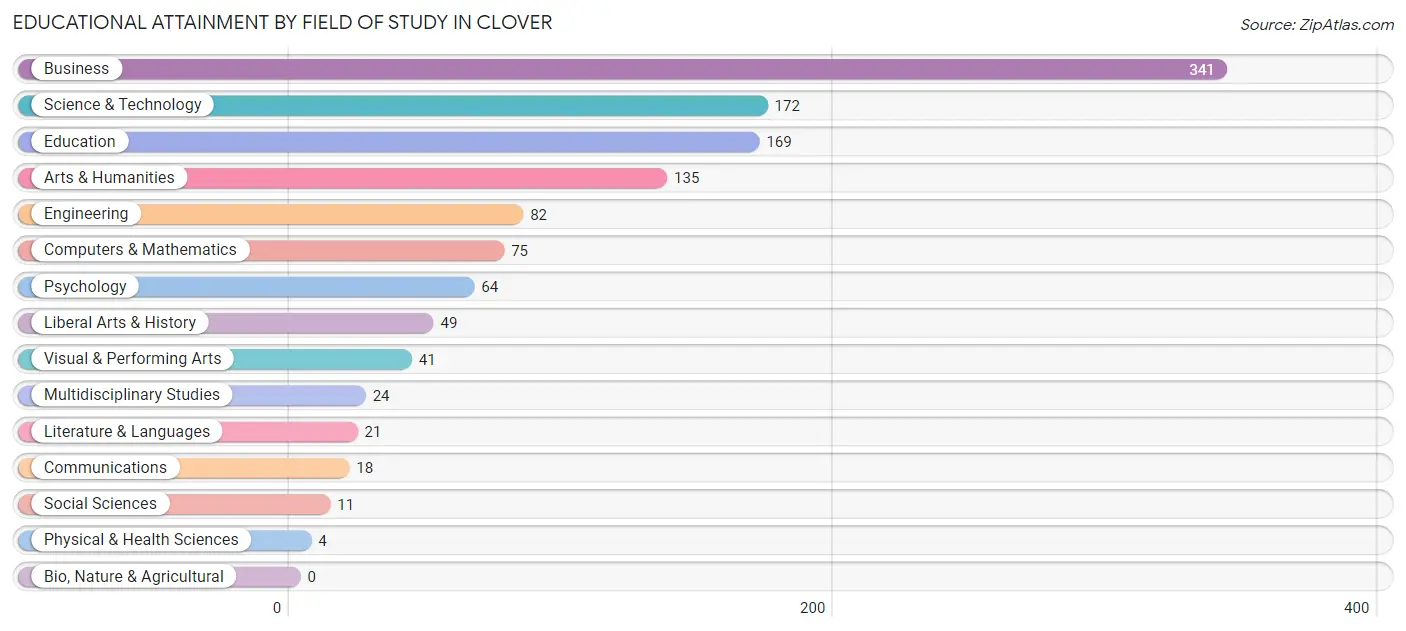
| Field of Study | # Graduates | % Graduates |
| Computers & Mathematics | 75 | 6.2% |
| Bio, Nature & Agricultural | 0 | 0.0% |
| Physical & Health Sciences | 4 | 0.3% |
| Psychology | 64 | 5.3% |
| Social Sciences | 11 | 0.9% |
| Engineering | 82 | 6.8% |
| Multidisciplinary Studies | 24 | 2.0% |
| Science & Technology | 172 | 14.3% |
| Business | 341 | 28.3% |
| Education | 169 | 14.0% |
| Literature & Languages | 21 | 1.7% |
| Liberal Arts & History | 49 | 4.1% |
| Visual & Performing Arts | 41 | 3.4% |
| Communications | 18 | 1.5% |
| Arts & Humanities | 135 | 11.2% |
| Total | 1,206 | 100.0% |
Transportation & Commute in Clover
Vehicle Availability by Sex in Clover
The most prevalent vehicle ownership categories in Clover are males with 2 vehicles (723, accounting for 45.9%) and females with 2 vehicles (638, making up 51.4%).
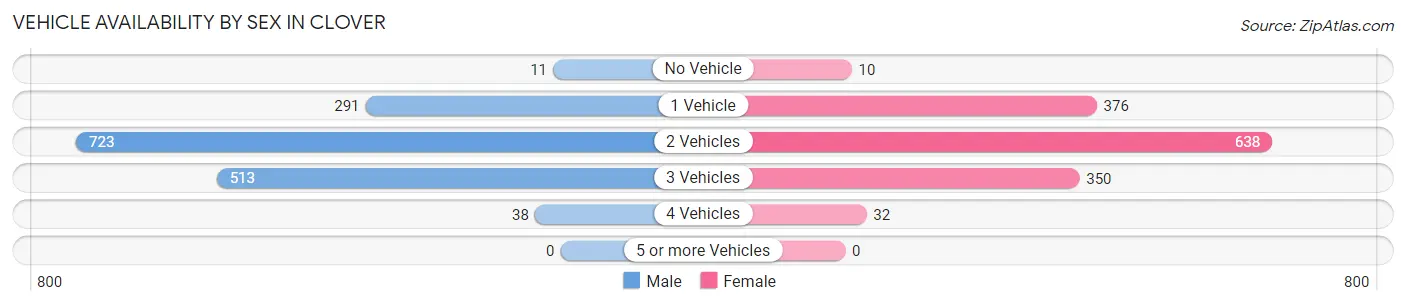
| Vehicles Available | Male | Female |
| No Vehicle | 11 (0.7%) | 10 (0.7%) |
| 1 Vehicle | 291 (18.5%) | 376 (26.7%) |
| 2 Vehicles | 723 (45.9%) | 638 (45.4%) |
| 3 Vehicles | 513 (32.6%) | 350 (24.9%) |
| 4 Vehicles | 38 (2.4%) | 32 (2.3%) |
| 5 or more Vehicles | 0 (0.0%) | 0 (0.0%) |
| Total | 1,576 (100.0%) | 1,406 (100.0%) |
Commute Time in Clover
The most frequently occuring commute durations in Clover are 45 to 59 minutes (573 commuters, 21.5%), 30 to 34 minutes (313 commuters, 11.8%), and 60 to 89 minutes (280 commuters, 10.5%).
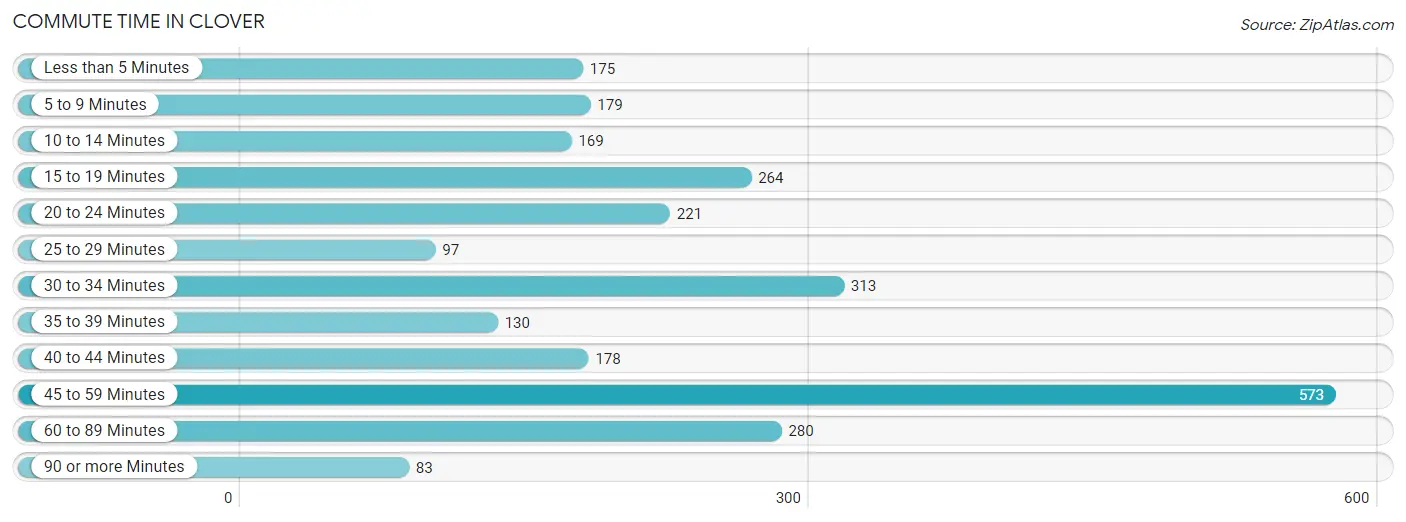
| Commute Time | # Commuters | % Commuters |
| Less than 5 Minutes | 175 | 6.6% |
| 5 to 9 Minutes | 179 | 6.7% |
| 10 to 14 Minutes | 169 | 6.4% |
| 15 to 19 Minutes | 264 | 9.9% |
| 20 to 24 Minutes | 221 | 8.3% |
| 25 to 29 Minutes | 97 | 3.6% |
| 30 to 34 Minutes | 313 | 11.8% |
| 35 to 39 Minutes | 130 | 4.9% |
| 40 to 44 Minutes | 178 | 6.7% |
| 45 to 59 Minutes | 573 | 21.5% |
| 60 to 89 Minutes | 280 | 10.5% |
| 90 or more Minutes | 83 | 3.1% |
Commute Time by Sex in Clover
The most common commute times in Clover are 45 to 59 minutes (302 commuters, 20.7%) for males and 45 to 59 minutes (271 commuters, 22.5%) for females.
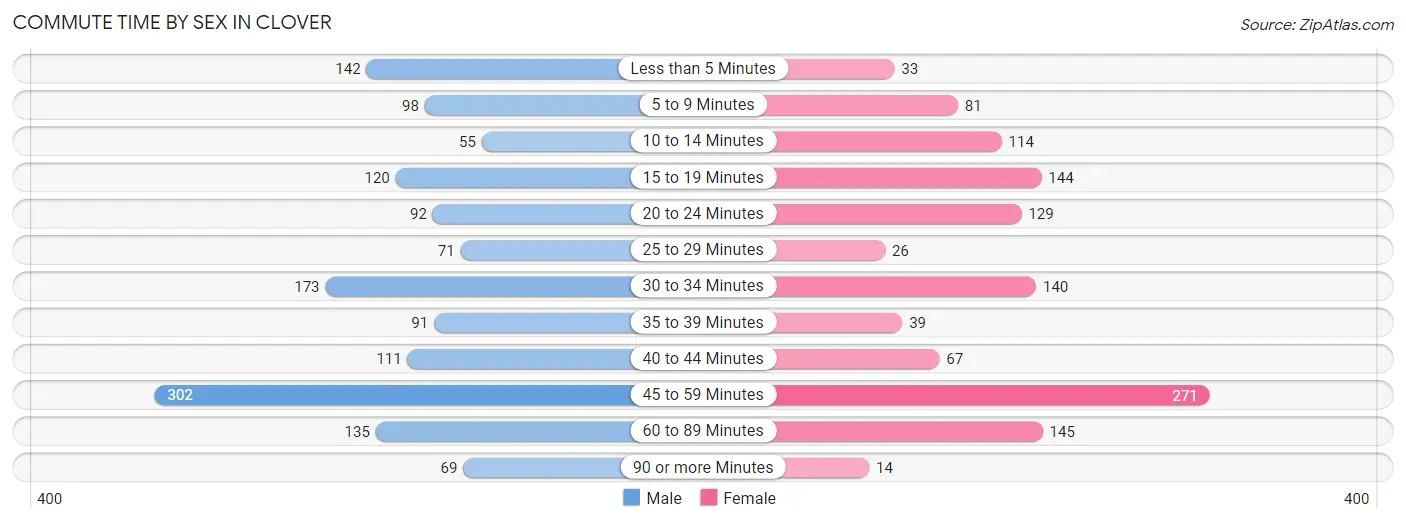
| Commute Time | Male | Female |
| Less than 5 Minutes | 142 (9.7%) | 33 (2.7%) |
| 5 to 9 Minutes | 98 (6.7%) | 81 (6.7%) |
| 10 to 14 Minutes | 55 (3.8%) | 114 (9.5%) |
| 15 to 19 Minutes | 120 (8.2%) | 144 (12.0%) |
| 20 to 24 Minutes | 92 (6.3%) | 129 (10.7%) |
| 25 to 29 Minutes | 71 (4.9%) | 26 (2.2%) |
| 30 to 34 Minutes | 173 (11.9%) | 140 (11.6%) |
| 35 to 39 Minutes | 91 (6.2%) | 39 (3.2%) |
| 40 to 44 Minutes | 111 (7.6%) | 67 (5.6%) |
| 45 to 59 Minutes | 302 (20.7%) | 271 (22.5%) |
| 60 to 89 Minutes | 135 (9.2%) | 145 (12.0%) |
| 90 or more Minutes | 69 (4.7%) | 14 (1.2%) |
Time of Departure to Work by Sex in Clover
The most frequent times of departure to work in Clover are 7:00 AM to 7:29 AM (385, 26.4%) for males and 7:00 AM to 7:29 AM (226, 18.8%) for females.
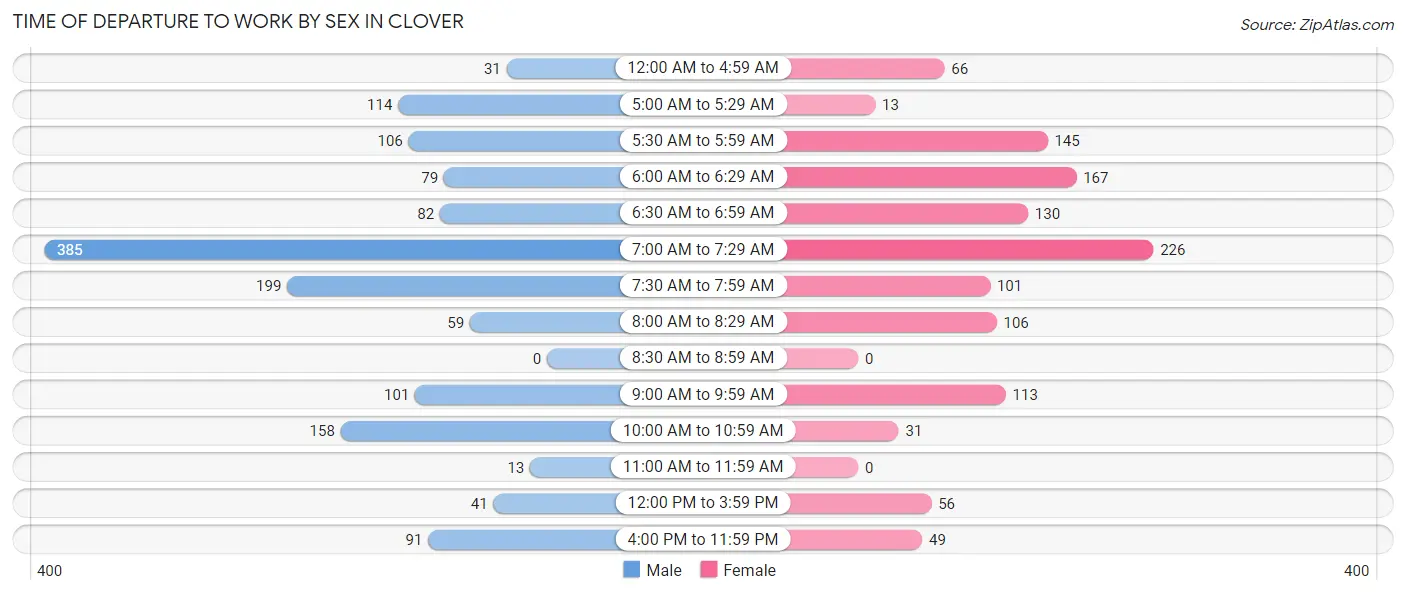
| Time of Departure | Male | Female |
| 12:00 AM to 4:59 AM | 31 (2.1%) | 66 (5.5%) |
| 5:00 AM to 5:29 AM | 114 (7.8%) | 13 (1.1%) |
| 5:30 AM to 5:59 AM | 106 (7.3%) | 145 (12.0%) |
| 6:00 AM to 6:29 AM | 79 (5.4%) | 167 (13.9%) |
| 6:30 AM to 6:59 AM | 82 (5.6%) | 130 (10.8%) |
| 7:00 AM to 7:29 AM | 385 (26.4%) | 226 (18.8%) |
| 7:30 AM to 7:59 AM | 199 (13.6%) | 101 (8.4%) |
| 8:00 AM to 8:29 AM | 59 (4.0%) | 106 (8.8%) |
| 8:30 AM to 8:59 AM | 0 (0.0%) | 0 (0.0%) |
| 9:00 AM to 9:59 AM | 101 (6.9%) | 113 (9.4%) |
| 10:00 AM to 10:59 AM | 158 (10.8%) | 31 (2.6%) |
| 11:00 AM to 11:59 AM | 13 (0.9%) | 0 (0.0%) |
| 12:00 PM to 3:59 PM | 41 (2.8%) | 56 (4.7%) |
| 4:00 PM to 11:59 PM | 91 (6.2%) | 49 (4.1%) |
| Total | 1,459 (100.0%) | 1,203 (100.0%) |
Housing Occupancy in Clover
Occupancy by Ownership in Clover
Of the total 2,656 dwellings in Clover, owner-occupied units account for 1,805 (68.0%), while renter-occupied units make up 851 (32.0%).
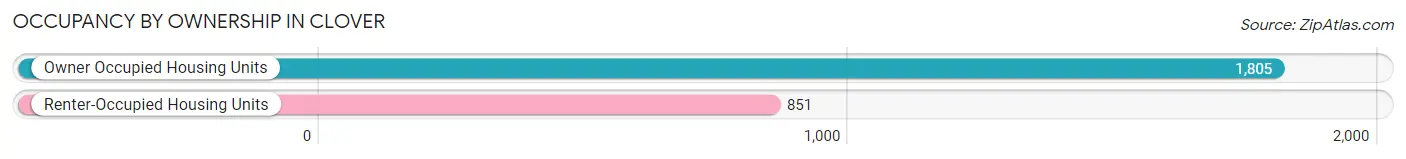
| Occupancy | # Housing Units | % Housing Units |
| Owner Occupied Housing Units | 1,805 | 68.0% |
| Renter-Occupied Housing Units | 851 | 32.0% |
| Total Occupied Housing Units | 2,656 | 100.0% |
Occupancy by Household Size in Clover
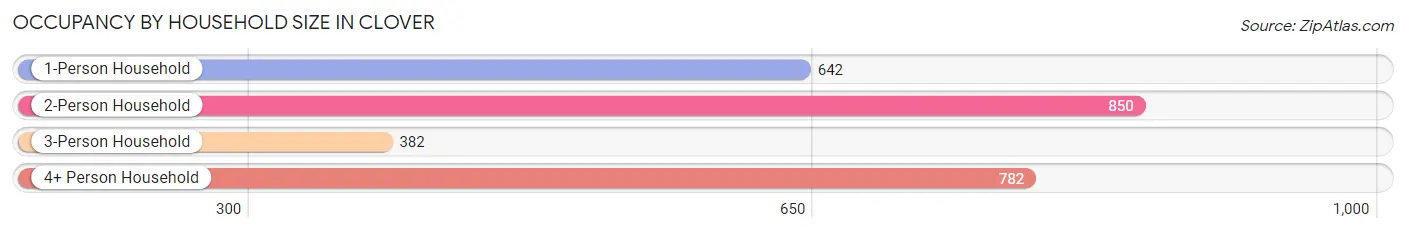
| Household Size | # Housing Units | % Housing Units |
| 1-Person Household | 642 | 24.2% |
| 2-Person Household | 850 | 32.0% |
| 3-Person Household | 382 | 14.4% |
| 4+ Person Household | 782 | 29.4% |
| Total Housing Units | 2,656 | 100.0% |
Occupancy by Ownership by Household Size in Clover
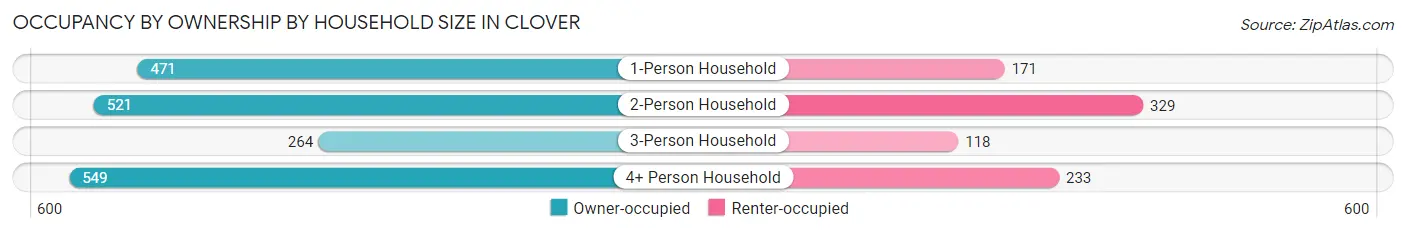
| Household Size | Owner-occupied | Renter-occupied |
| 1-Person Household | 471 (73.4%) | 171 (26.6%) |
| 2-Person Household | 521 (61.3%) | 329 (38.7%) |
| 3-Person Household | 264 (69.1%) | 118 (30.9%) |
| 4+ Person Household | 549 (70.2%) | 233 (29.8%) |
| Total Housing Units | 1,805 (68.0%) | 851 (32.0%) |
Occupancy by Educational Attainment in Clover
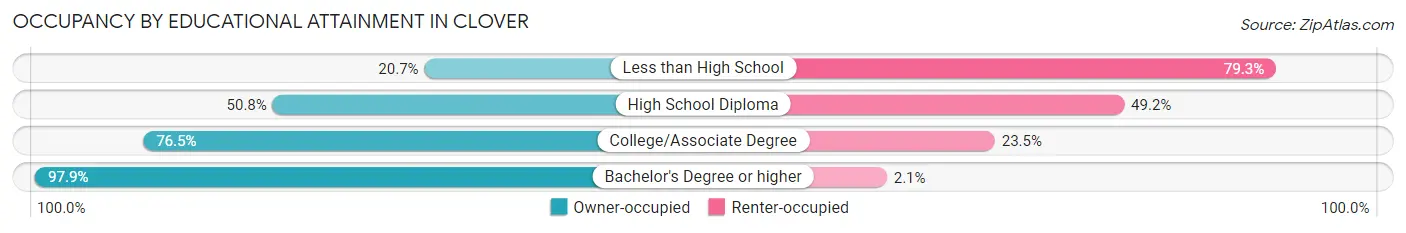
| Household Size | Owner-occupied | Renter-occupied |
| Less than High School | 80 (20.7%) | 306 (79.3%) |
| High School Diploma | 245 (50.8%) | 237 (49.2%) |
| College/Associate Degree | 966 (76.5%) | 297 (23.5%) |
| Bachelor's Degree or higher | 514 (97.9%) | 11 (2.1%) |
Occupancy by Age of Householder in Clover
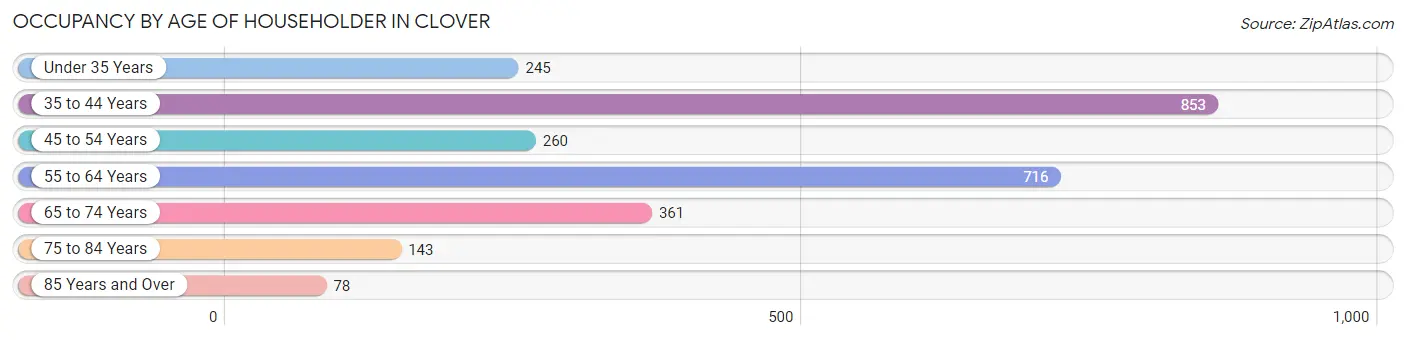
| Age Bracket | # Households | % Households |
| Under 35 Years | 245 | 9.2% |
| 35 to 44 Years | 853 | 32.1% |
| 45 to 54 Years | 260 | 9.8% |
| 55 to 64 Years | 716 | 27.0% |
| 65 to 74 Years | 361 | 13.6% |
| 75 to 84 Years | 143 | 5.4% |
| 85 Years and Over | 78 | 2.9% |
| Total | 2,656 | 100.0% |
Housing Finances in Clover
Median Income by Occupancy in Clover
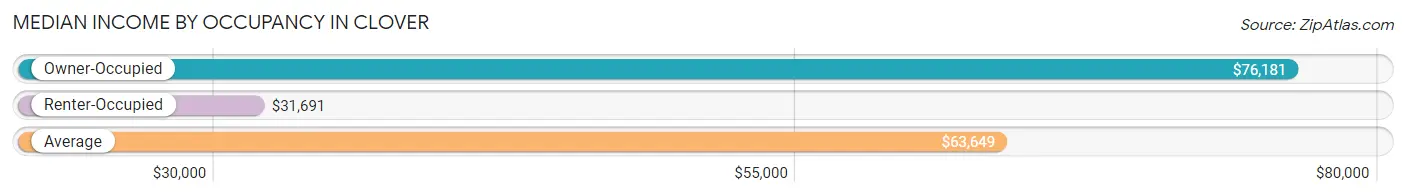
| Occupancy Type | # Households | Median Income |
| Owner-Occupied | 1,805 (68.0%) | $76,181 |
| Renter-Occupied | 851 (32.0%) | $31,691 |
| Average | 2,656 (100.0%) | $63,649 |
Occupancy by Householder Income Bracket in Clover
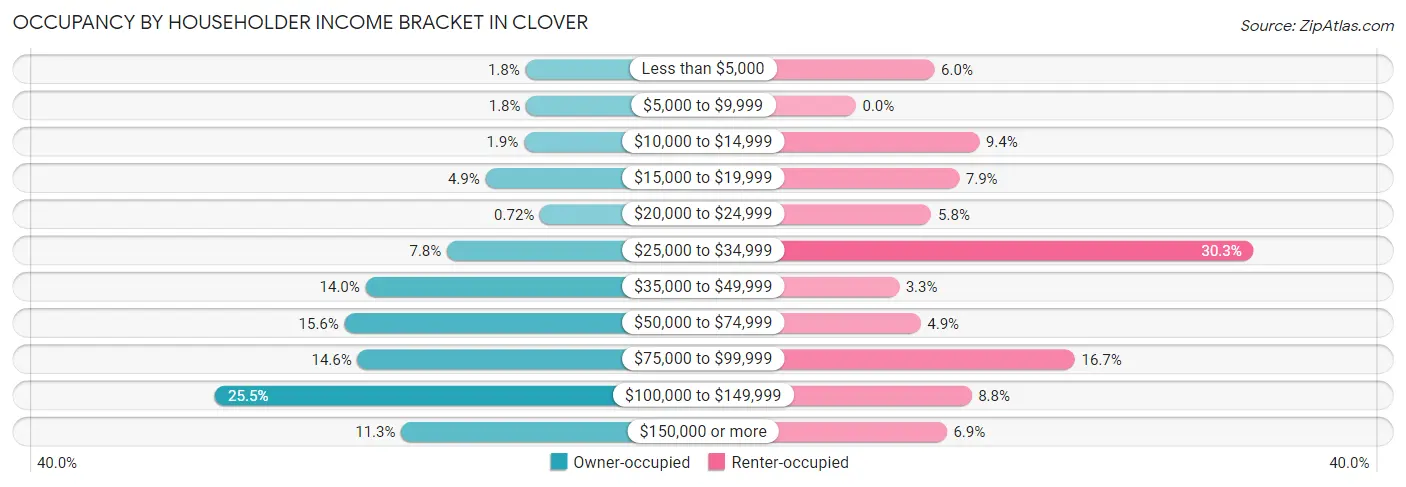
| Income Bracket | Owner-occupied | Renter-occupied |
| Less than $5,000 | 33 (1.8%) | 51 (6.0%) |
| $5,000 to $9,999 | 32 (1.8%) | 0 (0.0%) |
| $10,000 to $14,999 | 35 (1.9%) | 80 (9.4%) |
| $15,000 to $19,999 | 88 (4.9%) | 67 (7.9%) |
| $20,000 to $24,999 | 13 (0.7%) | 49 (5.8%) |
| $25,000 to $34,999 | 141 (7.8%) | 258 (30.3%) |
| $35,000 to $49,999 | 253 (14.0%) | 28 (3.3%) |
| $50,000 to $74,999 | 282 (15.6%) | 42 (4.9%) |
| $75,000 to $99,999 | 264 (14.6%) | 142 (16.7%) |
| $100,000 to $149,999 | 460 (25.5%) | 75 (8.8%) |
| $150,000 or more | 204 (11.3%) | 59 (6.9%) |
| Total | 1,805 (100.0%) | 851 (100.0%) |
Monthly Housing Cost Tiers in Clover
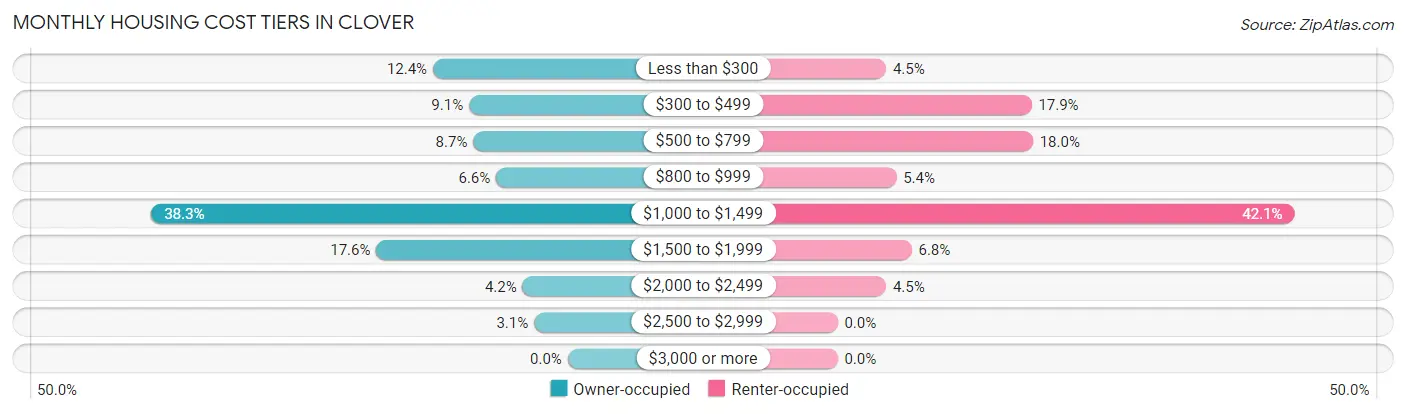
| Monthly Cost | Owner-occupied | Renter-occupied |
| Less than $300 | 224 (12.4%) | 38 (4.5%) |
| $300 to $499 | 164 (9.1%) | 152 (17.9%) |
| $500 to $799 | 157 (8.7%) | 153 (18.0%) |
| $800 to $999 | 119 (6.6%) | 46 (5.4%) |
| $1,000 to $1,499 | 692 (38.3%) | 358 (42.1%) |
| $1,500 to $1,999 | 318 (17.6%) | 58 (6.8%) |
| $2,000 to $2,499 | 75 (4.2%) | 38 (4.5%) |
| $2,500 to $2,999 | 56 (3.1%) | 0 (0.0%) |
| $3,000 or more | 0 (0.0%) | 0 (0.0%) |
| Total | 1,805 (100.0%) | 851 (100.0%) |
Physical Housing Characteristics in Clover
Housing Structures in Clover
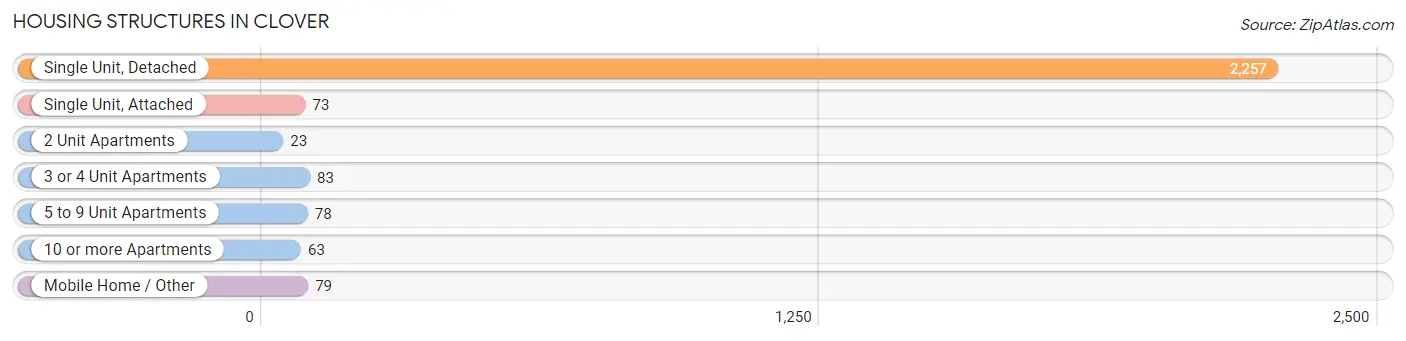
| Structure Type | # Housing Units | % Housing Units |
| Single Unit, Detached | 2,257 | 85.0% |
| Single Unit, Attached | 73 | 2.8% |
| 2 Unit Apartments | 23 | 0.9% |
| 3 or 4 Unit Apartments | 83 | 3.1% |
| 5 to 9 Unit Apartments | 78 | 2.9% |
| 10 or more Apartments | 63 | 2.4% |
| Mobile Home / Other | 79 | 3.0% |
| Total | 2,656 | 100.0% |
Housing Structures by Occupancy in Clover
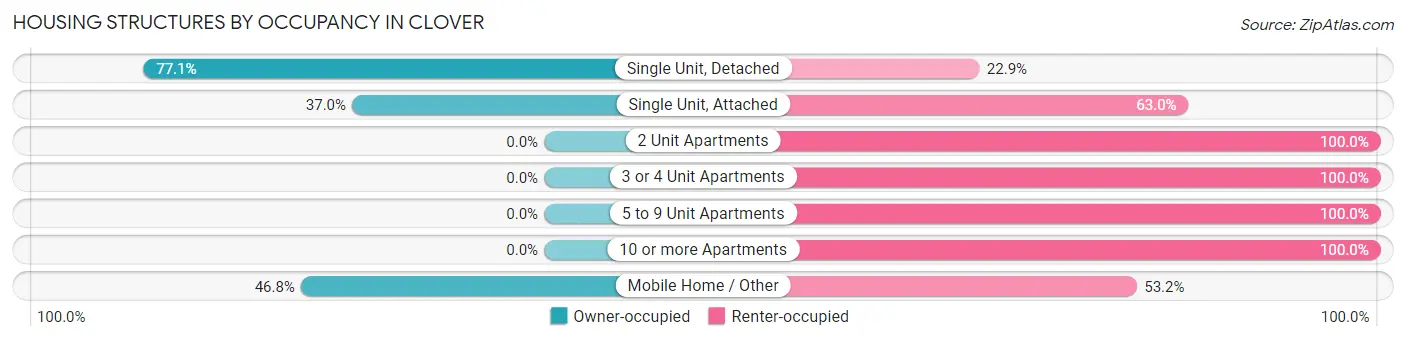
| Structure Type | Owner-occupied | Renter-occupied |
| Single Unit, Detached | 1,741 (77.1%) | 516 (22.9%) |
| Single Unit, Attached | 27 (37.0%) | 46 (63.0%) |
| 2 Unit Apartments | 0 (0.0%) | 23 (100.0%) |
| 3 or 4 Unit Apartments | 0 (0.0%) | 83 (100.0%) |
| 5 to 9 Unit Apartments | 0 (0.0%) | 78 (100.0%) |
| 10 or more Apartments | 0 (0.0%) | 63 (100.0%) |
| Mobile Home / Other | 37 (46.8%) | 42 (53.2%) |
| Total | 1,805 (68.0%) | 851 (32.0%) |
Housing Structures by Number of Rooms in Clover
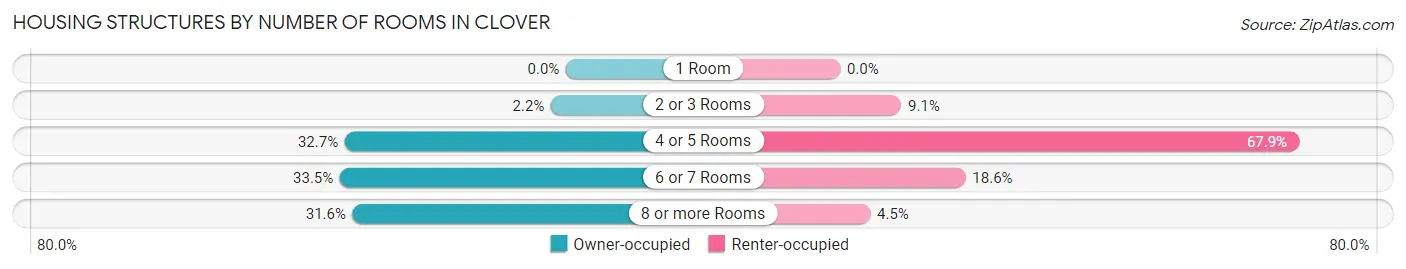
| Number of Rooms | Owner-occupied | Renter-occupied |
| 1 Room | 0 (0.0%) | 0 (0.0%) |
| 2 or 3 Rooms | 40 (2.2%) | 77 (9.0%) |
| 4 or 5 Rooms | 591 (32.7%) | 578 (67.9%) |
| 6 or 7 Rooms | 604 (33.5%) | 158 (18.6%) |
| 8 or more Rooms | 570 (31.6%) | 38 (4.5%) |
| Total | 1,805 (100.0%) | 851 (100.0%) |
Housing Structure by Heating Type in Clover
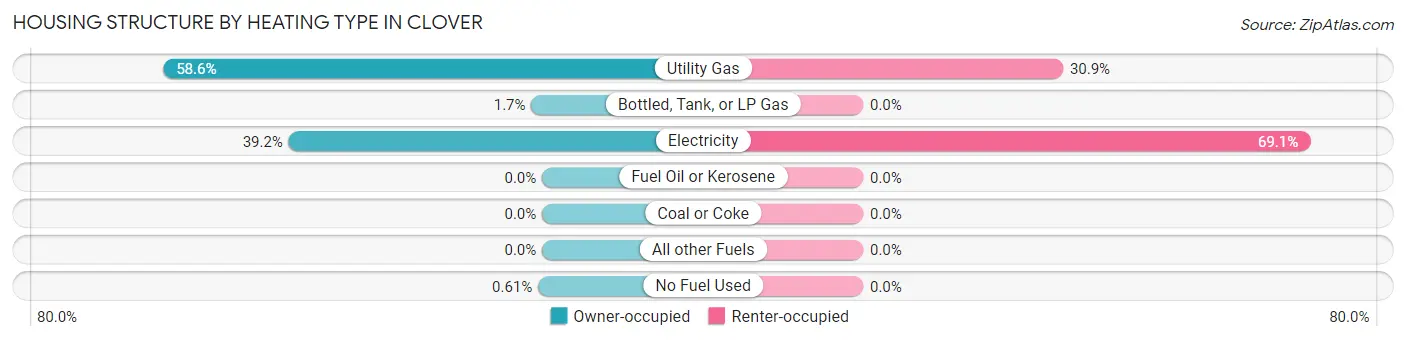
| Heating Type | Owner-occupied | Renter-occupied |
| Utility Gas | 1,057 (58.6%) | 263 (30.9%) |
| Bottled, Tank, or LP Gas | 30 (1.7%) | 0 (0.0%) |
| Electricity | 707 (39.2%) | 588 (69.1%) |
| Fuel Oil or Kerosene | 0 (0.0%) | 0 (0.0%) |
| Coal or Coke | 0 (0.0%) | 0 (0.0%) |
| All other Fuels | 0 (0.0%) | 0 (0.0%) |
| No Fuel Used | 11 (0.6%) | 0 (0.0%) |
| Total | 1,805 (100.0%) | 851 (100.0%) |
Household Vehicle Usage in Clover
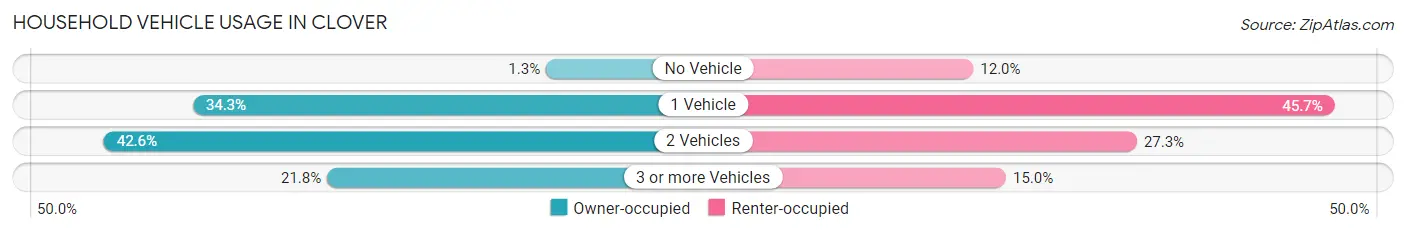
| Vehicles per Household | Owner-occupied | Renter-occupied |
| No Vehicle | 24 (1.3%) | 102 (12.0%) |
| 1 Vehicle | 619 (34.3%) | 389 (45.7%) |
| 2 Vehicles | 769 (42.6%) | 232 (27.3%) |
| 3 or more Vehicles | 393 (21.8%) | 128 (15.0%) |
| Total | 1,805 (100.0%) | 851 (100.0%) |
Real Estate & Mortgages in Clover
Real Estate and Mortgage Overview in Clover
| Characteristic | Without Mortgage | With Mortgage |
| Housing Units | 485 | 1,320 |
| Median Property Value | $161,200 | $224,900 |
| Median Household Income | $51,964 | $189 |
| Monthly Housing Costs | $348 | $0 |
| Real Estate Taxes | $819 | $70 |
Property Value by Mortgage Status in Clover
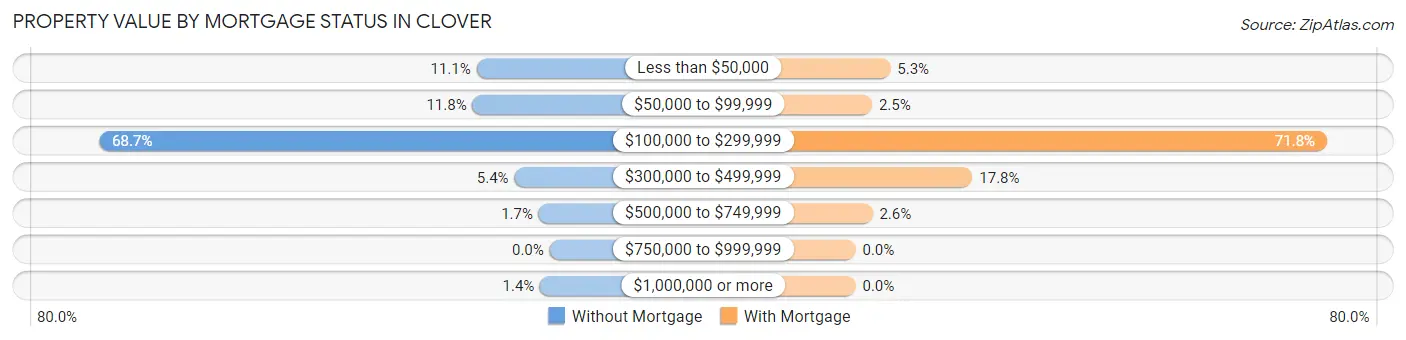
| Property Value | Without Mortgage | With Mortgage |
| Less than $50,000 | 54 (11.1%) | 70 (5.3%) |
| $50,000 to $99,999 | 57 (11.7%) | 33 (2.5%) |
| $100,000 to $299,999 | 333 (68.7%) | 948 (71.8%) |
| $300,000 to $499,999 | 26 (5.4%) | 235 (17.8%) |
| $500,000 to $749,999 | 8 (1.7%) | 34 (2.6%) |
| $750,000 to $999,999 | 0 (0.0%) | 0 (0.0%) |
| $1,000,000 or more | 7 (1.4%) | 0 (0.0%) |
| Total | 485 (100.0%) | 1,320 (100.0%) |
Household Income by Mortgage Status in Clover
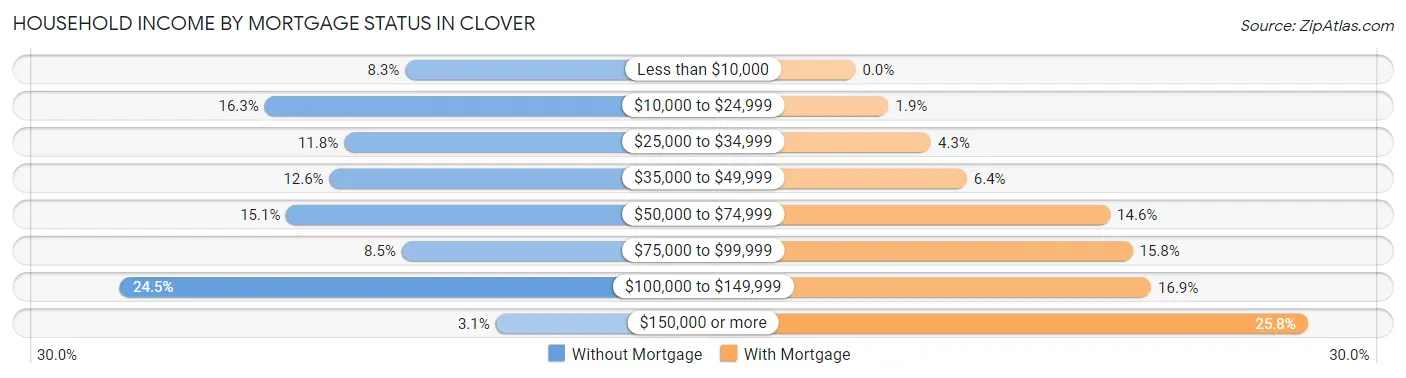
| Household Income | Without Mortgage | With Mortgage |
| Less than $10,000 | 40 (8.3%) | 0 (0.0%) |
| $10,000 to $24,999 | 79 (16.3%) | 25 (1.9%) |
| $25,000 to $34,999 | 57 (11.7%) | 57 (4.3%) |
| $35,000 to $49,999 | 61 (12.6%) | 84 (6.4%) |
| $50,000 to $74,999 | 73 (15.0%) | 192 (14.5%) |
| $75,000 to $99,999 | 41 (8.5%) | 209 (15.8%) |
| $100,000 to $149,999 | 119 (24.5%) | 223 (16.9%) |
| $150,000 or more | 15 (3.1%) | 341 (25.8%) |
| Total | 485 (100.0%) | 1,320 (100.0%) |
Property Value to Household Income Ratio in Clover
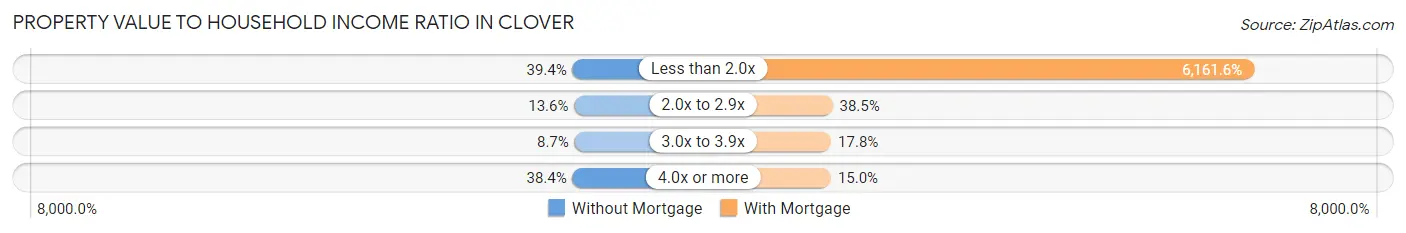
| Value-to-Income Ratio | Without Mortgage | With Mortgage |
| Less than 2.0x | 191 (39.4%) | 81,333 (6,161.6%) |
| 2.0x to 2.9x | 66 (13.6%) | 508 (38.5%) |
| 3.0x to 3.9x | 42 (8.7%) | 235 (17.8%) |
| 4.0x or more | 186 (38.4%) | 198 (15.0%) |
| Total | 485 (100.0%) | 1,320 (100.0%) |
Real Estate Taxes by Mortgage Status in Clover
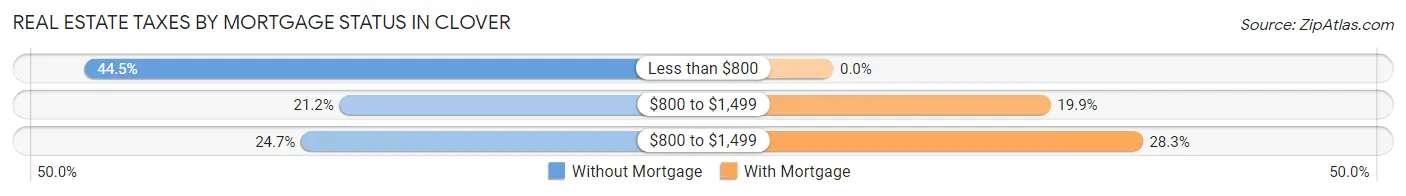
| Property Taxes | Without Mortgage | With Mortgage |
| Less than $800 | 216 (44.5%) | 0 (0.0%) |
| $800 to $1,499 | 103 (21.2%) | 262 (19.9%) |
| $800 to $1,499 | 120 (24.7%) | 373 (28.3%) |
| Total | 485 (100.0%) | 1,320 (100.0%) |
Health & Disability in Clover
Health Insurance Coverage by Age in Clover
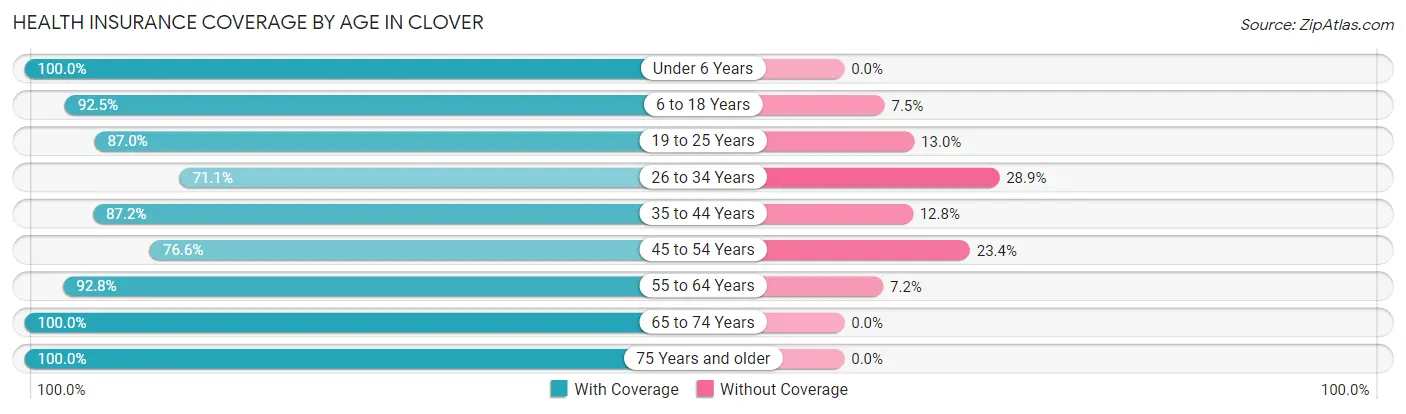
| Age Bracket | With Coverage | Without Coverage |
| Under 6 Years | 676 (100.0%) | 0 (0.0%) |
| 6 to 18 Years | 1,244 (92.5%) | 101 (7.5%) |
| 19 to 25 Years | 347 (87.0%) | 52 (13.0%) |
| 26 to 34 Years | 507 (71.1%) | 206 (28.9%) |
| 35 to 44 Years | 1,169 (87.2%) | 171 (12.8%) |
| 45 to 54 Years | 478 (76.6%) | 146 (23.4%) |
| 55 to 64 Years | 860 (92.8%) | 67 (7.2%) |
| 65 to 74 Years | 510 (100.0%) | 0 (0.0%) |
| 75 Years and older | 266 (100.0%) | 0 (0.0%) |
| Total | 6,057 (89.1%) | 743 (10.9%) |
Health Insurance Coverage by Citizenship Status in Clover
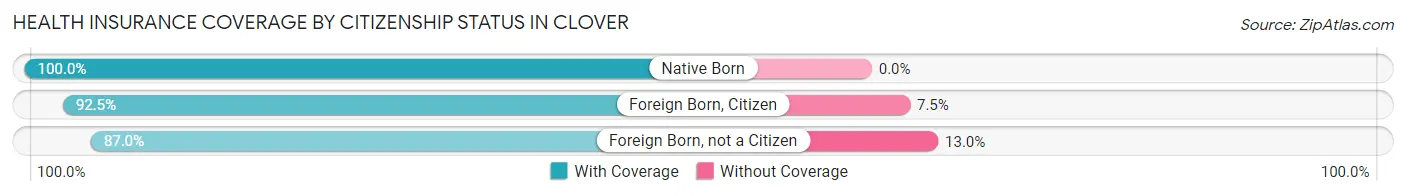
| Citizenship Status | With Coverage | Without Coverage |
| Native Born | 676 (100.0%) | 0 (0.0%) |
| Foreign Born, Citizen | 1,244 (92.5%) | 101 (7.5%) |
| Foreign Born, not a Citizen | 347 (87.0%) | 52 (13.0%) |
Health Insurance Coverage by Household Income in Clover
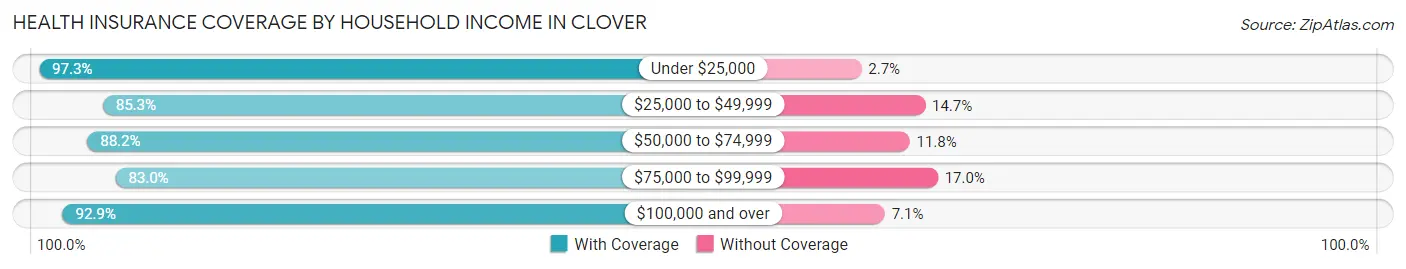
| Household Income | With Coverage | Without Coverage |
| Under $25,000 | 678 (97.3%) | 19 (2.7%) |
| $25,000 to $49,999 | 1,170 (85.3%) | 201 (14.7%) |
| $50,000 to $74,999 | 690 (88.2%) | 92 (11.8%) |
| $75,000 to $99,999 | 1,140 (83.0%) | 234 (17.0%) |
| $100,000 and over | 2,366 (92.9%) | 181 (7.1%) |
Public vs Private Health Insurance Coverage by Age in Clover
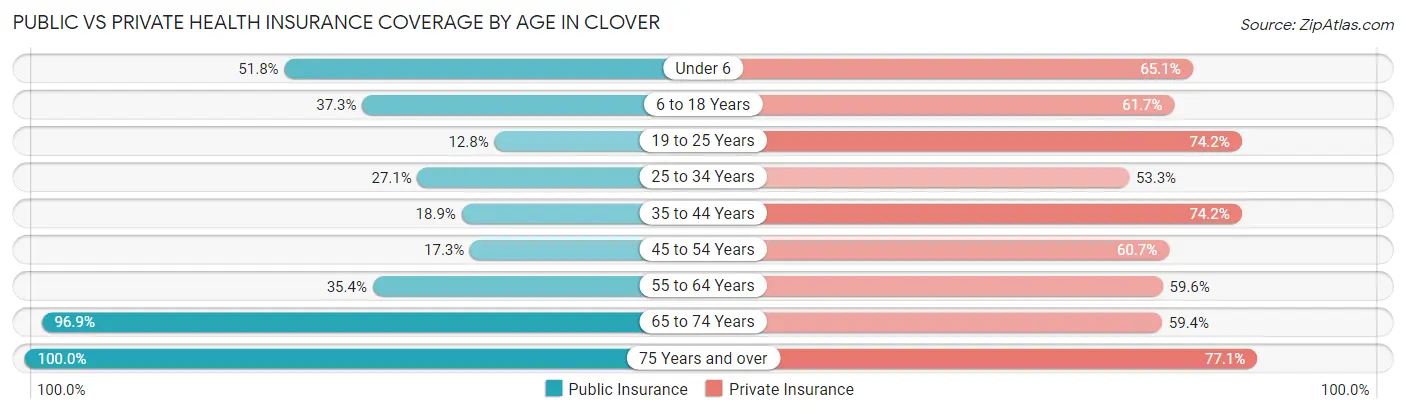
| Age Bracket | Public Insurance | Private Insurance |
| Under 6 | 350 (51.8%) | 440 (65.1%) |
| 6 to 18 Years | 502 (37.3%) | 830 (61.7%) |
| 19 to 25 Years | 51 (12.8%) | 296 (74.2%) |
| 25 to 34 Years | 193 (27.1%) | 380 (53.3%) |
| 35 to 44 Years | 253 (18.9%) | 994 (74.2%) |
| 45 to 54 Years | 108 (17.3%) | 379 (60.7%) |
| 55 to 64 Years | 328 (35.4%) | 552 (59.6%) |
| 65 to 74 Years | 494 (96.9%) | 303 (59.4%) |
| 75 Years and over | 266 (100.0%) | 205 (77.1%) |
| Total | 2,545 (37.4%) | 4,379 (64.4%) |
Disability Status by Sex by Age in Clover
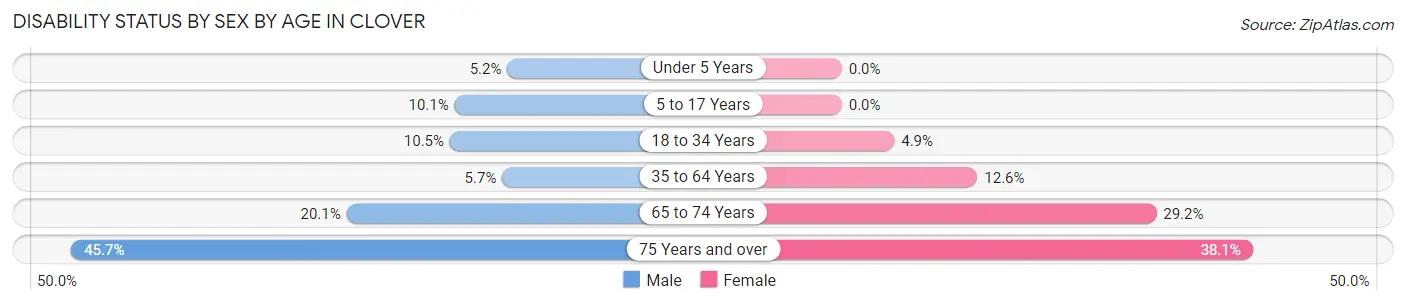
| Age Bracket | Male | Female |
| Under 5 Years | 21 (5.2%) | 0 (0.0%) |
| 5 to 17 Years | 80 (10.1%) | 0 (0.0%) |
| 18 to 34 Years | 64 (10.5%) | 27 (4.9%) |
| 35 to 64 Years | 80 (5.7%) | 186 (12.6%) |
| 65 to 74 Years | 33 (20.1%) | 101 (29.2%) |
| 75 Years and over | 58 (45.7%) | 53 (38.1%) |
Disability Class by Sex by Age in Clover
Disability Class: Hearing Difficulty
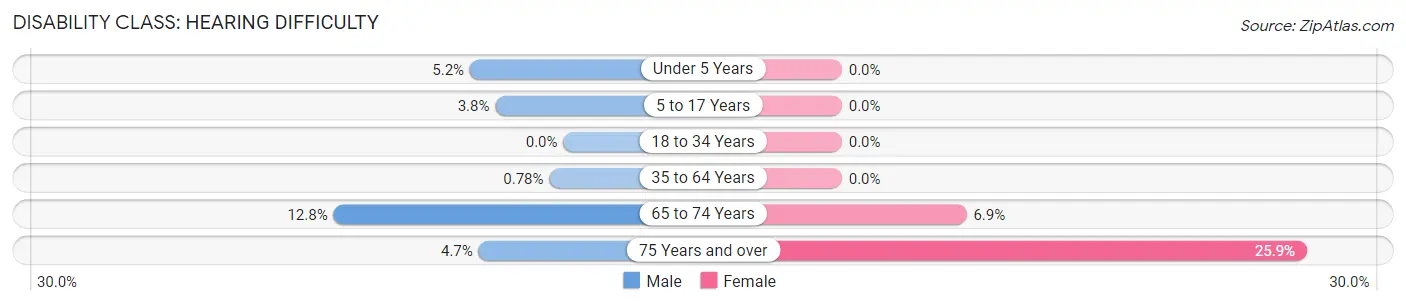
| Age Bracket | Male | Female |
| Under 5 Years | 21 (5.2%) | 0 (0.0%) |
| 5 to 17 Years | 30 (3.8%) | 0 (0.0%) |
| 18 to 34 Years | 0 (0.0%) | 0 (0.0%) |
| 35 to 64 Years | 11 (0.8%) | 0 (0.0%) |
| 65 to 74 Years | 21 (12.8%) | 24 (6.9%) |
| 75 Years and over | 6 (4.7%) | 36 (25.9%) |
Disability Class: Vision Difficulty
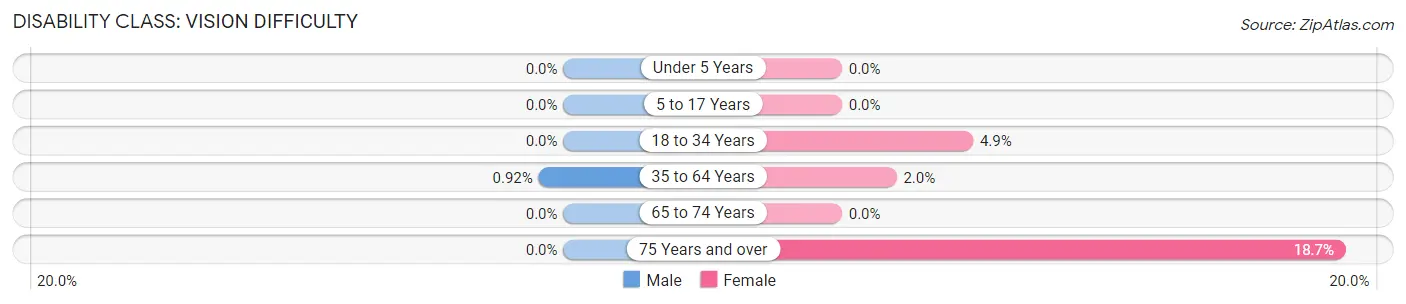
| Age Bracket | Male | Female |
| Under 5 Years | 0 (0.0%) | 0 (0.0%) |
| 5 to 17 Years | 0 (0.0%) | 0 (0.0%) |
| 18 to 34 Years | 0 (0.0%) | 27 (4.9%) |
| 35 to 64 Years | 13 (0.9%) | 30 (2.0%) |
| 65 to 74 Years | 0 (0.0%) | 0 (0.0%) |
| 75 Years and over | 0 (0.0%) | 26 (18.7%) |
Disability Class: Cognitive Difficulty
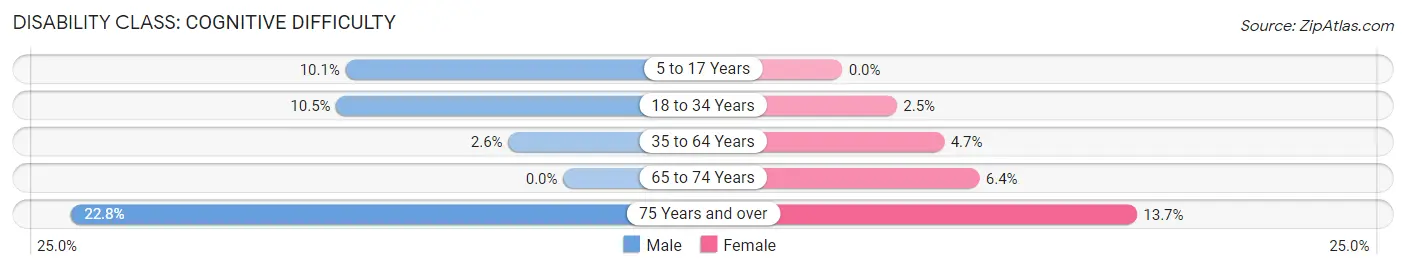
| Age Bracket | Male | Female |
| 5 to 17 Years | 80 (10.1%) | 0 (0.0%) |
| 18 to 34 Years | 64 (10.5%) | 14 (2.5%) |
| 35 to 64 Years | 36 (2.5%) | 70 (4.7%) |
| 65 to 74 Years | 0 (0.0%) | 22 (6.4%) |
| 75 Years and over | 29 (22.8%) | 19 (13.7%) |
Disability Class: Ambulatory Difficulty
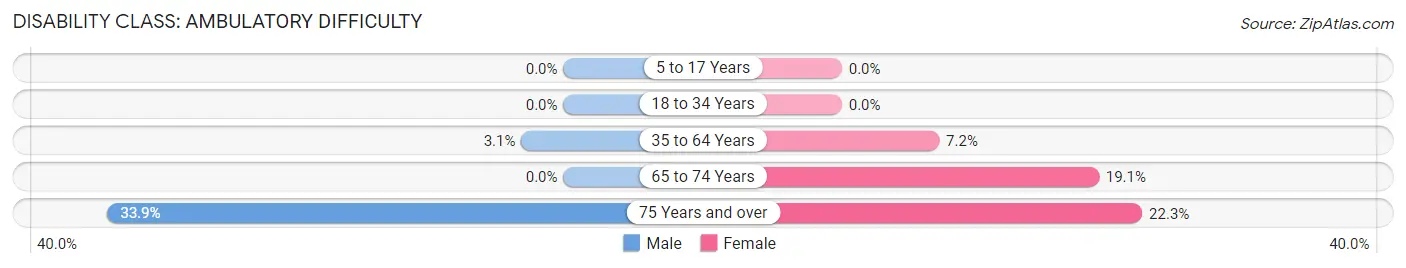
| Age Bracket | Male | Female |
| 5 to 17 Years | 0 (0.0%) | 0 (0.0%) |
| 18 to 34 Years | 0 (0.0%) | 0 (0.0%) |
| 35 to 64 Years | 44 (3.1%) | 107 (7.2%) |
| 65 to 74 Years | 0 (0.0%) | 66 (19.1%) |
| 75 Years and over | 43 (33.9%) | 31 (22.3%) |
Disability Class: Self-Care Difficulty
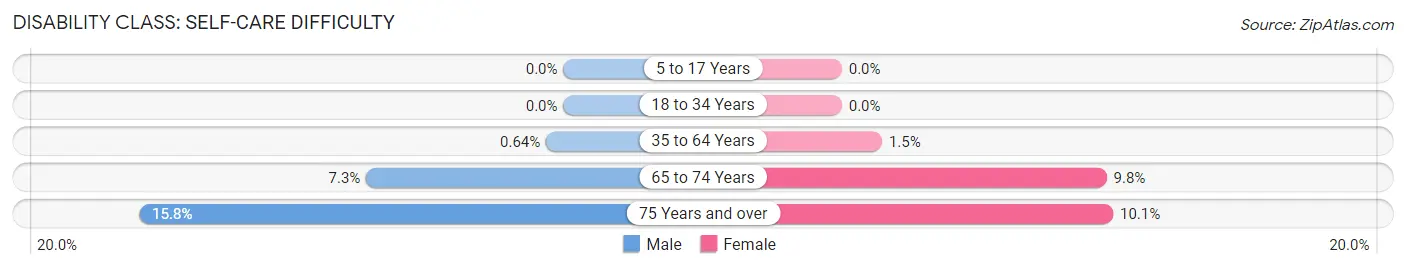
| Age Bracket | Male | Female |
| 5 to 17 Years | 0 (0.0%) | 0 (0.0%) |
| 18 to 34 Years | 0 (0.0%) | 0 (0.0%) |
| 35 to 64 Years | 9 (0.6%) | 22 (1.5%) |
| 65 to 74 Years | 12 (7.3%) | 34 (9.8%) |
| 75 Years and over | 20 (15.8%) | 14 (10.1%) |
Technology Access in Clover
Computing Device Access in Clover
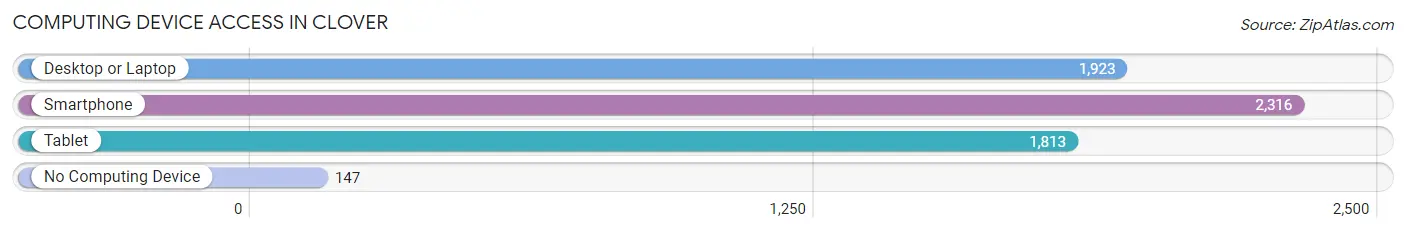
| Device Type | # Households | % Households |
| Desktop or Laptop | 1,923 | 72.4% |
| Smartphone | 2,316 | 87.2% |
| Tablet | 1,813 | 68.3% |
| No Computing Device | 147 | 5.5% |
| Total | 2,656 | 100.0% |
Internet Access in Clover
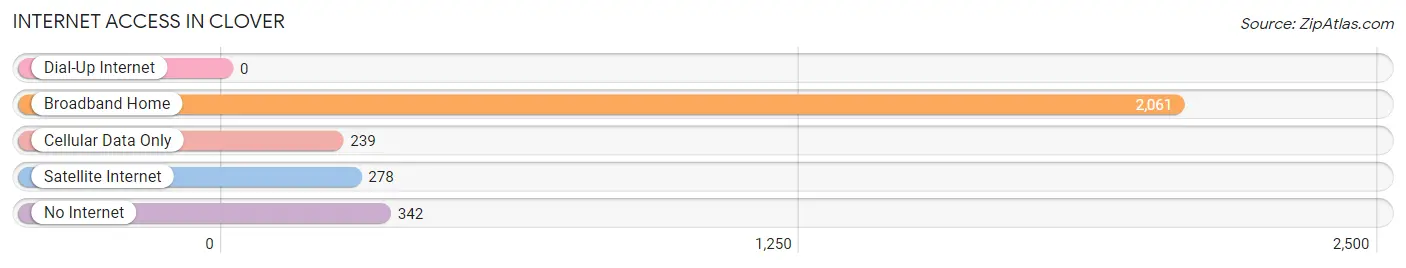
| Internet Type | # Households | % Households |
| Dial-Up Internet | 0 | 0.0% |
| Broadband Home | 2,061 | 77.6% |
| Cellular Data Only | 239 | 9.0% |
| Satellite Internet | 278 | 10.5% |
| No Internet | 342 | 12.9% |
| Total | 2,656 | 100.0% |
Clover Summary
Clover, South Carolina is a small town located in York County, South Carolina. It is situated in the northwest corner of the state, approximately 20 miles south of Charlotte, North Carolina. The town was founded in 1877 and is named after the clover fields that were once abundant in the area. Clover is a rural community with a population of approximately 5,000 people.
Geography
Clover is located in the Piedmont region of South Carolina, which is characterized by rolling hills and flat plains. The town is situated on the banks of the Catawba River, which provides a source of recreation for the residents. The town is surrounded by several small towns and cities, including York, Rock Hill, and Gastonia, North Carolina. The town is also located near Lake Wylie, which is a popular destination for fishing and boating.
Economy
Clover’s economy is largely based on agriculture and manufacturing. The town is home to several large farms, which produce a variety of crops, including corn, soybeans, and cotton. Clover is also home to several manufacturing companies, including a paper mill, a furniture factory, and a plastics plant. The town is also home to several small businesses, including restaurants, retail stores, and service providers.
Demographics
As of the 2010 census, the population of Clover was 5,094. The racial makeup of the town was 87.3% White, 8.2% African American, 0.5% Native American, 0.7% Asian, and 2.3% from other races. The median household income was $41,945, and the median family income was $50,945. The town’s population is largely Christian, with the majority of residents belonging to the Baptist and Methodist denominations.
Conclusion
Clover, South Carolina is a small rural town located in the northwest corner of the state. The town is situated on the banks of the Catawba River and is surrounded by several small towns and cities. The town’s economy is largely based on agriculture and manufacturing, and the population is largely Christian. Clover is a peaceful and welcoming community that offers its residents a unique and enjoyable quality of life.
Common Questions
What is Per Capita Income in Clover?
Per Capita income in Clover is $30,932.
What is the Median Family Income in Clover?
Median Family Income in Clover is $77,771.
What is the Median Household income in Clover?
Median Household Income in Clover is $63,649.
What is Income or Wage Gap in Clover?
Income or Wage Gap in Clover is 3.7%.
Women in Clover earn 96.3 cents for every dollar earned by a man.
What is Inequality or Gini Index in Clover?
Inequality or Gini Index in Clover is 0.44.
What is the Total Population of Clover?
Total Population of Clover is 6,800.
What is the Total Male Population of Clover?
Total Male Population of Clover is 3,507.
What is the Total Female Population of Clover?
Total Female Population of Clover is 3,293.
What is the Ratio of Males per 100 Females in Clover?
There are 106.50 Males per 100 Females in Clover.
What is the Ratio of Females per 100 Males in Clover?
There are 93.90 Females per 100 Males in Clover.
What is the Median Population Age in Clover?
Median Population Age in Clover is 36.5 Years.
What is the Average Family Size in Clover
Average Family Size in Clover is 3.0 People.
What is the Average Household Size in Clover
Average Household Size in Clover is 2.5 People.
How Large is the Labor Force in Clover?
There are 3,318 People in the Labor Forcein in Clover.
What is the Percentage of People in the Labor Force in Clover?
65.5% of People are in the Labor Force in Clover.
What is the Unemployment Rate in Clover?
Unemployment Rate in Clover is 8.9%.