Boonsboro, MD Map & Demographics
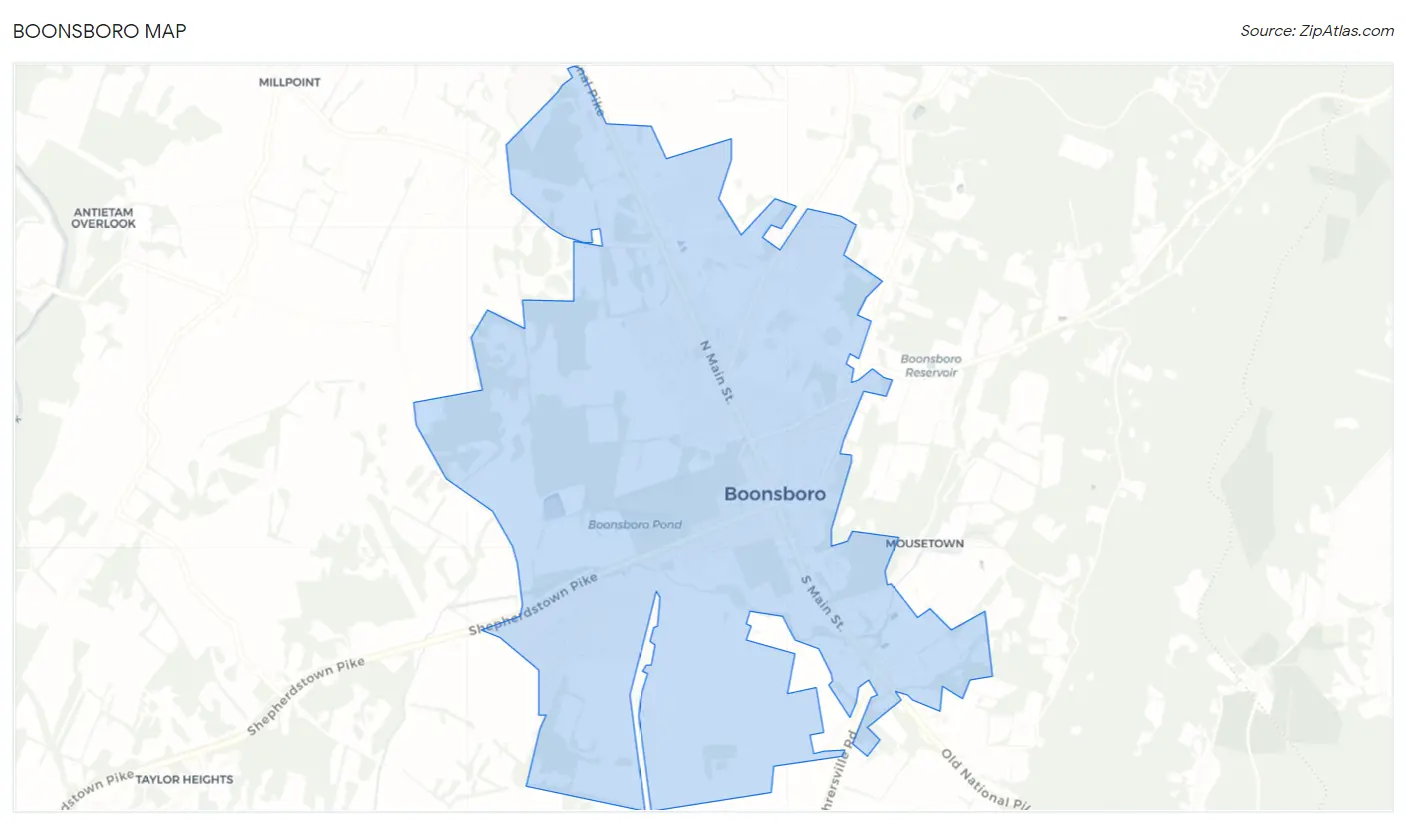
Boonsboro Map
Boonsboro Overview
$41,004
PER CAPITA INCOME
$116,944
AVG FAMILY INCOME
$96,111
AVG HOUSEHOLD INCOME
15.7%
WAGE / INCOME GAP [ % ]
84.3¢/ $1
WAGE / INCOME GAP [ $ ]
0.35
INEQUALITY / GINI INDEX
3,785
TOTAL POPULATION
2,224
MALE POPULATION
1,561
FEMALE POPULATION
142.47
MALES / 100 FEMALES
70.19
FEMALES / 100 MALES
38.5
MEDIAN AGE
2.8
AVG FAMILY SIZE
2.5
AVG HOUSEHOLD SIZE
1,930
LABOR FORCE [ PEOPLE ]
69.6%
PERCENT IN LABOR FORCE
3.5%
UNEMPLOYMENT RATE
Boonsboro Zip Codes
Boonsboro Area Codes
Income in Boonsboro
Income Overview in Boonsboro
Per Capita Income in Boonsboro is $41,004, while median incomes of families and households are $116,944 and $96,111 respectively.
| Characteristic | Number | Measure |
| Per Capita Income | 3,785 | $41,004 |
| Median Family Income | 1,144 | $116,944 |
| Mean Family Income | 1,144 | $113,559 |
| Median Household Income | 1,438 | $96,111 |
| Mean Household Income | 1,438 | $105,916 |
| Income Deficit | 1,144 | $0 |
| Wage / Income Gap (%) | 3,785 | 15.67% |
| Wage / Income Gap ($) | 3,785 | 84.33¢ per $1 |
| Gini / Inequality Index | 3,785 | 0.35 |
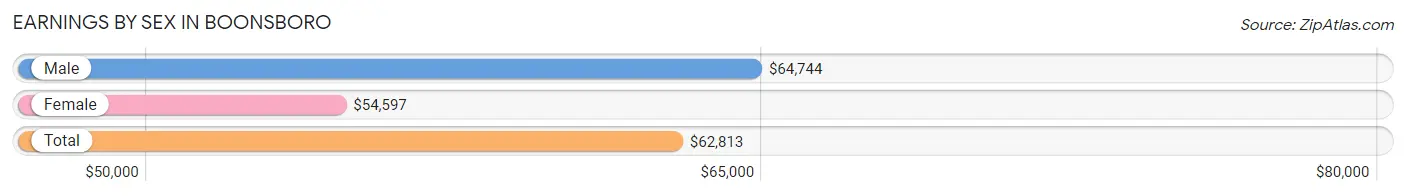
Earnings by Sex in Boonsboro
Average Earnings in Boonsboro are $62,813, $64,744 for men and $54,597 for women, a difference of 15.7%.
| Sex | Number | Average Earnings |
| Male | 1,333 (66.3%) | $64,744 |
| Female | 676 (33.7%) | $54,597 |
| Total | 2,009 (100.0%) | $62,813 |
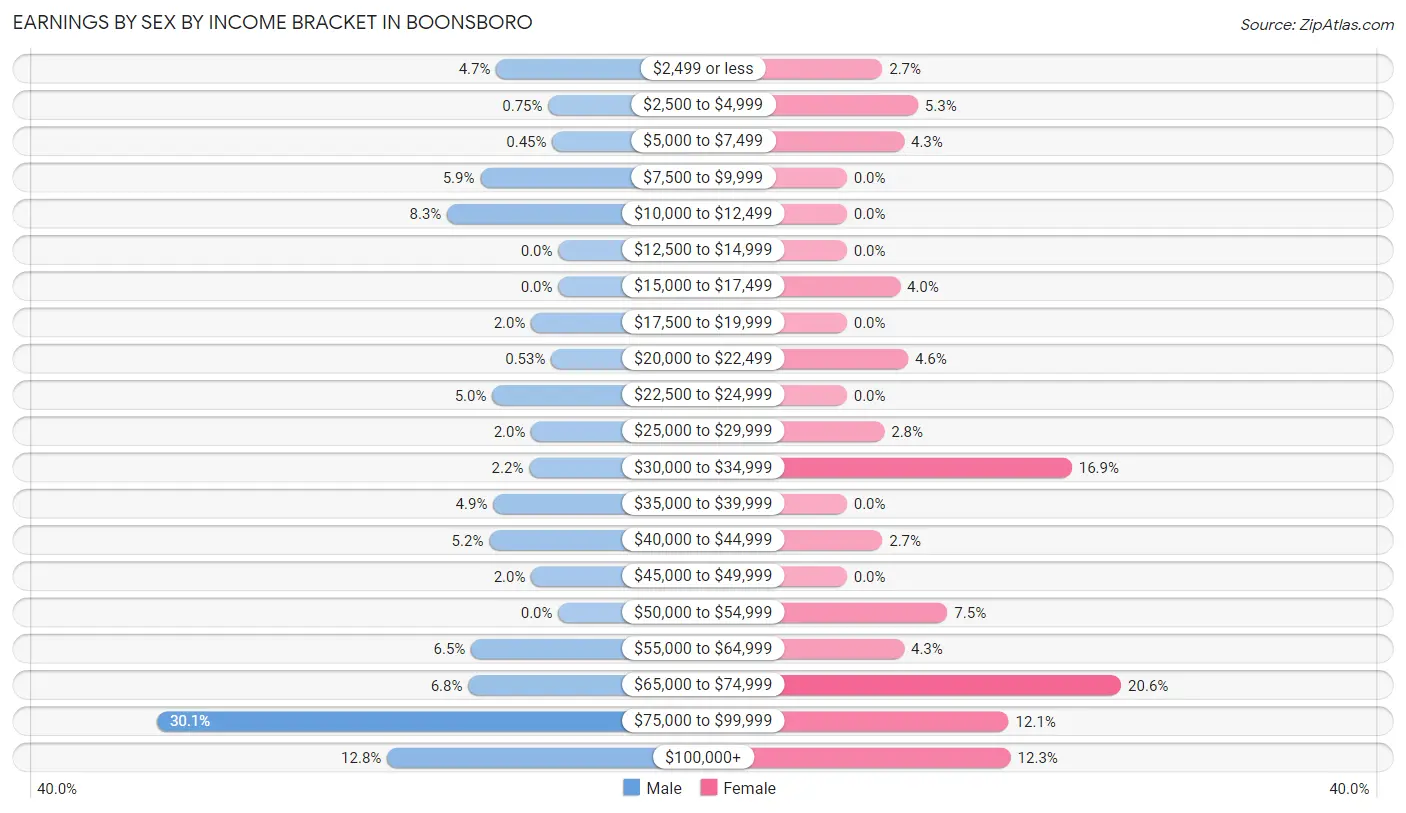
Earnings by Sex by Income Bracket in Boonsboro
The most common earnings brackets in Boonsboro are $75,000 to $99,999 for men (401 | 30.1%) and $65,000 to $74,999 for women (139 | 20.6%).
| Income | Male | Female |
| $2,499 or less | 62 (4.6%) | 18 (2.7%) |
| $2,500 to $4,999 | 10 (0.7%) | 36 (5.3%) |
| $5,000 to $7,499 | 6 (0.4%) | 29 (4.3%) |
| $7,500 to $9,999 | 78 (5.9%) | 0 (0.0%) |
| $10,000 to $12,499 | 111 (8.3%) | 0 (0.0%) |
| $12,500 to $14,999 | 0 (0.0%) | 0 (0.0%) |
| $15,000 to $17,499 | 0 (0.0%) | 27 (4.0%) |
| $17,500 to $19,999 | 27 (2.0%) | 0 (0.0%) |
| $20,000 to $22,499 | 7 (0.5%) | 31 (4.6%) |
| $22,500 to $24,999 | 66 (5.0%) | 0 (0.0%) |
| $25,000 to $29,999 | 27 (2.0%) | 19 (2.8%) |
| $30,000 to $34,999 | 29 (2.2%) | 114 (16.9%) |
| $35,000 to $39,999 | 65 (4.9%) | 0 (0.0%) |
| $40,000 to $44,999 | 69 (5.2%) | 18 (2.7%) |
| $45,000 to $49,999 | 27 (2.0%) | 0 (0.0%) |
| $50,000 to $54,999 | 0 (0.0%) | 51 (7.5%) |
| $55,000 to $64,999 | 87 (6.5%) | 29 (4.3%) |
| $65,000 to $74,999 | 90 (6.8%) | 139 (20.6%) |
| $75,000 to $99,999 | 401 (30.1%) | 82 (12.1%) |
| $100,000+ | 171 (12.8%) | 83 (12.3%) |
| Total | 1,333 (100.0%) | 676 (100.0%) |
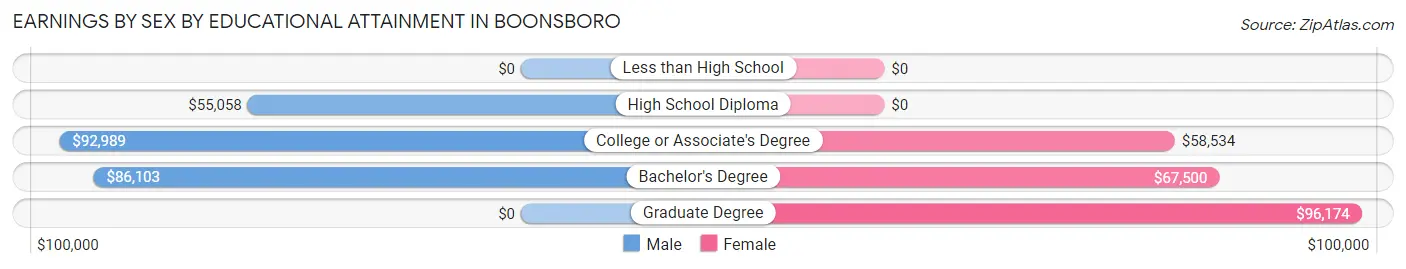
Earnings by Sex by Educational Attainment in Boonsboro
Average earnings in Boonsboro are $75,357 for men and $58,103 for women, a difference of 22.9%. Men with an educational attainment of college or associate's degree enjoy the highest average annual earnings of $92,989, while those with high school diploma education earn the least with $55,058. Women with an educational attainment of graduate degree earn the most with the average annual earnings of $96,174, while those with college or associate's degree education have the smallest earnings of $58,534.
| Educational Attainment | Male Income | Female Income |
| Less than High School | - | - |
| High School Diploma | $55,058 | $0 |
| College or Associate's Degree | $92,989 | $58,534 |
| Bachelor's Degree | $86,103 | $67,500 |
| Graduate Degree | - | - |
| Total | $75,357 | $58,103 |
Family Income in Boonsboro
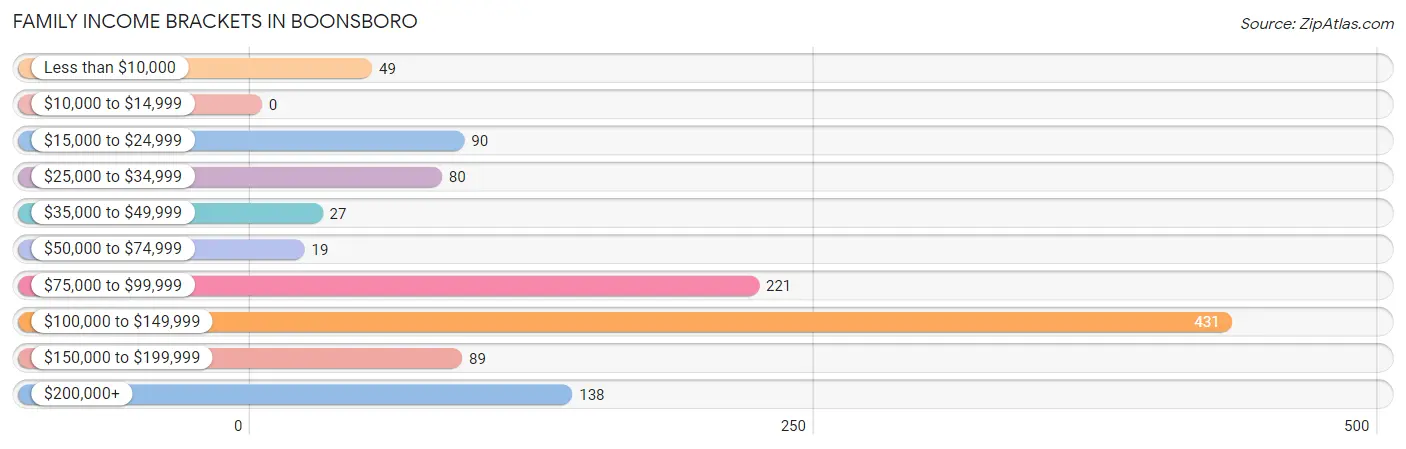
Family Income Brackets in Boonsboro
According to the Boonsboro family income data, there are 431 families falling into the $100,000 to $149,999 income range, which is the most common income bracket and makes up 37.7% of all families.
| Income Bracket | # Families | % Families |
| Less than $10,000 | 49 | 4.3% |
| $10,000 to $14,999 | 0 | 0.0% |
| $15,000 to $24,999 | 90 | 7.9% |
| $25,000 to $34,999 | 80 | 7.0% |
| $35,000 to $49,999 | 27 | 2.4% |
| $50,000 to $74,999 | 19 | 1.7% |
| $75,000 to $99,999 | 221 | 19.3% |
| $100,000 to $149,999 | 431 | 37.7% |
| $150,000 to $199,999 | 89 | 7.8% |
| $200,000+ | 138 | 12.1% |
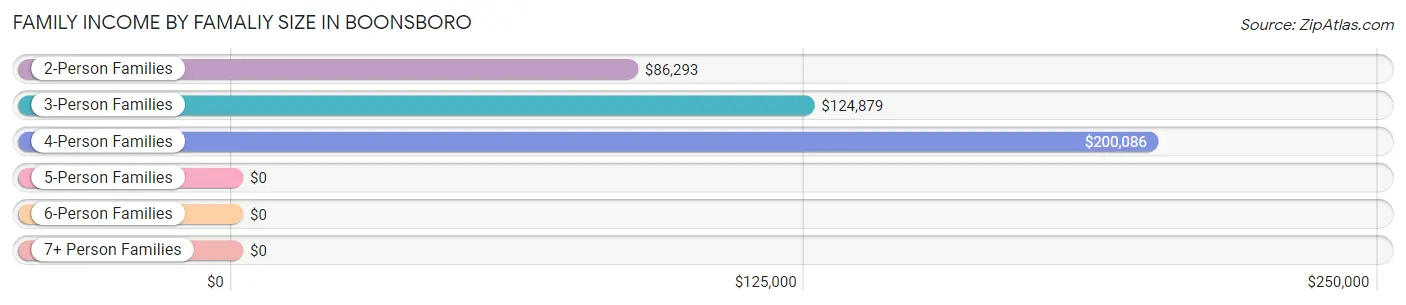
Family Income by Famaliy Size in Boonsboro
4-person families (84 | 7.3%) account for the highest median family income in Boonsboro with $200,086 per family, while 4-person families (84 | 7.3%) have the highest median income of $50,022 per family member.
| Income Bracket | # Families | Median Income |
| 2-Person Families | 460 (40.2%) | $86,293 |
| 3-Person Families | 558 (48.8%) | $124,879 |
| 4-Person Families | 84 (7.3%) | $200,086 |
| 5-Person Families | 0 (0.0%) | $0 |
| 6-Person Families | 42 (3.7%) | $0 |
| 7+ Person Families | 0 (0.0%) | $0 |
| Total | 1,144 (100.0%) | $116,944 |
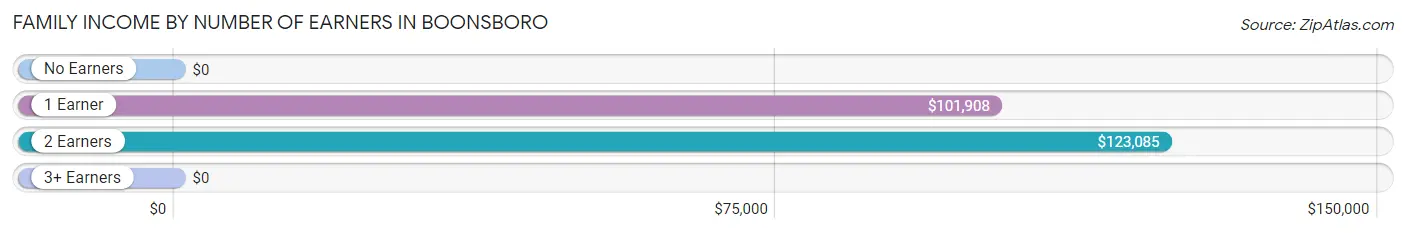
Family Income by Number of Earners in Boonsboro
| Number of Earners | # Families | Median Income |
| No Earners | 74 (6.5%) | $0 |
| 1 Earner | 490 (42.8%) | $101,908 |
| 2 Earners | 563 (49.2%) | $123,085 |
| 3+ Earners | 17 (1.5%) | $0 |
| Total | 1,144 (100.0%) | $116,944 |
Household Income in Boonsboro
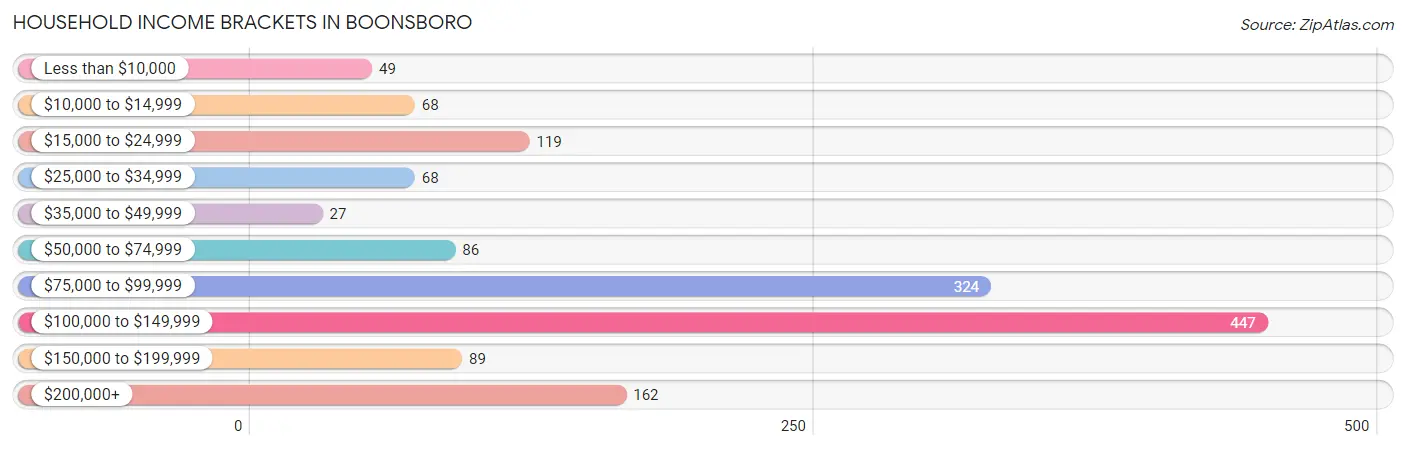
Household Income Brackets in Boonsboro
With 447 households falling in the category, the $100,000 to $149,999 income range is the most frequent in Boonsboro, accounting for 31.1% of all households. In contrast, only 27 households (1.9%) fall into the $35,000 to $49,999 income bracket, making it the least populous group.
| Income Bracket | # Households | % Households |
| Less than $10,000 | 49 | 3.4% |
| $10,000 to $14,999 | 68 | 4.7% |
| $15,000 to $24,999 | 119 | 8.3% |
| $25,000 to $34,999 | 68 | 4.7% |
| $35,000 to $49,999 | 27 | 1.9% |
| $50,000 to $74,999 | 86 | 6.0% |
| $75,000 to $99,999 | 324 | 22.5% |
| $100,000 to $149,999 | 447 | 31.1% |
| $150,000 to $199,999 | 89 | 6.2% |
| $200,000+ | 162 | 11.3% |
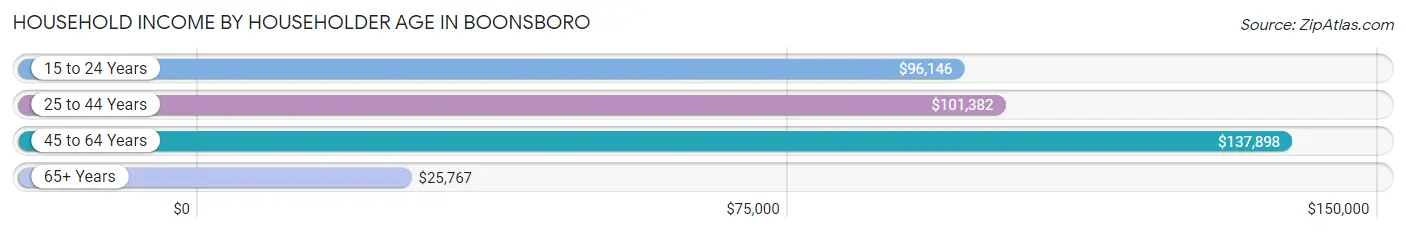
Household Income by Householder Age in Boonsboro
The median household income in Boonsboro is $96,111, with the highest median household income of $137,898 found in the 45 to 64 years age bracket for the primary householder. A total of 606 households (42.1%) fall into this category. Meanwhile, the 65+ years age bracket for the primary householder has the lowest median household income of $25,767, with 335 households (23.3%) in this group.
| Income Bracket | # Households | Median Income |
| 15 to 24 Years | 71 (4.9%) | $96,146 |
| 25 to 44 Years | 426 (29.6%) | $101,382 |
| 45 to 64 Years | 606 (42.1%) | $137,898 |
| 65+ Years | 335 (23.3%) | $25,767 |
| Total | 1,438 (100.0%) | $96,111 |
Poverty in Boonsboro
Income Below Poverty by Sex and Age in Boonsboro
With 5.3% poverty level for males and 5.9% for females among the residents of Boonsboro, 55 to 64 year old males and 45 to 54 year old females are the most vulnerable to poverty, with 48 males (28.4%) and 24 females (14.0%) in their respective age groups living below the poverty level.
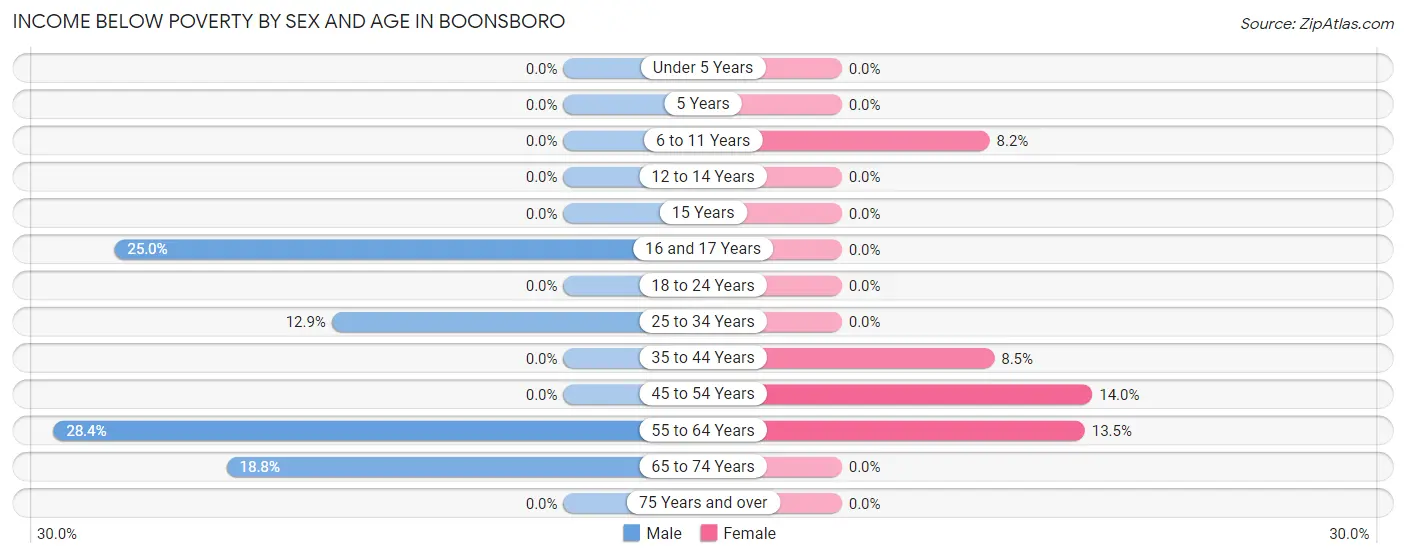
| Age Bracket | Male | Female |
| Under 5 Years | 0 (0.0%) | 0 (0.0%) |
| 5 Years | 0 (0.0%) | 0 (0.0%) |
| 6 to 11 Years | 0 (0.0%) | 13 (8.2%) |
| 12 to 14 Years | 0 (0.0%) | 0 (0.0%) |
| 15 Years | 0 (0.0%) | 0 (0.0%) |
| 16 and 17 Years | 21 (25.0%) | 0 (0.0%) |
| 18 to 24 Years | 0 (0.0%) | 0 (0.0%) |
| 25 to 34 Years | 16 (12.9%) | 0 (0.0%) |
| 35 to 44 Years | 0 (0.0%) | 22 (8.5%) |
| 45 to 54 Years | 0 (0.0%) | 24 (14.0%) |
| 55 to 64 Years | 48 (28.4%) | 28 (13.5%) |
| 65 to 74 Years | 30 (18.8%) | 0 (0.0%) |
| 75 Years and over | 0 (0.0%) | 0 (0.0%) |
| Total | 115 (5.3%) | 87 (5.9%) |
Income Above Poverty by Sex and Age in Boonsboro
According to the poverty statistics in Boonsboro, males aged under 5 years and females aged under 5 years are the age groups that are most secure financially, with 100.0% of males and 100.0% of females in these age groups living above the poverty line.
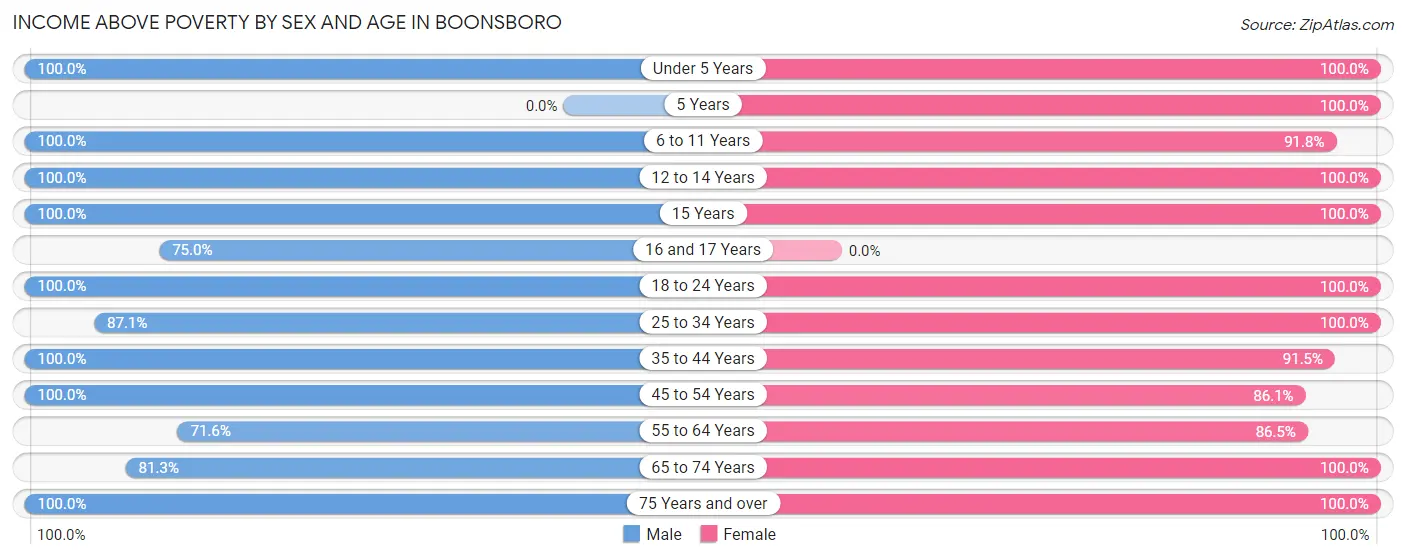
| Age Bracket | Male | Female |
| Under 5 Years | 66 (100.0%) | 122 (100.0%) |
| 5 Years | 0 (0.0%) | 62 (100.0%) |
| 6 to 11 Years | 334 (100.0%) | 145 (91.8%) |
| 12 to 14 Years | 216 (100.0%) | 15 (100.0%) |
| 15 Years | 11 (100.0%) | 28 (100.0%) |
| 16 and 17 Years | 63 (75.0%) | 0 (0.0%) |
| 18 to 24 Years | 244 (100.0%) | 62 (100.0%) |
| 25 to 34 Years | 108 (87.1%) | 116 (100.0%) |
| 35 to 44 Years | 370 (100.0%) | 237 (91.5%) |
| 45 to 54 Years | 390 (100.0%) | 148 (86.1%) |
| 55 to 64 Years | 121 (71.6%) | 179 (86.5%) |
| 65 to 74 Years | 130 (81.2%) | 186 (100.0%) |
| 75 Years and over | 16 (100.0%) | 89 (100.0%) |
| Total | 2,069 (94.7%) | 1,389 (94.1%) |
Income Below Poverty Among Married-Couple Families in Boonsboro
The poverty statistics for married-couple families in Boonsboro show that 4.7% or 30 of the total 635 families live below the poverty line. Families with no children have the highest poverty rate of 9.1%, comprising of 30 families. On the other hand, families with 1 or 2 children have the lowest poverty rate of 0.0%, which includes 0 families.
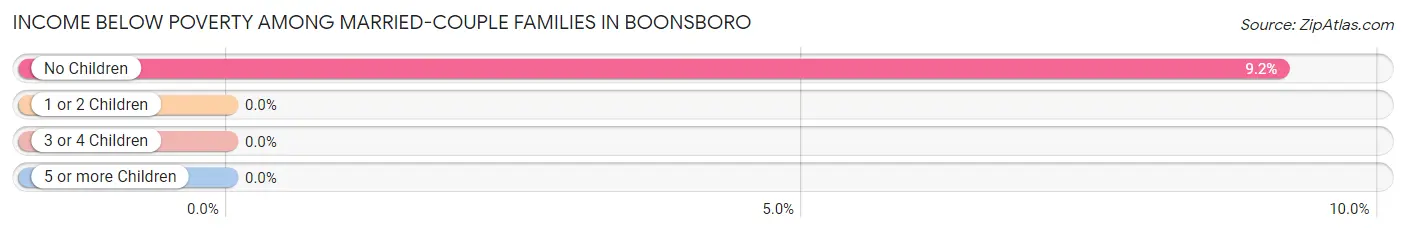
| Children | Above Poverty | Below Poverty |
| No Children | 298 (90.8%) | 30 (9.1%) |
| 1 or 2 Children | 271 (100.0%) | 0 (0.0%) |
| 3 or 4 Children | 36 (100.0%) | 0 (0.0%) |
| 5 or more Children | 0 (0.0%) | 0 (0.0%) |
| Total | 605 (95.3%) | 30 (4.7%) |
Income Below Poverty Among Single-Parent Households in Boonsboro
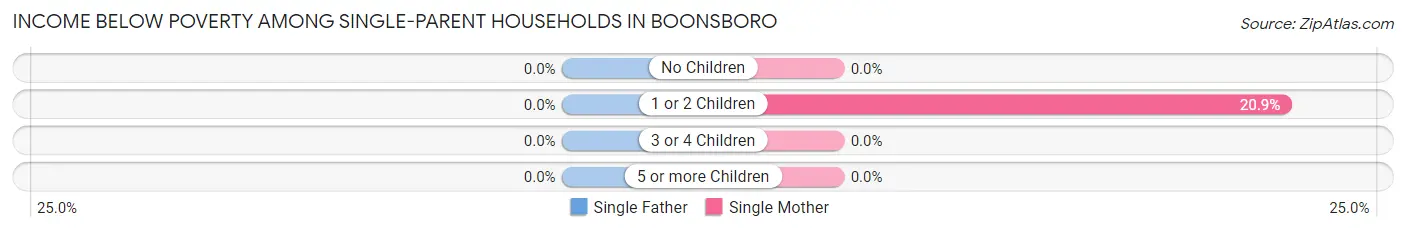
| Children | Single Father | Single Mother |
| No Children | 0 (0.0%) | 0 (0.0%) |
| 1 or 2 Children | 0 (0.0%) | 19 (20.9%) |
| 3 or 4 Children | 0 (0.0%) | 0 (0.0%) |
| 5 or more Children | 0 (0.0%) | 0 (0.0%) |
| Total | 0 (0.0%) | 19 (6.8%) |
Income Below Poverty Among Married-Couple vs Single-Parent Households in Boonsboro
The poverty data for Boonsboro shows that 30 of the married-couple family households (4.7%) and 19 of the single-parent households (3.7%) are living below the poverty level. Within the married-couple family households, those with no children have the highest poverty rate, with 30 households (9.1%) falling below the poverty line. Among the single-parent households, those with 1 or 2 children have the highest poverty rate, with 19 household (5.9%) living below poverty.
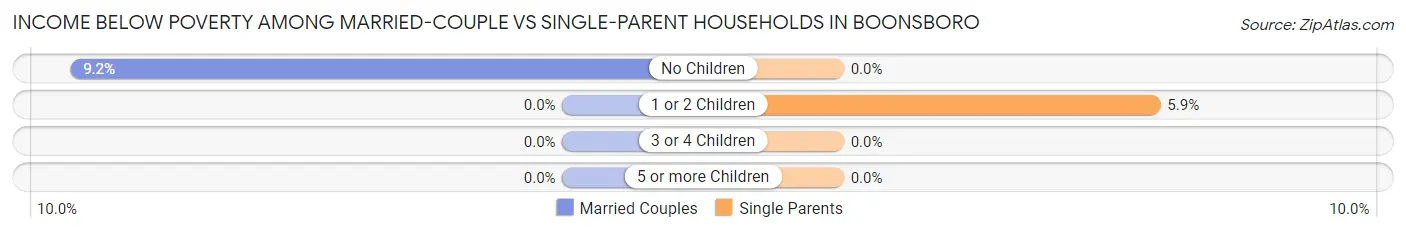
| Children | Married-Couple Families | Single-Parent Households |
| No Children | 30 (9.1%) | 0 (0.0%) |
| 1 or 2 Children | 0 (0.0%) | 19 (5.9%) |
| 3 or 4 Children | 0 (0.0%) | 0 (0.0%) |
| 5 or more Children | 0 (0.0%) | 0 (0.0%) |
| Total | 30 (4.7%) | 19 (3.7%) |
Race in Boonsboro
The most populous races in Boonsboro are White / Caucasian (3,470 | 91.7%), Black / African American (259 | 6.8%), and Hispanic or Latino (45 | 1.2%).
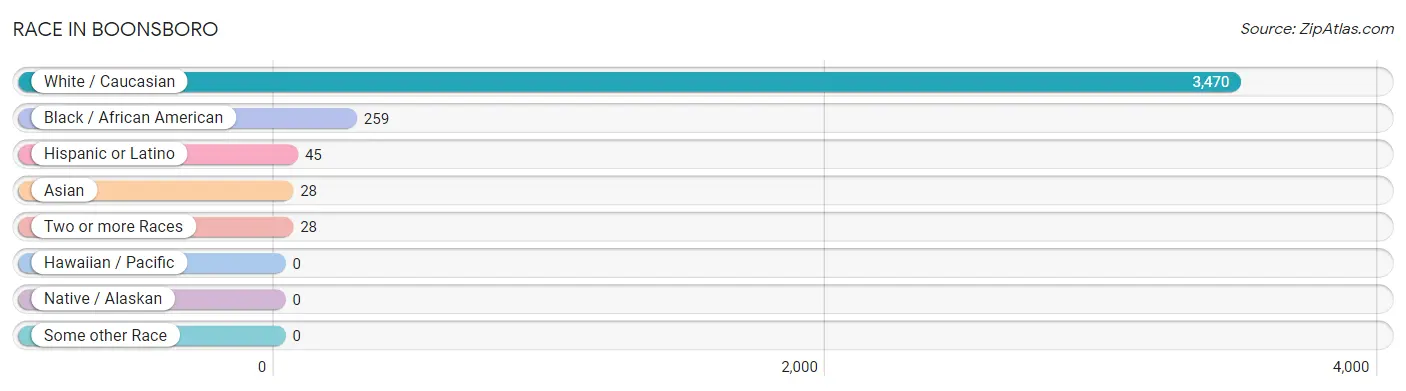
| Race | # Population | % Population |
| Asian | 28 | 0.7% |
| Black / African American | 259 | 6.8% |
| Hawaiian / Pacific | 0 | 0.0% |
| Hispanic or Latino | 45 | 1.2% |
| Native / Alaskan | 0 | 0.0% |
| White / Caucasian | 3,470 | 91.7% |
| Two or more Races | 28 | 0.7% |
| Some other Race | 0 | 0.0% |
| Total | 3,785 | 100.0% |
Ancestry in Boonsboro
The most populous ancestries reported in Boonsboro are German (1,358 | 35.9%), English (530 | 14.0%), Irish (372 | 9.8%), African (224 | 5.9%), and Subsaharan African (224 | 5.9%), together accounting for 71.6% of all Boonsboro residents.
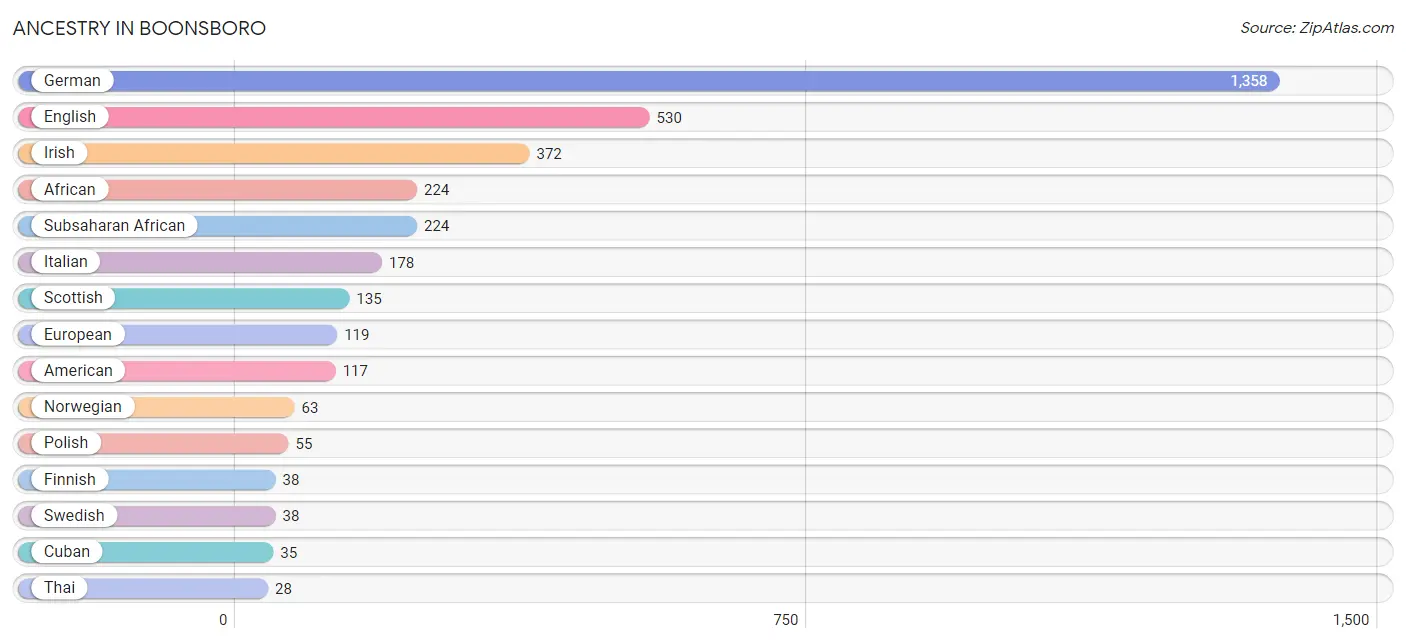
| Ancestry | # Population | % Population |
| African | 224 | 5.9% |
| American | 117 | 3.1% |
| Cherokee | 18 | 0.5% |
| Cuban | 35 | 0.9% |
| Dutch | 20 | 0.5% |
| English | 530 | 14.0% |
| European | 119 | 3.1% |
| Finnish | 38 | 1.0% |
| German | 1,358 | 35.9% |
| Hungarian | 18 | 0.5% |
| Irish | 372 | 9.8% |
| Italian | 178 | 4.7% |
| Norwegian | 63 | 1.7% |
| Polish | 55 | 1.5% |
| Puerto Rican | 10 | 0.3% |
| Scottish | 135 | 3.6% |
| Subsaharan African | 224 | 5.9% |
| Swedish | 38 | 1.0% |
| Thai | 28 | 0.7% |
| Welsh | 21 | 0.5% |
| Yugoslavian | 14 | 0.4% | View All 21 Rows |
Immigrants in Boonsboro
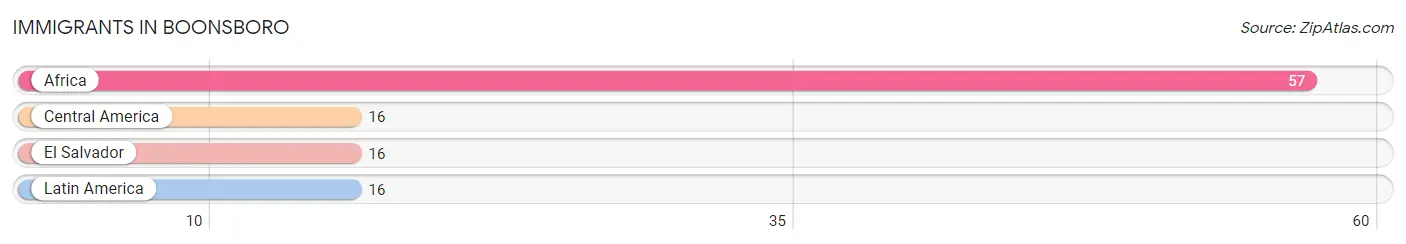
The most numerous immigrant groups reported in Boonsboro came from Africa (57 | 1.5%), Central America (16 | 0.4%), El Salvador (16 | 0.4%), and Latin America (16 | 0.4%), together accounting for 2.8% of all Boonsboro residents.
| Immigration Origin | # Population | % Population |
| Africa | 57 | 1.5% |
| Central America | 16 | 0.4% |
| El Salvador | 16 | 0.4% |
| Latin America | 16 | 0.4% | View All 4 Rows |
Sex and Age in Boonsboro
Sex and Age in Boonsboro
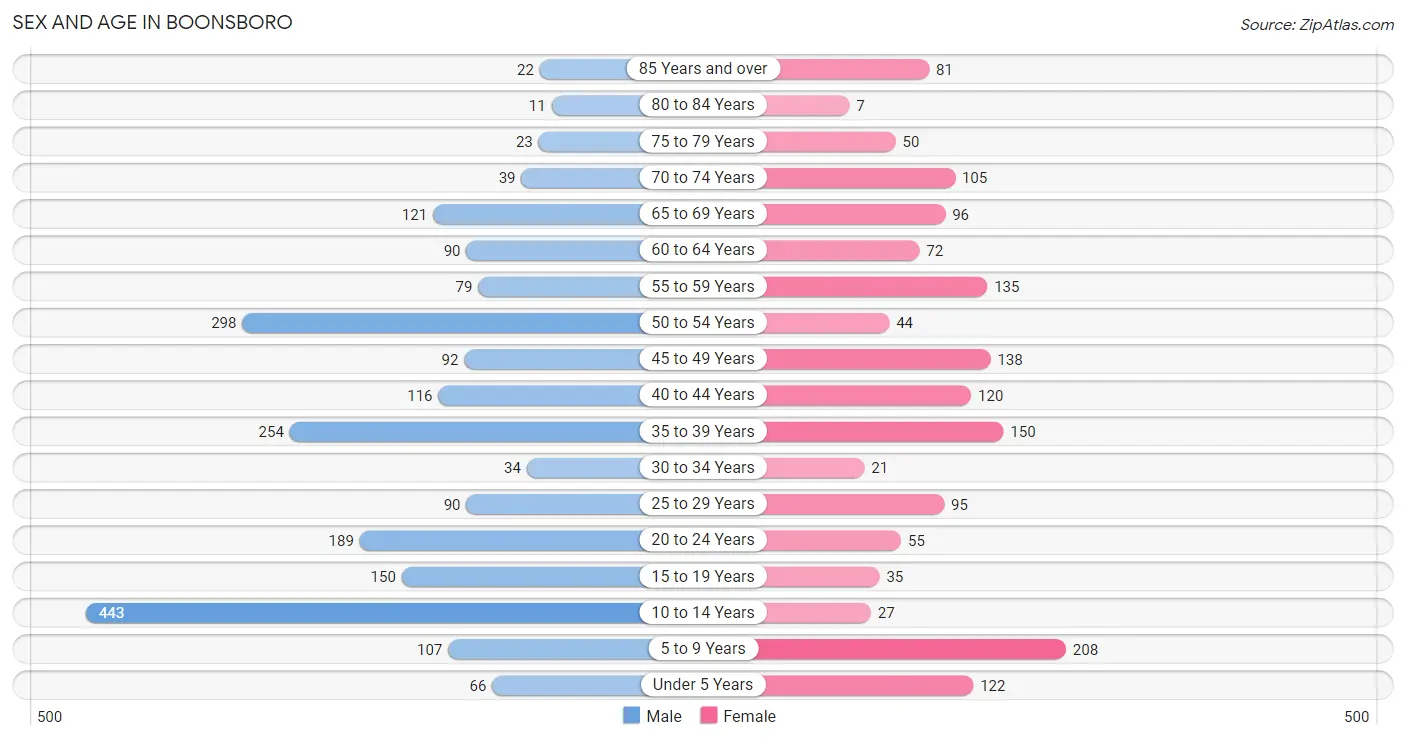
The most populous age groups in Boonsboro are 10 to 14 Years (443 | 19.9%) for men and 5 to 9 Years (208 | 13.3%) for women.
| Age Bracket | Male | Female |
| Under 5 Years | 66 (3.0%) | 122 (7.8%) |
| 5 to 9 Years | 107 (4.8%) | 208 (13.3%) |
| 10 to 14 Years | 443 (19.9%) | 27 (1.7%) |
| 15 to 19 Years | 150 (6.7%) | 35 (2.2%) |
| 20 to 24 Years | 189 (8.5%) | 55 (3.5%) |
| 25 to 29 Years | 90 (4.1%) | 95 (6.1%) |
| 30 to 34 Years | 34 (1.5%) | 21 (1.3%) |
| 35 to 39 Years | 254 (11.4%) | 150 (9.6%) |
| 40 to 44 Years | 116 (5.2%) | 120 (7.7%) |
| 45 to 49 Years | 92 (4.1%) | 138 (8.8%) |
| 50 to 54 Years | 298 (13.4%) | 44 (2.8%) |
| 55 to 59 Years | 79 (3.5%) | 135 (8.6%) |
| 60 to 64 Years | 90 (4.1%) | 72 (4.6%) |
| 65 to 69 Years | 121 (5.4%) | 96 (6.1%) |
| 70 to 74 Years | 39 (1.8%) | 105 (6.7%) |
| 75 to 79 Years | 23 (1.0%) | 50 (3.2%) |
| 80 to 84 Years | 11 (0.5%) | 7 (0.4%) |
| 85 Years and over | 22 (1.0%) | 81 (5.2%) |
| Total | 2,224 (100.0%) | 1,561 (100.0%) |
Families and Households in Boonsboro
Median Family Size in Boonsboro
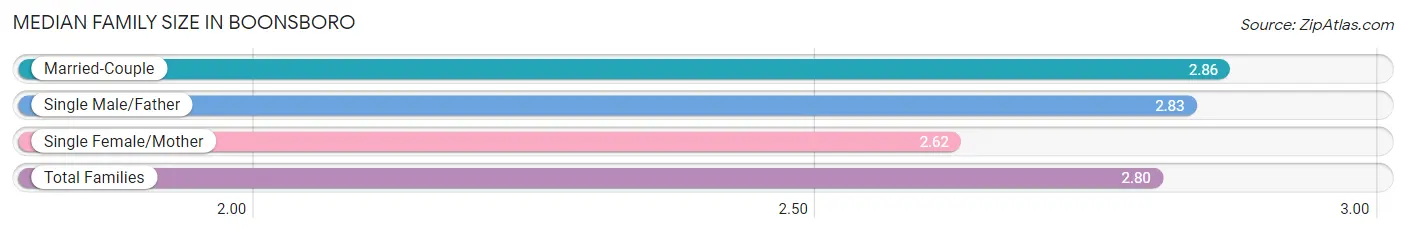
The median family size in Boonsboro is 2.80 persons per family, with married-couple families (635 | 55.5%) accounting for the largest median family size of 2.86 persons per family. On the other hand, single female/mother families (278 | 24.3%) represent the smallest median family size with 2.62 persons per family.
| Family Type | # Families | Family Size |
| Married-Couple | 635 (55.5%) | 2.86 |
| Single Male/Father | 231 (20.2%) | 2.83 |
| Single Female/Mother | 278 (24.3%) | 2.62 |
| Total Families | 1,144 (100.0%) | 2.80 |
Median Household Size in Boonsboro
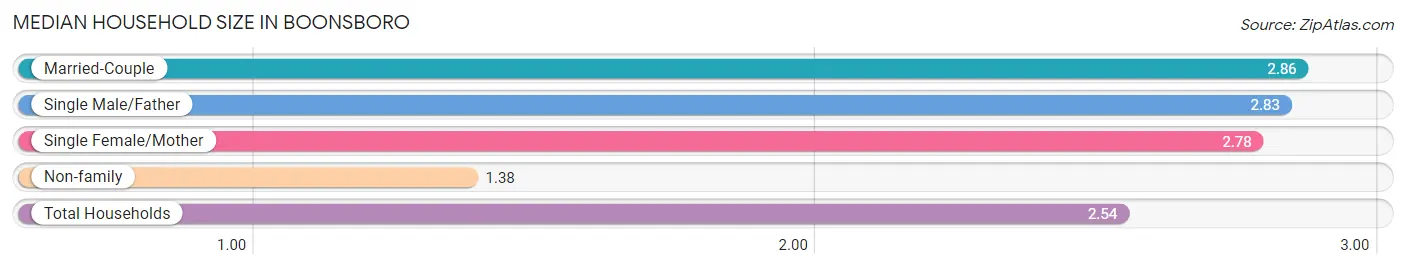
The median household size in Boonsboro is 2.54 persons per household, with married-couple households (635 | 44.2%) accounting for the largest median household size of 2.86 persons per household. non-family households (294 | 20.4%) represent the smallest median household size with 1.38 persons per household.
| Household Type | # Households | Household Size |
| Married-Couple | 635 (44.2%) | 2.86 |
| Single Male/Father | 231 (16.1%) | 2.83 |
| Single Female/Mother | 278 (19.3%) | 2.78 |
| Non-family | 294 (20.4%) | 1.38 |
| Total Households | 1,438 (100.0%) | 2.54 |
Household Size by Marriage Status in Boonsboro
Out of a total of 1,438 households in Boonsboro, 1,144 (79.5%) are family households, while 294 (20.4%) are nonfamily households. The most numerous type of family households are 3-person households, comprising 517, and the most common type of nonfamily households are 1-person households, comprising 214.
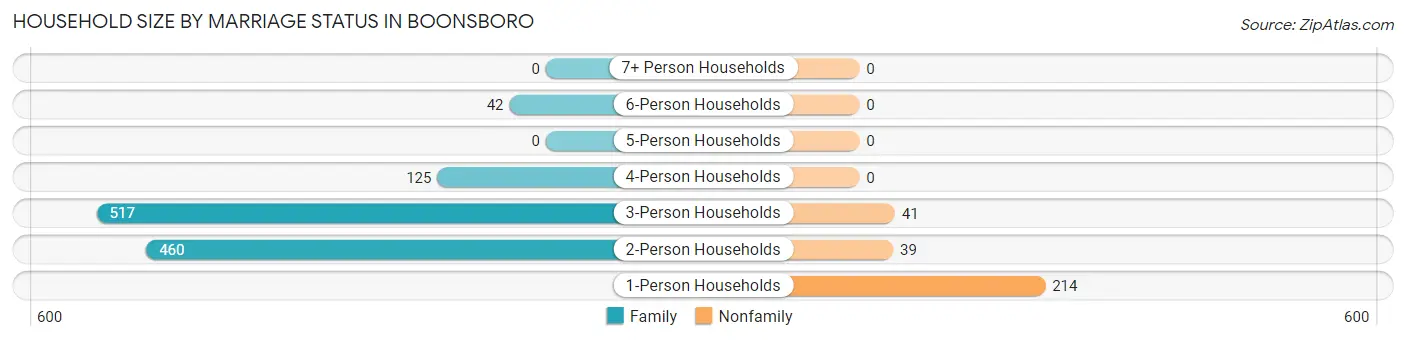
| Household Size | Family Households | Nonfamily Households |
| 1-Person Households | - | 214 (14.9%) |
| 2-Person Households | 460 (32.0%) | 39 (2.7%) |
| 3-Person Households | 517 (35.9%) | 41 (2.9%) |
| 4-Person Households | 125 (8.7%) | 0 (0.0%) |
| 5-Person Households | 0 (0.0%) | 0 (0.0%) |
| 6-Person Households | 42 (2.9%) | 0 (0.0%) |
| 7+ Person Households | 0 (0.0%) | 0 (0.0%) |
| Total | 1,144 (79.5%) | 294 (20.4%) |
Female Fertility in Boonsboro
Fertility by Age in Boonsboro
Average fertility rate in Boonsboro is 56.0 births per 1,000 women. Women in the age bracket of 20 to 34 years have the highest fertility rate with 211.0 births per 1,000 women. Women in the age bracket of 20 to 34 years acount for 100.0% of all women with births.
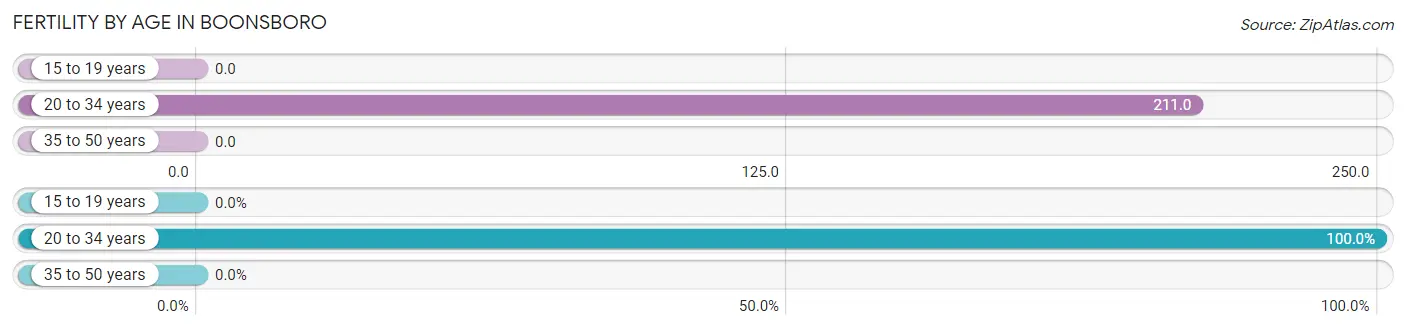
| Age Bracket | Women with Births | Births / 1,000 Women |
| 15 to 19 years | 0 (0.0%) | 0.0 |
| 20 to 34 years | 36 (100.0%) | 211.0 |
| 35 to 50 years | 0 (0.0%) | 0.0 |
| Total | 36 (100.0%) | 56.0 |
Fertility by Age by Marriage Status in Boonsboro
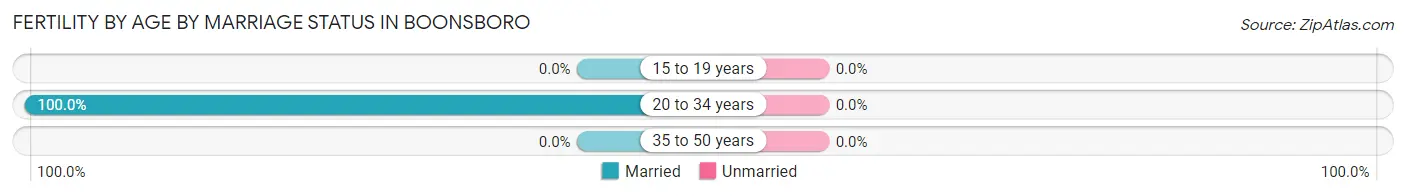
| Age Bracket | Married | Unmarried |
| 15 to 19 years | 0 (0.0%) | 0 (0.0%) |
| 20 to 34 years | 36 (100.0%) | 0 (0.0%) |
| 35 to 50 years | 0 (0.0%) | 0 (0.0%) |
| Total | 36 (100.0%) | 0 (0.0%) |
Fertility by Education in Boonsboro
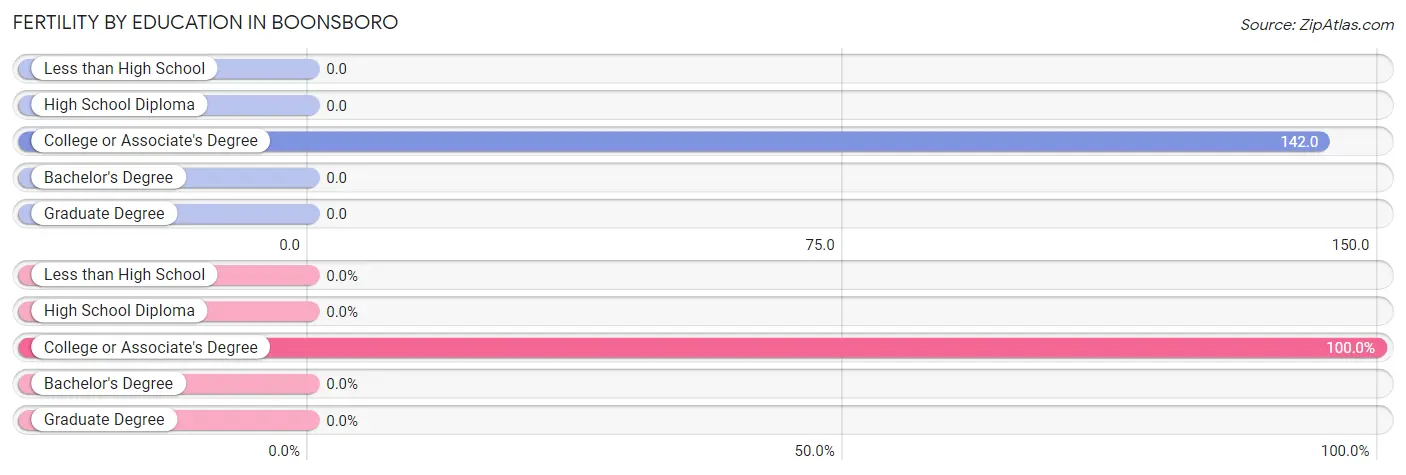
| Educational Attainment | Women with Births | Births / 1,000 Women |
| Less than High School | 0 (0.0%) | 0.0 |
| High School Diploma | 0 (0.0%) | 0.0 |
| College or Associate's Degree | 36 (100.0%) | 142.0 |
| Bachelor's Degree | 0 (0.0%) | 0.0 |
| Graduate Degree | 0 (0.0%) | 0.0 |
| Total | 36 (100.0%) | 56.0 |
Fertility by Education by Marriage Status in Boonsboro
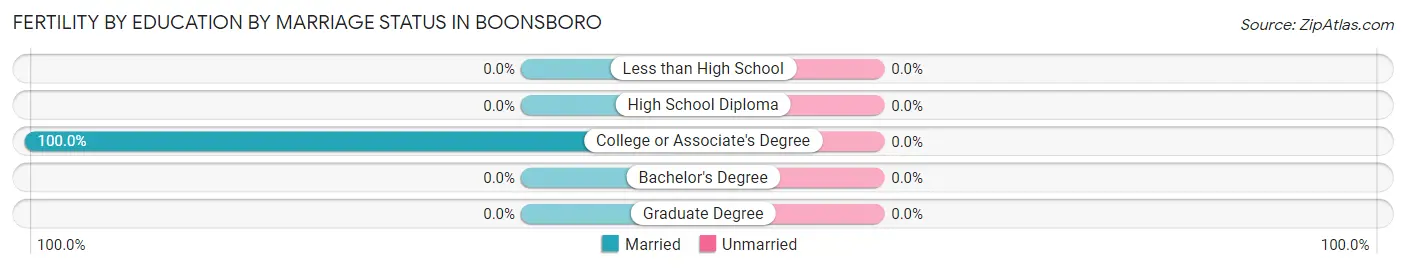
| Educational Attainment | Married | Unmarried |
| Less than High School | 0 (0.0%) | 0 (0.0%) |
| High School Diploma | 0 (0.0%) | 0 (0.0%) |
| College or Associate's Degree | 36 (100.0%) | 0 (0.0%) |
| Bachelor's Degree | 0 (0.0%) | 0 (0.0%) |
| Graduate Degree | 0 (0.0%) | 0 (0.0%) |
| Total | 36 (100.0%) | 0 (0.0%) |
Employment Characteristics in Boonsboro
Employment by Class of Employer in Boonsboro
Among the 1,862 employed individuals in Boonsboro, private company employees (988 | 53.1%), local government employees (326 | 17.5%), and federal government employees (196 | 10.5%) make up the most common classes of employment.
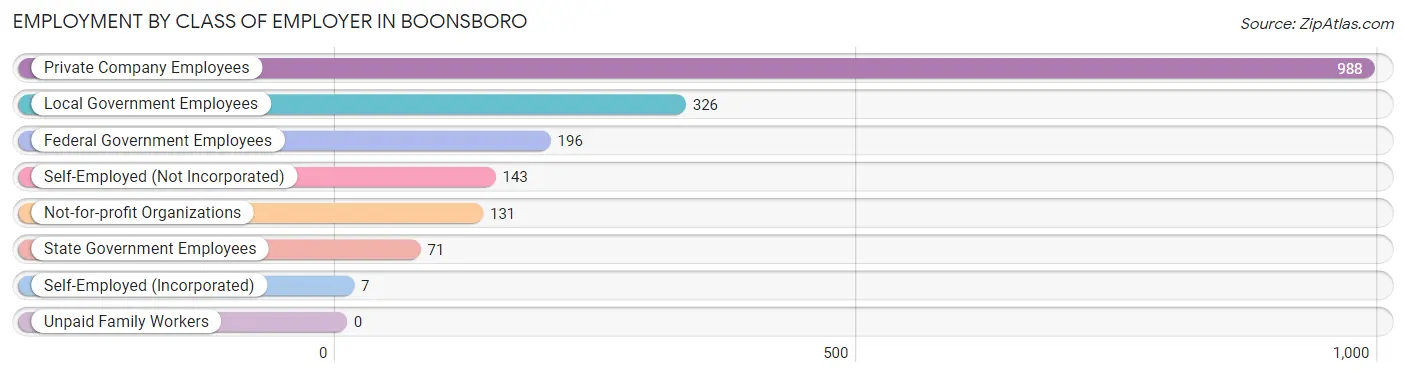
| Employer Class | # Employees | % Employees |
| Private Company Employees | 988 | 53.1% |
| Self-Employed (Incorporated) | 7 | 0.4% |
| Self-Employed (Not Incorporated) | 143 | 7.7% |
| Not-for-profit Organizations | 131 | 7.0% |
| Local Government Employees | 326 | 17.5% |
| State Government Employees | 71 | 3.8% |
| Federal Government Employees | 196 | 10.5% |
| Unpaid Family Workers | 0 | 0.0% |
| Total | 1,862 | 100.0% |
Employment Status by Age in Boonsboro
According to the labor force statistics for Boonsboro, out of the total population over 16 years of age (2,773), 69.6% or 1,930 individuals are in the labor force, with 3.5% or 68 of them unemployed. The age group with the highest labor force participation rate is 20 to 24 years, with 100.0% or 244 individuals in the labor force. Within the labor force, the 20 to 24 years age range has the highest percentage of unemployed individuals, with 8.6% or 21 of them being unemployed.
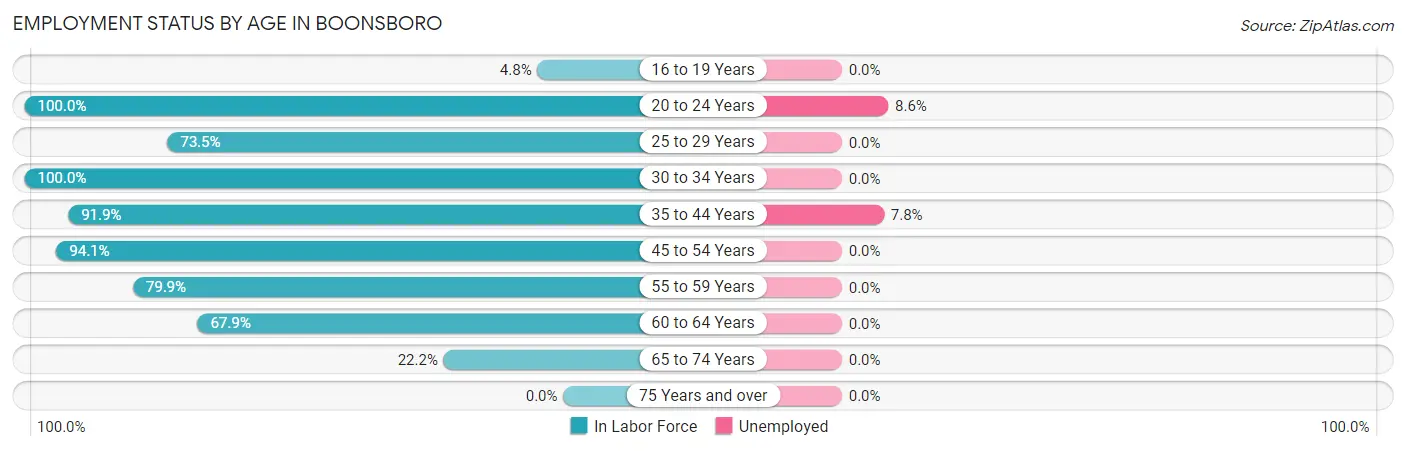
| Age Bracket | In Labor Force | Unemployed |
| 16 to 19 Years | 7 (4.8%) | 0 (0.0%) |
| 20 to 24 Years | 244 (100.0%) | 21 (8.6%) |
| 25 to 29 Years | 136 (73.5%) | 0 (0.0%) |
| 30 to 34 Years | 55 (100.0%) | 0 (0.0%) |
| 35 to 44 Years | 588 (91.9%) | 46 (7.8%) |
| 45 to 54 Years | 538 (94.1%) | 0 (0.0%) |
| 55 to 59 Years | 171 (79.9%) | 0 (0.0%) |
| 60 to 64 Years | 110 (67.9%) | 0 (0.0%) |
| 65 to 74 Years | 80 (22.2%) | 0 (0.0%) |
| 75 Years and over | 0 (0.0%) | 0 (0.0%) |
| Total | 1,930 (69.6%) | 68 (3.5%) |
Employment Status by Educational Attainment in Boonsboro
According to labor force statistics for Boonsboro, 87.4% of individuals (1,598) out of the total population between 25 and 64 years of age (1,828) are in the labor force, with 2.9% or 46 of them being unemployed. The group with the highest labor force participation rate are those with the educational attainment of college / associate degree, with 91.3% or 774 individuals in the labor force. Within the labor force, individuals with high school diploma education have the highest percentage of unemployment, with 9.5% or 27 of them being unemployed.
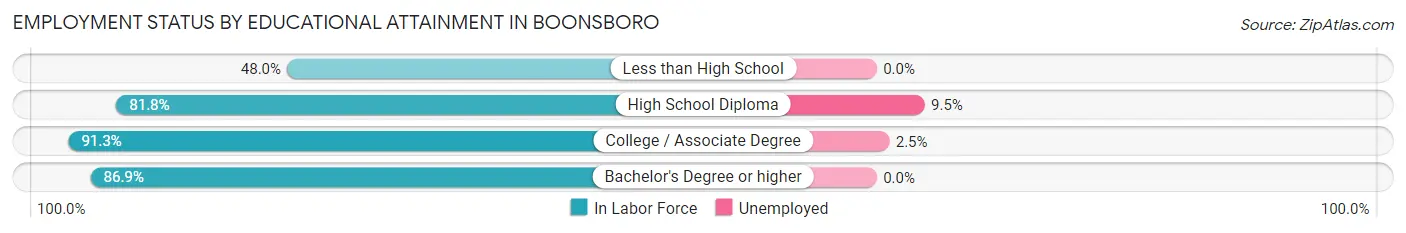
| Educational Attainment | In Labor Force | Unemployed |
| Less than High School | 12 (48.0%) | 0 (0.0%) |
| High School Diploma | 283 (81.8%) | 33 (9.5%) |
| College / Associate Degree | 774 (91.3%) | 21 (2.5%) |
| Bachelor's Degree or higher | 529 (86.9%) | 0 (0.0%) |
| Total | 1,598 (87.4%) | 53 (2.9%) |
Employment Occupations by Sex in Boonsboro
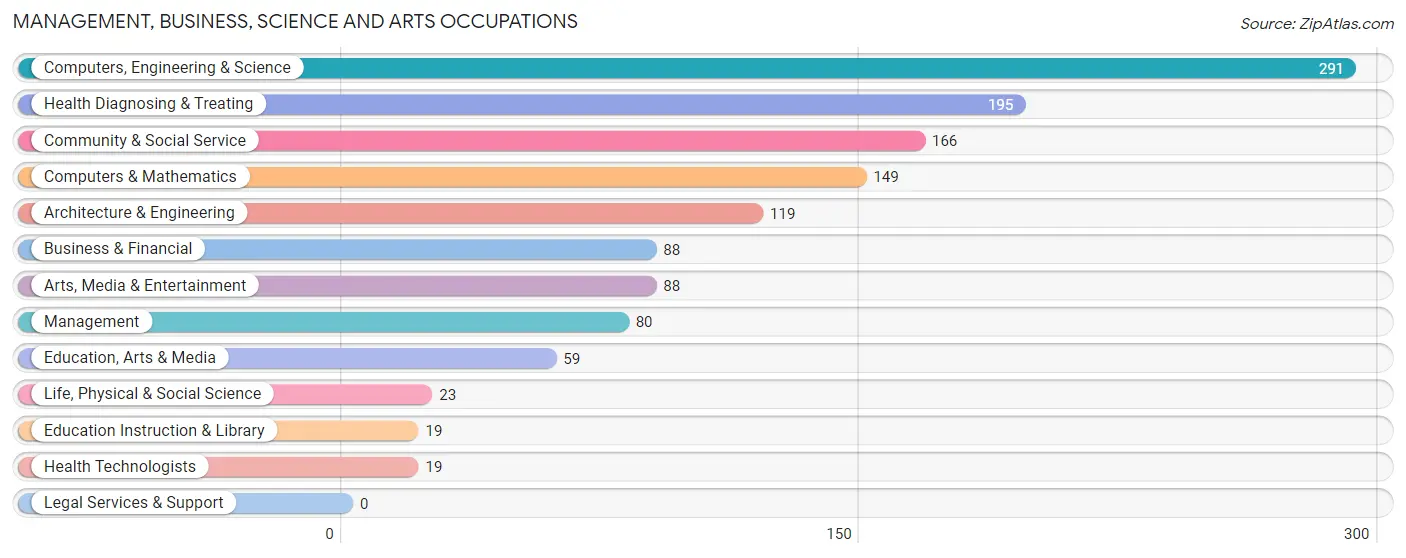
Management, Business, Science and Arts Occupations
The most common Management, Business, Science and Arts occupations in Boonsboro are Computers, Engineering & Science (291 | 15.6%), Health Diagnosing & Treating (195 | 10.5%), Community & Social Service (166 | 8.9%), Computers & Mathematics (149 | 8.0%), and Architecture & Engineering (119 | 6.4%).
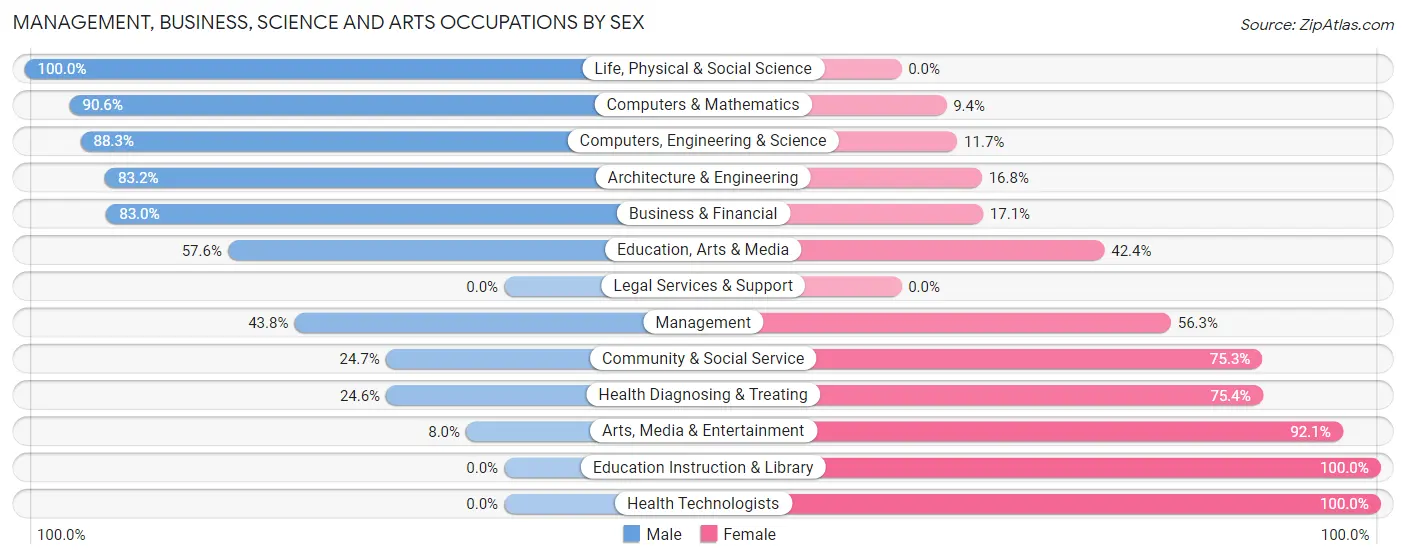
Management, Business, Science and Arts Occupations by Sex
Within the Management, Business, Science and Arts occupations in Boonsboro, the most male-oriented occupations are Life, Physical & Social Science (100.0%), Computers & Mathematics (90.6%), and Computers, Engineering & Science (88.3%), while the most female-oriented occupations are Education Instruction & Library (100.0%), Health Technologists (100.0%), and Arts, Media & Entertainment (92.0%).
| Occupation | Male | Female |
| Management | 35 (43.8%) | 45 (56.2%) |
| Business & Financial | 73 (83.0%) | 15 (17.1%) |
| Computers, Engineering & Science | 257 (88.3%) | 34 (11.7%) |
| Computers & Mathematics | 135 (90.6%) | 14 (9.4%) |
| Architecture & Engineering | 99 (83.2%) | 20 (16.8%) |
| Life, Physical & Social Science | 23 (100.0%) | 0 (0.0%) |
| Community & Social Service | 41 (24.7%) | 125 (75.3%) |
| Education, Arts & Media | 34 (57.6%) | 25 (42.4%) |
| Legal Services & Support | 0 (0.0%) | 0 (0.0%) |
| Education Instruction & Library | 0 (0.0%) | 19 (100.0%) |
| Arts, Media & Entertainment | 7 (8.0%) | 81 (92.0%) |
| Health Diagnosing & Treating | 48 (24.6%) | 147 (75.4%) |
| Health Technologists | 0 (0.0%) | 19 (100.0%) |
| Total (Category) | 454 (55.4%) | 366 (44.6%) |
| Total (Overall) | 1,204 (64.7%) | 658 (35.3%) |
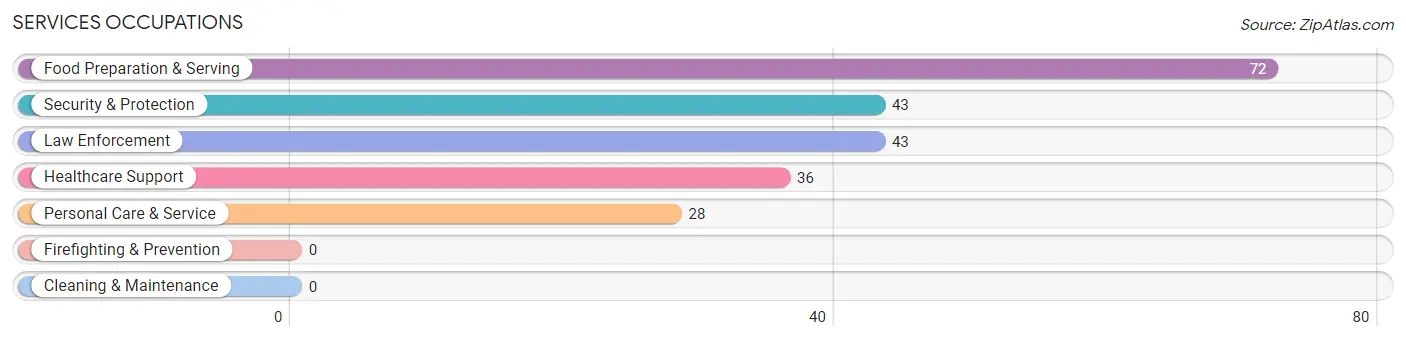
Services Occupations
The most common Services occupations in Boonsboro are Food Preparation & Serving (72 | 3.9%), Security & Protection (43 | 2.3%), Law Enforcement (43 | 2.3%), Healthcare Support (36 | 1.9%), and Personal Care & Service (28 | 1.5%).
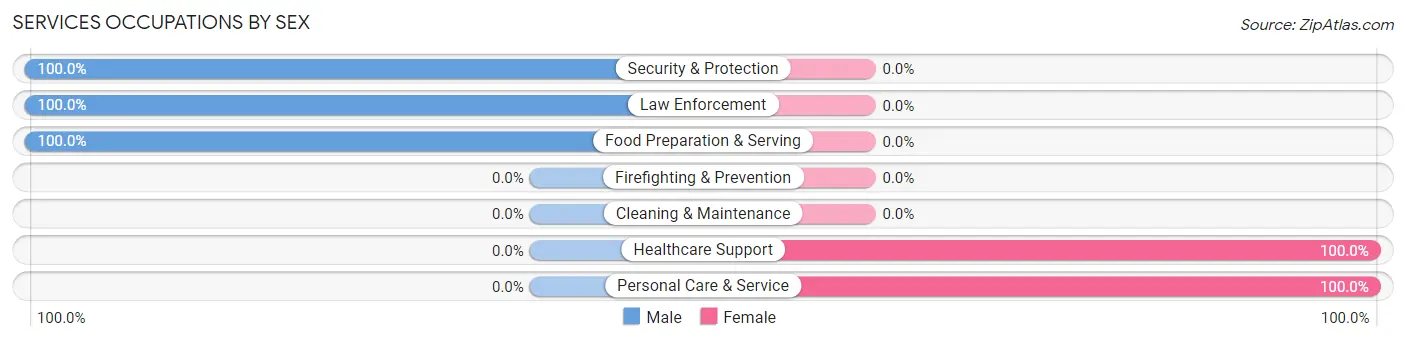
Services Occupations by Sex
Within the Services occupations in Boonsboro, the most male-oriented occupations are Security & Protection (100.0%), Law Enforcement (100.0%), and Food Preparation & Serving (100.0%), while the most female-oriented occupations are Healthcare Support (100.0%), and Personal Care & Service (100.0%).
| Occupation | Male | Female |
| Healthcare Support | 0 (0.0%) | 36 (100.0%) |
| Security & Protection | 43 (100.0%) | 0 (0.0%) |
| Firefighting & Prevention | 0 (0.0%) | 0 (0.0%) |
| Law Enforcement | 43 (100.0%) | 0 (0.0%) |
| Food Preparation & Serving | 72 (100.0%) | 0 (0.0%) |
| Cleaning & Maintenance | 0 (0.0%) | 0 (0.0%) |
| Personal Care & Service | 0 (0.0%) | 28 (100.0%) |
| Total (Category) | 115 (64.2%) | 64 (35.7%) |
| Total (Overall) | 1,204 (64.7%) | 658 (35.3%) |
Sales and Office Occupations
The most common Sales and Office occupations in Boonsboro are Sales & Related (388 | 20.8%), and Office & Administration (122 | 6.6%).
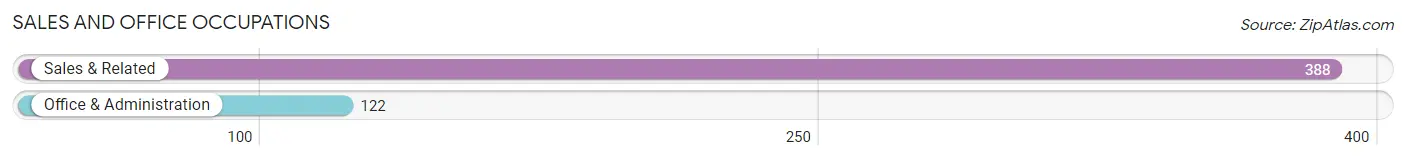
Sales and Office Occupations by Sex
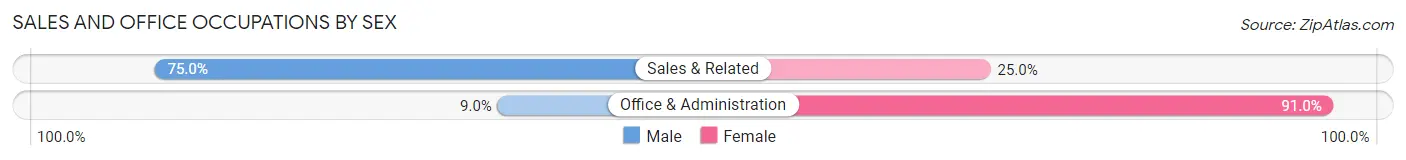
| Occupation | Male | Female |
| Sales & Related | 291 (75.0%) | 97 (25.0%) |
| Office & Administration | 11 (9.0%) | 111 (91.0%) |
| Total (Category) | 302 (59.2%) | 208 (40.8%) |
| Total (Overall) | 1,204 (64.7%) | 658 (35.3%) |
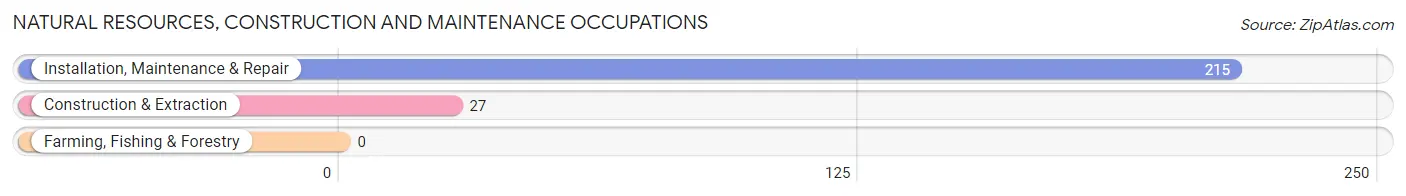
Natural Resources, Construction and Maintenance Occupations
The most common Natural Resources, Construction and Maintenance occupations in Boonsboro are Installation, Maintenance & Repair (215 | 11.6%), and Construction & Extraction (27 | 1.5%).
Natural Resources, Construction and Maintenance Occupations by Sex
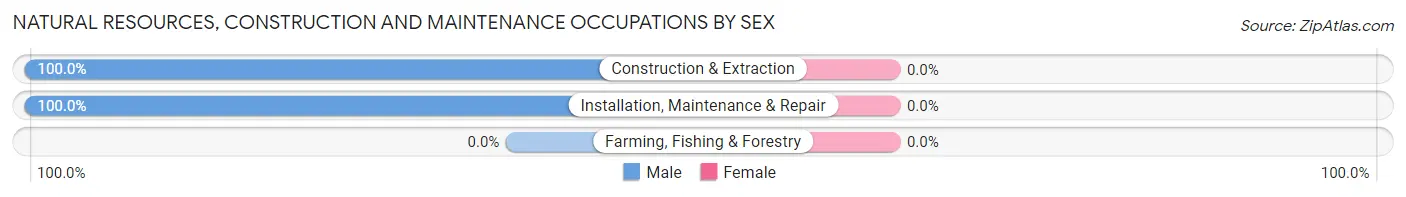
| Occupation | Male | Female |
| Farming, Fishing & Forestry | 0 (0.0%) | 0 (0.0%) |
| Construction & Extraction | 27 (100.0%) | 0 (0.0%) |
| Installation, Maintenance & Repair | 215 (100.0%) | 0 (0.0%) |
| Total (Category) | 242 (100.0%) | 0 (0.0%) |
| Total (Overall) | 1,204 (64.7%) | 658 (35.3%) |
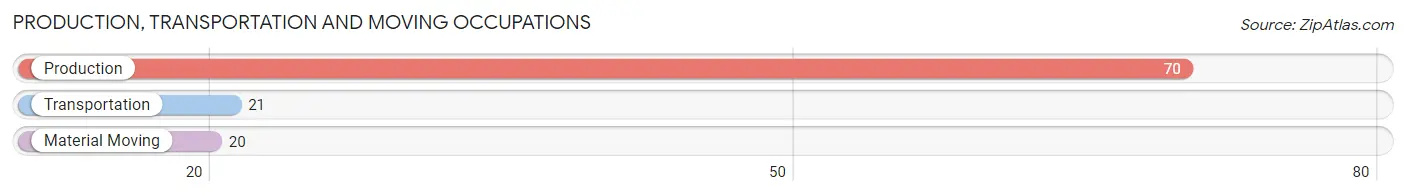
Production, Transportation and Moving Occupations
The most common Production, Transportation and Moving occupations in Boonsboro are Production (70 | 3.8%), Transportation (21 | 1.1%), and Material Moving (20 | 1.1%).
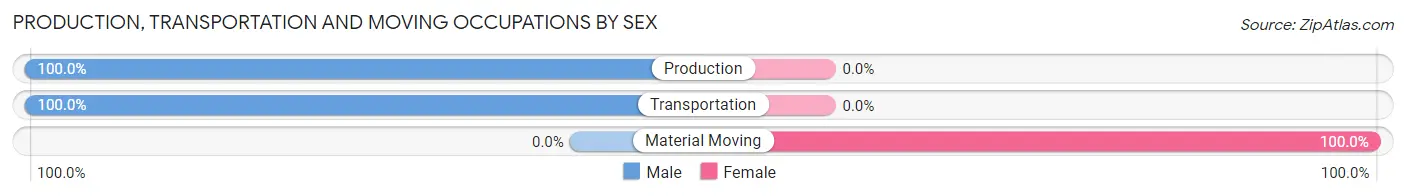
Production, Transportation and Moving Occupations by Sex
| Occupation | Male | Female |
| Production | 70 (100.0%) | 0 (0.0%) |
| Transportation | 21 (100.0%) | 0 (0.0%) |
| Material Moving | 0 (0.0%) | 20 (100.0%) |
| Total (Category) | 91 (82.0%) | 20 (18.0%) |
| Total (Overall) | 1,204 (64.7%) | 658 (35.3%) |
Employment Industries by Sex in Boonsboro
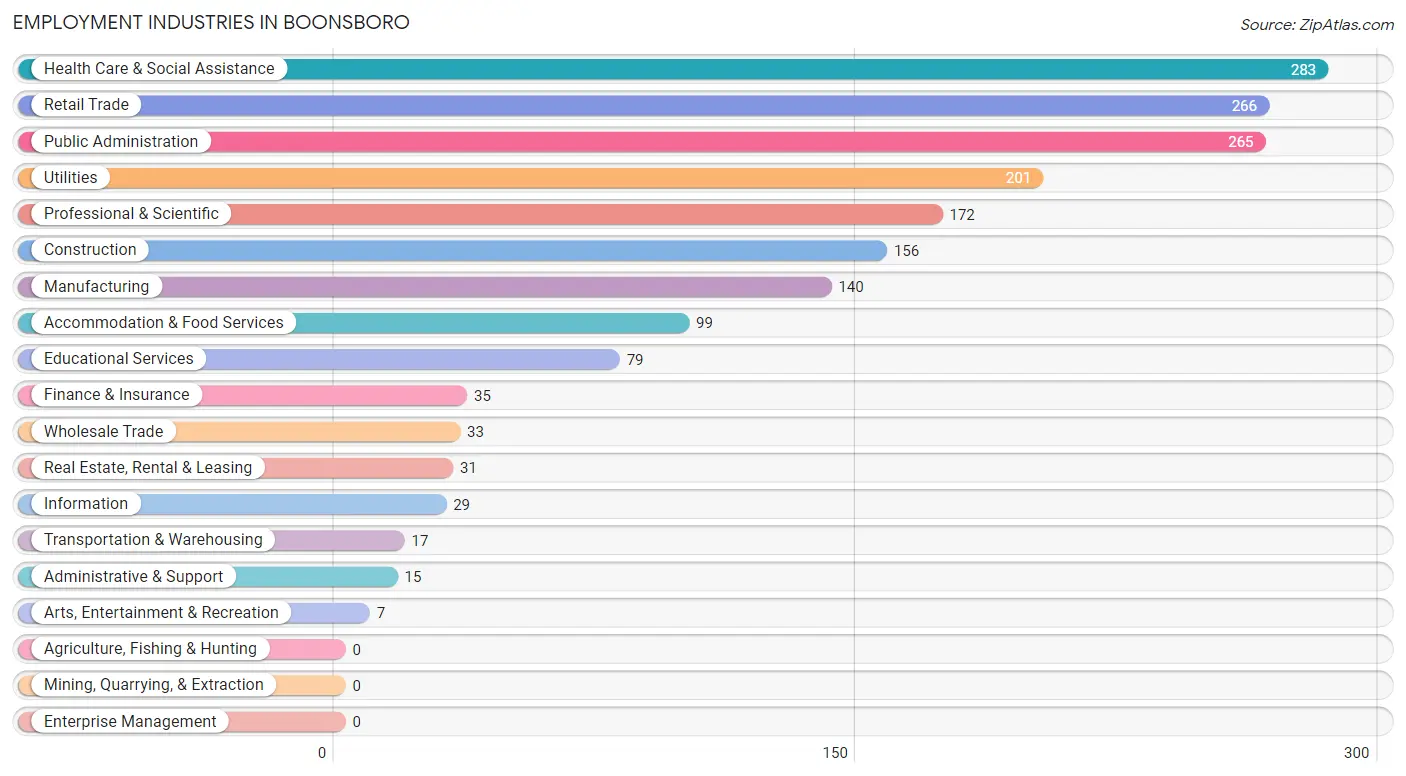
Employment Industries in Boonsboro
The major employment industries in Boonsboro include Health Care & Social Assistance (283 | 15.2%), Retail Trade (266 | 14.3%), Public Administration (265 | 14.2%), Utilities (201 | 10.8%), and Professional & Scientific (172 | 9.2%).
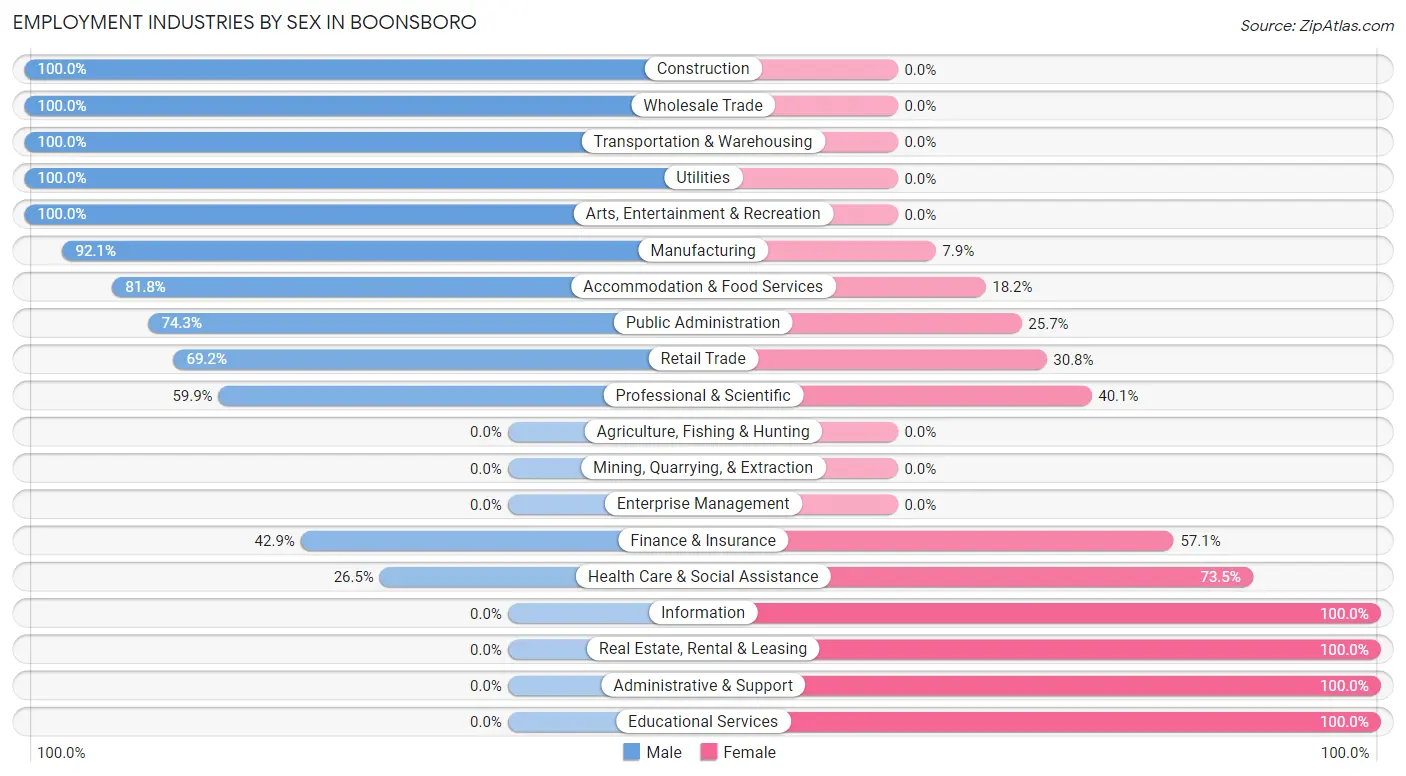
Employment Industries by Sex in Boonsboro
The Boonsboro industries that see more men than women are Construction (100.0%), Wholesale Trade (100.0%), and Transportation & Warehousing (100.0%), whereas the industries that tend to have a higher number of women are Information (100.0%), Real Estate, Rental & Leasing (100.0%), and Administrative & Support (100.0%).
| Industry | Male | Female |
| Agriculture, Fishing & Hunting | 0 (0.0%) | 0 (0.0%) |
| Mining, Quarrying, & Extraction | 0 (0.0%) | 0 (0.0%) |
| Construction | 156 (100.0%) | 0 (0.0%) |
| Manufacturing | 129 (92.1%) | 11 (7.9%) |
| Wholesale Trade | 33 (100.0%) | 0 (0.0%) |
| Retail Trade | 184 (69.2%) | 82 (30.8%) |
| Transportation & Warehousing | 17 (100.0%) | 0 (0.0%) |
| Utilities | 201 (100.0%) | 0 (0.0%) |
| Information | 0 (0.0%) | 29 (100.0%) |
| Finance & Insurance | 15 (42.9%) | 20 (57.1%) |
| Real Estate, Rental & Leasing | 0 (0.0%) | 31 (100.0%) |
| Professional & Scientific | 103 (59.9%) | 69 (40.1%) |
| Enterprise Management | 0 (0.0%) | 0 (0.0%) |
| Administrative & Support | 0 (0.0%) | 15 (100.0%) |
| Educational Services | 0 (0.0%) | 79 (100.0%) |
| Health Care & Social Assistance | 75 (26.5%) | 208 (73.5%) |
| Arts, Entertainment & Recreation | 7 (100.0%) | 0 (0.0%) |
| Accommodation & Food Services | 81 (81.8%) | 18 (18.2%) |
| Public Administration | 197 (74.3%) | 68 (25.7%) |
| Total | 1,204 (64.7%) | 658 (35.3%) |
Education in Boonsboro
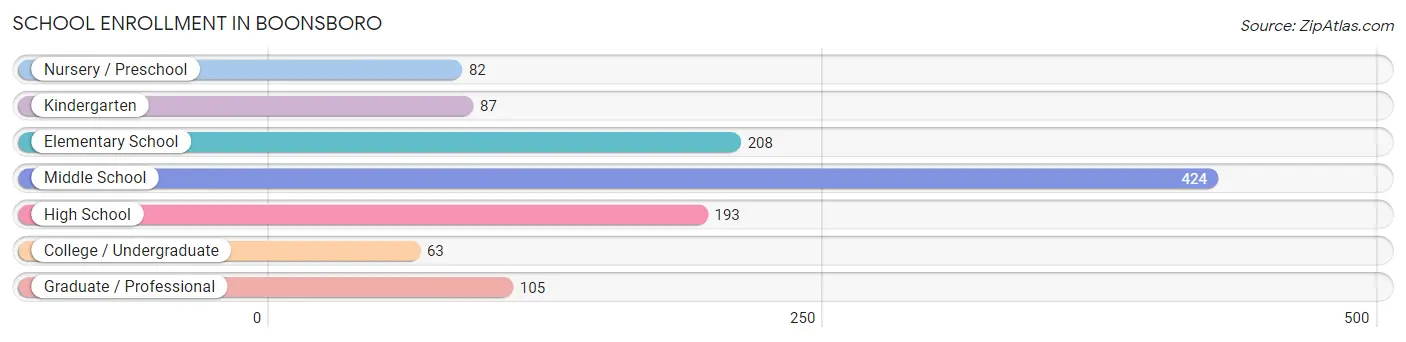
School Enrollment in Boonsboro
The most common levels of schooling among the 1,162 students in Boonsboro are middle school (424 | 36.5%), elementary school (208 | 17.9%), and high school (193 | 16.6%).
| School Level | # Students | % Students |
| Nursery / Preschool | 82 | 7.1% |
| Kindergarten | 87 | 7.5% |
| Elementary School | 208 | 17.9% |
| Middle School | 424 | 36.5% |
| High School | 193 | 16.6% |
| College / Undergraduate | 63 | 5.4% |
| Graduate / Professional | 105 | 9.0% |
| Total | 1,162 | 100.0% |
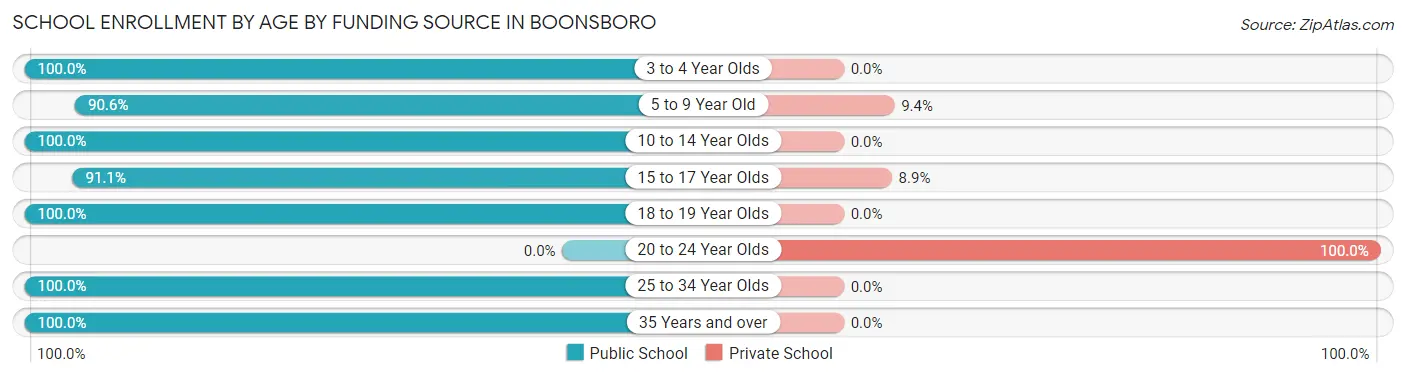
School Enrollment by Age by Funding Source in Boonsboro
Out of a total of 1,162 students who are enrolled in schools in Boonsboro, 65 (5.6%) attend a private institution, while the remaining 1,097 (94.4%) are enrolled in public schools. The age group of 20 to 24 year olds has the highest likelihood of being enrolled in private schools, with 27 (100.0% in the age bracket) enrolled. Conversely, the age group of 3 to 4 year olds has the lowest likelihood of being enrolled in a private school, with 59 (100.0% in the age bracket) attending a public institution.
| Age Bracket | Public School | Private School |
| 3 to 4 Year Olds | 59 (100.0%) | 0 (0.0%) |
| 5 to 9 Year Old | 260 (90.6%) | 27 (9.4%) |
| 10 to 14 Year Olds | 470 (100.0%) | 0 (0.0%) |
| 15 to 17 Year Olds | 112 (91.1%) | 11 (8.9%) |
| 18 to 19 Year Olds | 62 (100.0%) | 0 (0.0%) |
| 20 to 24 Year Olds | 0 (0.0%) | 27 (100.0%) |
| 25 to 34 Year Olds | 42 (100.0%) | 0 (0.0%) |
| 35 Years and over | 92 (100.0%) | 0 (0.0%) |
| Total | 1,097 (94.4%) | 65 (5.6%) |
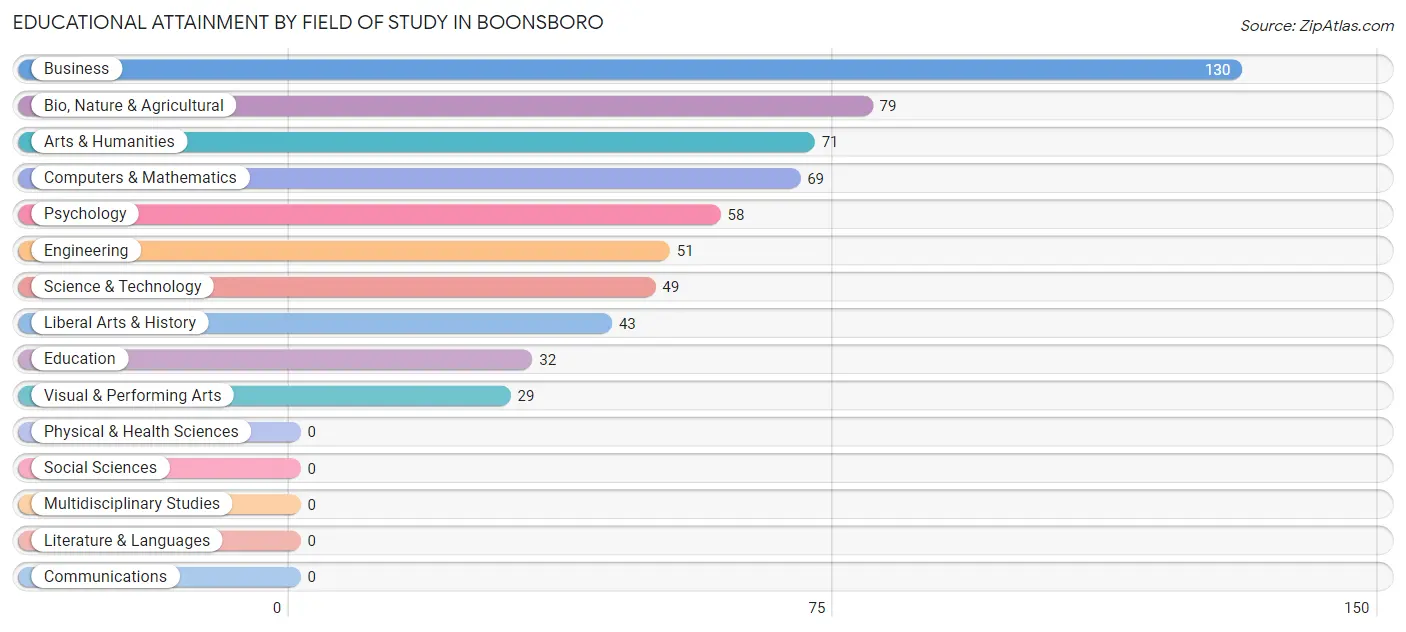
Educational Attainment by Field of Study in Boonsboro
Business (130 | 21.3%), bio, nature & agricultural (79 | 12.9%), arts & humanities (71 | 11.6%), computers & mathematics (69 | 11.3%), and psychology (58 | 9.5%) are the most common fields of study among 611 individuals in Boonsboro who have obtained a bachelor's degree or higher.
| Field of Study | # Graduates | % Graduates |
| Computers & Mathematics | 69 | 11.3% |
| Bio, Nature & Agricultural | 79 | 12.9% |
| Physical & Health Sciences | 0 | 0.0% |
| Psychology | 58 | 9.5% |
| Social Sciences | 0 | 0.0% |
| Engineering | 51 | 8.4% |
| Multidisciplinary Studies | 0 | 0.0% |
| Science & Technology | 49 | 8.0% |
| Business | 130 | 21.3% |
| Education | 32 | 5.2% |
| Literature & Languages | 0 | 0.0% |
| Liberal Arts & History | 43 | 7.0% |
| Visual & Performing Arts | 29 | 4.8% |
| Communications | 0 | 0.0% |
| Arts & Humanities | 71 | 11.6% |
| Total | 611 | 100.0% |
Transportation & Commute in Boonsboro
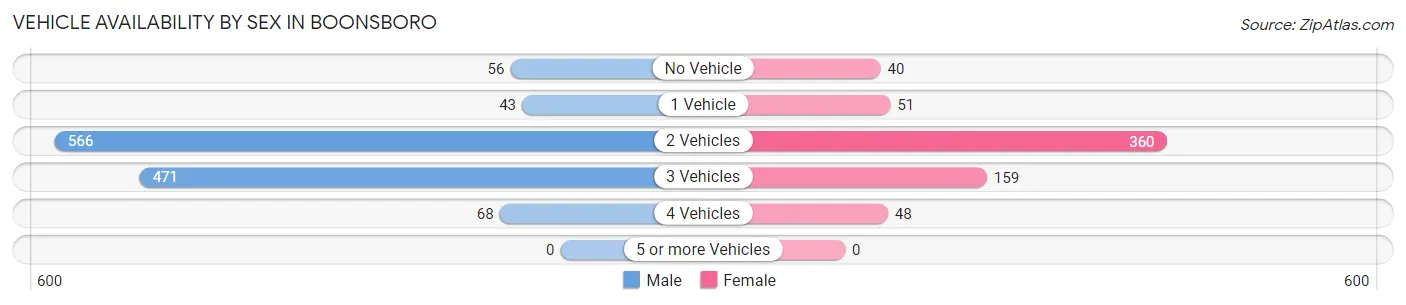
Vehicle Availability by Sex in Boonsboro
The most prevalent vehicle ownership categories in Boonsboro are males with 2 vehicles (566, accounting for 47.0%) and females with 2 vehicles (360, making up 86.0%).
| Vehicles Available | Male | Female |
| No Vehicle | 56 (4.6%) | 40 (6.1%) |
| 1 Vehicle | 43 (3.6%) | 51 (7.7%) |
| 2 Vehicles | 566 (47.0%) | 360 (54.7%) |
| 3 Vehicles | 471 (39.1%) | 159 (24.2%) |
| 4 Vehicles | 68 (5.7%) | 48 (7.3%) |
| 5 or more Vehicles | 0 (0.0%) | 0 (0.0%) |
| Total | 1,204 (100.0%) | 658 (100.0%) |
Commute Time in Boonsboro
The most frequently occuring commute durations in Boonsboro are 10 to 14 minutes (327 commuters, 20.0%), 30 to 34 minutes (315 commuters, 19.3%), and 60 to 89 minutes (209 commuters, 12.8%).
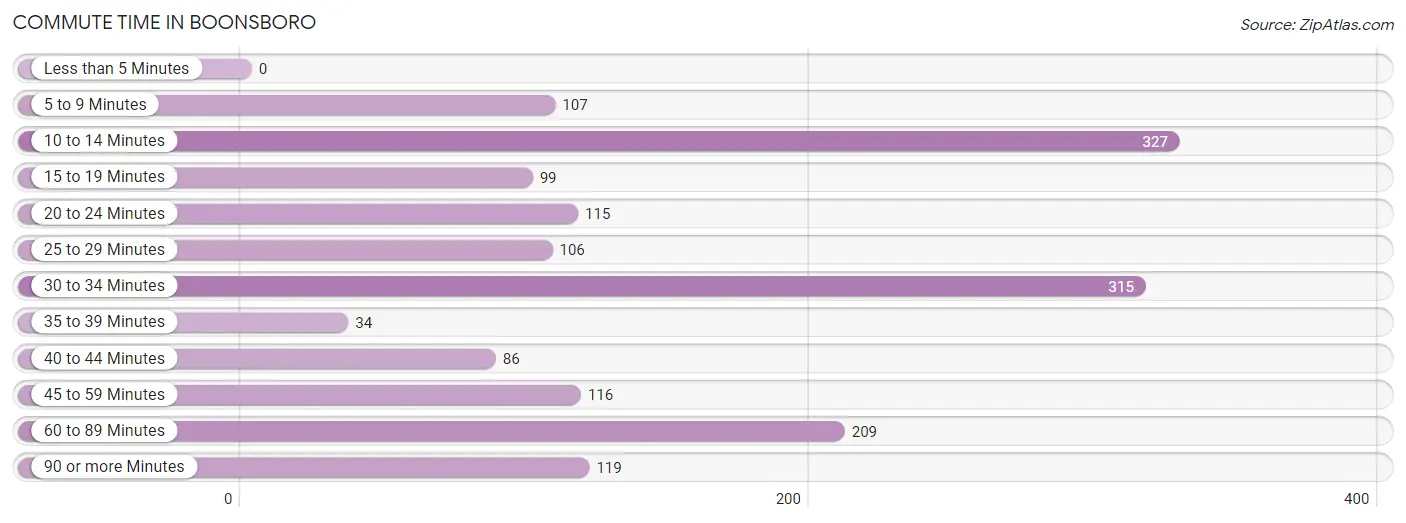
| Commute Time | # Commuters | % Commuters |
| Less than 5 Minutes | 0 | 0.0% |
| 5 to 9 Minutes | 107 | 6.6% |
| 10 to 14 Minutes | 327 | 20.0% |
| 15 to 19 Minutes | 99 | 6.1% |
| 20 to 24 Minutes | 115 | 7.0% |
| 25 to 29 Minutes | 106 | 6.5% |
| 30 to 34 Minutes | 315 | 19.3% |
| 35 to 39 Minutes | 34 | 2.1% |
| 40 to 44 Minutes | 86 | 5.3% |
| 45 to 59 Minutes | 116 | 7.1% |
| 60 to 89 Minutes | 209 | 12.8% |
| 90 or more Minutes | 119 | 7.3% |
Commute Time by Sex in Boonsboro
The most common commute times in Boonsboro are 30 to 34 minutes (283 commuters, 26.0%) for males and 60 to 89 minutes (118 commuters, 21.6%) for females.
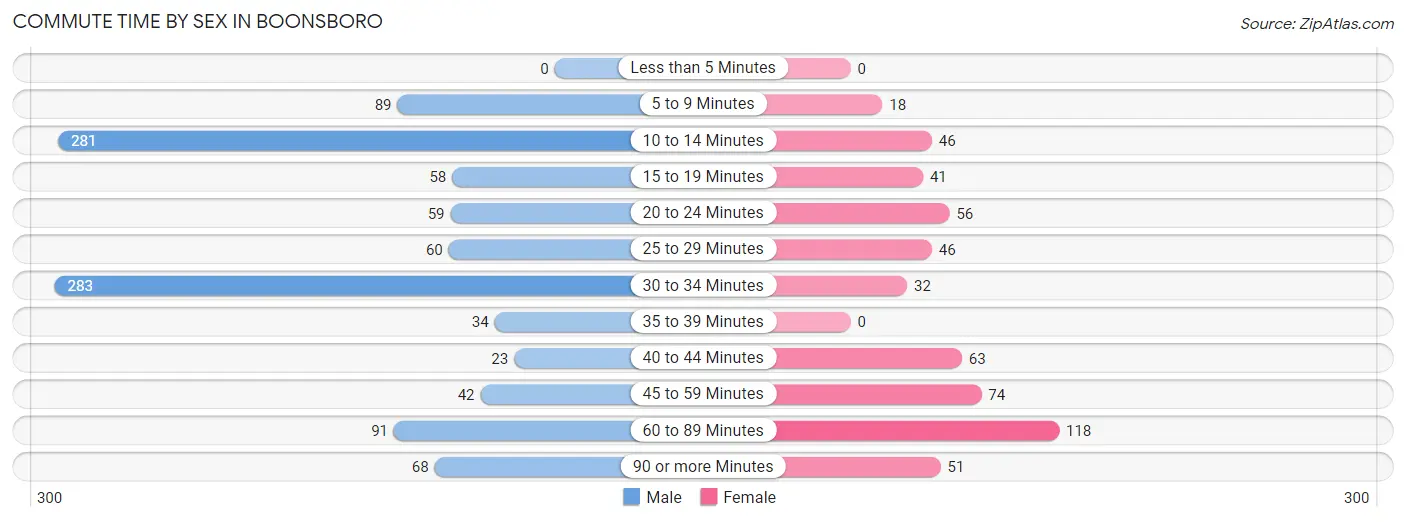
| Commute Time | Male | Female |
| Less than 5 Minutes | 0 (0.0%) | 0 (0.0%) |
| 5 to 9 Minutes | 89 (8.2%) | 18 (3.3%) |
| 10 to 14 Minutes | 281 (25.8%) | 46 (8.4%) |
| 15 to 19 Minutes | 58 (5.3%) | 41 (7.5%) |
| 20 to 24 Minutes | 59 (5.4%) | 56 (10.3%) |
| 25 to 29 Minutes | 60 (5.5%) | 46 (8.4%) |
| 30 to 34 Minutes | 283 (26.0%) | 32 (5.9%) |
| 35 to 39 Minutes | 34 (3.1%) | 0 (0.0%) |
| 40 to 44 Minutes | 23 (2.1%) | 63 (11.6%) |
| 45 to 59 Minutes | 42 (3.9%) | 74 (13.6%) |
| 60 to 89 Minutes | 91 (8.4%) | 118 (21.6%) |
| 90 or more Minutes | 68 (6.2%) | 51 (9.4%) |
Time of Departure to Work by Sex in Boonsboro
The most frequent times of departure to work in Boonsboro are 7:30 AM to 7:59 AM (279, 25.6%) for males and 6:30 AM to 6:59 AM (125, 22.9%) for females.
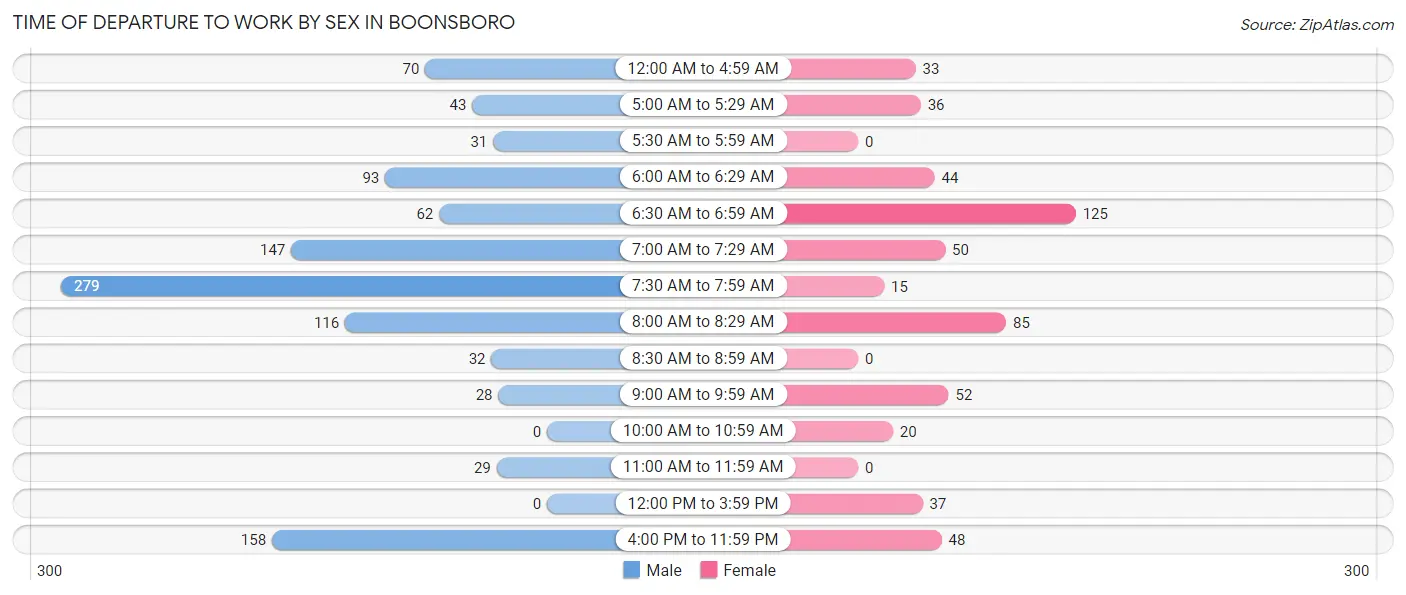
| Time of Departure | Male | Female |
| 12:00 AM to 4:59 AM | 70 (6.4%) | 33 (6.1%) |
| 5:00 AM to 5:29 AM | 43 (4.0%) | 36 (6.6%) |
| 5:30 AM to 5:59 AM | 31 (2.9%) | 0 (0.0%) |
| 6:00 AM to 6:29 AM | 93 (8.6%) | 44 (8.1%) |
| 6:30 AM to 6:59 AM | 62 (5.7%) | 125 (22.9%) |
| 7:00 AM to 7:29 AM | 147 (13.5%) | 50 (9.2%) |
| 7:30 AM to 7:59 AM | 279 (25.6%) | 15 (2.8%) |
| 8:00 AM to 8:29 AM | 116 (10.7%) | 85 (15.6%) |
| 8:30 AM to 8:59 AM | 32 (2.9%) | 0 (0.0%) |
| 9:00 AM to 9:59 AM | 28 (2.6%) | 52 (9.5%) |
| 10:00 AM to 10:59 AM | 0 (0.0%) | 20 (3.7%) |
| 11:00 AM to 11:59 AM | 29 (2.7%) | 0 (0.0%) |
| 12:00 PM to 3:59 PM | 0 (0.0%) | 37 (6.8%) |
| 4:00 PM to 11:59 PM | 158 (14.5%) | 48 (8.8%) |
| Total | 1,088 (100.0%) | 545 (100.0%) |
Housing Occupancy in Boonsboro
Occupancy by Ownership in Boonsboro
Of the total 1,438 dwellings in Boonsboro, owner-occupied units account for 1,121 (78.0%), while renter-occupied units make up 317 (22.0%).
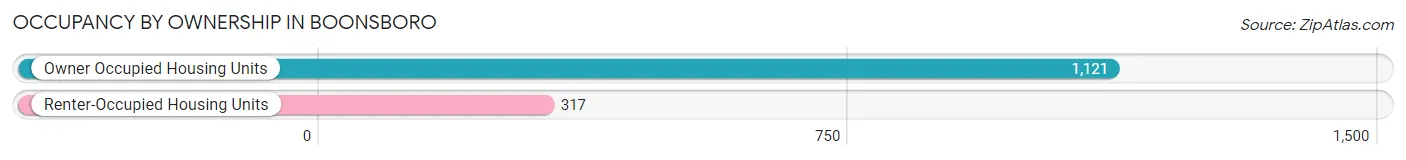
| Occupancy | # Housing Units | % Housing Units |
| Owner Occupied Housing Units | 1,121 | 78.0% |
| Renter-Occupied Housing Units | 317 | 22.0% |
| Total Occupied Housing Units | 1,438 | 100.0% |
Occupancy by Household Size in Boonsboro
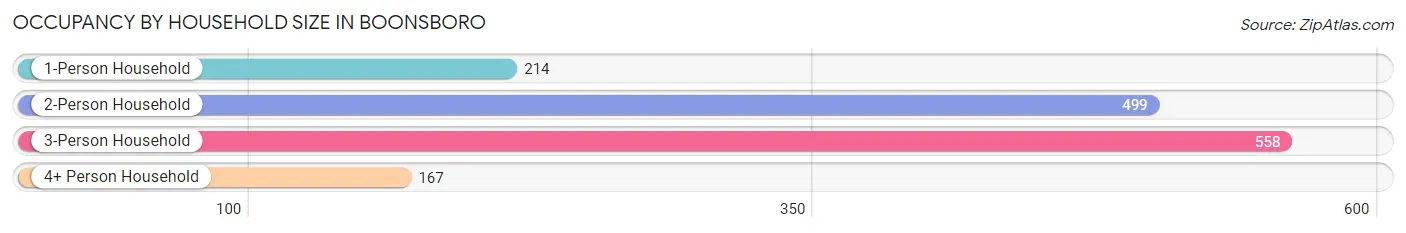
| Household Size | # Housing Units | % Housing Units |
| 1-Person Household | 214 | 14.9% |
| 2-Person Household | 499 | 34.7% |
| 3-Person Household | 558 | 38.8% |
| 4+ Person Household | 167 | 11.6% |
| Total Housing Units | 1,438 | 100.0% |
Occupancy by Ownership by Household Size in Boonsboro
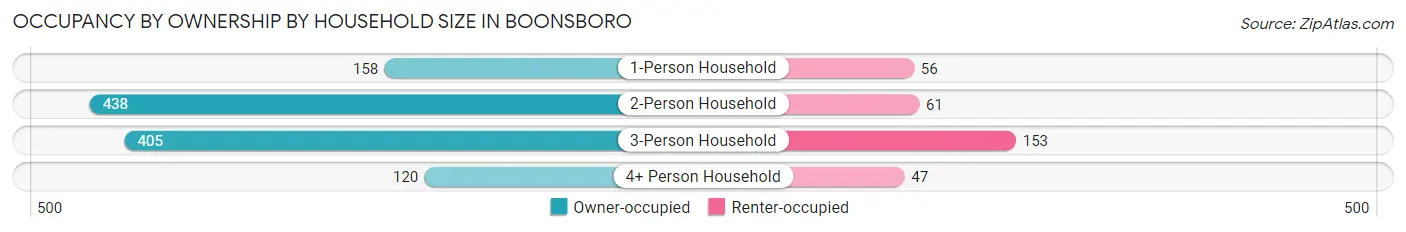
| Household Size | Owner-occupied | Renter-occupied |
| 1-Person Household | 158 (73.8%) | 56 (26.2%) |
| 2-Person Household | 438 (87.8%) | 61 (12.2%) |
| 3-Person Household | 405 (72.6%) | 153 (27.4%) |
| 4+ Person Household | 120 (71.9%) | 47 (28.1%) |
| Total Housing Units | 1,121 (78.0%) | 317 (22.0%) |
Occupancy by Educational Attainment in Boonsboro
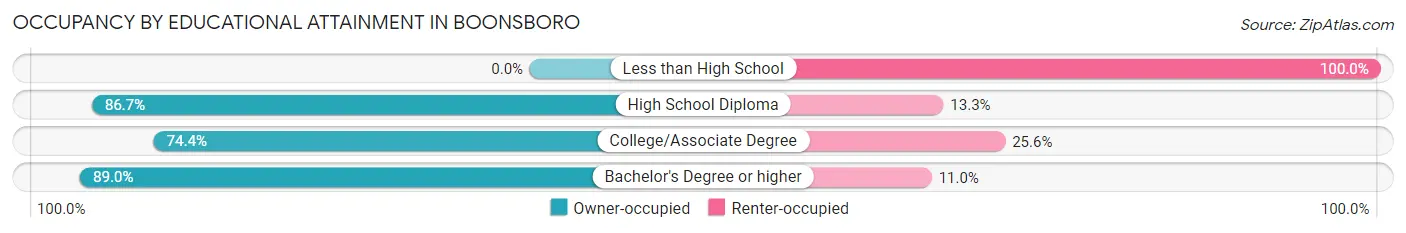
| Household Size | Owner-occupied | Renter-occupied |
| Less than High School | 0 (0.0%) | 40 (100.0%) |
| High School Diploma | 234 (86.7%) | 36 (13.3%) |
| College/Associate Degree | 596 (74.4%) | 205 (25.6%) |
| Bachelor's Degree or higher | 291 (89.0%) | 36 (11.0%) |
Occupancy by Age of Householder in Boonsboro
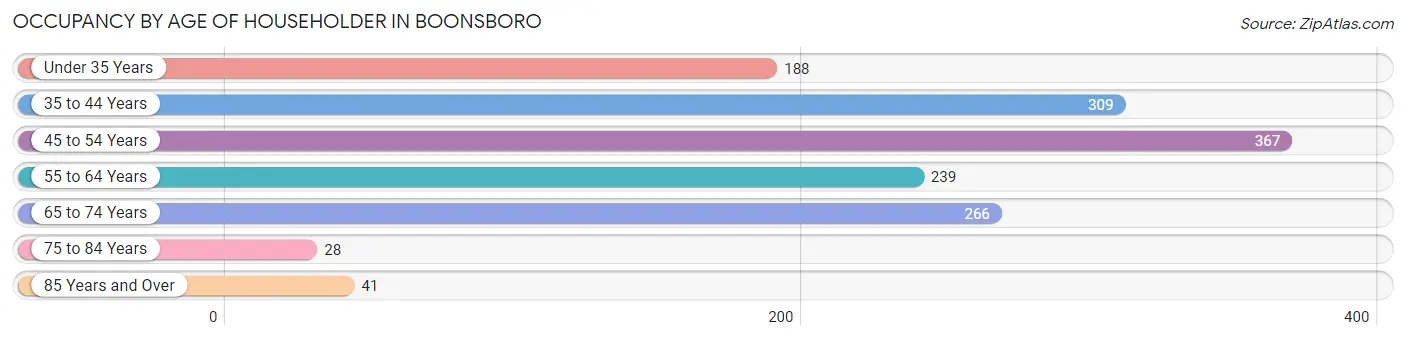
| Age Bracket | # Households | % Households |
| Under 35 Years | 188 | 13.1% |
| 35 to 44 Years | 309 | 21.5% |
| 45 to 54 Years | 367 | 25.5% |
| 55 to 64 Years | 239 | 16.6% |
| 65 to 74 Years | 266 | 18.5% |
| 75 to 84 Years | 28 | 1.9% |
| 85 Years and Over | 41 | 2.9% |
| Total | 1,438 | 100.0% |
Housing Finances in Boonsboro
Median Income by Occupancy in Boonsboro
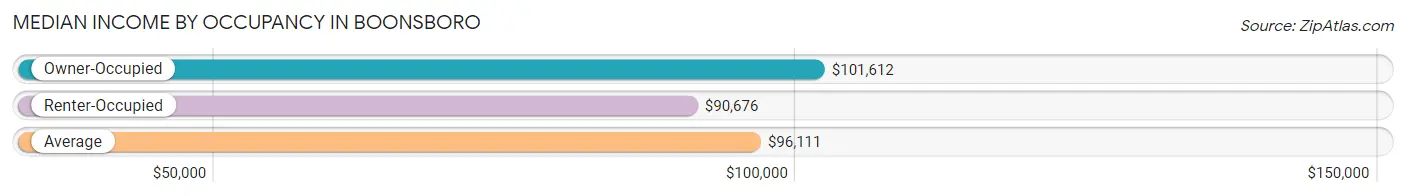
| Occupancy Type | # Households | Median Income |
| Owner-Occupied | 1,121 (78.0%) | $101,612 |
| Renter-Occupied | 317 (22.0%) | $90,676 |
| Average | 1,438 (100.0%) | $96,111 |
Occupancy by Householder Income Bracket in Boonsboro
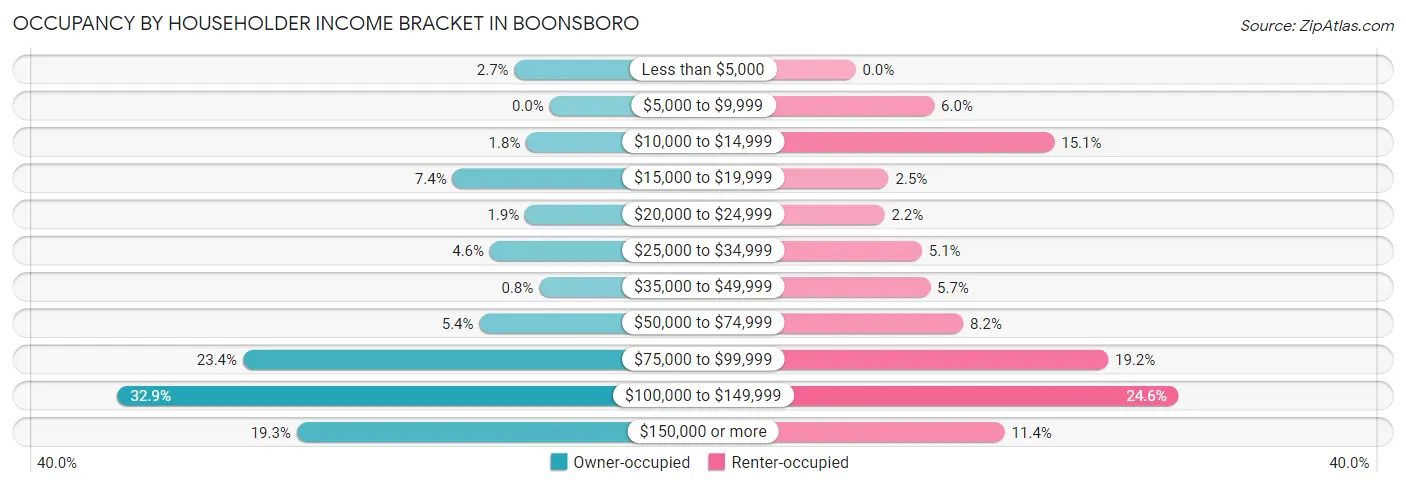
| Income Bracket | Owner-occupied | Renter-occupied |
| Less than $5,000 | 30 (2.7%) | 0 (0.0%) |
| $5,000 to $9,999 | 0 (0.0%) | 19 (6.0%) |
| $10,000 to $14,999 | 20 (1.8%) | 48 (15.1%) |
| $15,000 to $19,999 | 83 (7.4%) | 8 (2.5%) |
| $20,000 to $24,999 | 21 (1.9%) | 7 (2.2%) |
| $25,000 to $34,999 | 51 (4.5%) | 16 (5.1%) |
| $35,000 to $49,999 | 9 (0.8%) | 18 (5.7%) |
| $50,000 to $74,999 | 60 (5.3%) | 26 (8.2%) |
| $75,000 to $99,999 | 262 (23.4%) | 61 (19.2%) |
| $100,000 to $149,999 | 369 (32.9%) | 78 (24.6%) |
| $150,000 or more | 216 (19.3%) | 36 (11.4%) |
| Total | 1,121 (100.0%) | 317 (100.0%) |
Monthly Housing Cost Tiers in Boonsboro
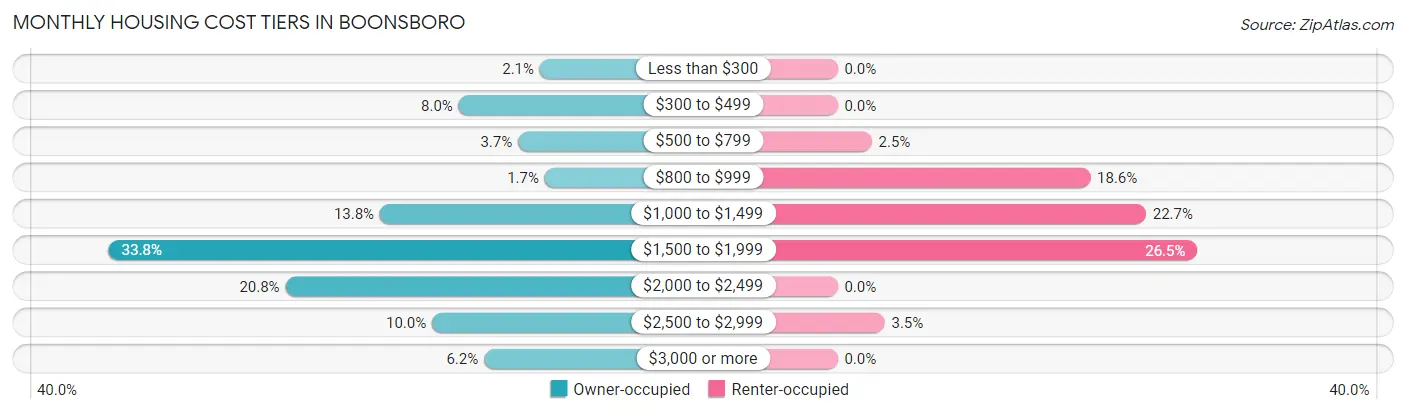
| Monthly Cost | Owner-occupied | Renter-occupied |
| Less than $300 | 23 (2.1%) | 0 (0.0%) |
| $300 to $499 | 90 (8.0%) | 0 (0.0%) |
| $500 to $799 | 41 (3.7%) | 8 (2.5%) |
| $800 to $999 | 19 (1.7%) | 59 (18.6%) |
| $1,000 to $1,499 | 155 (13.8%) | 72 (22.7%) |
| $1,500 to $1,999 | 379 (33.8%) | 84 (26.5%) |
| $2,000 to $2,499 | 233 (20.8%) | 0 (0.0%) |
| $2,500 to $2,999 | 112 (10.0%) | 11 (3.5%) |
| $3,000 or more | 69 (6.2%) | 0 (0.0%) |
| Total | 1,121 (100.0%) | 317 (100.0%) |
Physical Housing Characteristics in Boonsboro
Housing Structures in Boonsboro
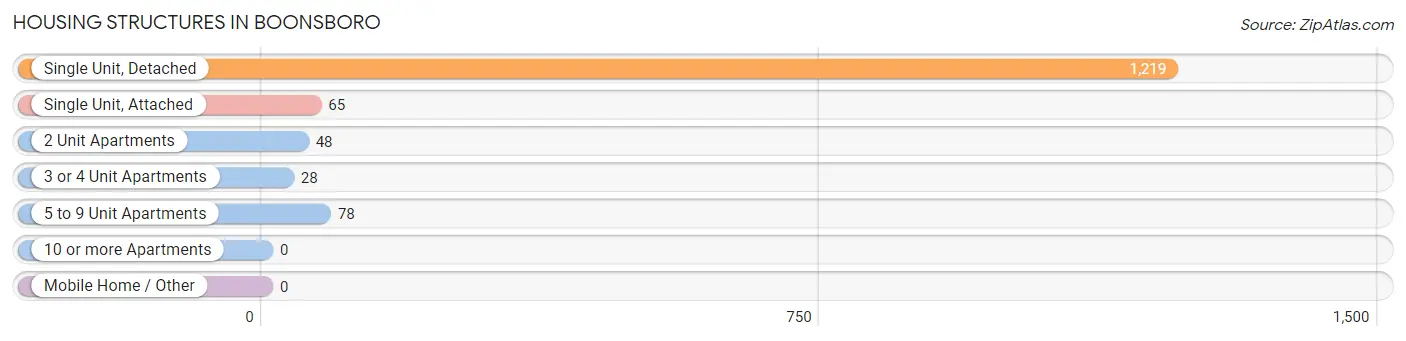
| Structure Type | # Housing Units | % Housing Units |
| Single Unit, Detached | 1,219 | 84.8% |
| Single Unit, Attached | 65 | 4.5% |
| 2 Unit Apartments | 48 | 3.3% |
| 3 or 4 Unit Apartments | 28 | 1.9% |
| 5 to 9 Unit Apartments | 78 | 5.4% |
| 10 or more Apartments | 0 | 0.0% |
| Mobile Home / Other | 0 | 0.0% |
| Total | 1,438 | 100.0% |
Housing Structures by Occupancy in Boonsboro
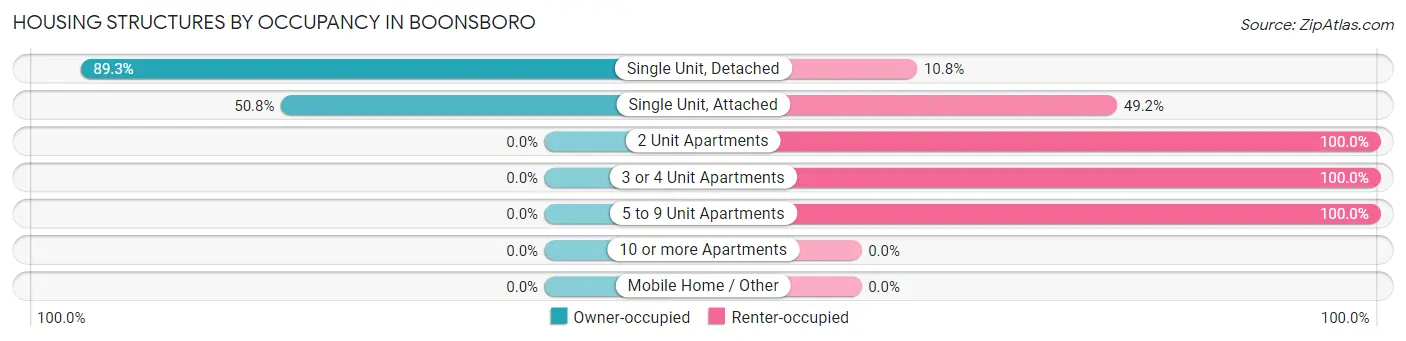
| Structure Type | Owner-occupied | Renter-occupied |
| Single Unit, Detached | 1,088 (89.2%) | 131 (10.7%) |
| Single Unit, Attached | 33 (50.8%) | 32 (49.2%) |
| 2 Unit Apartments | 0 (0.0%) | 48 (100.0%) |
| 3 or 4 Unit Apartments | 0 (0.0%) | 28 (100.0%) |
| 5 to 9 Unit Apartments | 0 (0.0%) | 78 (100.0%) |
| 10 or more Apartments | 0 (0.0%) | 0 (0.0%) |
| Mobile Home / Other | 0 (0.0%) | 0 (0.0%) |
| Total | 1,121 (78.0%) | 317 (22.0%) |
Housing Structures by Number of Rooms in Boonsboro
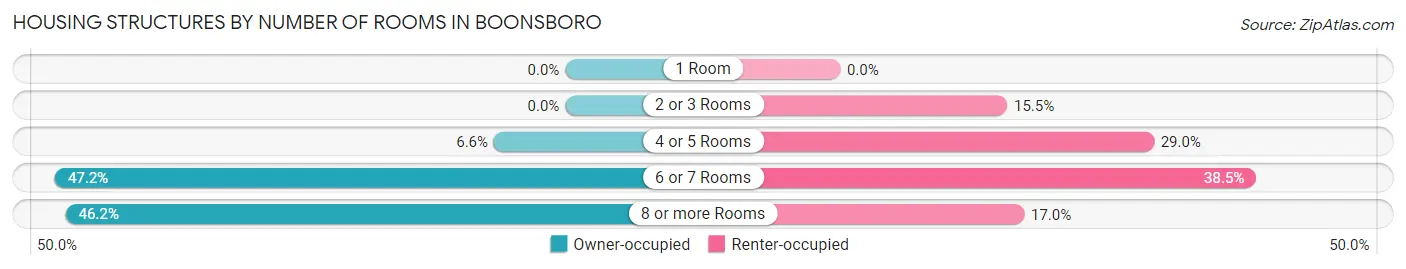
| Number of Rooms | Owner-occupied | Renter-occupied |
| 1 Room | 0 (0.0%) | 0 (0.0%) |
| 2 or 3 Rooms | 0 (0.0%) | 49 (15.5%) |
| 4 or 5 Rooms | 74 (6.6%) | 92 (29.0%) |
| 6 or 7 Rooms | 529 (47.2%) | 122 (38.5%) |
| 8 or more Rooms | 518 (46.2%) | 54 (17.0%) |
| Total | 1,121 (100.0%) | 317 (100.0%) |
Housing Structure by Heating Type in Boonsboro
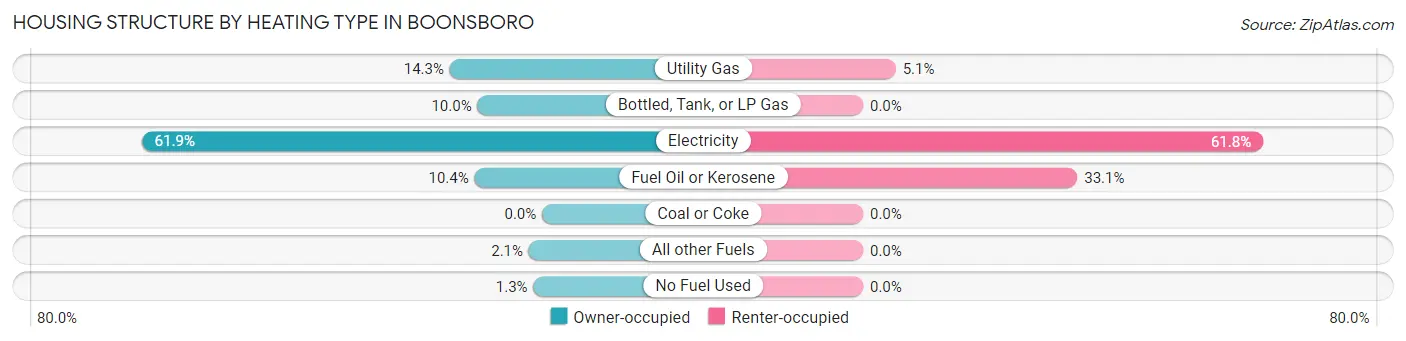
| Heating Type | Owner-occupied | Renter-occupied |
| Utility Gas | 160 (14.3%) | 16 (5.1%) |
| Bottled, Tank, or LP Gas | 112 (10.0%) | 0 (0.0%) |
| Electricity | 694 (61.9%) | 196 (61.8%) |
| Fuel Oil or Kerosene | 117 (10.4%) | 105 (33.1%) |
| Coal or Coke | 0 (0.0%) | 0 (0.0%) |
| All other Fuels | 23 (2.1%) | 0 (0.0%) |
| No Fuel Used | 15 (1.3%) | 0 (0.0%) |
| Total | 1,121 (100.0%) | 317 (100.0%) |
Household Vehicle Usage in Boonsboro
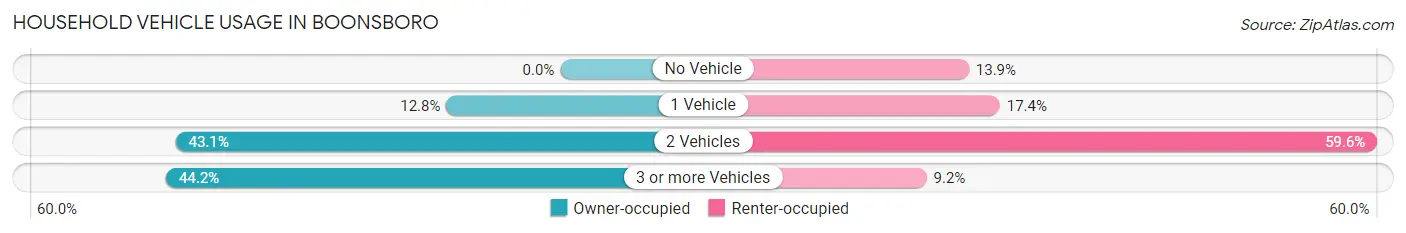
| Vehicles per Household | Owner-occupied | Renter-occupied |
| No Vehicle | 0 (0.0%) | 44 (13.9%) |
| 1 Vehicle | 143 (12.8%) | 55 (17.3%) |
| 2 Vehicles | 483 (43.1%) | 189 (59.6%) |
| 3 or more Vehicles | 495 (44.2%) | 29 (9.1%) |
| Total | 1,121 (100.0%) | 317 (100.0%) |
Real Estate & Mortgages in Boonsboro
Real Estate and Mortgage Overview in Boonsboro
| Characteristic | Without Mortgage | With Mortgage |
| Housing Units | 212 | 909 |
| Median Property Value | $310,200 | $345,400 |
| Median Household Income | $77,372 | $177 |
| Monthly Housing Costs | $490 | $69 |
| Real Estate Taxes | $2,789 | $0 |
Property Value by Mortgage Status in Boonsboro
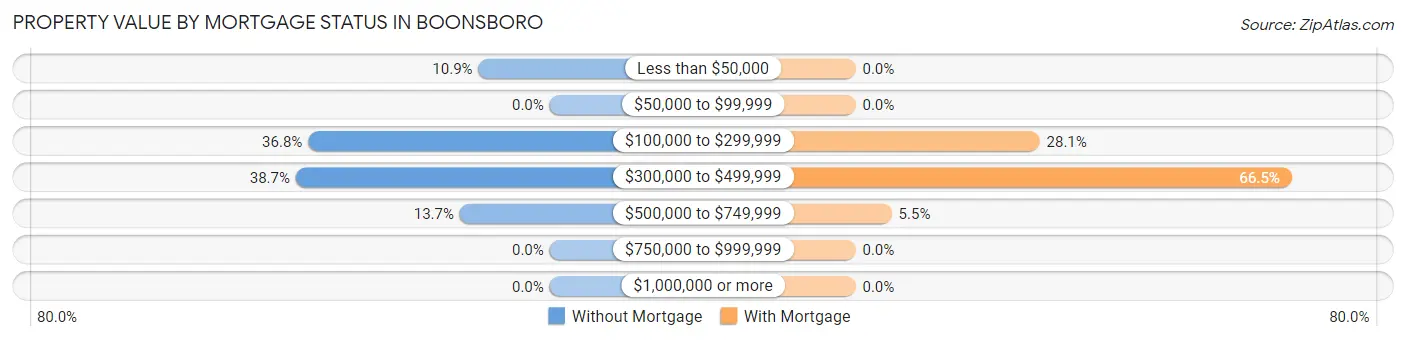
| Property Value | Without Mortgage | With Mortgage |
| Less than $50,000 | 23 (10.8%) | 0 (0.0%) |
| $50,000 to $99,999 | 0 (0.0%) | 0 (0.0%) |
| $100,000 to $299,999 | 78 (36.8%) | 255 (28.1%) |
| $300,000 to $499,999 | 82 (38.7%) | 604 (66.4%) |
| $500,000 to $749,999 | 29 (13.7%) | 50 (5.5%) |
| $750,000 to $999,999 | 0 (0.0%) | 0 (0.0%) |
| $1,000,000 or more | 0 (0.0%) | 0 (0.0%) |
| Total | 212 (100.0%) | 909 (100.0%) |
Household Income by Mortgage Status in Boonsboro
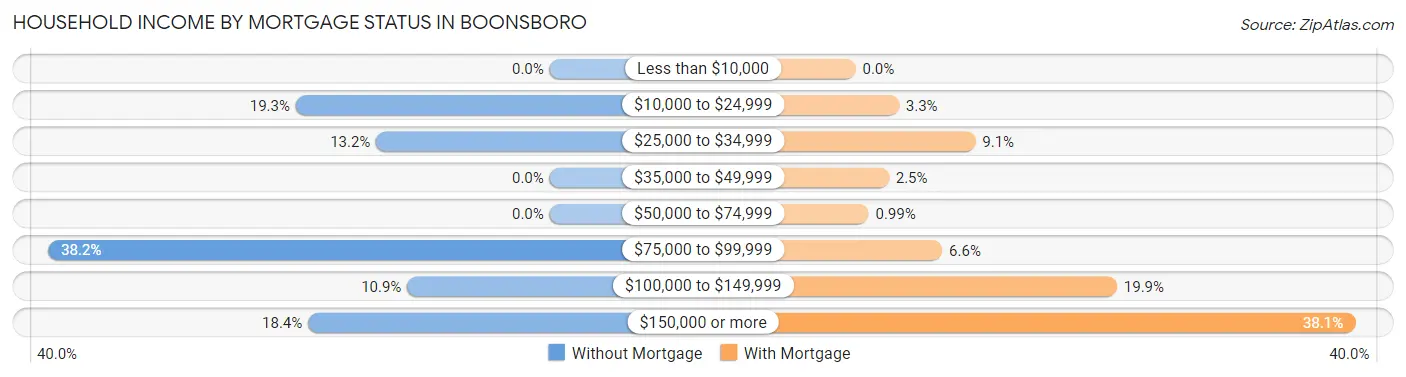
| Household Income | Without Mortgage | With Mortgage |
| Less than $10,000 | 0 (0.0%) | 0 (0.0%) |
| $10,000 to $24,999 | 41 (19.3%) | 30 (3.3%) |
| $25,000 to $34,999 | 28 (13.2%) | 83 (9.1%) |
| $35,000 to $49,999 | 0 (0.0%) | 23 (2.5%) |
| $50,000 to $74,999 | 0 (0.0%) | 9 (1.0%) |
| $75,000 to $99,999 | 81 (38.2%) | 60 (6.6%) |
| $100,000 to $149,999 | 23 (10.8%) | 181 (19.9%) |
| $150,000 or more | 39 (18.4%) | 346 (38.1%) |
| Total | 212 (100.0%) | 909 (100.0%) |
Property Value to Household Income Ratio in Boonsboro
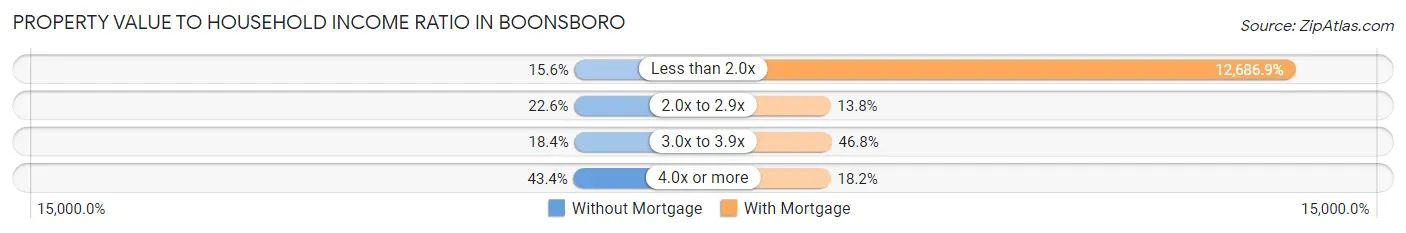
| Value-to-Income Ratio | Without Mortgage | With Mortgage |
| Less than 2.0x | 33 (15.6%) | 115,324 (12,686.9%) |
| 2.0x to 2.9x | 48 (22.6%) | 125 (13.8%) |
| 3.0x to 3.9x | 39 (18.4%) | 425 (46.8%) |
| 4.0x or more | 92 (43.4%) | 165 (18.1%) |
| Total | 212 (100.0%) | 909 (100.0%) |
Real Estate Taxes by Mortgage Status in Boonsboro

| Property Taxes | Without Mortgage | With Mortgage |
| Less than $800 | 23 (10.8%) | 30 (3.3%) |
| $800 to $1,499 | 0 (0.0%) | 0 (0.0%) |
| $800 to $1,499 | 189 (89.1%) | 336 (37.0%) |
| Total | 212 (100.0%) | 909 (100.0%) |
Health & Disability in Boonsboro
Health Insurance Coverage by Age in Boonsboro
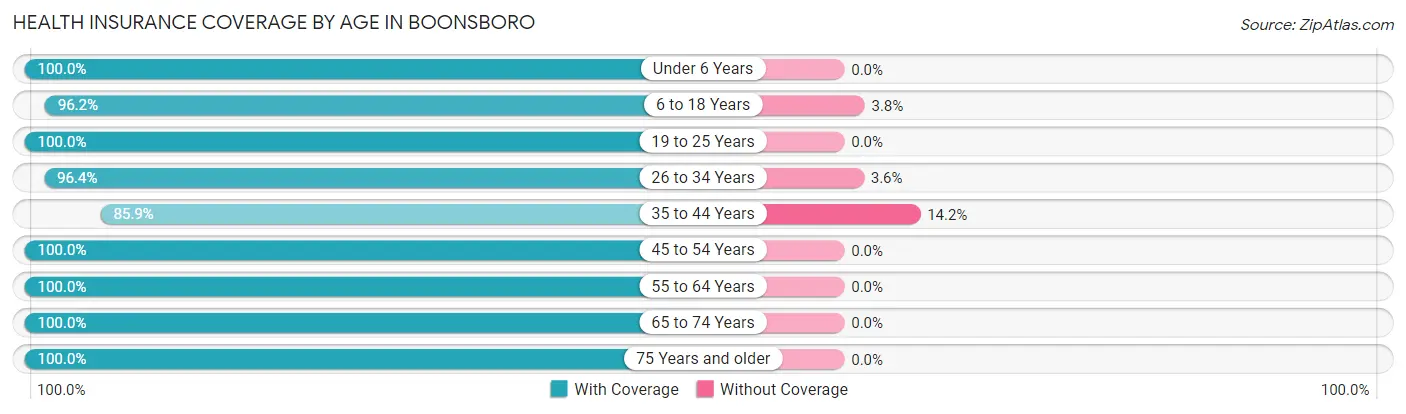
| Age Bracket | With Coverage | Without Coverage |
| Under 6 Years | 250 (100.0%) | 0 (0.0%) |
| 6 to 18 Years | 867 (96.2%) | 34 (3.8%) |
| 19 to 25 Years | 298 (100.0%) | 0 (0.0%) |
| 26 to 34 Years | 186 (96.4%) | 7 (3.6%) |
| 35 to 44 Years | 540 (85.9%) | 89 (14.1%) |
| 45 to 54 Years | 562 (100.0%) | 0 (0.0%) |
| 55 to 64 Years | 376 (100.0%) | 0 (0.0%) |
| 65 to 74 Years | 346 (100.0%) | 0 (0.0%) |
| 75 Years and older | 105 (100.0%) | 0 (0.0%) |
| Total | 3,530 (96.5%) | 130 (3.5%) |
Health Insurance Coverage by Citizenship Status in Boonsboro
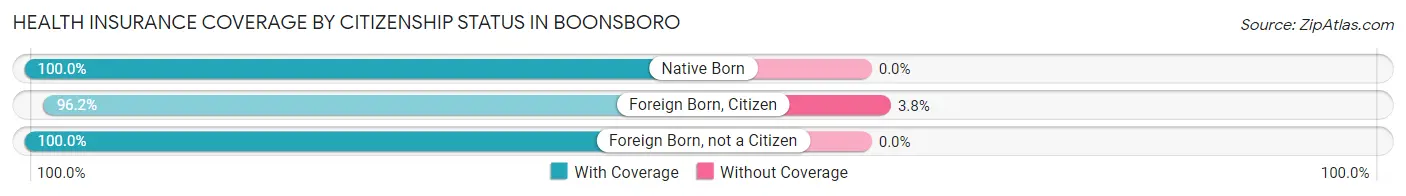
| Citizenship Status | With Coverage | Without Coverage |
| Native Born | 250 (100.0%) | 0 (0.0%) |
| Foreign Born, Citizen | 867 (96.2%) | 34 (3.8%) |
| Foreign Born, not a Citizen | 298 (100.0%) | 0 (0.0%) |
Health Insurance Coverage by Household Income in Boonsboro
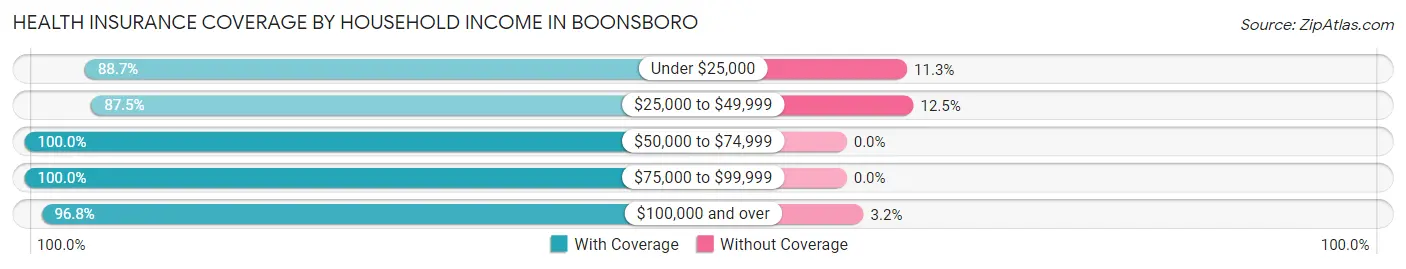
| Household Income | With Coverage | Without Coverage |
| Under $25,000 | 353 (88.7%) | 45 (11.3%) |
| $25,000 to $49,999 | 161 (87.5%) | 23 (12.5%) |
| $50,000 to $74,999 | 146 (100.0%) | 0 (0.0%) |
| $75,000 to $99,999 | 962 (100.0%) | 0 (0.0%) |
| $100,000 and over | 1,899 (96.8%) | 62 (3.2%) |
Public vs Private Health Insurance Coverage by Age in Boonsboro
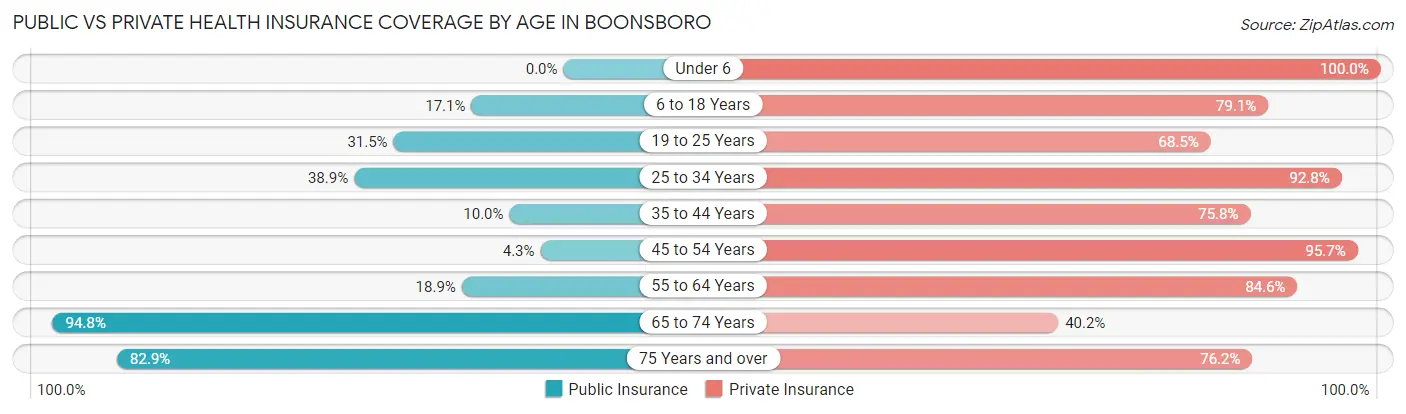
| Age Bracket | Public Insurance | Private Insurance |
| Under 6 | 0 (0.0%) | 250 (100.0%) |
| 6 to 18 Years | 154 (17.1%) | 713 (79.1%) |
| 19 to 25 Years | 94 (31.5%) | 204 (68.5%) |
| 25 to 34 Years | 75 (38.9%) | 179 (92.7%) |
| 35 to 44 Years | 63 (10.0%) | 477 (75.8%) |
| 45 to 54 Years | 24 (4.3%) | 538 (95.7%) |
| 55 to 64 Years | 71 (18.9%) | 318 (84.6%) |
| 65 to 74 Years | 328 (94.8%) | 139 (40.2%) |
| 75 Years and over | 87 (82.9%) | 80 (76.2%) |
| Total | 896 (24.5%) | 2,898 (79.2%) |
Disability Status by Sex by Age in Boonsboro
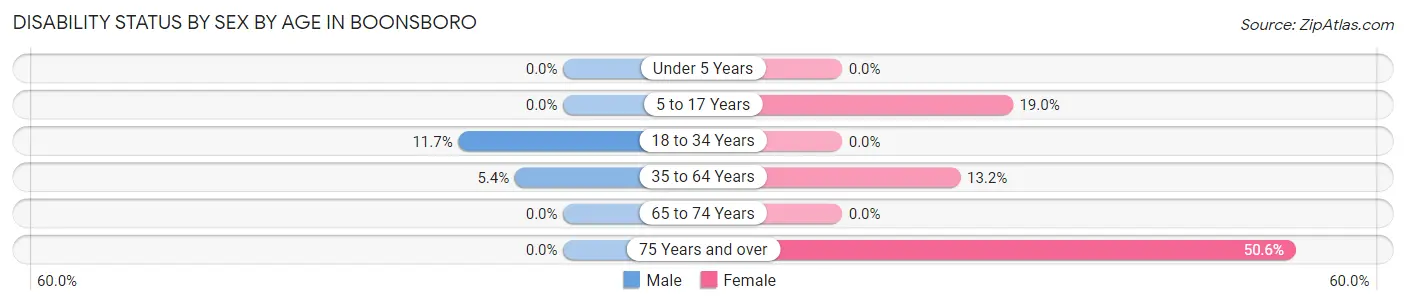
| Age Bracket | Male | Female |
| Under 5 Years | 0 (0.0%) | 0 (0.0%) |
| 5 to 17 Years | 0 (0.0%) | 50 (19.0%) |
| 18 to 34 Years | 43 (11.7%) | 0 (0.0%) |
| 35 to 64 Years | 50 (5.4%) | 84 (13.2%) |
| 65 to 74 Years | 0 (0.0%) | 0 (0.0%) |
| 75 Years and over | 0 (0.0%) | 45 (50.6%) |
Disability Class by Sex by Age in Boonsboro
Disability Class: Hearing Difficulty
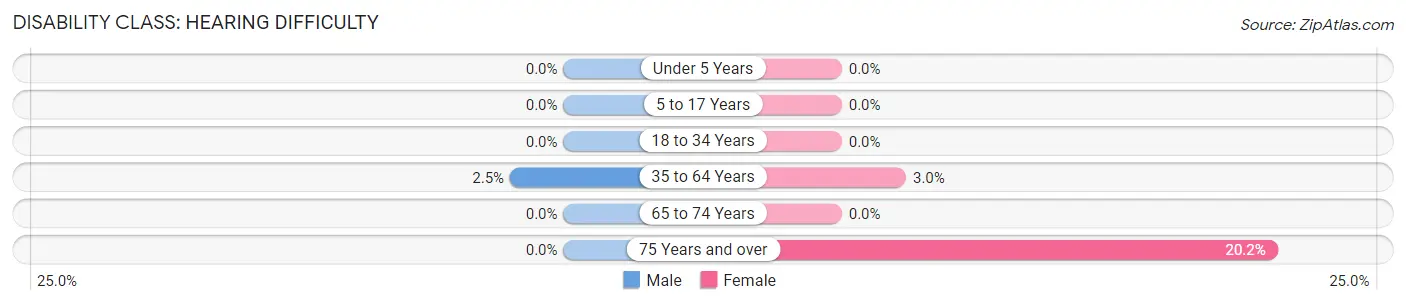
| Age Bracket | Male | Female |
| Under 5 Years | 0 (0.0%) | 0 (0.0%) |
| 5 to 17 Years | 0 (0.0%) | 0 (0.0%) |
| 18 to 34 Years | 0 (0.0%) | 0 (0.0%) |
| 35 to 64 Years | 23 (2.5%) | 19 (3.0%) |
| 65 to 74 Years | 0 (0.0%) | 0 (0.0%) |
| 75 Years and over | 0 (0.0%) | 18 (20.2%) |
Disability Class: Vision Difficulty
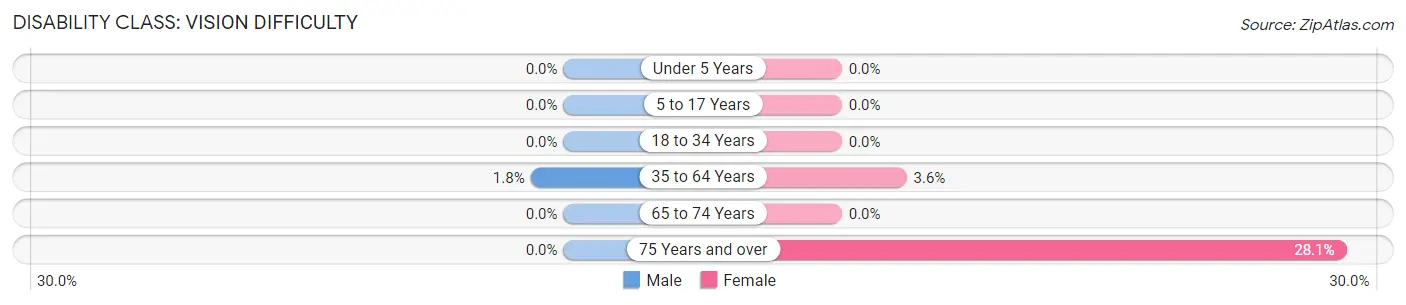
| Age Bracket | Male | Female |
| Under 5 Years | 0 (0.0%) | 0 (0.0%) |
| 5 to 17 Years | 0 (0.0%) | 0 (0.0%) |
| 18 to 34 Years | 0 (0.0%) | 0 (0.0%) |
| 35 to 64 Years | 17 (1.8%) | 23 (3.6%) |
| 65 to 74 Years | 0 (0.0%) | 0 (0.0%) |
| 75 Years and over | 0 (0.0%) | 25 (28.1%) |
Disability Class: Cognitive Difficulty
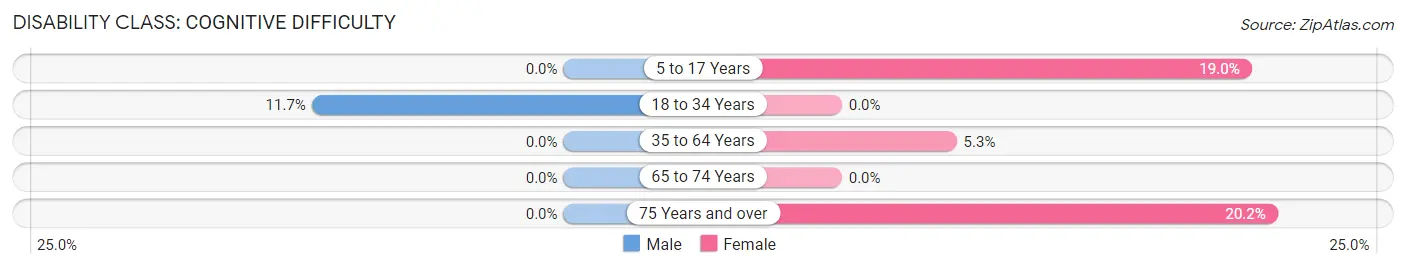
| Age Bracket | Male | Female |
| 5 to 17 Years | 0 (0.0%) | 50 (19.0%) |
| 18 to 34 Years | 43 (11.7%) | 0 (0.0%) |
| 35 to 64 Years | 0 (0.0%) | 34 (5.3%) |
| 65 to 74 Years | 0 (0.0%) | 0 (0.0%) |
| 75 Years and over | 0 (0.0%) | 18 (20.2%) |
Disability Class: Ambulatory Difficulty
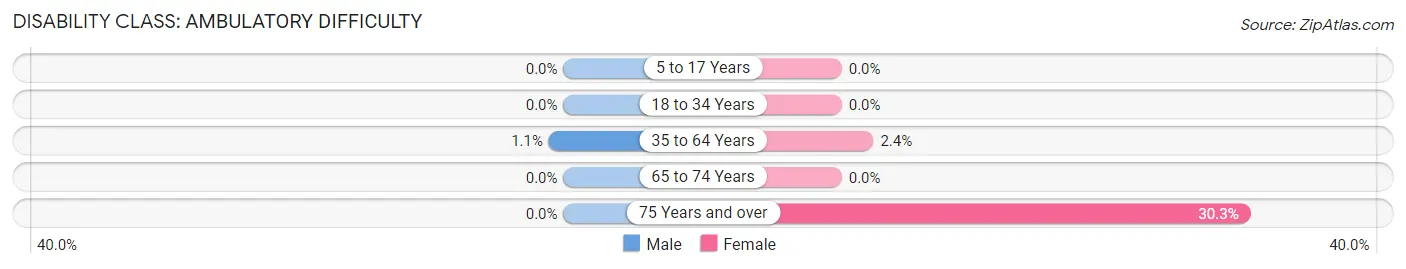
| Age Bracket | Male | Female |
| 5 to 17 Years | 0 (0.0%) | 0 (0.0%) |
| 18 to 34 Years | 0 (0.0%) | 0 (0.0%) |
| 35 to 64 Years | 10 (1.1%) | 15 (2.4%) |
| 65 to 74 Years | 0 (0.0%) | 0 (0.0%) |
| 75 Years and over | 0 (0.0%) | 27 (30.3%) |
Disability Class: Self-Care Difficulty
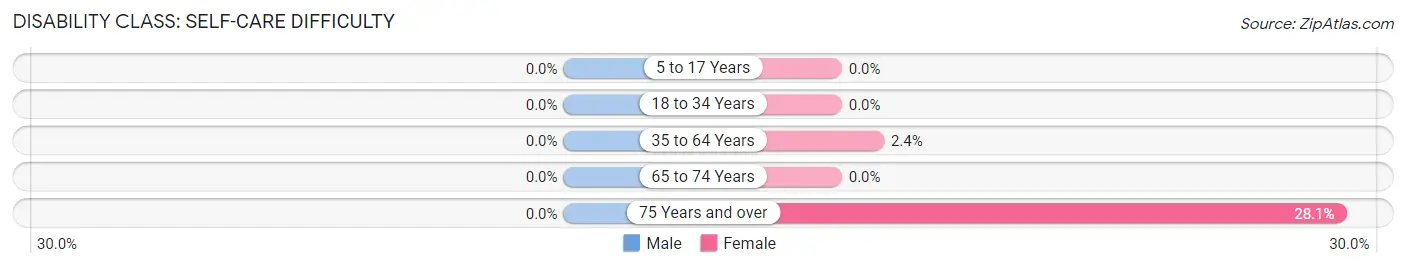
| Age Bracket | Male | Female |
| 5 to 17 Years | 0 (0.0%) | 0 (0.0%) |
| 18 to 34 Years | 0 (0.0%) | 0 (0.0%) |
| 35 to 64 Years | 0 (0.0%) | 15 (2.4%) |
| 65 to 74 Years | 0 (0.0%) | 0 (0.0%) |
| 75 Years and over | 0 (0.0%) | 25 (28.1%) |
Technology Access in Boonsboro
Computing Device Access in Boonsboro
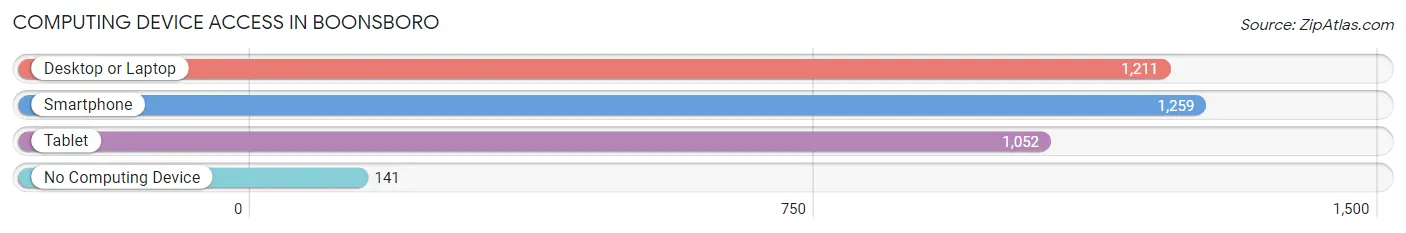
| Device Type | # Households | % Households |
| Desktop or Laptop | 1,211 | 84.2% |
| Smartphone | 1,259 | 87.5% |
| Tablet | 1,052 | 73.2% |
| No Computing Device | 141 | 9.8% |
| Total | 1,438 | 100.0% |
Internet Access in Boonsboro
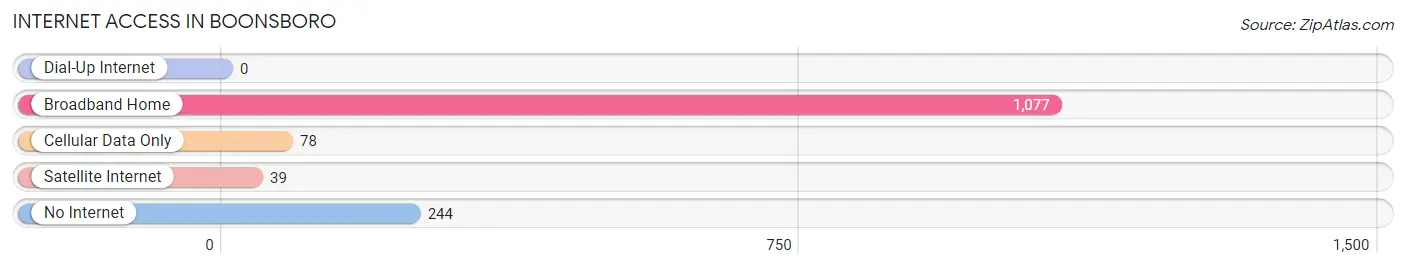
| Internet Type | # Households | % Households |
| Dial-Up Internet | 0 | 0.0% |
| Broadband Home | 1,077 | 74.9% |
| Cellular Data Only | 78 | 5.4% |
| Satellite Internet | 39 | 2.7% |
| No Internet | 244 | 17.0% |
| Total | 1,438 | 100.0% |
Boonsboro Summary
Boonsboro is a town located in Washington County, Maryland, United States. It is situated in the foothills of South Mountain, approximately 10 miles south of Hagerstown. The town was founded in 1792 by George Boone, a great-grandson of Daniel Boone, and was incorporated in 1831. Boonsboro has a rich history, diverse geography, and a vibrant economy.
History
Boonsboro was founded in 1792 by George Boone, a great-grandson of Daniel Boone. The town was originally known as Boonesborough, but the name was changed to Boonsboro in 1831 when it was incorporated. The town was an important stop on the National Road, which was the first federally funded highway in the United States. The road was built in the early 19th century to connect the Potomac and Ohio Rivers.
During the Civil War, Boonsboro was the site of several battles, including the Battle of South Mountain and the Battle of Antietam. The town was also the site of the first Confederate victory in Maryland, when Confederate forces defeated Union forces at the Battle of Boonsboro in 1862.
Geography
Boonsboro is located in Washington County, Maryland, approximately 10 miles south of Hagerstown. The town is situated in the foothills of South Mountain, which is part of the Appalachian Mountains. The town is bordered by the Potomac River to the east and the Antietam Creek to the west.
The town has a total area of 1.3 square miles, all of which is land. Boonsboro has a humid subtropical climate, with hot, humid summers and cold, wet winters. The average annual temperature is 54°F, and the average annual precipitation is 41 inches.
Economy
Boonsboro has a vibrant economy, with a variety of businesses and industries. The town is home to several manufacturing companies, including a furniture manufacturer, a plastics manufacturer, and a metal fabrication company. Boonsboro is also home to several retail stores, restaurants, and other businesses.
The town is also home to several tourist attractions, including the South Mountain State Battlefield, the Washington Monument State Park, and the Boonsboro Historic District. These attractions draw thousands of visitors to the town each year, providing a boost to the local economy.
Demographics
As of the 2010 census, Boonsboro had a population of 3,336. The population is predominantly white (93.3%), with small percentages of African American (3.2%), Asian (1.2%), and Hispanic or Latino (1.2%) residents. The median household income is $50,902, and the median age is 41.
Boonsboro is a small town with a rich history, diverse geography, and a vibrant economy. The town is home to a variety of businesses and industries, as well as several tourist attractions. Boonsboro is a great place to live, work, and visit.
Common Questions
What is Per Capita Income in Boonsboro?
Per Capita income in Boonsboro is $41,004.
What is the Median Family Income in Boonsboro?
Median Family Income in Boonsboro is $116,944.
What is the Median Household income in Boonsboro?
Median Household Income in Boonsboro is $96,111.
What is Income or Wage Gap in Boonsboro?
Income or Wage Gap in Boonsboro is 15.7%.
Women in Boonsboro earn 84.3 cents for every dollar earned by a man.
What is Inequality or Gini Index in Boonsboro?
Inequality or Gini Index in Boonsboro is 0.35.
What is the Total Population of Boonsboro?
Total Population of Boonsboro is 3,785.
What is the Total Male Population of Boonsboro?
Total Male Population of Boonsboro is 2,224.
What is the Total Female Population of Boonsboro?
Total Female Population of Boonsboro is 1,561.
What is the Ratio of Males per 100 Females in Boonsboro?
There are 142.47 Males per 100 Females in Boonsboro.
What is the Ratio of Females per 100 Males in Boonsboro?
There are 70.19 Females per 100 Males in Boonsboro.
What is the Median Population Age in Boonsboro?
Median Population Age in Boonsboro is 38.5 Years.
What is the Average Family Size in Boonsboro
Average Family Size in Boonsboro is 2.8 People.
What is the Average Household Size in Boonsboro
Average Household Size in Boonsboro is 2.5 People.
How Large is the Labor Force in Boonsboro?
There are 1,930 People in the Labor Forcein in Boonsboro.
What is the Percentage of People in the Labor Force in Boonsboro?
69.6% of People are in the Labor Force in Boonsboro.
What is the Unemployment Rate in Boonsboro?
Unemployment Rate in Boonsboro is 3.5%.