Port Deposit, MD Map & Demographics
Port Deposit Map
Port Deposit Overview
$37,227
PER CAPITA INCOME
$70,208
AVG FAMILY INCOME
$46,979
AVG HOUSEHOLD INCOME
29.4%
WAGE / INCOME GAP [ % ]
70.6¢/ $1
WAGE / INCOME GAP [ $ ]
0.54
INEQUALITY / GINI INDEX
587
TOTAL POPULATION
253
MALE POPULATION
334
FEMALE POPULATION
75.75
MALES / 100 FEMALES
132.02
FEMALES / 100 MALES
38.1
MEDIAN AGE
3.1
AVG FAMILY SIZE
2.0
AVG HOUSEHOLD SIZE
294
LABOR FORCE [ PEOPLE ]
64.6%
PERCENT IN LABOR FORCE
Port Deposit Zip Codes
Income in Port Deposit
Income Overview in Port Deposit
Per Capita Income in Port Deposit is $37,227, while median incomes of families and households are $70,208 and $46,979 respectively.
| Characteristic | Number | Measure |
| Per Capita Income | 587 | $37,227 |
| Median Family Income | 123 | $70,208 |
| Mean Family Income | 123 | $105,840 |
| Median Household Income | 285 | $46,979 |
| Mean Household Income | 285 | $78,405 |
| Income Deficit | 123 | $0 |
| Wage / Income Gap (%) | 587 | 29.39% |
| Wage / Income Gap ($) | 587 | 70.61¢ per $1 |
| Gini / Inequality Index | 587 | 0.54 |
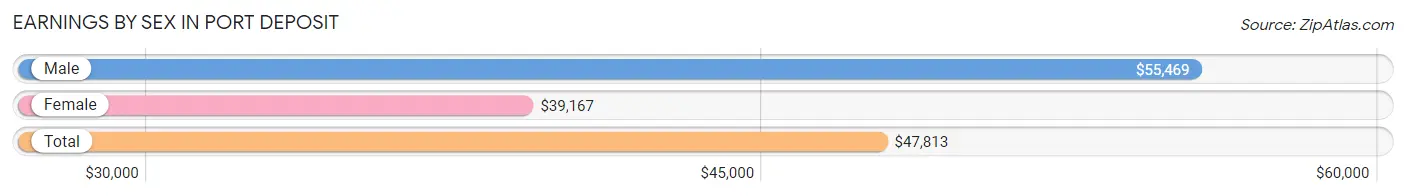
Earnings by Sex in Port Deposit
Average Earnings in Port Deposit are $47,813, $55,469 for men and $39,167 for women, a difference of 29.4%.
| Sex | Number | Average Earnings |
| Male | 123 (40.9%) | $55,469 |
| Female | 178 (59.1%) | $39,167 |
| Total | 301 (100.0%) | $47,813 |
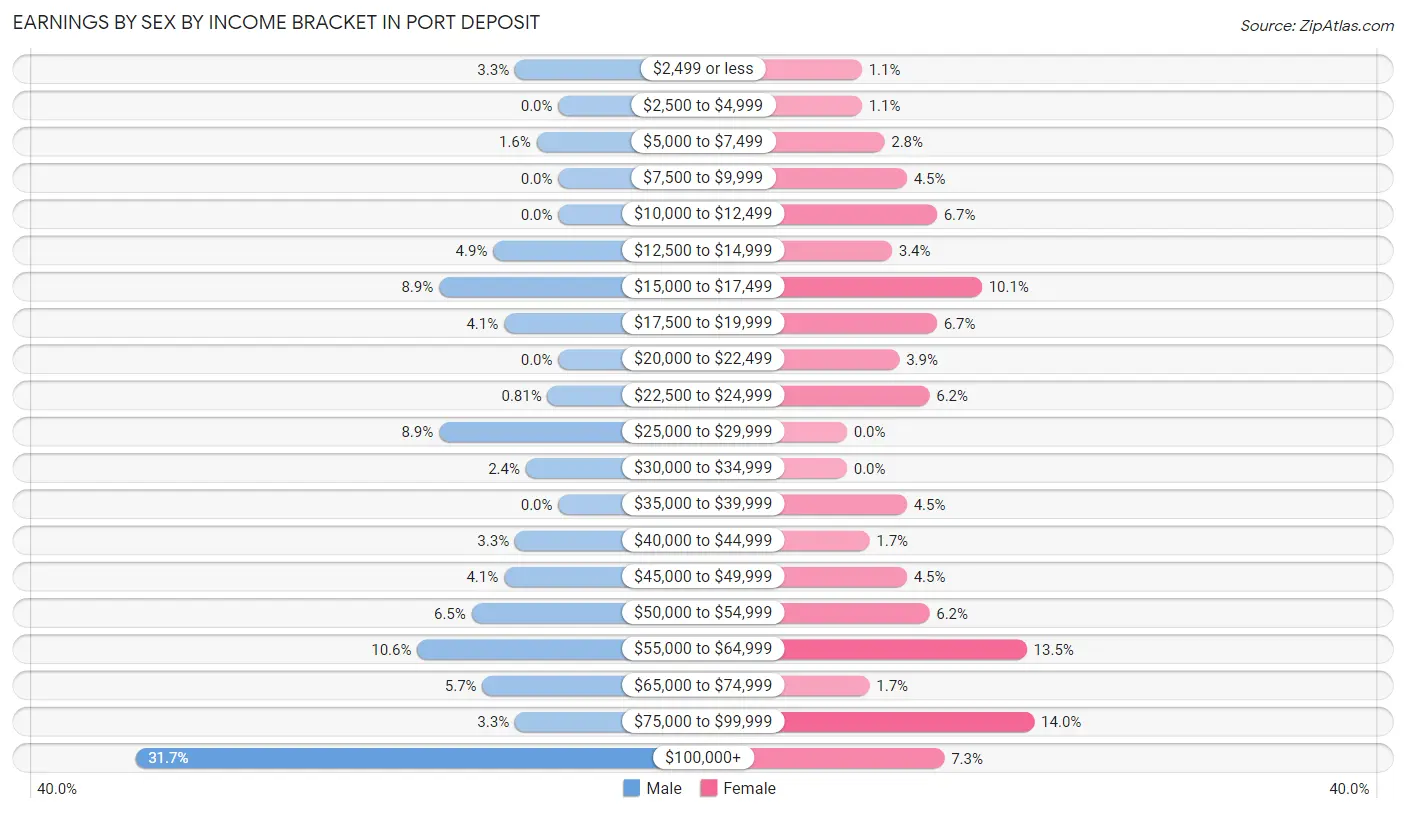
Earnings by Sex by Income Bracket in Port Deposit
The most common earnings brackets in Port Deposit are $100,000+ for men (39 | 31.7%) and $75,000 to $99,999 for women (25 | 14.0%).
| Income | Male | Female |
| $2,499 or less | 4 (3.3%) | 2 (1.1%) |
| $2,500 to $4,999 | 0 (0.0%) | 2 (1.1%) |
| $5,000 to $7,499 | 2 (1.6%) | 5 (2.8%) |
| $7,500 to $9,999 | 0 (0.0%) | 8 (4.5%) |
| $10,000 to $12,499 | 0 (0.0%) | 12 (6.7%) |
| $12,500 to $14,999 | 6 (4.9%) | 6 (3.4%) |
| $15,000 to $17,499 | 11 (8.9%) | 18 (10.1%) |
| $17,500 to $19,999 | 5 (4.1%) | 12 (6.7%) |
| $20,000 to $22,499 | 0 (0.0%) | 7 (3.9%) |
| $22,500 to $24,999 | 1 (0.8%) | 11 (6.2%) |
| $25,000 to $29,999 | 11 (8.9%) | 0 (0.0%) |
| $30,000 to $34,999 | 3 (2.4%) | 0 (0.0%) |
| $35,000 to $39,999 | 0 (0.0%) | 8 (4.5%) |
| $40,000 to $44,999 | 4 (3.3%) | 3 (1.7%) |
| $45,000 to $49,999 | 5 (4.1%) | 8 (4.5%) |
| $50,000 to $54,999 | 8 (6.5%) | 11 (6.2%) |
| $55,000 to $64,999 | 13 (10.6%) | 24 (13.5%) |
| $65,000 to $74,999 | 7 (5.7%) | 3 (1.7%) |
| $75,000 to $99,999 | 4 (3.3%) | 25 (14.0%) |
| $100,000+ | 39 (31.7%) | 13 (7.3%) |
| Total | 123 (100.0%) | 178 (100.0%) |
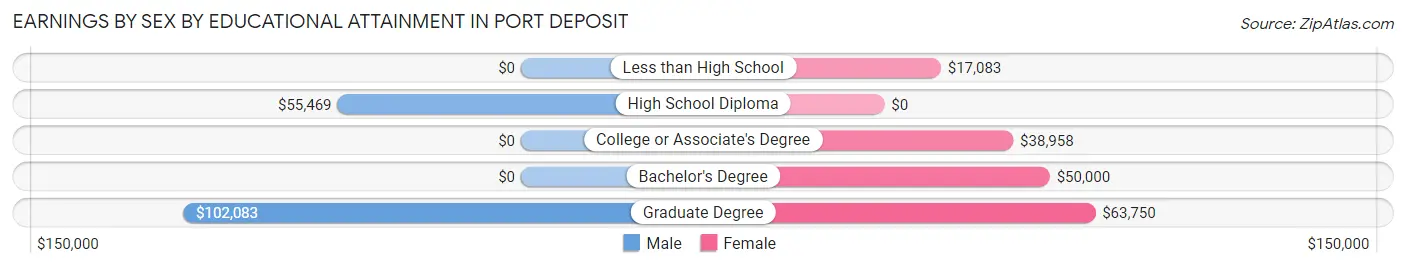
Earnings by Sex by Educational Attainment in Port Deposit
Average earnings in Port Deposit are $57,344 for men and $48,125 for women, a difference of 16.1%. Men with an educational attainment of graduate degree enjoy the highest average annual earnings of $102,083, while those with high school diploma education earn the least with $55,469. Women with an educational attainment of graduate degree earn the most with the average annual earnings of $63,750, while those with less than high school education have the smallest earnings of $17,083.
| Educational Attainment | Male Income | Female Income |
| Less than High School | - | - |
| High School Diploma | $55,469 | $0 |
| College or Associate's Degree | - | - |
| Bachelor's Degree | - | - |
| Graduate Degree | $102,083 | $63,750 |
| Total | $57,344 | $48,125 |
Family Income in Port Deposit
Family Income Brackets in Port Deposit
According to the Port Deposit family income data, there are 22 families falling into the $200,000+ income range, which is the most common income bracket and makes up 17.9% of all families. Conversely, the $100,000 to $149,999 income bracket is the least frequent group with only 7 families (5.7%) belonging to this category.
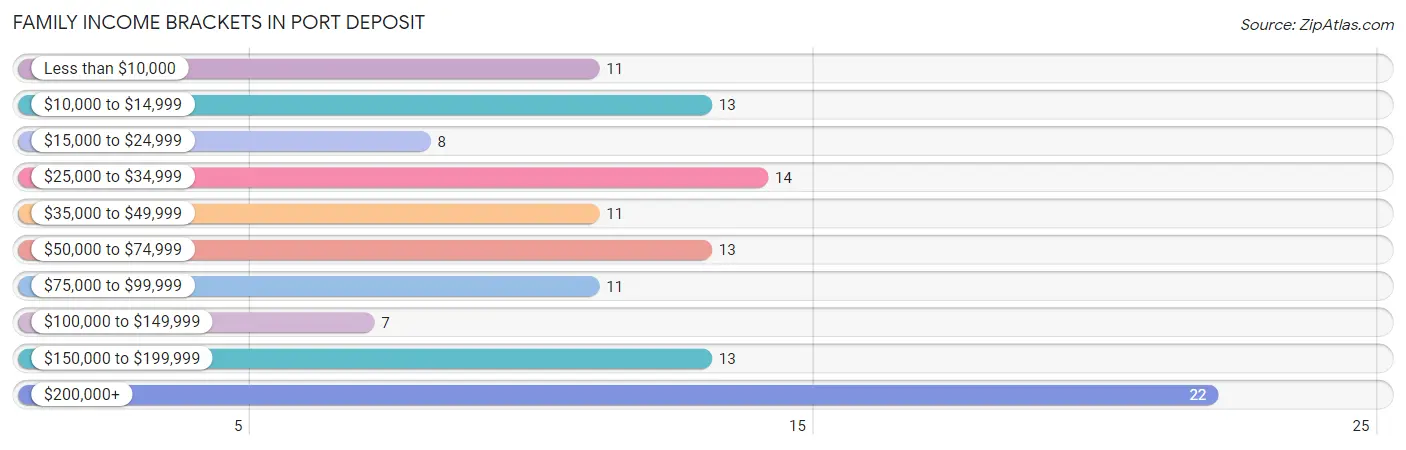
| Income Bracket | # Families | % Families |
| Less than $10,000 | 11 | 8.9% |
| $10,000 to $14,999 | 13 | 10.6% |
| $15,000 to $24,999 | 8 | 6.5% |
| $25,000 to $34,999 | 14 | 11.4% |
| $35,000 to $49,999 | 11 | 8.9% |
| $50,000 to $74,999 | 13 | 10.6% |
| $75,000 to $99,999 | 11 | 8.9% |
| $100,000 to $149,999 | 7 | 5.7% |
| $150,000 to $199,999 | 13 | 10.6% |
| $200,000+ | 22 | 17.9% |
Family Income by Famaliy Size in Port Deposit
5-person families (13 | 10.6%) account for the highest median family income in Port Deposit with $110,250 per family, while 5-person families (13 | 10.6%) have the highest median income of $22,050 per family member.
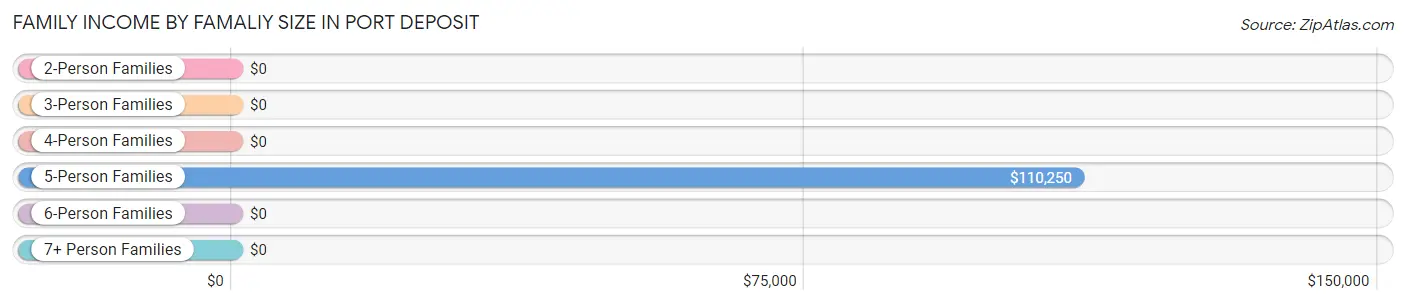
| Income Bracket | # Families | Median Income |
| 2-Person Families | 45 (36.6%) | $0 |
| 3-Person Families | 37 (30.1%) | $0 |
| 4-Person Families | 28 (22.8%) | $0 |
| 5-Person Families | 13 (10.6%) | $110,250 |
| 6-Person Families | 0 (0.0%) | $0 |
| 7+ Person Families | 0 (0.0%) | $0 |
| Total | 123 (100.0%) | $70,208 |
Family Income by Number of Earners in Port Deposit
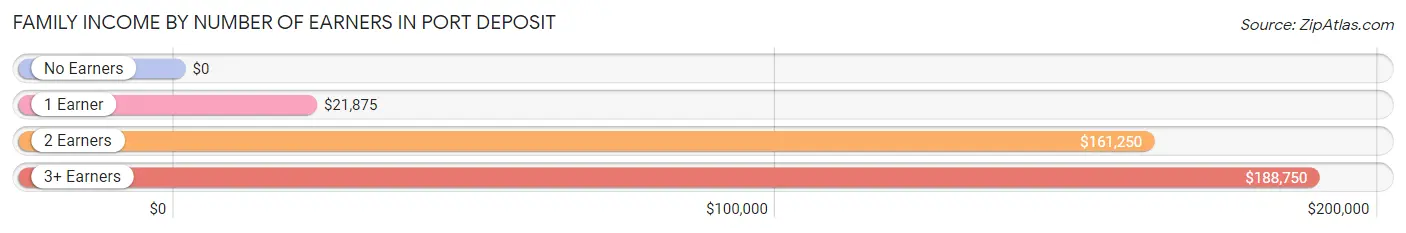
| Number of Earners | # Families | Median Income |
| No Earners | 24 (19.5%) | $0 |
| 1 Earner | 43 (35.0%) | $21,875 |
| 2 Earners | 44 (35.8%) | $161,250 |
| 3+ Earners | 12 (9.8%) | $188,750 |
| Total | 123 (100.0%) | $70,208 |
Household Income in Port Deposit
Household Income Brackets in Port Deposit
With 42 households falling in the category, the $35,000 to $49,999 income range is the most frequent in Port Deposit, accounting for 14.7% of all households. In contrast, only 17 households (6.0%) fall into the $75,000 to $99,999 income bracket, making it the least populous group.
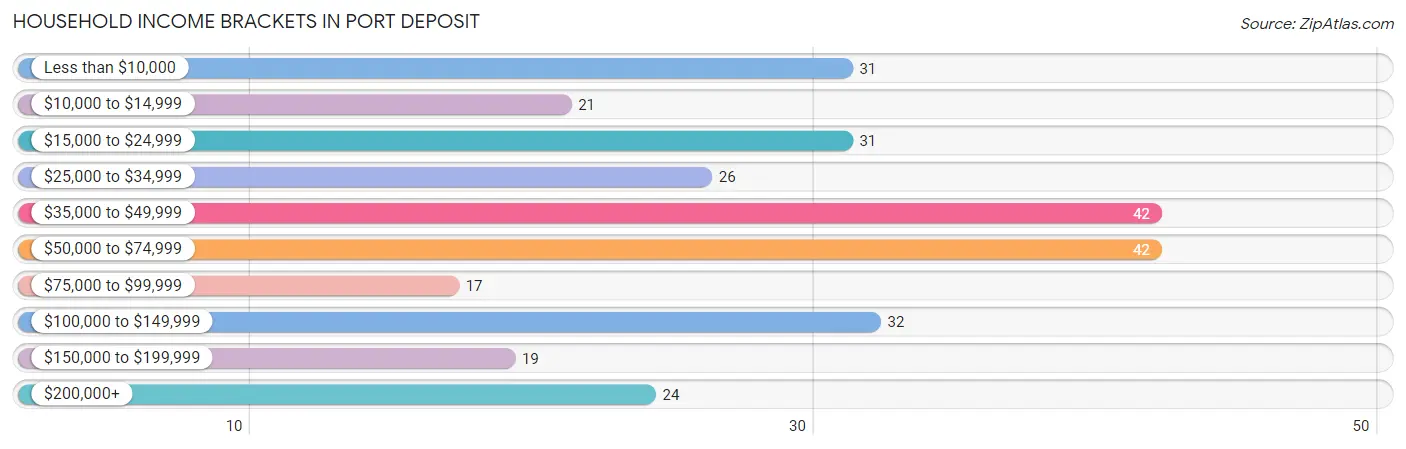
| Income Bracket | # Households | % Households |
| Less than $10,000 | 31 | 10.9% |
| $10,000 to $14,999 | 21 | 7.4% |
| $15,000 to $24,999 | 31 | 10.9% |
| $25,000 to $34,999 | 26 | 9.1% |
| $35,000 to $49,999 | 42 | 14.7% |
| $50,000 to $74,999 | 42 | 14.7% |
| $75,000 to $99,999 | 17 | 6.0% |
| $100,000 to $149,999 | 32 | 11.2% |
| $150,000 to $199,999 | 19 | 6.7% |
| $200,000+ | 24 | 8.4% |
Household Income by Householder Age in Port Deposit
The median household income in Port Deposit is $46,979, with the highest median household income of $63,438 found in the 45 to 64 years age bracket for the primary householder. A total of 113 households (39.7%) fall into this category. Meanwhile, the 15 to 24 years age bracket for the primary householder has the lowest median household income of $0, with 23 households (8.1%) in this group.
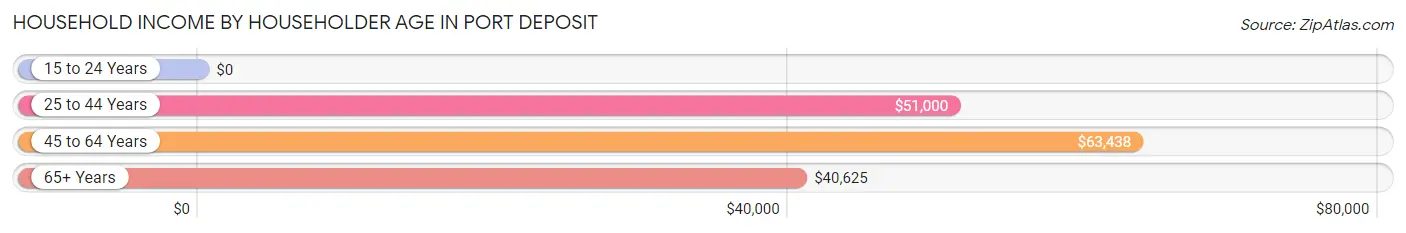
| Income Bracket | # Households | Median Income |
| 15 to 24 Years | 23 (8.1%) | $0 |
| 25 to 44 Years | 104 (36.5%) | $51,000 |
| 45 to 64 Years | 113 (39.7%) | $63,438 |
| 65+ Years | 45 (15.8%) | $40,625 |
| Total | 285 (100.0%) | $46,979 |
Poverty in Port Deposit
Income Below Poverty by Sex and Age in Port Deposit
With 24.6% poverty level for males and 24.2% for females among the residents of Port Deposit, 6 to 11 year old males and 5 year old females are the most vulnerable to poverty, with 2 males (100.0%) and 10 females (62.5%) in their respective age groups living below the poverty level.
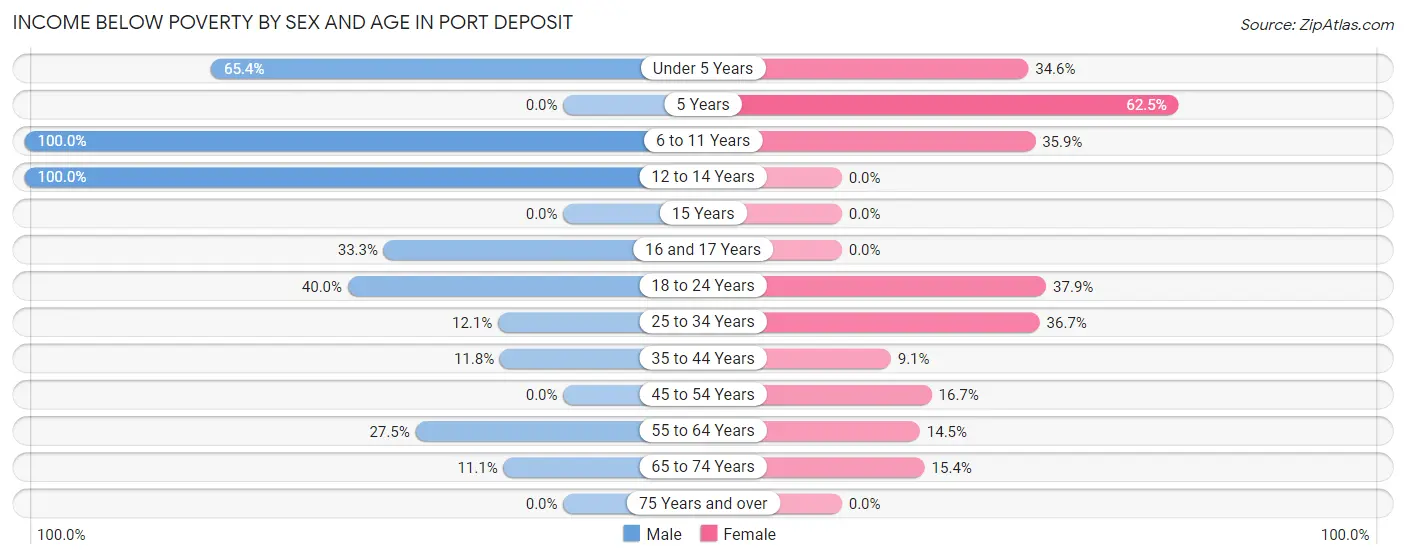
| Age Bracket | Male | Female |
| Under 5 Years | 17 (65.4%) | 9 (34.6%) |
| 5 Years | 0 (0.0%) | 10 (62.5%) |
| 6 to 11 Years | 2 (100.0%) | 14 (35.9%) |
| 12 to 14 Years | 4 (100.0%) | 0 (0.0%) |
| 15 Years | 0 (0.0%) | 0 (0.0%) |
| 16 and 17 Years | 2 (33.3%) | 0 (0.0%) |
| 18 to 24 Years | 8 (40.0%) | 11 (37.9%) |
| 25 to 34 Years | 4 (12.1%) | 18 (36.7%) |
| 35 to 44 Years | 4 (11.8%) | 4 (9.1%) |
| 45 to 54 Years | 0 (0.0%) | 3 (16.7%) |
| 55 to 64 Years | 14 (27.5%) | 10 (14.5%) |
| 65 to 74 Years | 4 (11.1%) | 2 (15.4%) |
| 75 Years and over | 0 (0.0%) | 0 (0.0%) |
| Total | 59 (24.6%) | 81 (24.2%) |
Income Above Poverty by Sex and Age in Port Deposit
According to the poverty statistics in Port Deposit, males aged 45 to 54 years and females aged 12 to 14 years are the age groups that are most secure financially, with 100.0% of males and 100.0% of females in these age groups living above the poverty line.
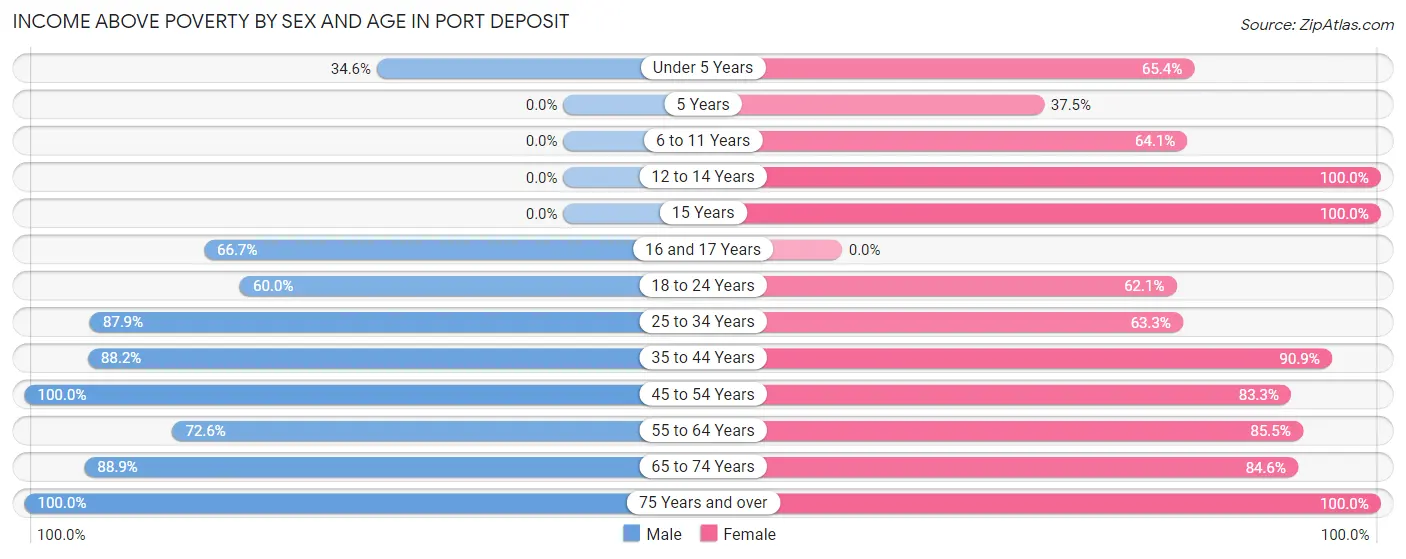
| Age Bracket | Male | Female |
| Under 5 Years | 9 (34.6%) | 17 (65.4%) |
| 5 Years | 0 (0.0%) | 6 (37.5%) |
| 6 to 11 Years | 0 (0.0%) | 25 (64.1%) |
| 12 to 14 Years | 0 (0.0%) | 12 (100.0%) |
| 15 Years | 0 (0.0%) | 7 (100.0%) |
| 16 and 17 Years | 4 (66.7%) | 0 (0.0%) |
| 18 to 24 Years | 12 (60.0%) | 18 (62.1%) |
| 25 to 34 Years | 29 (87.9%) | 31 (63.3%) |
| 35 to 44 Years | 30 (88.2%) | 40 (90.9%) |
| 45 to 54 Years | 24 (100.0%) | 15 (83.3%) |
| 55 to 64 Years | 37 (72.6%) | 59 (85.5%) |
| 65 to 74 Years | 32 (88.9%) | 11 (84.6%) |
| 75 Years and over | 4 (100.0%) | 12 (100.0%) |
| Total | 181 (75.4%) | 253 (75.7%) |
Income Below Poverty Among Married-Couple Families in Port Deposit
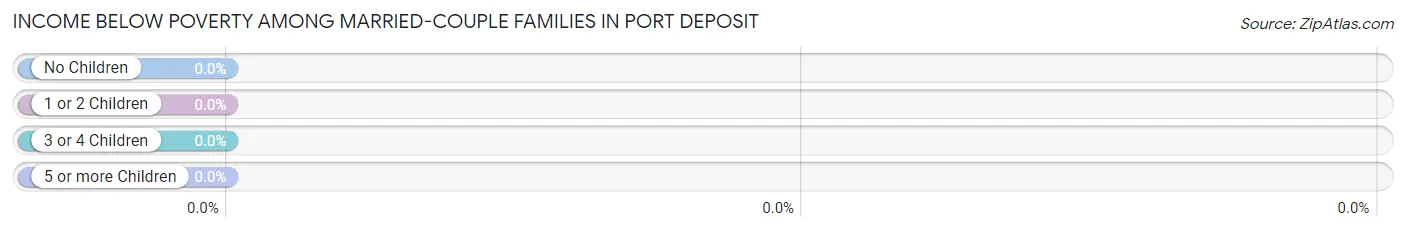
| Children | Above Poverty | Below Poverty |
| No Children | 44 (100.0%) | 0 (0.0%) |
| 1 or 2 Children | 26 (100.0%) | 0 (0.0%) |
| 3 or 4 Children | 6 (100.0%) | 0 (0.0%) |
| 5 or more Children | 0 (0.0%) | 0 (0.0%) |
| Total | 76 (100.0%) | 0 (0.0%) |
Income Below Poverty Among Single-Parent Households in Port Deposit
According to the poverty data in Port Deposit, 14.3% or 1 single-father households and 82.5% or 33 single-mother households are living below the poverty line. Among single-father households, those with no children have the highest poverty rate, with 1 households (14.3%) experiencing poverty. Likewise, among single-mother households, those with 1 or 2 children have the highest poverty rate, with 33 households (94.3%) falling below the poverty line.
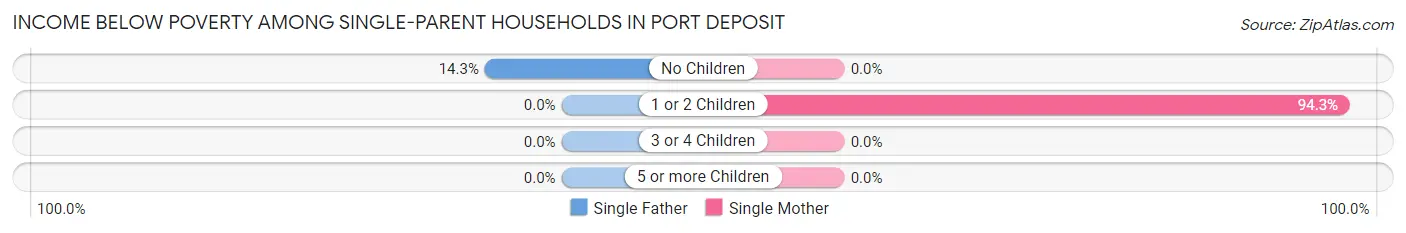
| Children | Single Father | Single Mother |
| No Children | 1 (14.3%) | 0 (0.0%) |
| 1 or 2 Children | 0 (0.0%) | 33 (94.3%) |
| 3 or 4 Children | 0 (0.0%) | 0 (0.0%) |
| 5 or more Children | 0 (0.0%) | 0 (0.0%) |
| Total | 1 (14.3%) | 33 (82.5%) |
Income Below Poverty Among Married-Couple vs Single-Parent Households in Port Deposit
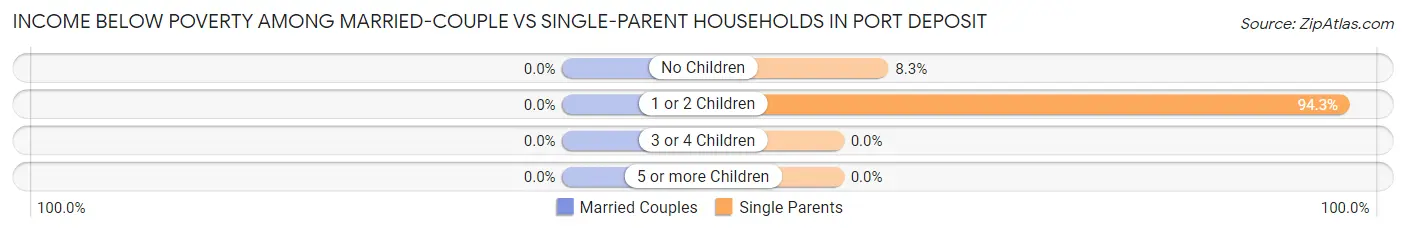
| Children | Married-Couple Families | Single-Parent Households |
| No Children | 0 (0.0%) | 1 (8.3%) |
| 1 or 2 Children | 0 (0.0%) | 33 (94.3%) |
| 3 or 4 Children | 0 (0.0%) | 0 (0.0%) |
| 5 or more Children | 0 (0.0%) | 0 (0.0%) |
| Total | 0 (0.0%) | 34 (72.3%) |
Race in Port Deposit
The most populous races in Port Deposit are White / Caucasian (401 | 68.3%), Black / African American (121 | 20.6%), and Hispanic or Latino (65 | 11.1%).
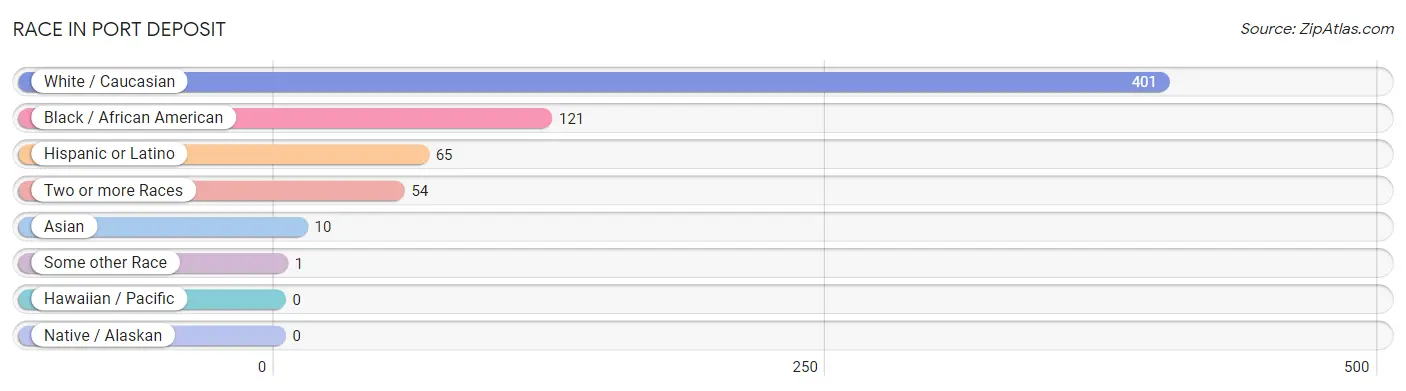
| Race | # Population | % Population |
| Asian | 10 | 1.7% |
| Black / African American | 121 | 20.6% |
| Hawaiian / Pacific | 0 | 0.0% |
| Hispanic or Latino | 65 | 11.1% |
| Native / Alaskan | 0 | 0.0% |
| White / Caucasian | 401 | 68.3% |
| Two or more Races | 54 | 9.2% |
| Some other Race | 1 | 0.2% |
| Total | 587 | 100.0% |
Ancestry in Port Deposit
The most populous ancestries reported in Port Deposit are German (106 | 18.1%), Irish (105 | 17.9%), English (64 | 10.9%), Italian (56 | 9.5%), and Mexican (45 | 7.7%), together accounting for 64.1% of all Port Deposit residents.
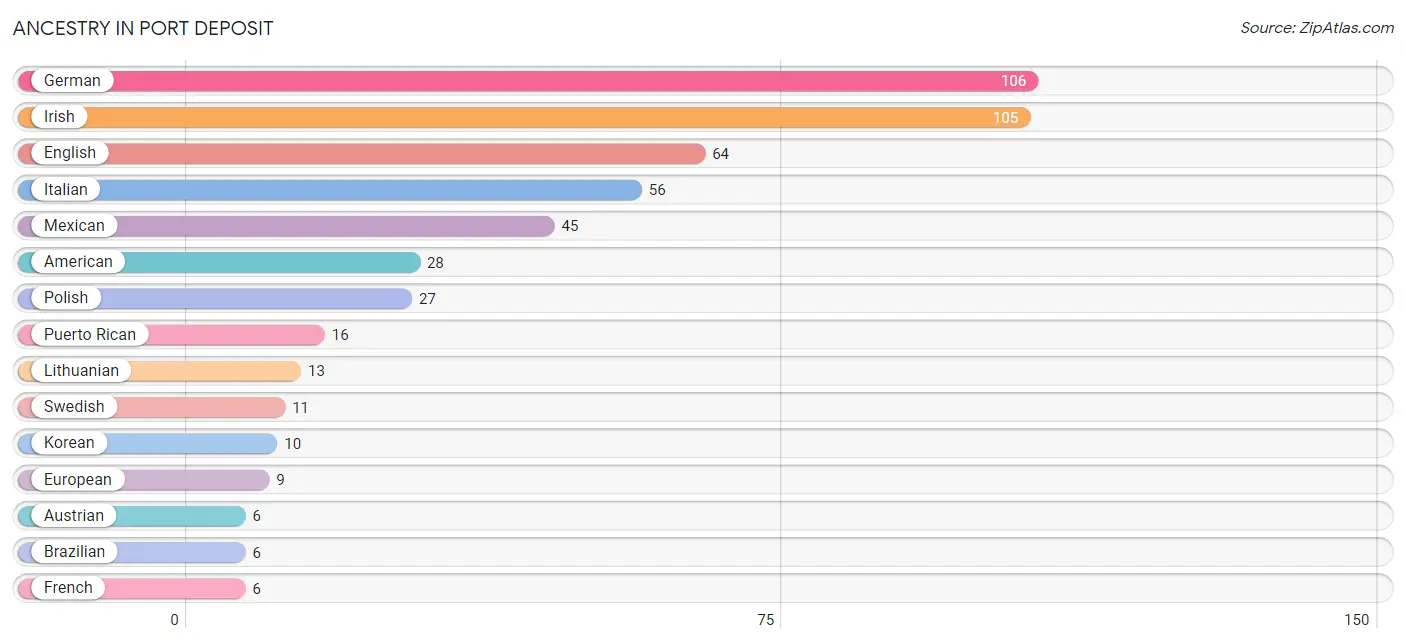
| Ancestry | # Population | % Population |
| American | 28 | 4.8% |
| Austrian | 6 | 1.0% |
| Brazilian | 6 | 1.0% |
| British | 2 | 0.3% |
| Burmese | 2 | 0.3% |
| Cuban | 4 | 0.7% |
| Danish | 2 | 0.3% |
| Eastern European | 5 | 0.9% |
| English | 64 | 10.9% |
| European | 9 | 1.5% |
| Finnish | 2 | 0.3% |
| French | 6 | 1.0% |
| German | 106 | 18.1% |
| Greek | 2 | 0.3% |
| Hungarian | 5 | 0.9% |
| Irish | 105 | 17.9% |
| Italian | 56 | 9.5% |
| Korean | 10 | 1.7% |
| Lithuanian | 13 | 2.2% |
| Mexican | 45 | 7.7% |
| Norwegian | 2 | 0.3% |
| Pennsylvania German | 6 | 1.0% |
| Polish | 27 | 4.6% |
| Puerto Rican | 16 | 2.7% |
| Russian | 2 | 0.3% |
| Scottish | 4 | 0.7% |
| Slovak | 3 | 0.5% |
| Swedish | 11 | 1.9% |
| Welsh | 2 | 0.3% | View All 29 Rows |
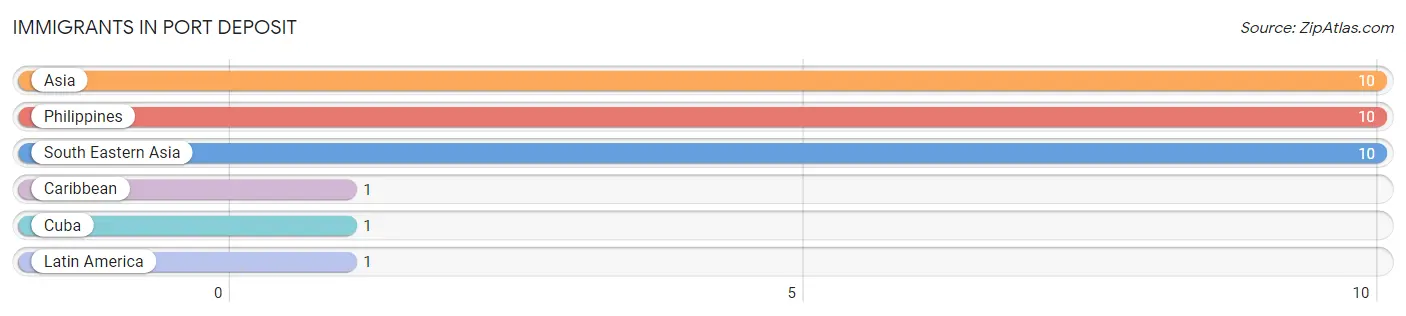
Immigrants in Port Deposit
The most numerous immigrant groups reported in Port Deposit came from Asia (10 | 1.7%), Philippines (10 | 1.7%), South Eastern Asia (10 | 1.7%), Caribbean (1 | 0.2%), and Cuba (1 | 0.2%), together accounting for 5.4% of all Port Deposit residents.
| Immigration Origin | # Population | % Population |
| Asia | 10 | 1.7% |
| Caribbean | 1 | 0.2% |
| Cuba | 1 | 0.2% |
| Latin America | 1 | 0.2% |
| Philippines | 10 | 1.7% |
| South Eastern Asia | 10 | 1.7% | View All 6 Rows |
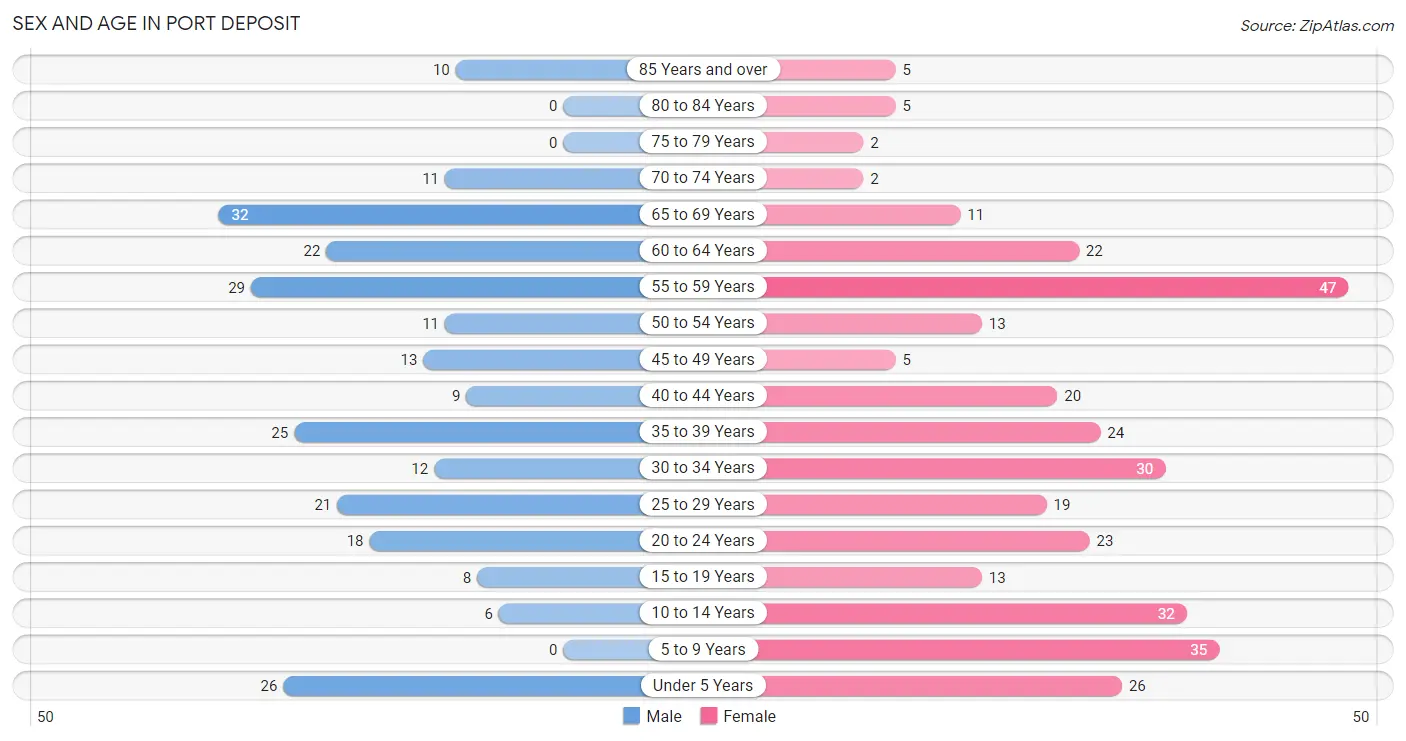
Sex and Age in Port Deposit
Sex and Age in Port Deposit
The most populous age groups in Port Deposit are 65 to 69 Years (32 | 12.7%) for men and 55 to 59 Years (47 | 14.1%) for women.
| Age Bracket | Male | Female |
| Under 5 Years | 26 (10.3%) | 26 (7.8%) |
| 5 to 9 Years | 0 (0.0%) | 35 (10.5%) |
| 10 to 14 Years | 6 (2.4%) | 32 (9.6%) |
| 15 to 19 Years | 8 (3.2%) | 13 (3.9%) |
| 20 to 24 Years | 18 (7.1%) | 23 (6.9%) |
| 25 to 29 Years | 21 (8.3%) | 19 (5.7%) |
| 30 to 34 Years | 12 (4.7%) | 30 (9.0%) |
| 35 to 39 Years | 25 (9.9%) | 24 (7.2%) |
| 40 to 44 Years | 9 (3.6%) | 20 (6.0%) |
| 45 to 49 Years | 13 (5.1%) | 5 (1.5%) |
| 50 to 54 Years | 11 (4.3%) | 13 (3.9%) |
| 55 to 59 Years | 29 (11.5%) | 47 (14.1%) |
| 60 to 64 Years | 22 (8.7%) | 22 (6.6%) |
| 65 to 69 Years | 32 (12.7%) | 11 (3.3%) |
| 70 to 74 Years | 11 (4.3%) | 2 (0.6%) |
| 75 to 79 Years | 0 (0.0%) | 2 (0.6%) |
| 80 to 84 Years | 0 (0.0%) | 5 (1.5%) |
| 85 Years and over | 10 (4.0%) | 5 (1.5%) |
| Total | 253 (100.0%) | 334 (100.0%) |
Families and Households in Port Deposit
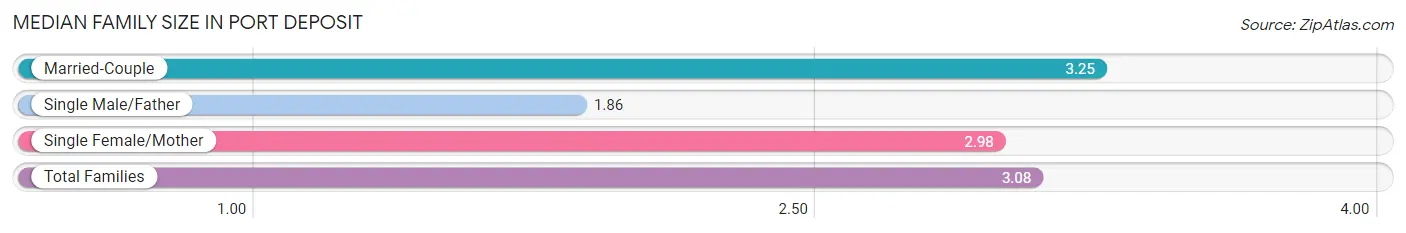
Median Family Size in Port Deposit
The median family size in Port Deposit is 3.08 persons per family, with married-couple families (76 | 61.8%) accounting for the largest median family size of 3.25 persons per family. On the other hand, single male/father families (7 | 5.7%) represent the smallest median family size with 1.86 persons per family.
| Family Type | # Families | Family Size |
| Married-Couple | 76 (61.8%) | 3.25 |
| Single Male/Father | 7 (5.7%) | 1.86 |
| Single Female/Mother | 40 (32.5%) | 2.98 |
| Total Families | 123 (100.0%) | 3.08 |
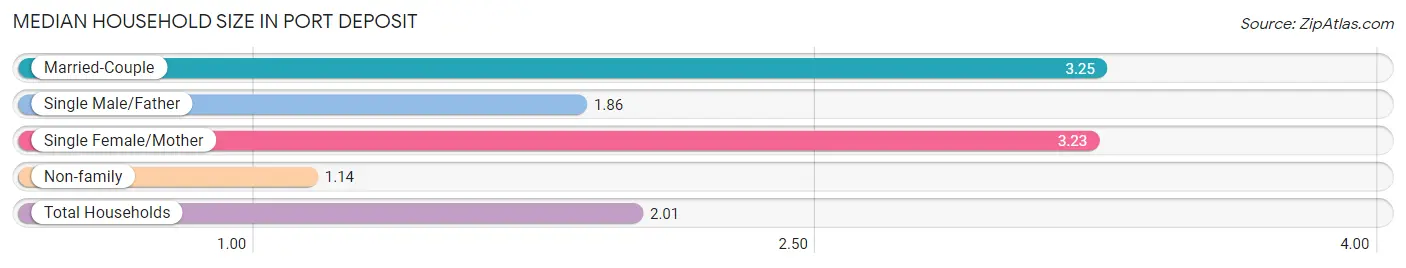
Median Household Size in Port Deposit
The median household size in Port Deposit is 2.01 persons per household, with married-couple households (76 | 26.7%) accounting for the largest median household size of 3.25 persons per household. non-family households (162 | 56.8%) represent the smallest median household size with 1.14 persons per household.
| Household Type | # Households | Household Size |
| Married-Couple | 76 (26.7%) | 3.25 |
| Single Male/Father | 7 (2.5%) | 1.86 |
| Single Female/Mother | 40 (14.0%) | 3.23 |
| Non-family | 162 (56.8%) | 1.14 |
| Total Households | 285 (100.0%) | 2.01 |
Household Size by Marriage Status in Port Deposit
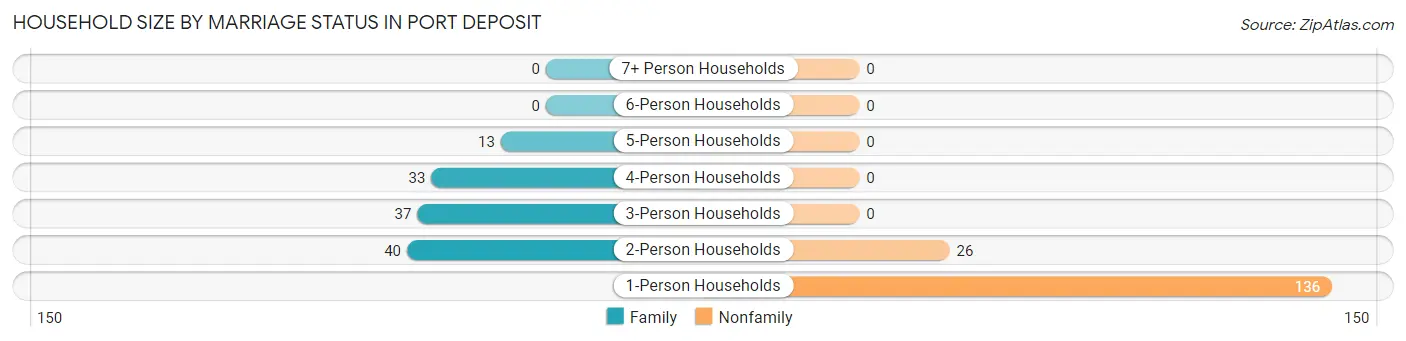
Out of a total of 285 households in Port Deposit, 123 (43.2%) are family households, while 162 (56.8%) are nonfamily households. The most numerous type of family households are 2-person households, comprising 40, and the most common type of nonfamily households are 1-person households, comprising 136.
| Household Size | Family Households | Nonfamily Households |
| 1-Person Households | - | 136 (47.7%) |
| 2-Person Households | 40 (14.0%) | 26 (9.1%) |
| 3-Person Households | 37 (13.0%) | 0 (0.0%) |
| 4-Person Households | 33 (11.6%) | 0 (0.0%) |
| 5-Person Households | 13 (4.6%) | 0 (0.0%) |
| 6-Person Households | 0 (0.0%) | 0 (0.0%) |
| 7+ Person Households | 0 (0.0%) | 0 (0.0%) |
| Total | 123 (43.2%) | 162 (56.8%) |
Female Fertility in Port Deposit
Fertility by Age in Port Deposit
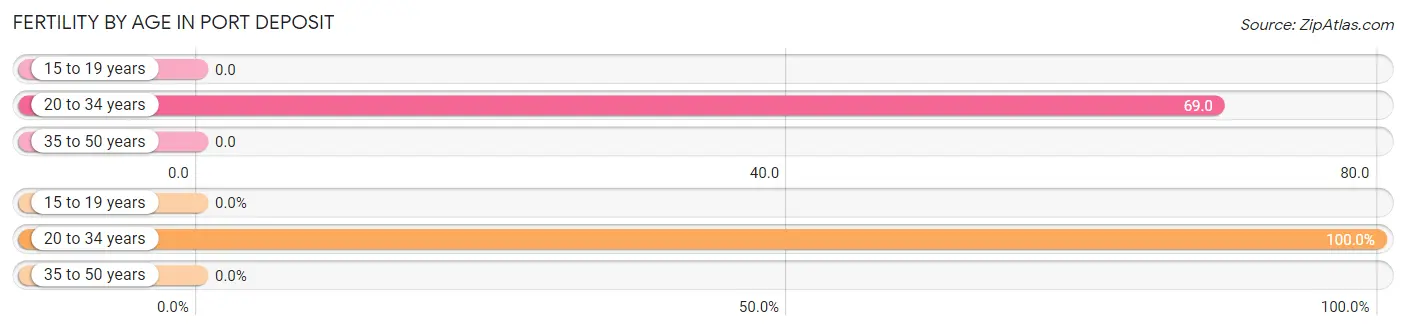
Average fertility rate in Port Deposit is 36.0 births per 1,000 women. Women in the age bracket of 20 to 34 years have the highest fertility rate with 69.0 births per 1,000 women. Women in the age bracket of 20 to 34 years acount for 100.0% of all women with births.
| Age Bracket | Women with Births | Births / 1,000 Women |
| 15 to 19 years | 0 (0.0%) | 0.0 |
| 20 to 34 years | 5 (100.0%) | 69.0 |
| 35 to 50 years | 0 (0.0%) | 0.0 |
| Total | 5 (100.0%) | 36.0 |
Fertility by Age by Marriage Status in Port Deposit
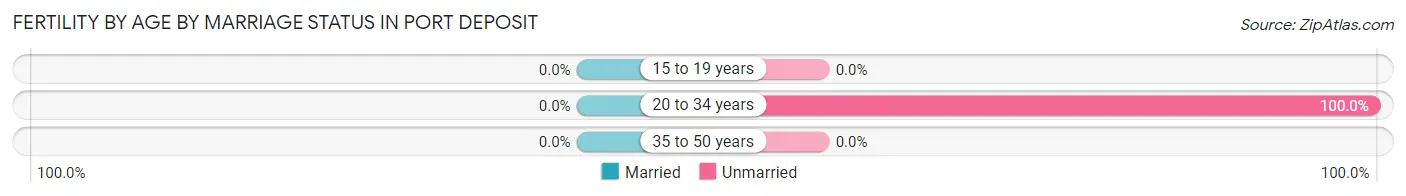
| Age Bracket | Married | Unmarried |
| 15 to 19 years | 0 (0.0%) | 0 (0.0%) |
| 20 to 34 years | 0 (0.0%) | 5 (100.0%) |
| 35 to 50 years | 0 (0.0%) | 0 (0.0%) |
| Total | 0 (0.0%) | 5 (100.0%) |
Fertility by Education in Port Deposit
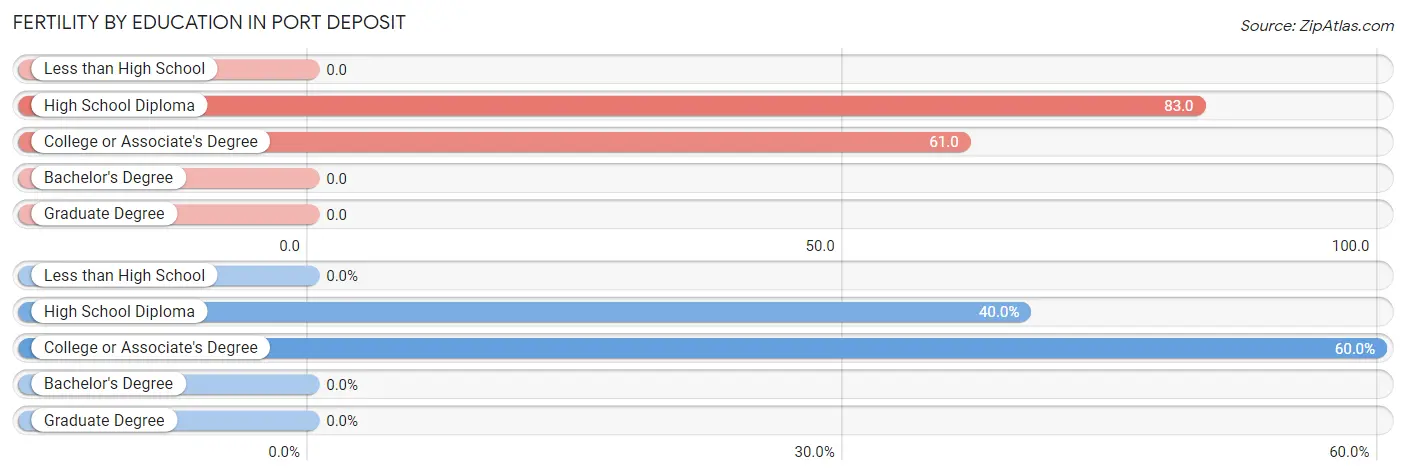
| Educational Attainment | Women with Births | Births / 1,000 Women |
| Less than High School | 0 (0.0%) | 0.0 |
| High School Diploma | 2 (40.0%) | 83.0 |
| College or Associate's Degree | 3 (60.0%) | 61.0 |
| Bachelor's Degree | 0 (0.0%) | 0.0 |
| Graduate Degree | 0 (0.0%) | 0.0 |
| Total | 5 (100.0%) | 36.0 |
Fertility by Education by Marriage Status in Port Deposit
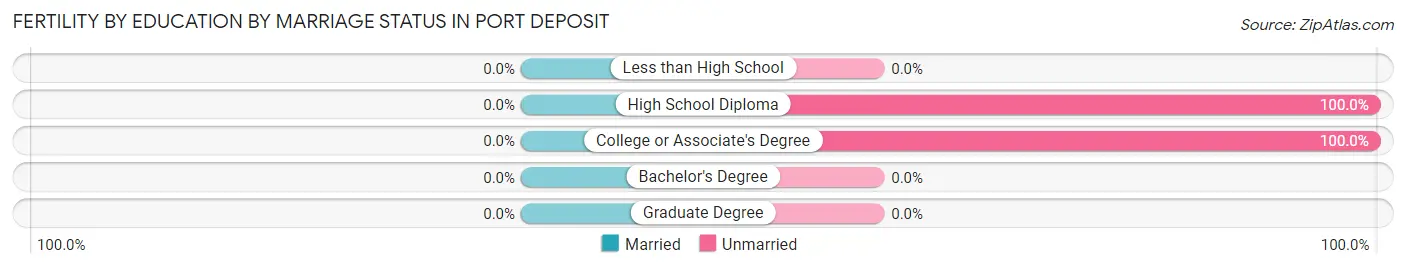
| Educational Attainment | Married | Unmarried |
| Less than High School | 0 (0.0%) | 0 (0.0%) |
| High School Diploma | 0 (0.0%) | 2 (100.0%) |
| College or Associate's Degree | 0 (0.0%) | 3 (100.0%) |
| Bachelor's Degree | 0 (0.0%) | 0 (0.0%) |
| Graduate Degree | 0 (0.0%) | 0 (0.0%) |
| Total | 0 (0.0%) | 5 (100.0%) |
Employment Characteristics in Port Deposit
Employment by Class of Employer in Port Deposit
Among the 292 employed individuals in Port Deposit, private company employees (163 | 55.8%), not-for-profit organizations (52 | 17.8%), and local government employees (25 | 8.6%) make up the most common classes of employment.
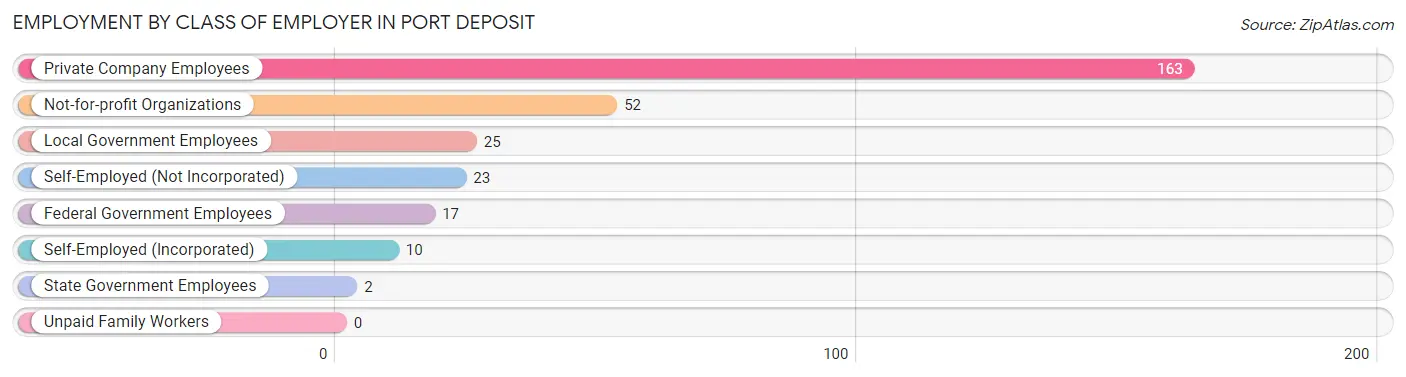
| Employer Class | # Employees | % Employees |
| Private Company Employees | 163 | 55.8% |
| Self-Employed (Incorporated) | 10 | 3.4% |
| Self-Employed (Not Incorporated) | 23 | 7.9% |
| Not-for-profit Organizations | 52 | 17.8% |
| Local Government Employees | 25 | 8.6% |
| State Government Employees | 2 | 0.7% |
| Federal Government Employees | 17 | 5.8% |
| Unpaid Family Workers | 0 | 0.0% |
| Total | 292 | 100.0% |
Employment Status by Age in Port Deposit
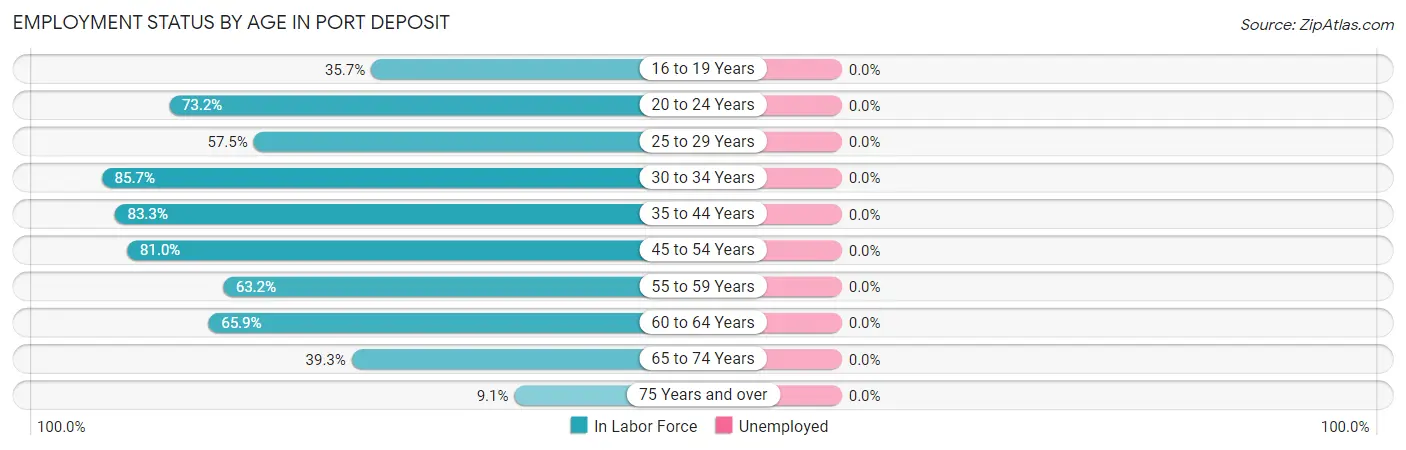
| Age Bracket | In Labor Force | Unemployed |
| 16 to 19 Years | 5 (35.7%) | 0 (0.0%) |
| 20 to 24 Years | 30 (73.2%) | 0 (0.0%) |
| 25 to 29 Years | 23 (57.5%) | 0 (0.0%) |
| 30 to 34 Years | 36 (85.7%) | 0 (0.0%) |
| 35 to 44 Years | 65 (83.3%) | 0 (0.0%) |
| 45 to 54 Years | 34 (81.0%) | 0 (0.0%) |
| 55 to 59 Years | 48 (63.2%) | 0 (0.0%) |
| 60 to 64 Years | 29 (65.9%) | 0 (0.0%) |
| 65 to 74 Years | 22 (39.3%) | 0 (0.0%) |
| 75 Years and over | 2 (9.1%) | 0 (0.0%) |
| Total | 294 (64.6%) | 0 (0.0%) |
Employment Status by Educational Attainment in Port Deposit
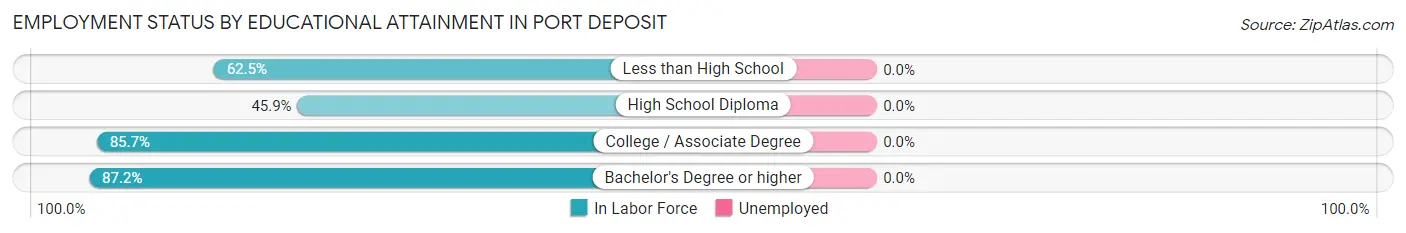
| Educational Attainment | In Labor Force | Unemployed |
| Less than High School | 10 (62.5%) | 0 (0.0%) |
| High School Diploma | 45 (45.9%) | 0 (0.0%) |
| College / Associate Degree | 78 (85.7%) | 0 (0.0%) |
| Bachelor's Degree or higher | 102 (87.2%) | 0 (0.0%) |
| Total | 235 (73.0%) | 0 (0.0%) |
Employment Occupations by Sex in Port Deposit
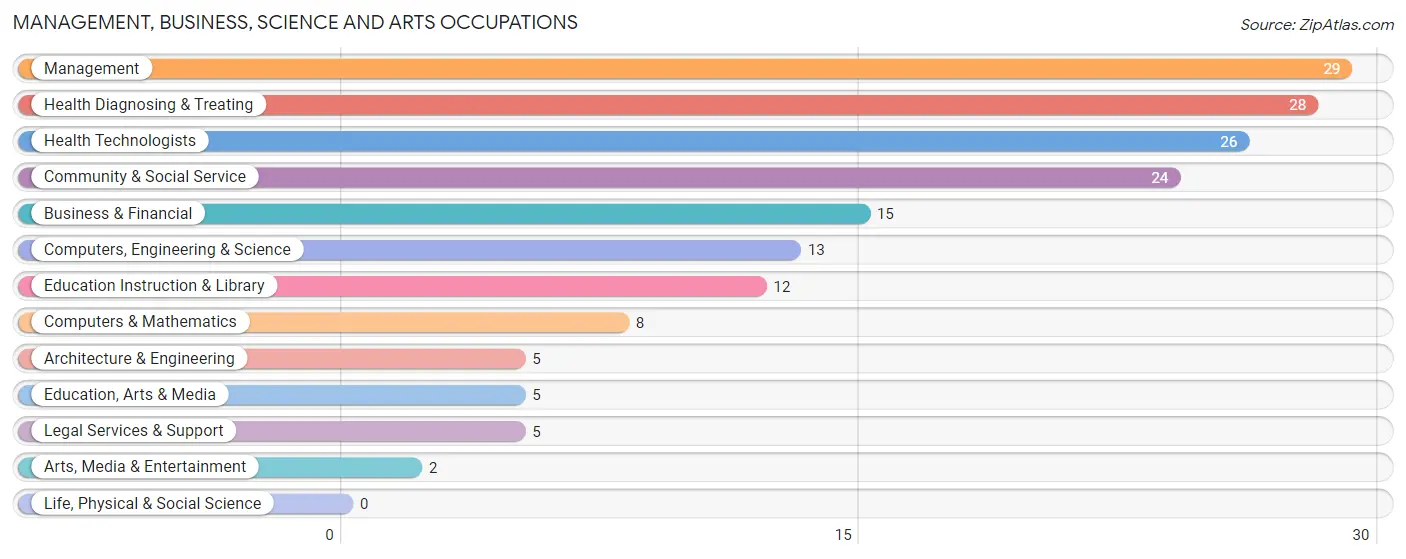
Management, Business, Science and Arts Occupations
The most common Management, Business, Science and Arts occupations in Port Deposit are Management (29 | 9.9%), Health Diagnosing & Treating (28 | 9.5%), Health Technologists (26 | 8.8%), Community & Social Service (24 | 8.2%), and Business & Financial (15 | 5.1%).
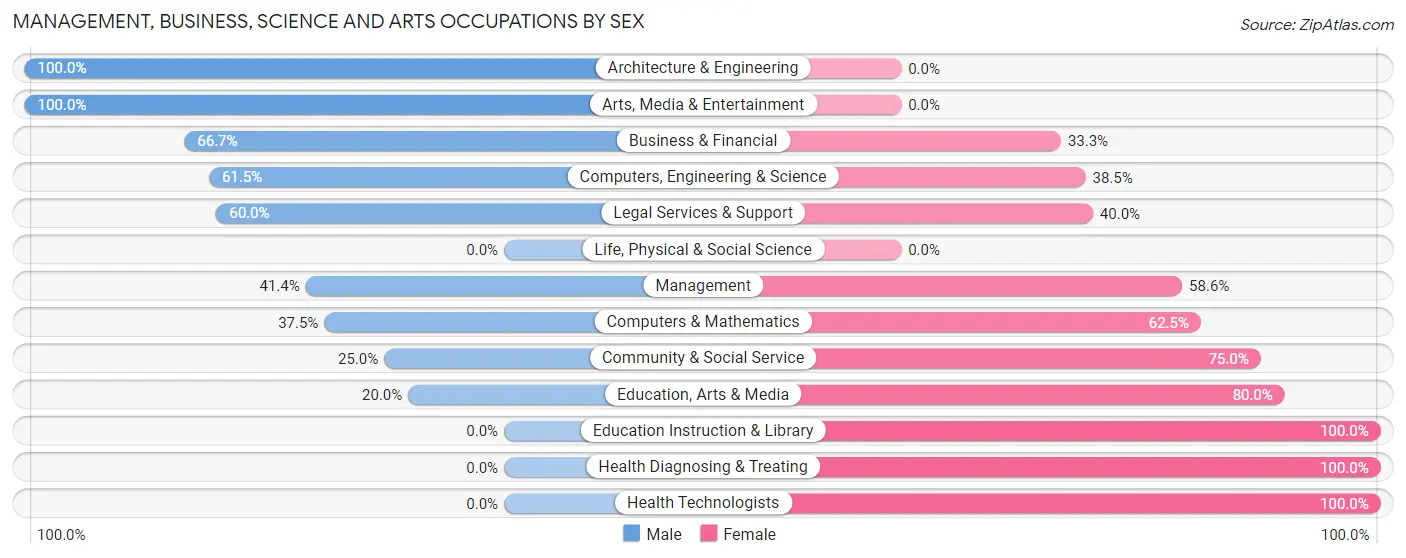
Management, Business, Science and Arts Occupations by Sex
Within the Management, Business, Science and Arts occupations in Port Deposit, the most male-oriented occupations are Architecture & Engineering (100.0%), Arts, Media & Entertainment (100.0%), and Business & Financial (66.7%), while the most female-oriented occupations are Education Instruction & Library (100.0%), Health Diagnosing & Treating (100.0%), and Health Technologists (100.0%).
| Occupation | Male | Female |
| Management | 12 (41.4%) | 17 (58.6%) |
| Business & Financial | 10 (66.7%) | 5 (33.3%) |
| Computers, Engineering & Science | 8 (61.5%) | 5 (38.5%) |
| Computers & Mathematics | 3 (37.5%) | 5 (62.5%) |
| Architecture & Engineering | 5 (100.0%) | 0 (0.0%) |
| Life, Physical & Social Science | 0 (0.0%) | 0 (0.0%) |
| Community & Social Service | 6 (25.0%) | 18 (75.0%) |
| Education, Arts & Media | 1 (20.0%) | 4 (80.0%) |
| Legal Services & Support | 3 (60.0%) | 2 (40.0%) |
| Education Instruction & Library | 0 (0.0%) | 12 (100.0%) |
| Arts, Media & Entertainment | 2 (100.0%) | 0 (0.0%) |
| Health Diagnosing & Treating | 0 (0.0%) | 28 (100.0%) |
| Health Technologists | 0 (0.0%) | 26 (100.0%) |
| Total (Category) | 36 (33.0%) | 73 (67.0%) |
| Total (Overall) | 119 (40.5%) | 175 (59.5%) |
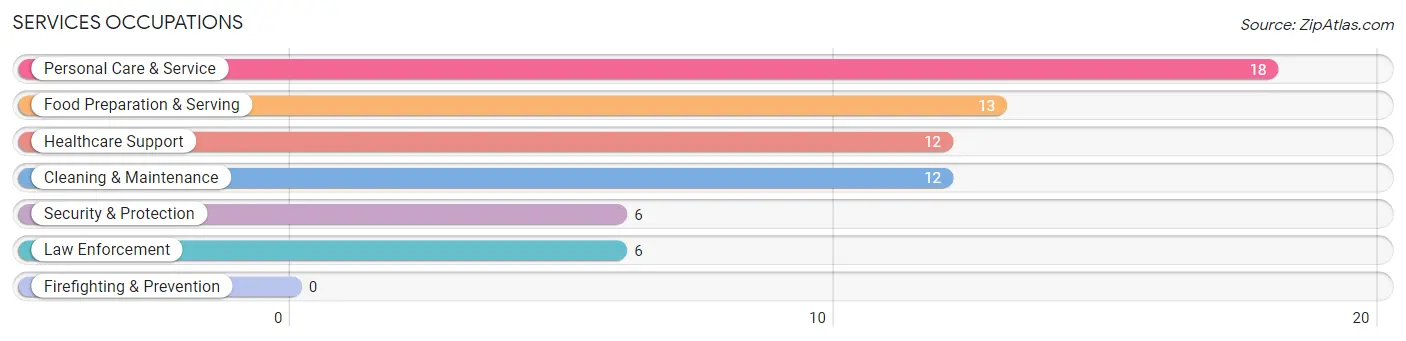
Services Occupations
The most common Services occupations in Port Deposit are Personal Care & Service (18 | 6.1%), Food Preparation & Serving (13 | 4.4%), Healthcare Support (12 | 4.1%), Cleaning & Maintenance (12 | 4.1%), and Security & Protection (6 | 2.0%).
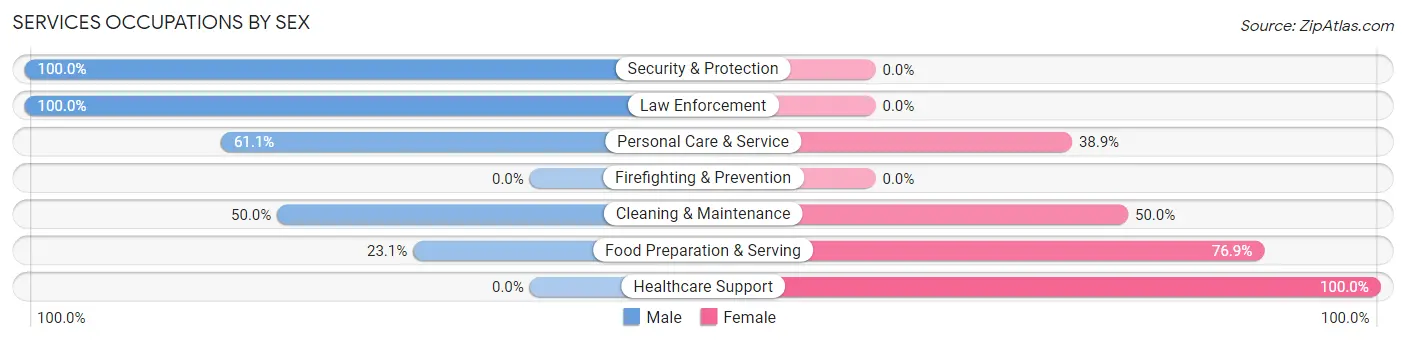
Services Occupations by Sex
Within the Services occupations in Port Deposit, the most male-oriented occupations are Security & Protection (100.0%), Law Enforcement (100.0%), and Personal Care & Service (61.1%), while the most female-oriented occupations are Healthcare Support (100.0%), Food Preparation & Serving (76.9%), and Cleaning & Maintenance (50.0%).
| Occupation | Male | Female |
| Healthcare Support | 0 (0.0%) | 12 (100.0%) |
| Security & Protection | 6 (100.0%) | 0 (0.0%) |
| Firefighting & Prevention | 0 (0.0%) | 0 (0.0%) |
| Law Enforcement | 6 (100.0%) | 0 (0.0%) |
| Food Preparation & Serving | 3 (23.1%) | 10 (76.9%) |
| Cleaning & Maintenance | 6 (50.0%) | 6 (50.0%) |
| Personal Care & Service | 11 (61.1%) | 7 (38.9%) |
| Total (Category) | 26 (42.6%) | 35 (57.4%) |
| Total (Overall) | 119 (40.5%) | 175 (59.5%) |
Sales and Office Occupations
The most common Sales and Office occupations in Port Deposit are Sales & Related (30 | 10.2%), and Office & Administration (24 | 8.2%).
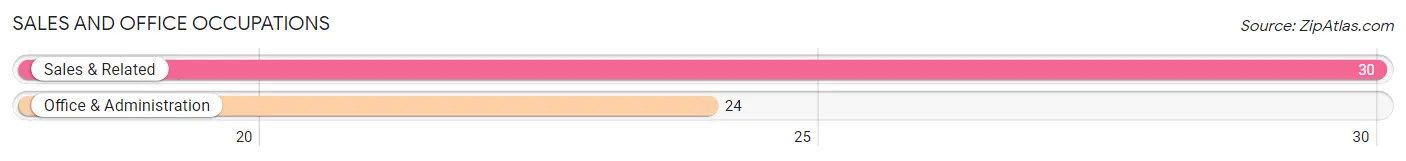
Sales and Office Occupations by Sex
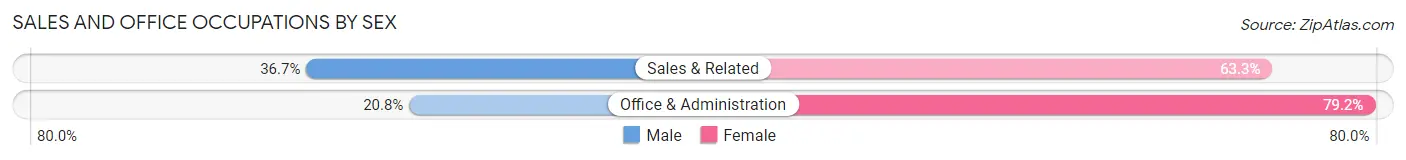
| Occupation | Male | Female |
| Sales & Related | 11 (36.7%) | 19 (63.3%) |
| Office & Administration | 5 (20.8%) | 19 (79.2%) |
| Total (Category) | 16 (29.6%) | 38 (70.4%) |
| Total (Overall) | 119 (40.5%) | 175 (59.5%) |
Natural Resources, Construction and Maintenance Occupations
The most common Natural Resources, Construction and Maintenance occupations in Port Deposit are Construction & Extraction (14 | 4.8%), and Installation, Maintenance & Repair (6 | 2.0%).
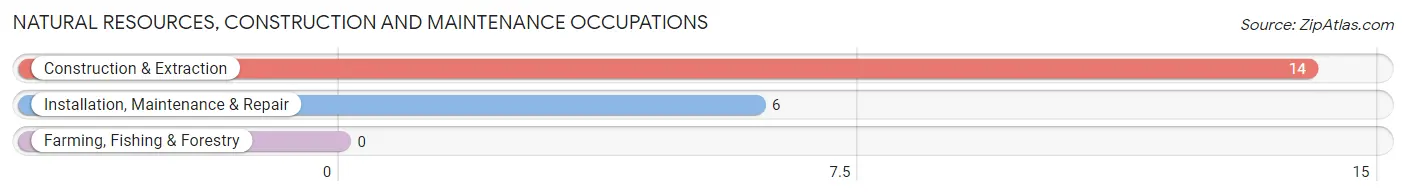
Natural Resources, Construction and Maintenance Occupations by Sex
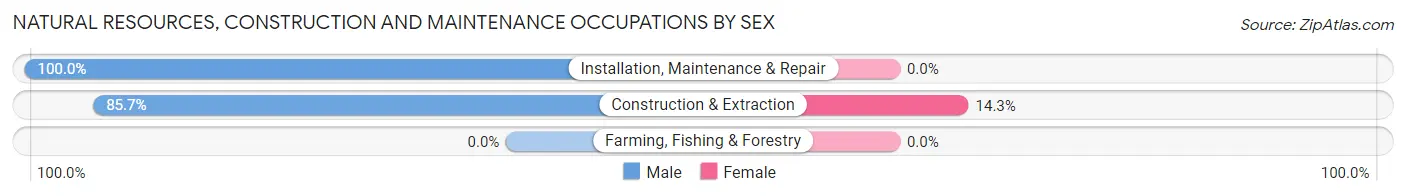
| Occupation | Male | Female |
| Farming, Fishing & Forestry | 0 (0.0%) | 0 (0.0%) |
| Construction & Extraction | 12 (85.7%) | 2 (14.3%) |
| Installation, Maintenance & Repair | 6 (100.0%) | 0 (0.0%) |
| Total (Category) | 18 (90.0%) | 2 (10.0%) |
| Total (Overall) | 119 (40.5%) | 175 (59.5%) |
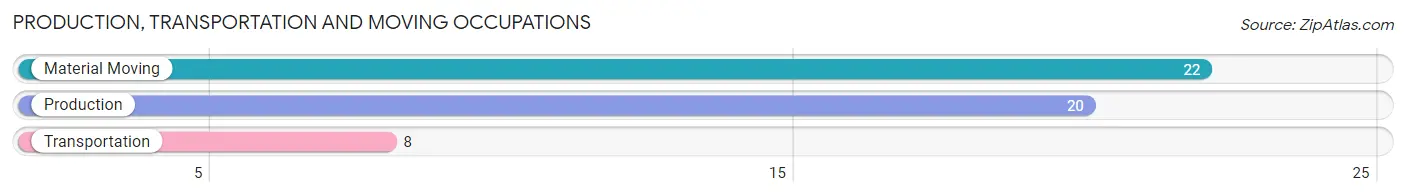
Production, Transportation and Moving Occupations
The most common Production, Transportation and Moving occupations in Port Deposit are Material Moving (22 | 7.5%), Production (20 | 6.8%), and Transportation (8 | 2.7%).
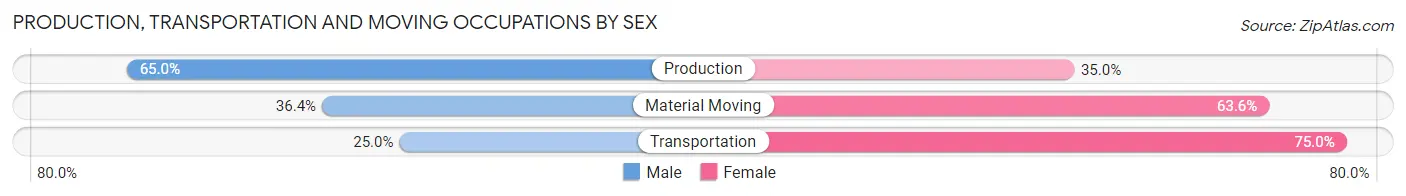
Production, Transportation and Moving Occupations by Sex
| Occupation | Male | Female |
| Production | 13 (65.0%) | 7 (35.0%) |
| Transportation | 2 (25.0%) | 6 (75.0%) |
| Material Moving | 8 (36.4%) | 14 (63.6%) |
| Total (Category) | 23 (46.0%) | 27 (54.0%) |
| Total (Overall) | 119 (40.5%) | 175 (59.5%) |
Employment Industries by Sex in Port Deposit
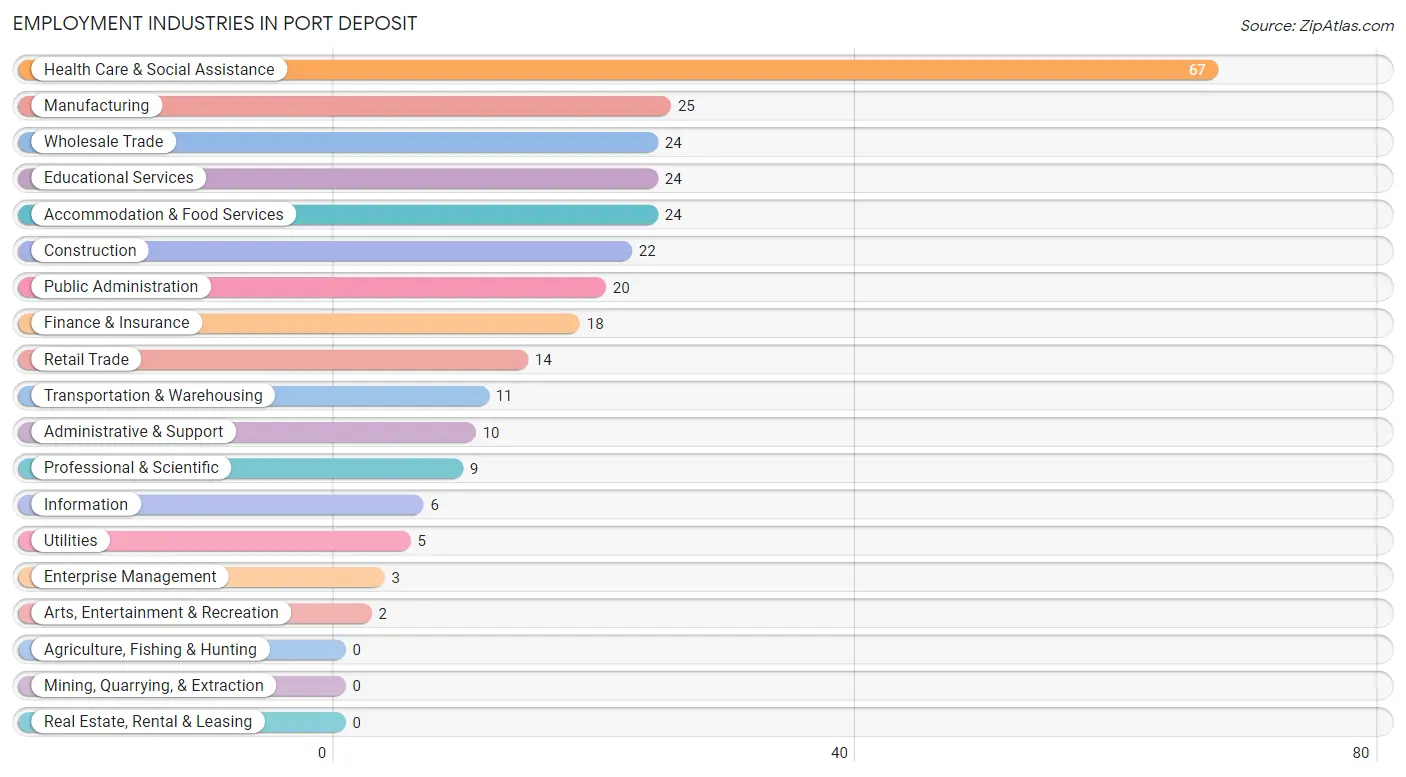
Employment Industries in Port Deposit
The major employment industries in Port Deposit include Health Care & Social Assistance (67 | 22.8%), Manufacturing (25 | 8.5%), Wholesale Trade (24 | 8.2%), Educational Services (24 | 8.2%), and Accommodation & Food Services (24 | 8.2%).
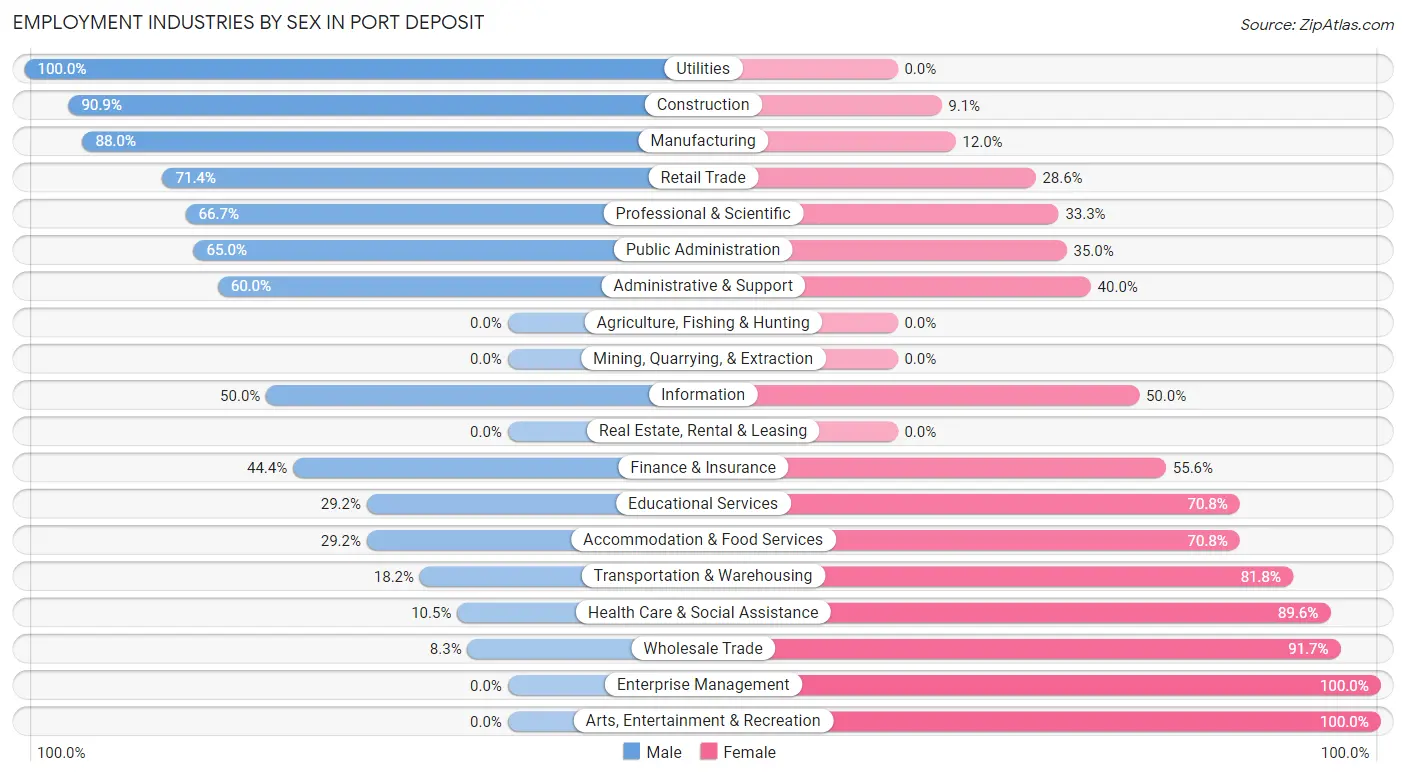
Employment Industries by Sex in Port Deposit
The Port Deposit industries that see more men than women are Utilities (100.0%), Construction (90.9%), and Manufacturing (88.0%), whereas the industries that tend to have a higher number of women are Enterprise Management (100.0%), Arts, Entertainment & Recreation (100.0%), and Wholesale Trade (91.7%).
| Industry | Male | Female |
| Agriculture, Fishing & Hunting | 0 (0.0%) | 0 (0.0%) |
| Mining, Quarrying, & Extraction | 0 (0.0%) | 0 (0.0%) |
| Construction | 20 (90.9%) | 2 (9.1%) |
| Manufacturing | 22 (88.0%) | 3 (12.0%) |
| Wholesale Trade | 2 (8.3%) | 22 (91.7%) |
| Retail Trade | 10 (71.4%) | 4 (28.6%) |
| Transportation & Warehousing | 2 (18.2%) | 9 (81.8%) |
| Utilities | 5 (100.0%) | 0 (0.0%) |
| Information | 3 (50.0%) | 3 (50.0%) |
| Finance & Insurance | 8 (44.4%) | 10 (55.6%) |
| Real Estate, Rental & Leasing | 0 (0.0%) | 0 (0.0%) |
| Professional & Scientific | 6 (66.7%) | 3 (33.3%) |
| Enterprise Management | 0 (0.0%) | 3 (100.0%) |
| Administrative & Support | 6 (60.0%) | 4 (40.0%) |
| Educational Services | 7 (29.2%) | 17 (70.8%) |
| Health Care & Social Assistance | 7 (10.4%) | 60 (89.5%) |
| Arts, Entertainment & Recreation | 0 (0.0%) | 2 (100.0%) |
| Accommodation & Food Services | 7 (29.2%) | 17 (70.8%) |
| Public Administration | 13 (65.0%) | 7 (35.0%) |
| Total | 119 (40.5%) | 175 (59.5%) |
Education in Port Deposit
School Enrollment in Port Deposit
The most common levels of schooling among the 157 students in Port Deposit are college / undergraduate (35 | 22.3%), elementary school (27 | 17.2%), and middle school (26 | 16.6%).
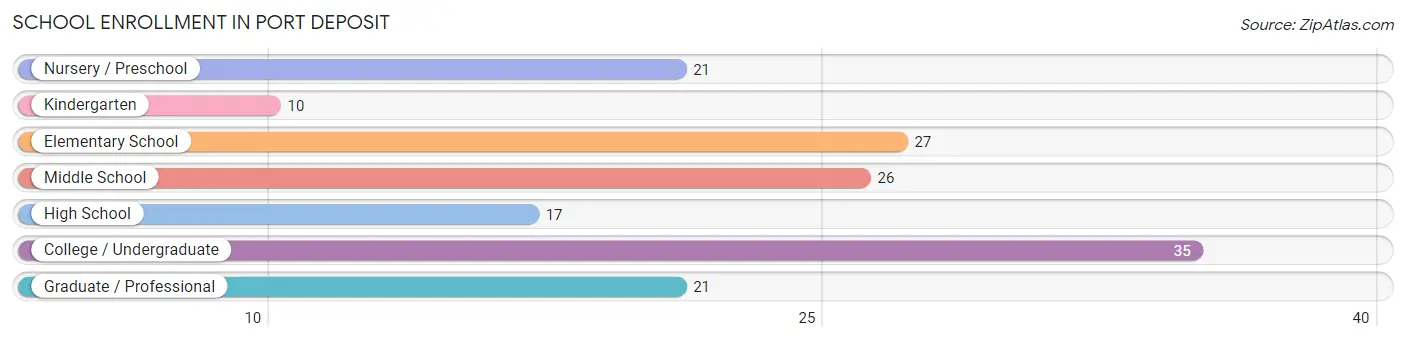
| School Level | # Students | % Students |
| Nursery / Preschool | 21 | 13.4% |
| Kindergarten | 10 | 6.4% |
| Elementary School | 27 | 17.2% |
| Middle School | 26 | 16.6% |
| High School | 17 | 10.8% |
| College / Undergraduate | 35 | 22.3% |
| Graduate / Professional | 21 | 13.4% |
| Total | 157 | 100.0% |
School Enrollment by Age by Funding Source in Port Deposit
Out of a total of 157 students who are enrolled in schools in Port Deposit, 29 (18.5%) attend a private institution, while the remaining 128 (81.5%) are enrolled in public schools. The age group of 35 years and over has the highest likelihood of being enrolled in private schools, with 17 (60.7% in the age bracket) enrolled. Conversely, the age group of 5 to 9 year old has the lowest likelihood of being enrolled in a private school, with 35 (100.0% in the age bracket) attending a public institution.
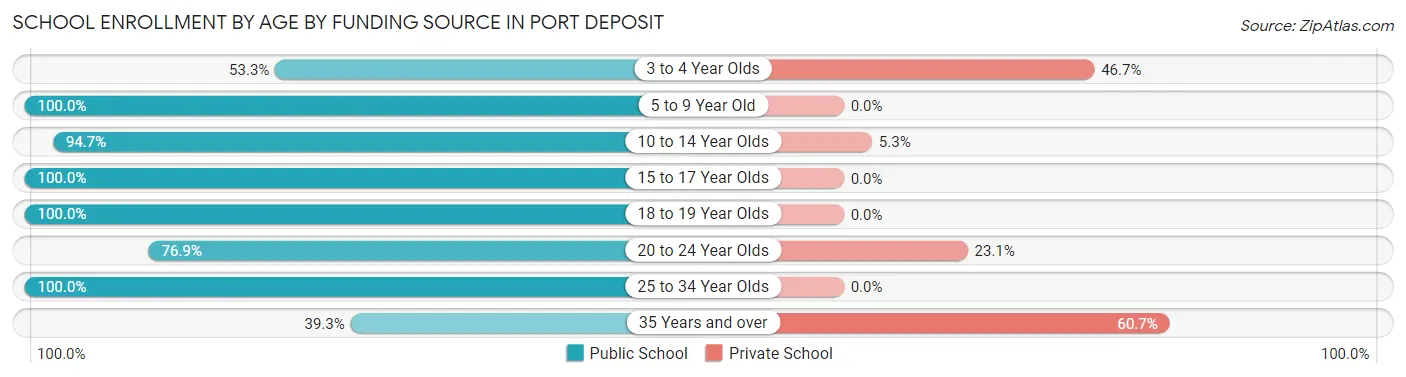
| Age Bracket | Public School | Private School |
| 3 to 4 Year Olds | 8 (53.3%) | 7 (46.7%) |
| 5 to 9 Year Old | 35 (100.0%) | 0 (0.0%) |
| 10 to 14 Year Olds | 36 (94.7%) | 2 (5.3%) |
| 15 to 17 Year Olds | 13 (100.0%) | 0 (0.0%) |
| 18 to 19 Year Olds | 6 (100.0%) | 0 (0.0%) |
| 20 to 24 Year Olds | 10 (76.9%) | 3 (23.1%) |
| 25 to 34 Year Olds | 9 (100.0%) | 0 (0.0%) |
| 35 Years and over | 11 (39.3%) | 17 (60.7%) |
| Total | 128 (81.5%) | 29 (18.5%) |
Educational Attainment by Field of Study in Port Deposit
Education (34 | 18.4%), business (27 | 14.6%), physical & health sciences (14 | 7.6%), psychology (14 | 7.6%), and engineering (13 | 7.0%) are the most common fields of study among 185 individuals in Port Deposit who have obtained a bachelor's degree or higher.
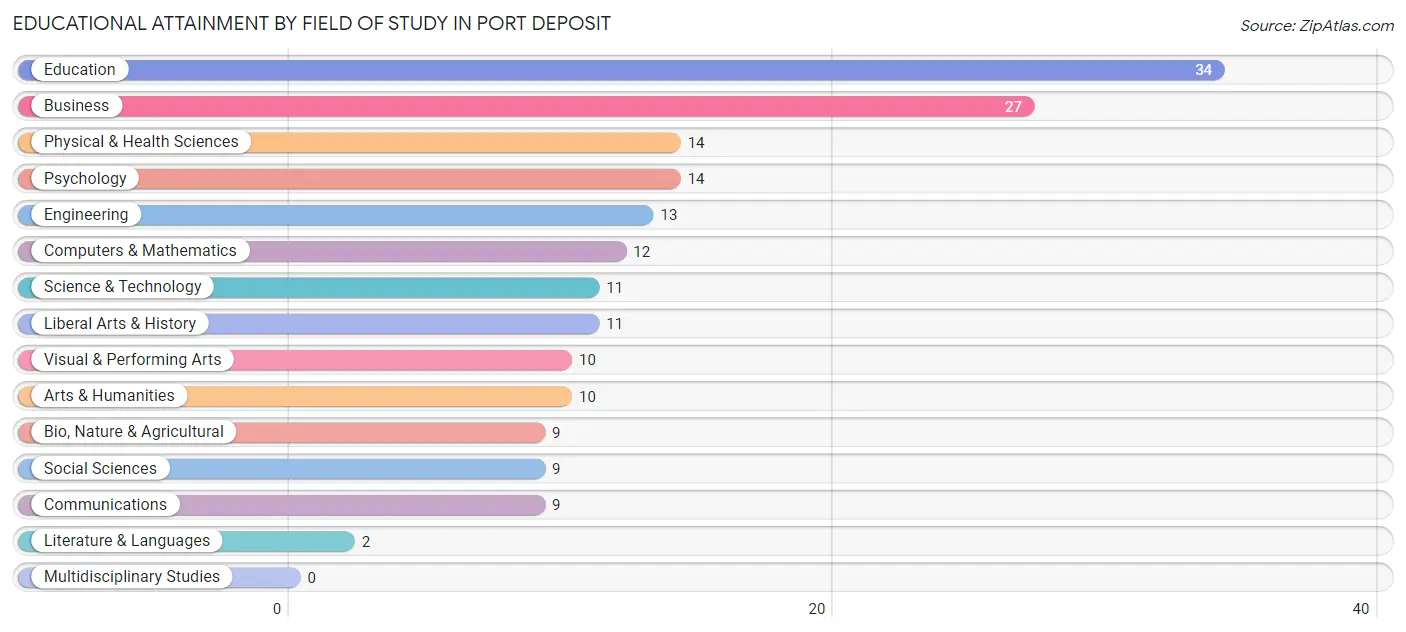
| Field of Study | # Graduates | % Graduates |
| Computers & Mathematics | 12 | 6.5% |
| Bio, Nature & Agricultural | 9 | 4.9% |
| Physical & Health Sciences | 14 | 7.6% |
| Psychology | 14 | 7.6% |
| Social Sciences | 9 | 4.9% |
| Engineering | 13 | 7.0% |
| Multidisciplinary Studies | 0 | 0.0% |
| Science & Technology | 11 | 5.9% |
| Business | 27 | 14.6% |
| Education | 34 | 18.4% |
| Literature & Languages | 2 | 1.1% |
| Liberal Arts & History | 11 | 5.9% |
| Visual & Performing Arts | 10 | 5.4% |
| Communications | 9 | 4.9% |
| Arts & Humanities | 10 | 5.4% |
| Total | 185 | 100.0% |
Transportation & Commute in Port Deposit
Vehicle Availability by Sex in Port Deposit
The most prevalent vehicle ownership categories in Port Deposit are males with 1 vehicle (45, accounting for 38.5%) and females with 1 vehicle (97, making up 25.7%).
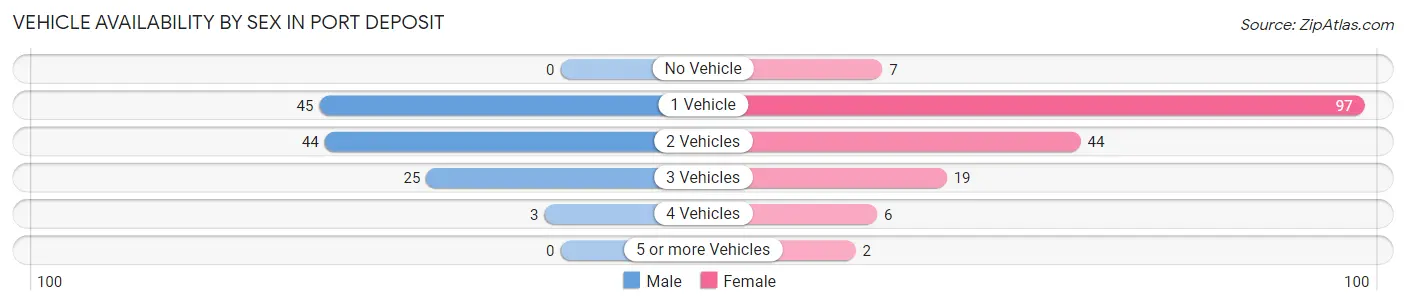
| Vehicles Available | Male | Female |
| No Vehicle | 0 (0.0%) | 7 (4.0%) |
| 1 Vehicle | 45 (38.5%) | 97 (55.4%) |
| 2 Vehicles | 44 (37.6%) | 44 (25.1%) |
| 3 Vehicles | 25 (21.4%) | 19 (10.9%) |
| 4 Vehicles | 3 (2.6%) | 6 (3.4%) |
| 5 or more Vehicles | 0 (0.0%) | 2 (1.1%) |
| Total | 117 (100.0%) | 175 (100.0%) |
Commute Time in Port Deposit
The most frequently occuring commute durations in Port Deposit are 30 to 34 minutes (81 commuters, 29.7%), 45 to 59 minutes (49 commuters, 17.9%), and 15 to 19 minutes (36 commuters, 13.2%).
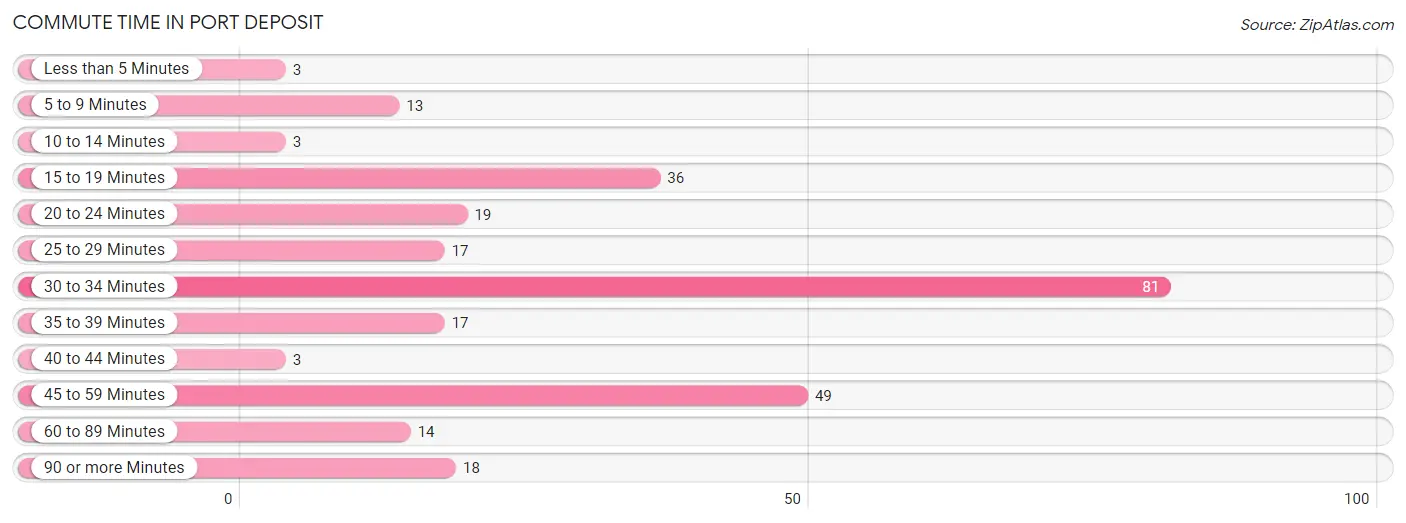
| Commute Time | # Commuters | % Commuters |
| Less than 5 Minutes | 3 | 1.1% |
| 5 to 9 Minutes | 13 | 4.8% |
| 10 to 14 Minutes | 3 | 1.1% |
| 15 to 19 Minutes | 36 | 13.2% |
| 20 to 24 Minutes | 19 | 7.0% |
| 25 to 29 Minutes | 17 | 6.2% |
| 30 to 34 Minutes | 81 | 29.7% |
| 35 to 39 Minutes | 17 | 6.2% |
| 40 to 44 Minutes | 3 | 1.1% |
| 45 to 59 Minutes | 49 | 17.9% |
| 60 to 89 Minutes | 14 | 5.1% |
| 90 or more Minutes | 18 | 6.6% |
Commute Time by Sex in Port Deposit
The most common commute times in Port Deposit are 30 to 34 minutes (26 commuters, 26.5%) for males and 30 to 34 minutes (55 commuters, 31.4%) for females.
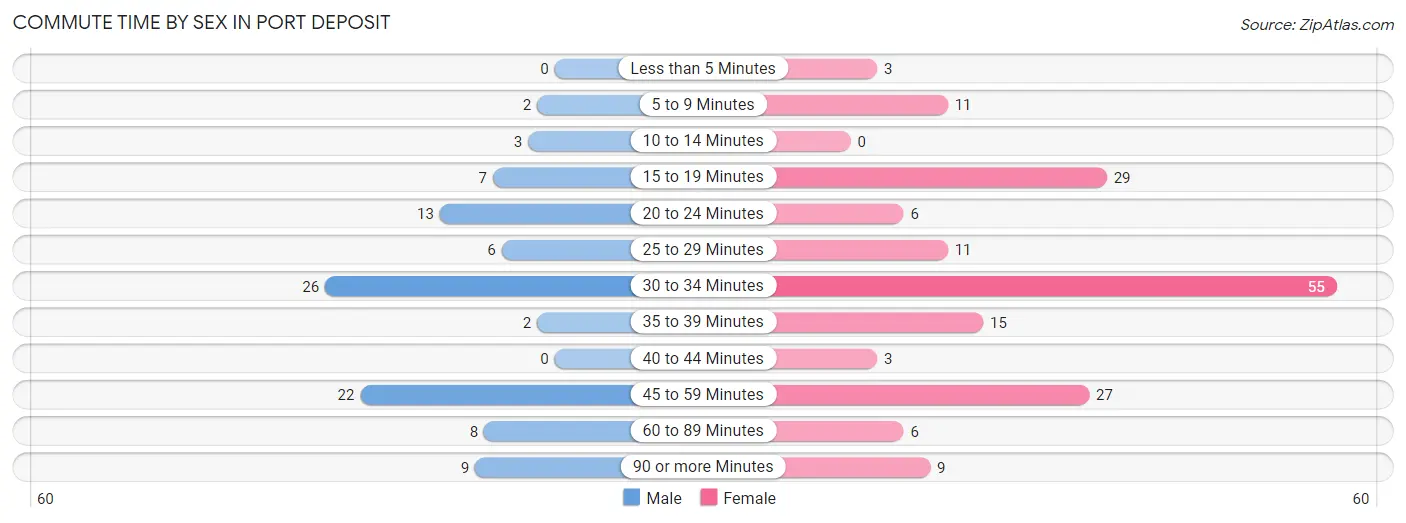
| Commute Time | Male | Female |
| Less than 5 Minutes | 0 (0.0%) | 3 (1.7%) |
| 5 to 9 Minutes | 2 (2.0%) | 11 (6.3%) |
| 10 to 14 Minutes | 3 (3.1%) | 0 (0.0%) |
| 15 to 19 Minutes | 7 (7.1%) | 29 (16.6%) |
| 20 to 24 Minutes | 13 (13.3%) | 6 (3.4%) |
| 25 to 29 Minutes | 6 (6.1%) | 11 (6.3%) |
| 30 to 34 Minutes | 26 (26.5%) | 55 (31.4%) |
| 35 to 39 Minutes | 2 (2.0%) | 15 (8.6%) |
| 40 to 44 Minutes | 0 (0.0%) | 3 (1.7%) |
| 45 to 59 Minutes | 22 (22.5%) | 27 (15.4%) |
| 60 to 89 Minutes | 8 (8.2%) | 6 (3.4%) |
| 90 or more Minutes | 9 (9.2%) | 9 (5.1%) |
Time of Departure to Work by Sex in Port Deposit
The most frequent times of departure to work in Port Deposit are 7:00 AM to 7:29 AM (34, 34.7%) for males and 6:00 AM to 6:29 AM (23, 13.1%) for females.
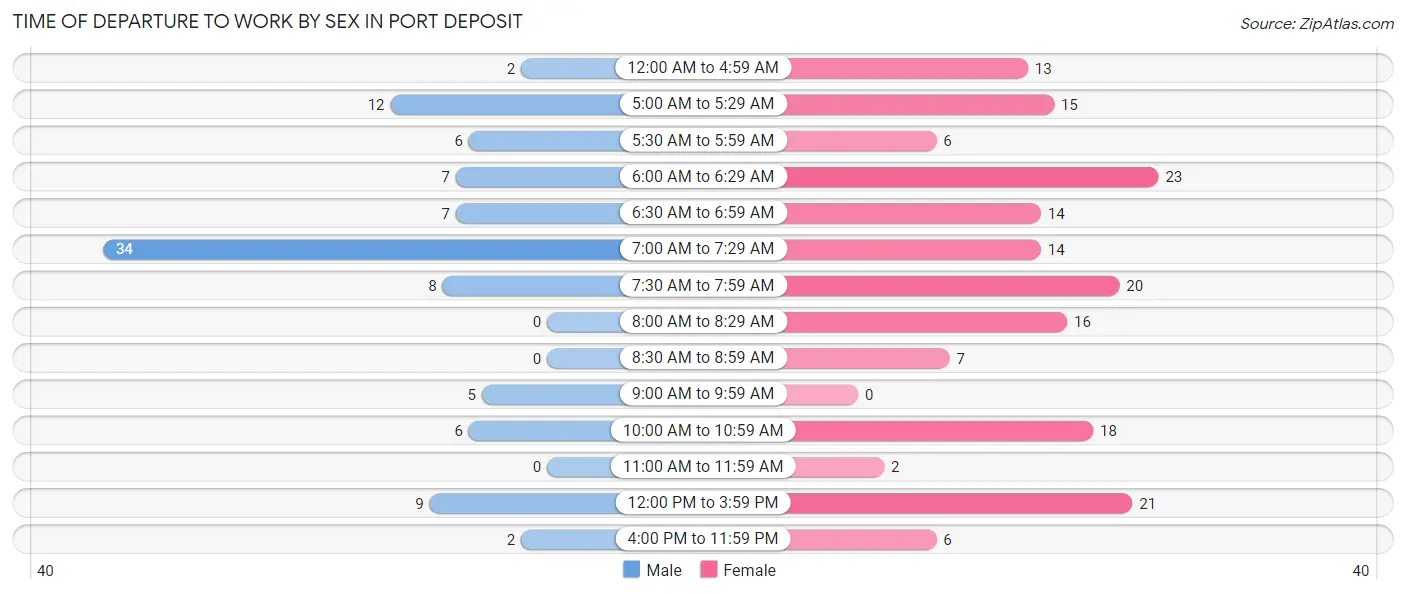
| Time of Departure | Male | Female |
| 12:00 AM to 4:59 AM | 2 (2.0%) | 13 (7.4%) |
| 5:00 AM to 5:29 AM | 12 (12.2%) | 15 (8.6%) |
| 5:30 AM to 5:59 AM | 6 (6.1%) | 6 (3.4%) |
| 6:00 AM to 6:29 AM | 7 (7.1%) | 23 (13.1%) |
| 6:30 AM to 6:59 AM | 7 (7.1%) | 14 (8.0%) |
| 7:00 AM to 7:29 AM | 34 (34.7%) | 14 (8.0%) |
| 7:30 AM to 7:59 AM | 8 (8.2%) | 20 (11.4%) |
| 8:00 AM to 8:29 AM | 0 (0.0%) | 16 (9.1%) |
| 8:30 AM to 8:59 AM | 0 (0.0%) | 7 (4.0%) |
| 9:00 AM to 9:59 AM | 5 (5.1%) | 0 (0.0%) |
| 10:00 AM to 10:59 AM | 6 (6.1%) | 18 (10.3%) |
| 11:00 AM to 11:59 AM | 0 (0.0%) | 2 (1.1%) |
| 12:00 PM to 3:59 PM | 9 (9.2%) | 21 (12.0%) |
| 4:00 PM to 11:59 PM | 2 (2.0%) | 6 (3.4%) |
| Total | 98 (100.0%) | 175 (100.0%) |
Housing Occupancy in Port Deposit
Occupancy by Ownership in Port Deposit
Of the total 285 dwellings in Port Deposit, owner-occupied units account for 150 (52.6%), while renter-occupied units make up 135 (47.4%).
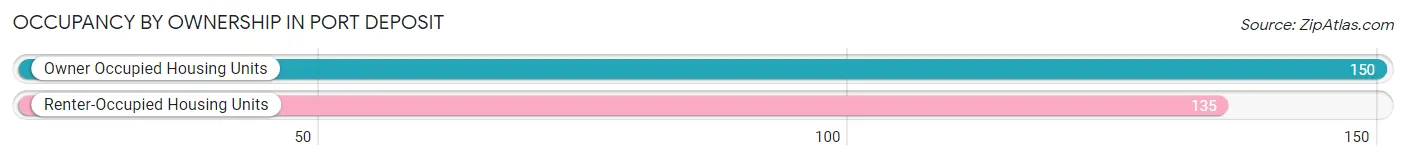
| Occupancy | # Housing Units | % Housing Units |
| Owner Occupied Housing Units | 150 | 52.6% |
| Renter-Occupied Housing Units | 135 | 47.4% |
| Total Occupied Housing Units | 285 | 100.0% |
Occupancy by Household Size in Port Deposit
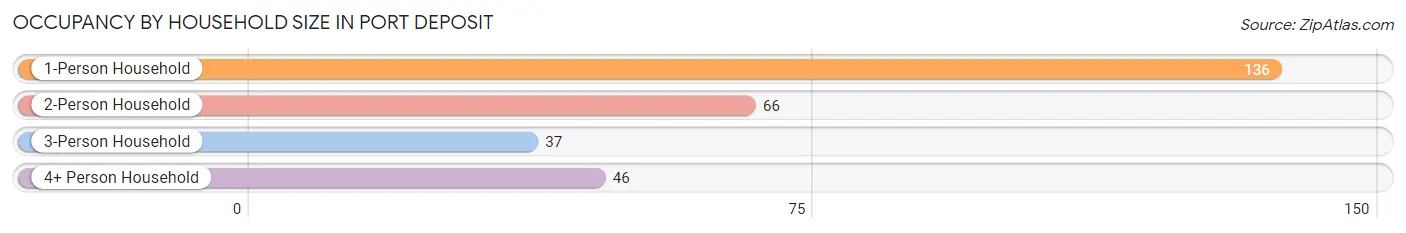
| Household Size | # Housing Units | % Housing Units |
| 1-Person Household | 136 | 47.7% |
| 2-Person Household | 66 | 23.2% |
| 3-Person Household | 37 | 13.0% |
| 4+ Person Household | 46 | 16.1% |
| Total Housing Units | 285 | 100.0% |
Occupancy by Ownership by Household Size in Port Deposit
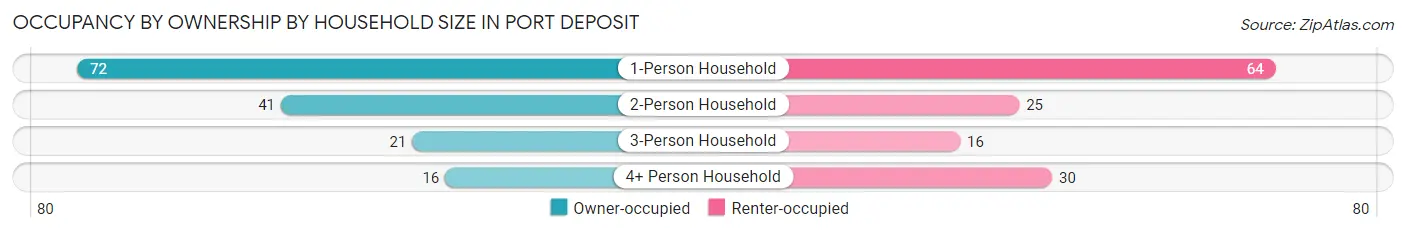
| Household Size | Owner-occupied | Renter-occupied |
| 1-Person Household | 72 (52.9%) | 64 (47.1%) |
| 2-Person Household | 41 (62.1%) | 25 (37.9%) |
| 3-Person Household | 21 (56.8%) | 16 (43.2%) |
| 4+ Person Household | 16 (34.8%) | 30 (65.2%) |
| Total Housing Units | 150 (52.6%) | 135 (47.4%) |
Occupancy by Educational Attainment in Port Deposit
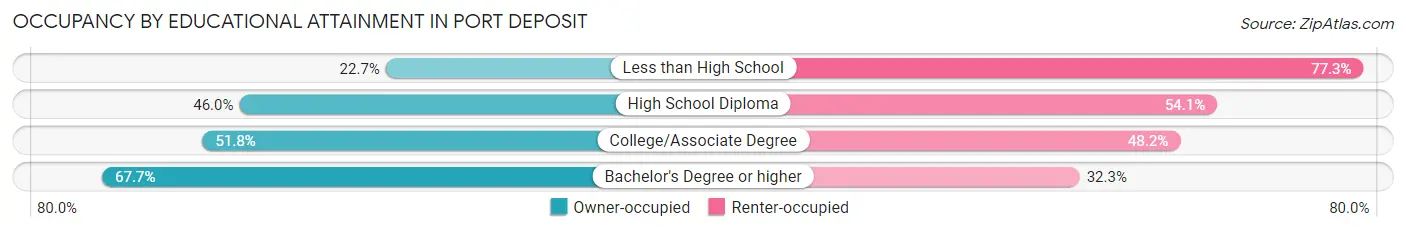
| Household Size | Owner-occupied | Renter-occupied |
| Less than High School | 5 (22.7%) | 17 (77.3%) |
| High School Diploma | 51 (46.0%) | 60 (54.0%) |
| College/Associate Degree | 29 (51.8%) | 27 (48.2%) |
| Bachelor's Degree or higher | 65 (67.7%) | 31 (32.3%) |
Occupancy by Age of Householder in Port Deposit
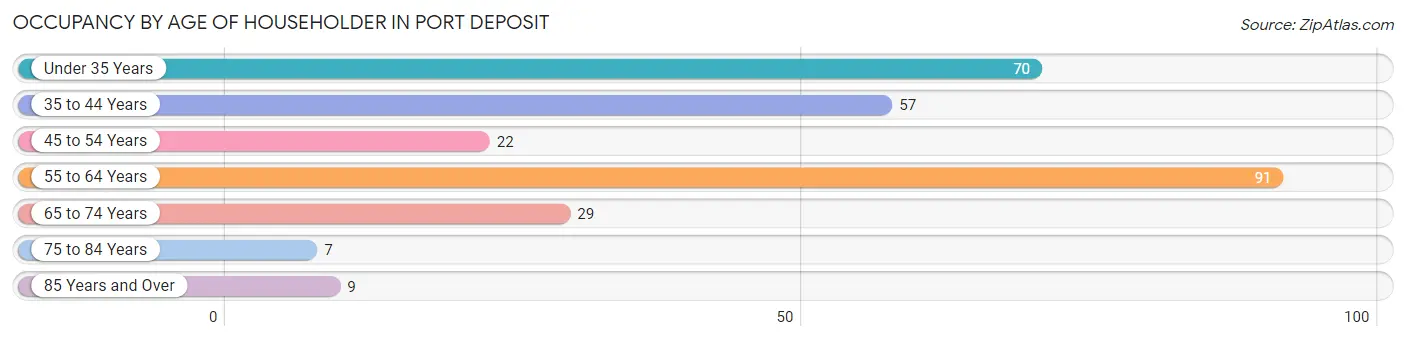
| Age Bracket | # Households | % Households |
| Under 35 Years | 70 | 24.6% |
| 35 to 44 Years | 57 | 20.0% |
| 45 to 54 Years | 22 | 7.7% |
| 55 to 64 Years | 91 | 31.9% |
| 65 to 74 Years | 29 | 10.2% |
| 75 to 84 Years | 7 | 2.5% |
| 85 Years and Over | 9 | 3.2% |
| Total | 285 | 100.0% |
Housing Finances in Port Deposit
Median Income by Occupancy in Port Deposit
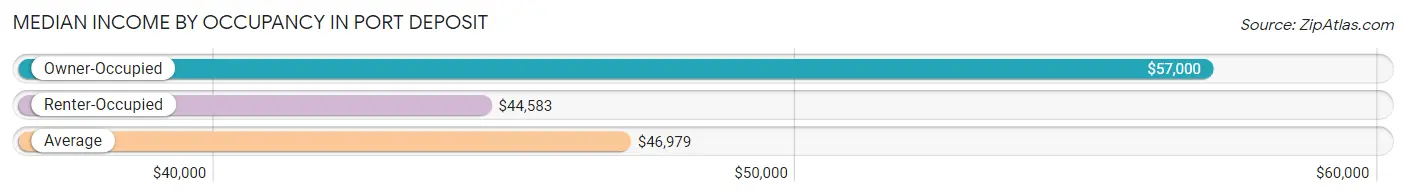
| Occupancy Type | # Households | Median Income |
| Owner-Occupied | 150 (52.6%) | $57,000 |
| Renter-Occupied | 135 (47.4%) | $44,583 |
| Average | 285 (100.0%) | $46,979 |
Occupancy by Householder Income Bracket in Port Deposit
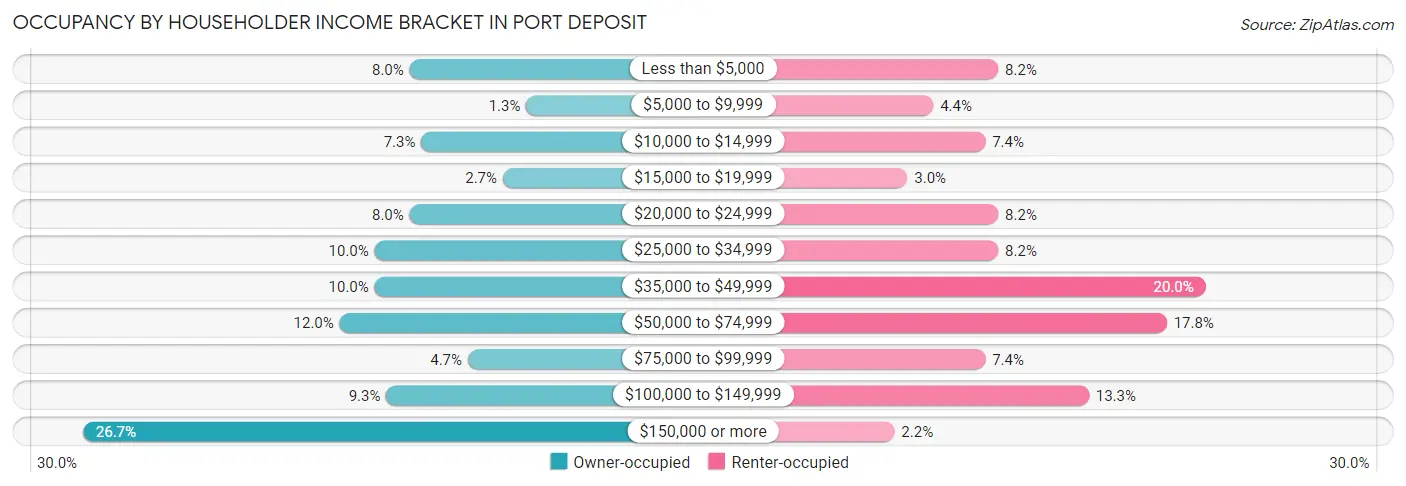
| Income Bracket | Owner-occupied | Renter-occupied |
| Less than $5,000 | 12 (8.0%) | 11 (8.2%) |
| $5,000 to $9,999 | 2 (1.3%) | 6 (4.4%) |
| $10,000 to $14,999 | 11 (7.3%) | 10 (7.4%) |
| $15,000 to $19,999 | 4 (2.7%) | 4 (3.0%) |
| $20,000 to $24,999 | 12 (8.0%) | 11 (8.2%) |
| $25,000 to $34,999 | 15 (10.0%) | 11 (8.2%) |
| $35,000 to $49,999 | 15 (10.0%) | 27 (20.0%) |
| $50,000 to $74,999 | 18 (12.0%) | 24 (17.8%) |
| $75,000 to $99,999 | 7 (4.7%) | 10 (7.4%) |
| $100,000 to $149,999 | 14 (9.3%) | 18 (13.3%) |
| $150,000 or more | 40 (26.7%) | 3 (2.2%) |
| Total | 150 (100.0%) | 135 (100.0%) |
Monthly Housing Cost Tiers in Port Deposit
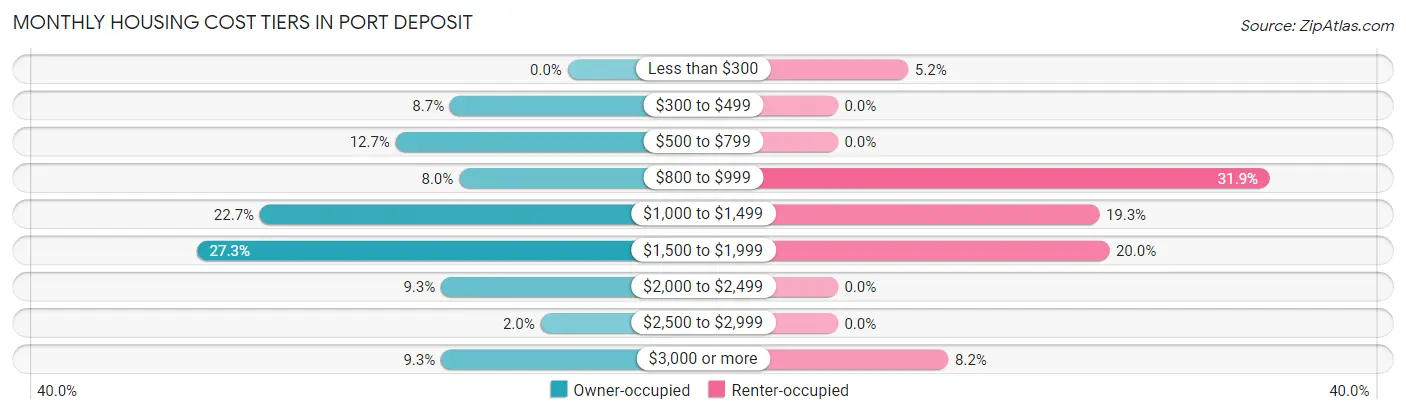
| Monthly Cost | Owner-occupied | Renter-occupied |
| Less than $300 | 0 (0.0%) | 7 (5.2%) |
| $300 to $499 | 13 (8.7%) | 0 (0.0%) |
| $500 to $799 | 19 (12.7%) | 0 (0.0%) |
| $800 to $999 | 12 (8.0%) | 43 (31.9%) |
| $1,000 to $1,499 | 34 (22.7%) | 26 (19.3%) |
| $1,500 to $1,999 | 41 (27.3%) | 27 (20.0%) |
| $2,000 to $2,499 | 14 (9.3%) | 0 (0.0%) |
| $2,500 to $2,999 | 3 (2.0%) | 0 (0.0%) |
| $3,000 or more | 14 (9.3%) | 11 (8.2%) |
| Total | 150 (100.0%) | 135 (100.0%) |
Physical Housing Characteristics in Port Deposit
Housing Structures in Port Deposit
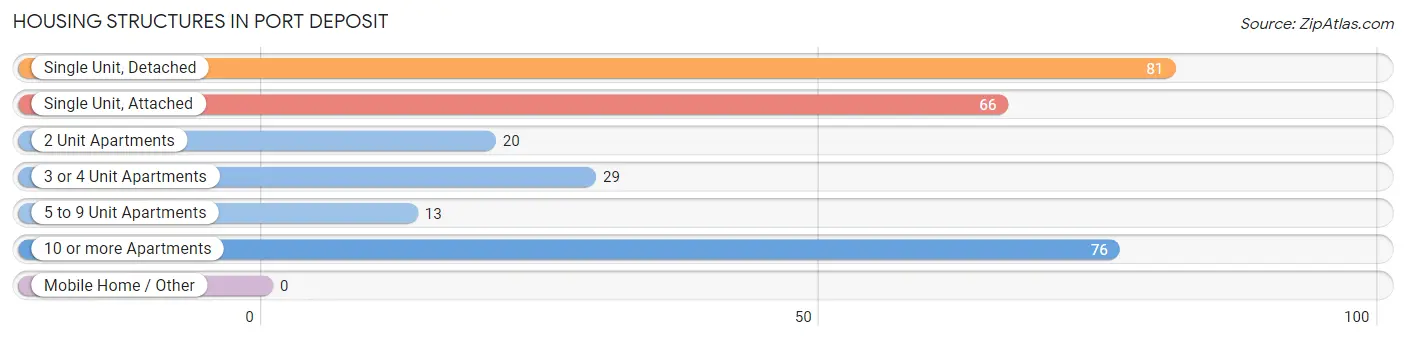
| Structure Type | # Housing Units | % Housing Units |
| Single Unit, Detached | 81 | 28.4% |
| Single Unit, Attached | 66 | 23.2% |
| 2 Unit Apartments | 20 | 7.0% |
| 3 or 4 Unit Apartments | 29 | 10.2% |
| 5 to 9 Unit Apartments | 13 | 4.6% |
| 10 or more Apartments | 76 | 26.7% |
| Mobile Home / Other | 0 | 0.0% |
| Total | 285 | 100.0% |
Housing Structures by Occupancy in Port Deposit
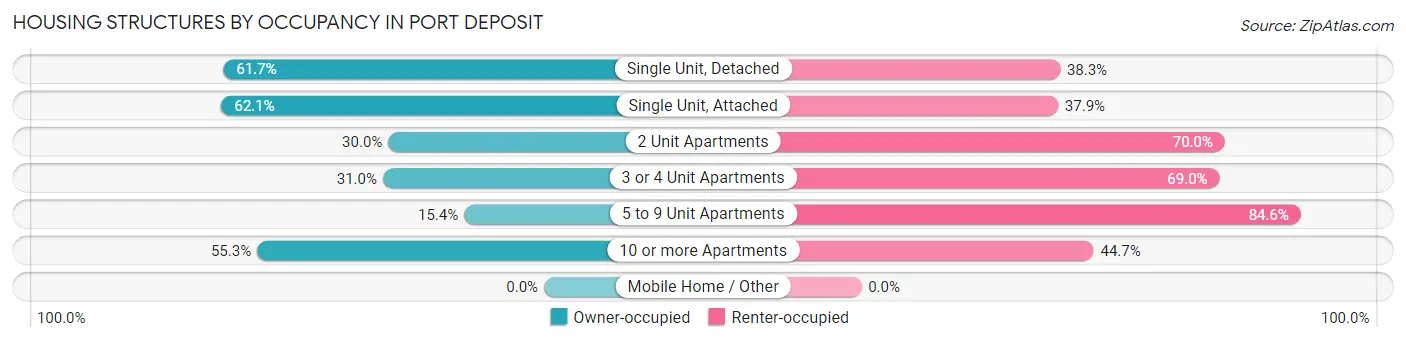
| Structure Type | Owner-occupied | Renter-occupied |
| Single Unit, Detached | 50 (61.7%) | 31 (38.3%) |
| Single Unit, Attached | 41 (62.1%) | 25 (37.9%) |
| 2 Unit Apartments | 6 (30.0%) | 14 (70.0%) |
| 3 or 4 Unit Apartments | 9 (31.0%) | 20 (69.0%) |
| 5 to 9 Unit Apartments | 2 (15.4%) | 11 (84.6%) |
| 10 or more Apartments | 42 (55.3%) | 34 (44.7%) |
| Mobile Home / Other | 0 (0.0%) | 0 (0.0%) |
| Total | 150 (52.6%) | 135 (47.4%) |
Housing Structures by Number of Rooms in Port Deposit
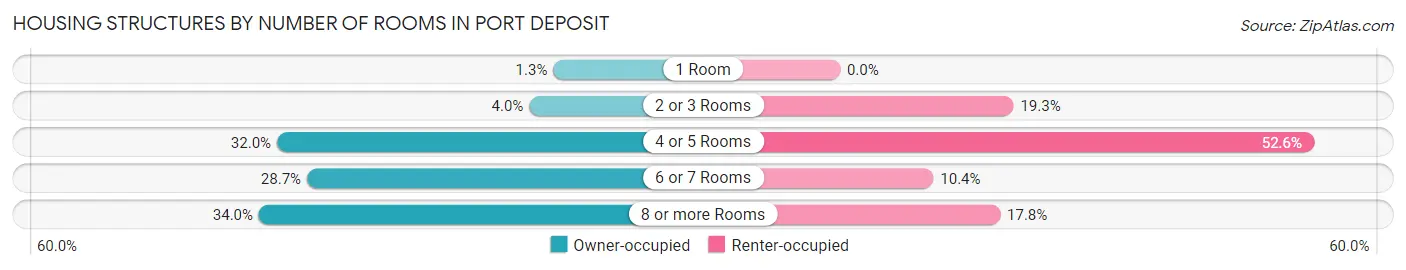
| Number of Rooms | Owner-occupied | Renter-occupied |
| 1 Room | 2 (1.3%) | 0 (0.0%) |
| 2 or 3 Rooms | 6 (4.0%) | 26 (19.3%) |
| 4 or 5 Rooms | 48 (32.0%) | 71 (52.6%) |
| 6 or 7 Rooms | 43 (28.7%) | 14 (10.4%) |
| 8 or more Rooms | 51 (34.0%) | 24 (17.8%) |
| Total | 150 (100.0%) | 135 (100.0%) |
Housing Structure by Heating Type in Port Deposit
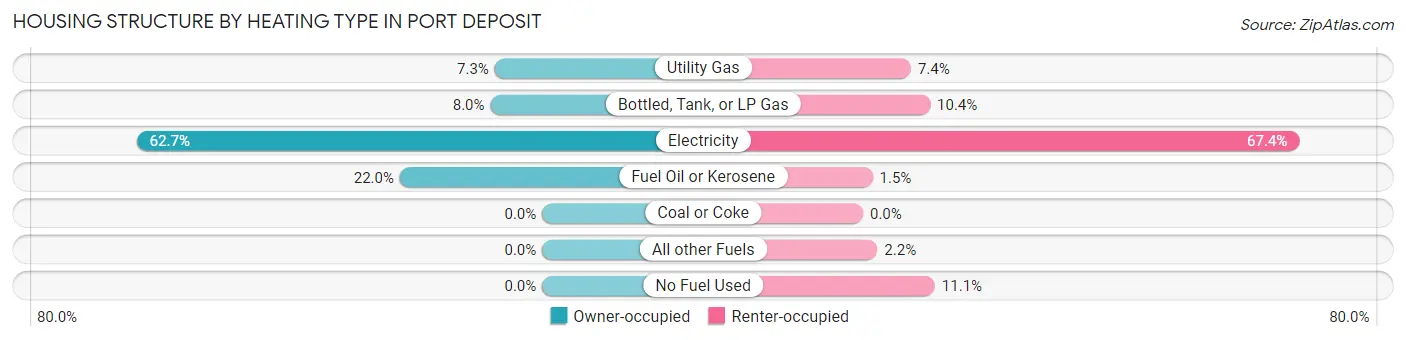
| Heating Type | Owner-occupied | Renter-occupied |
| Utility Gas | 11 (7.3%) | 10 (7.4%) |
| Bottled, Tank, or LP Gas | 12 (8.0%) | 14 (10.4%) |
| Electricity | 94 (62.7%) | 91 (67.4%) |
| Fuel Oil or Kerosene | 33 (22.0%) | 2 (1.5%) |
| Coal or Coke | 0 (0.0%) | 0 (0.0%) |
| All other Fuels | 0 (0.0%) | 3 (2.2%) |
| No Fuel Used | 0 (0.0%) | 15 (11.1%) |
| Total | 150 (100.0%) | 135 (100.0%) |
Household Vehicle Usage in Port Deposit
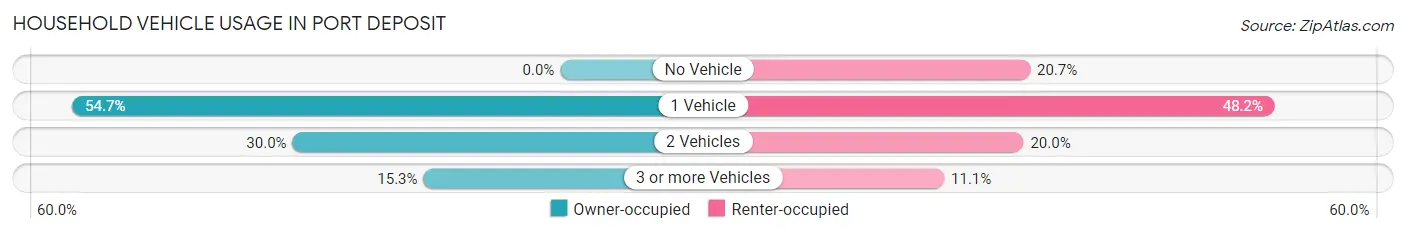
| Vehicles per Household | Owner-occupied | Renter-occupied |
| No Vehicle | 0 (0.0%) | 28 (20.7%) |
| 1 Vehicle | 82 (54.7%) | 65 (48.1%) |
| 2 Vehicles | 45 (30.0%) | 27 (20.0%) |
| 3 or more Vehicles | 23 (15.3%) | 15 (11.1%) |
| Total | 150 (100.0%) | 135 (100.0%) |
Real Estate & Mortgages in Port Deposit
Real Estate and Mortgage Overview in Port Deposit
| Characteristic | Without Mortgage | With Mortgage |
| Housing Units | 49 | 101 |
| Median Property Value | $189,600 | $240,600 |
| Median Household Income | - | - |
| Monthly Housing Costs | $672 | $14 |
| Real Estate Taxes | $2,833 | $0 |
Property Value by Mortgage Status in Port Deposit
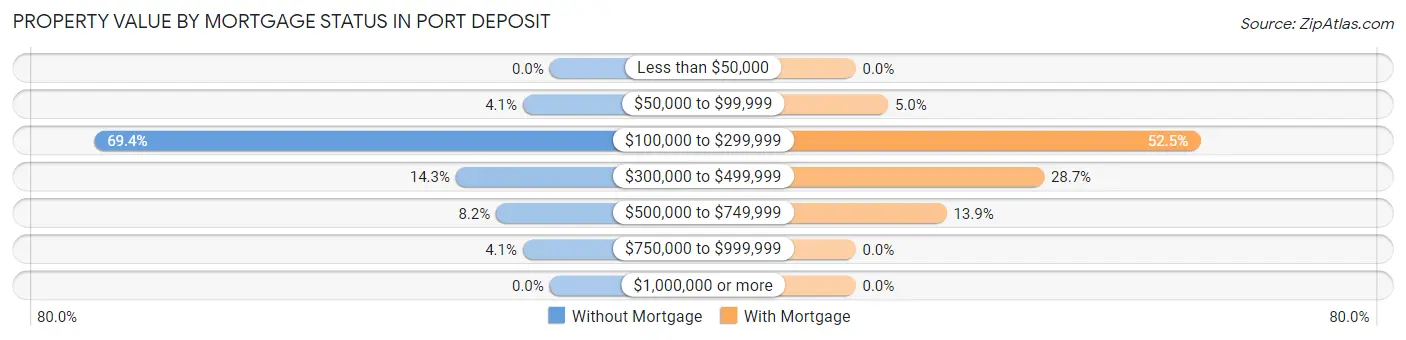
| Property Value | Without Mortgage | With Mortgage |
| Less than $50,000 | 0 (0.0%) | 0 (0.0%) |
| $50,000 to $99,999 | 2 (4.1%) | 5 (5.0%) |
| $100,000 to $299,999 | 34 (69.4%) | 53 (52.5%) |
| $300,000 to $499,999 | 7 (14.3%) | 29 (28.7%) |
| $500,000 to $749,999 | 4 (8.2%) | 14 (13.9%) |
| $750,000 to $999,999 | 2 (4.1%) | 0 (0.0%) |
| $1,000,000 or more | 0 (0.0%) | 0 (0.0%) |
| Total | 49 (100.0%) | 101 (100.0%) |
Household Income by Mortgage Status in Port Deposit
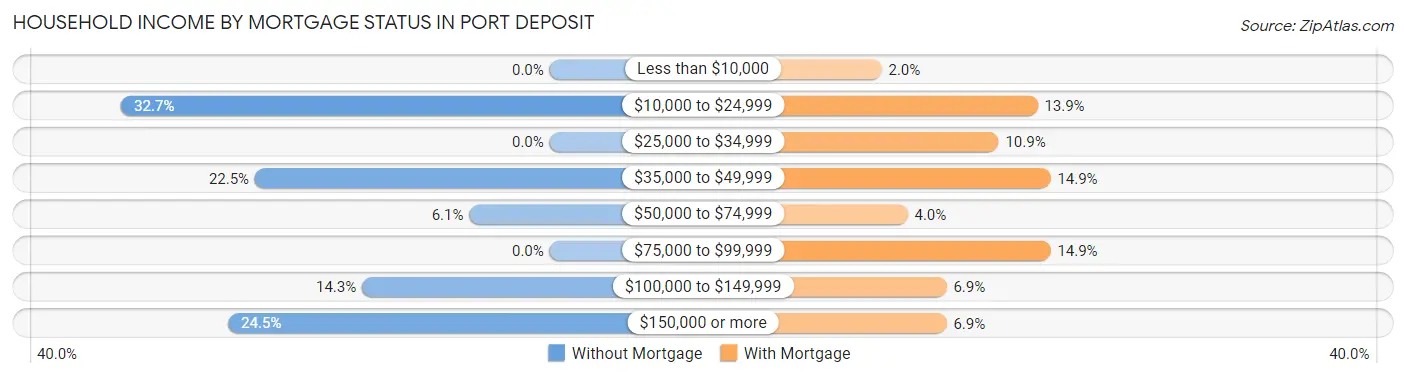
| Household Income | Without Mortgage | With Mortgage |
| Less than $10,000 | 0 (0.0%) | 2 (2.0%) |
| $10,000 to $24,999 | 16 (32.7%) | 14 (13.9%) |
| $25,000 to $34,999 | 0 (0.0%) | 11 (10.9%) |
| $35,000 to $49,999 | 11 (22.5%) | 15 (14.8%) |
| $50,000 to $74,999 | 3 (6.1%) | 4 (4.0%) |
| $75,000 to $99,999 | 0 (0.0%) | 15 (14.8%) |
| $100,000 to $149,999 | 7 (14.3%) | 7 (6.9%) |
| $150,000 or more | 12 (24.5%) | 7 (6.9%) |
| Total | 49 (100.0%) | 101 (100.0%) |
Property Value to Household Income Ratio in Port Deposit
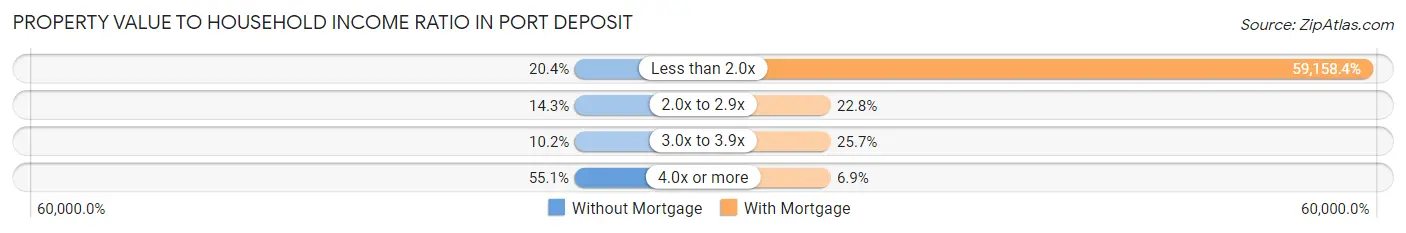
| Value-to-Income Ratio | Without Mortgage | With Mortgage |
| Less than 2.0x | 10 (20.4%) | 59,750 (59,158.4%) |
| 2.0x to 2.9x | 7 (14.3%) | 23 (22.8%) |
| 3.0x to 3.9x | 5 (10.2%) | 26 (25.7%) |
| 4.0x or more | 27 (55.1%) | 7 (6.9%) |
| Total | 49 (100.0%) | 101 (100.0%) |
Real Estate Taxes by Mortgage Status in Port Deposit
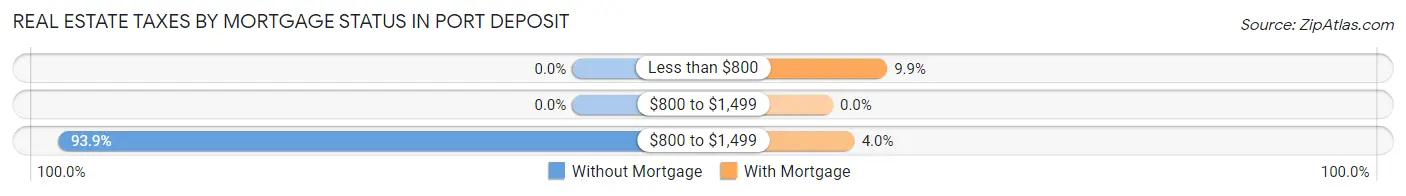
| Property Taxes | Without Mortgage | With Mortgage |
| Less than $800 | 0 (0.0%) | 10 (9.9%) |
| $800 to $1,499 | 0 (0.0%) | 0 (0.0%) |
| $800 to $1,499 | 46 (93.9%) | 4 (4.0%) |
| Total | 49 (100.0%) | 101 (100.0%) |
Health & Disability in Port Deposit
Health Insurance Coverage by Age in Port Deposit
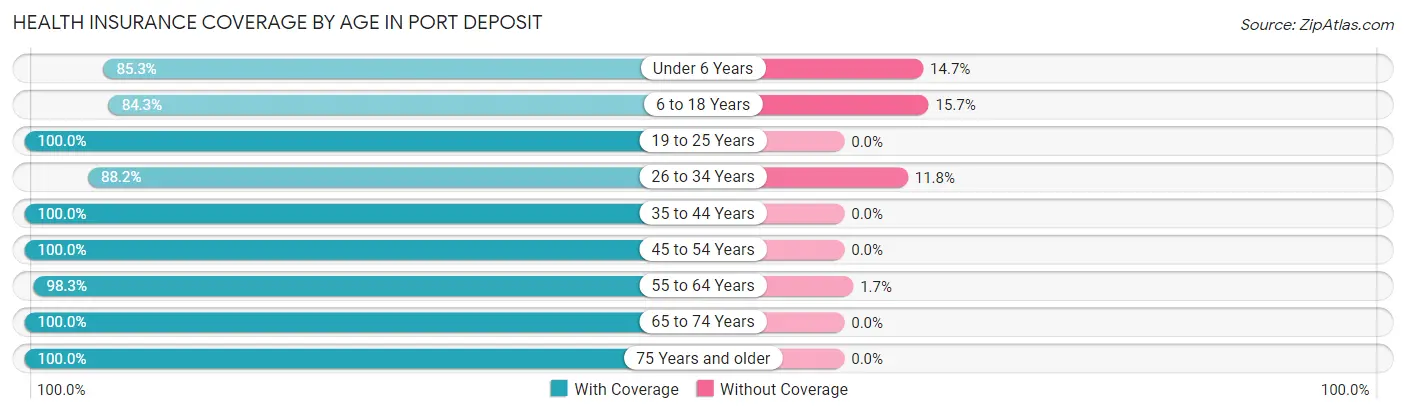
| Age Bracket | With Coverage | Without Coverage |
| Under 6 Years | 58 (85.3%) | 10 (14.7%) |
| 6 to 18 Years | 59 (84.3%) | 11 (15.7%) |
| 19 to 25 Years | 55 (100.0%) | 0 (0.0%) |
| 26 to 34 Years | 67 (88.2%) | 9 (11.8%) |
| 35 to 44 Years | 78 (100.0%) | 0 (0.0%) |
| 45 to 54 Years | 42 (100.0%) | 0 (0.0%) |
| 55 to 64 Years | 118 (98.3%) | 2 (1.7%) |
| 65 to 74 Years | 49 (100.0%) | 0 (0.0%) |
| 75 Years and older | 16 (100.0%) | 0 (0.0%) |
| Total | 542 (94.4%) | 32 (5.6%) |
Health Insurance Coverage by Citizenship Status in Port Deposit
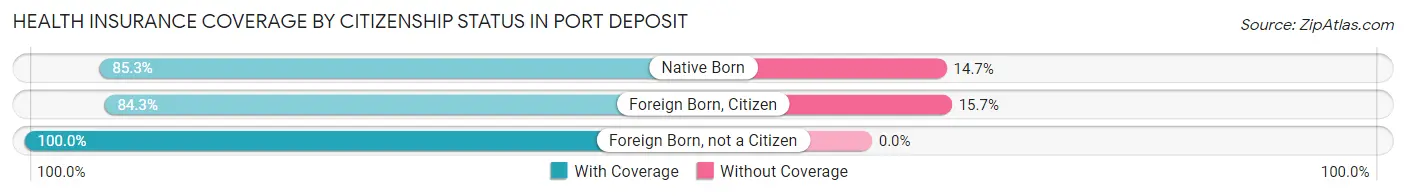
| Citizenship Status | With Coverage | Without Coverage |
| Native Born | 58 (85.3%) | 10 (14.7%) |
| Foreign Born, Citizen | 59 (84.3%) | 11 (15.7%) |
| Foreign Born, not a Citizen | 55 (100.0%) | 0 (0.0%) |
Health Insurance Coverage by Household Income in Port Deposit
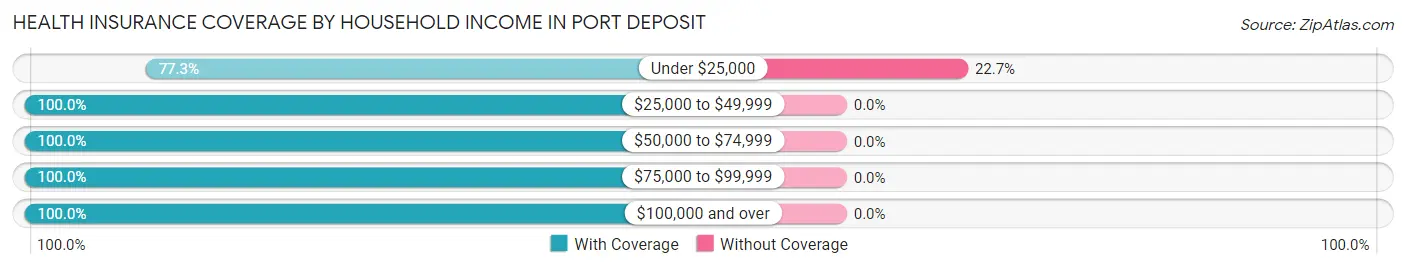
| Household Income | With Coverage | Without Coverage |
| Under $25,000 | 109 (77.3%) | 32 (22.7%) |
| $25,000 to $49,999 | 132 (100.0%) | 0 (0.0%) |
| $50,000 to $74,999 | 83 (100.0%) | 0 (0.0%) |
| $75,000 to $99,999 | 45 (100.0%) | 0 (0.0%) |
| $100,000 and over | 173 (100.0%) | 0 (0.0%) |
Public vs Private Health Insurance Coverage by Age in Port Deposit
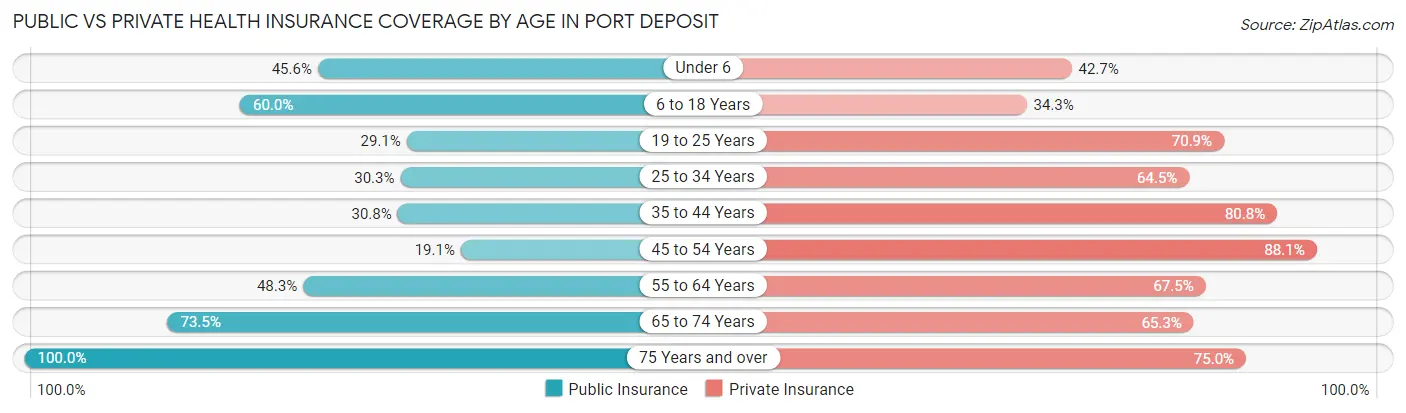
| Age Bracket | Public Insurance | Private Insurance |
| Under 6 | 31 (45.6%) | 29 (42.6%) |
| 6 to 18 Years | 42 (60.0%) | 24 (34.3%) |
| 19 to 25 Years | 16 (29.1%) | 39 (70.9%) |
| 25 to 34 Years | 23 (30.3%) | 49 (64.5%) |
| 35 to 44 Years | 24 (30.8%) | 63 (80.8%) |
| 45 to 54 Years | 8 (19.1%) | 37 (88.1%) |
| 55 to 64 Years | 58 (48.3%) | 81 (67.5%) |
| 65 to 74 Years | 36 (73.5%) | 32 (65.3%) |
| 75 Years and over | 16 (100.0%) | 12 (75.0%) |
| Total | 254 (44.3%) | 366 (63.8%) |
Disability Status by Sex by Age in Port Deposit
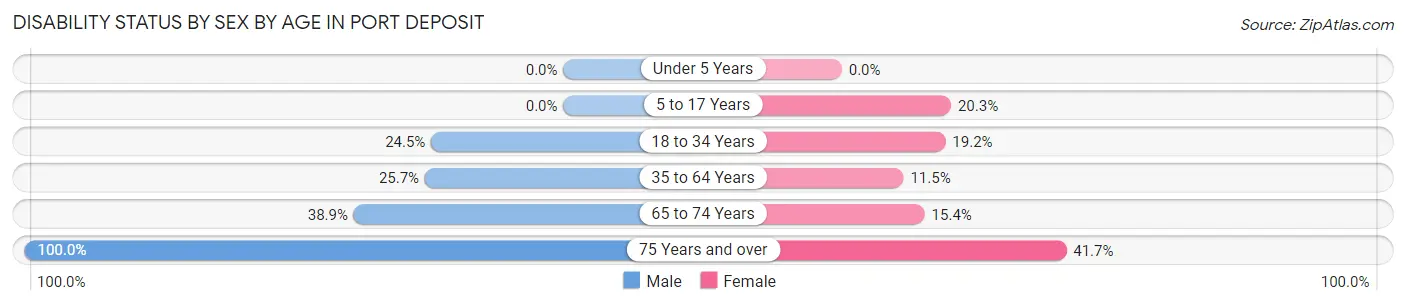
| Age Bracket | Male | Female |
| Under 5 Years | 0 (0.0%) | 0 (0.0%) |
| 5 to 17 Years | 0 (0.0%) | 15 (20.3%) |
| 18 to 34 Years | 13 (24.5%) | 15 (19.2%) |
| 35 to 64 Years | 28 (25.7%) | 15 (11.5%) |
| 65 to 74 Years | 14 (38.9%) | 2 (15.4%) |
| 75 Years and over | 4 (100.0%) | 5 (41.7%) |
Disability Class by Sex by Age in Port Deposit
Disability Class: Hearing Difficulty
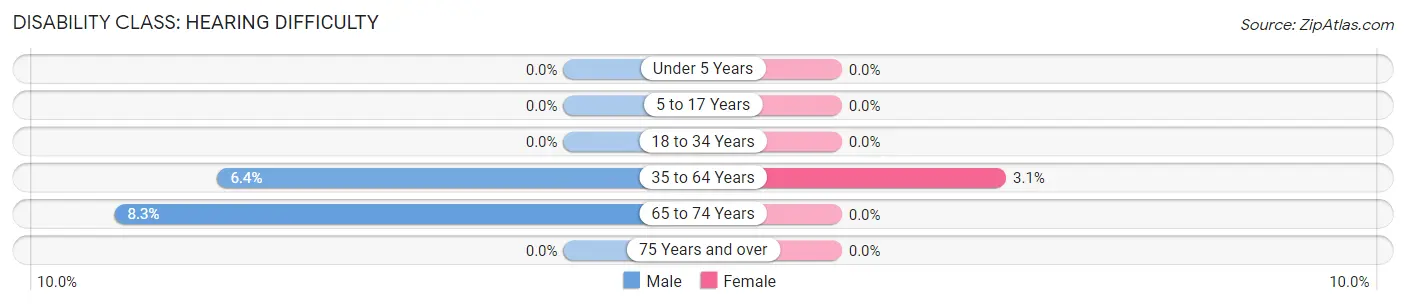
| Age Bracket | Male | Female |
| Under 5 Years | 0 (0.0%) | 0 (0.0%) |
| 5 to 17 Years | 0 (0.0%) | 0 (0.0%) |
| 18 to 34 Years | 0 (0.0%) | 0 (0.0%) |
| 35 to 64 Years | 7 (6.4%) | 4 (3.0%) |
| 65 to 74 Years | 3 (8.3%) | 0 (0.0%) |
| 75 Years and over | 0 (0.0%) | 0 (0.0%) |
Disability Class: Vision Difficulty
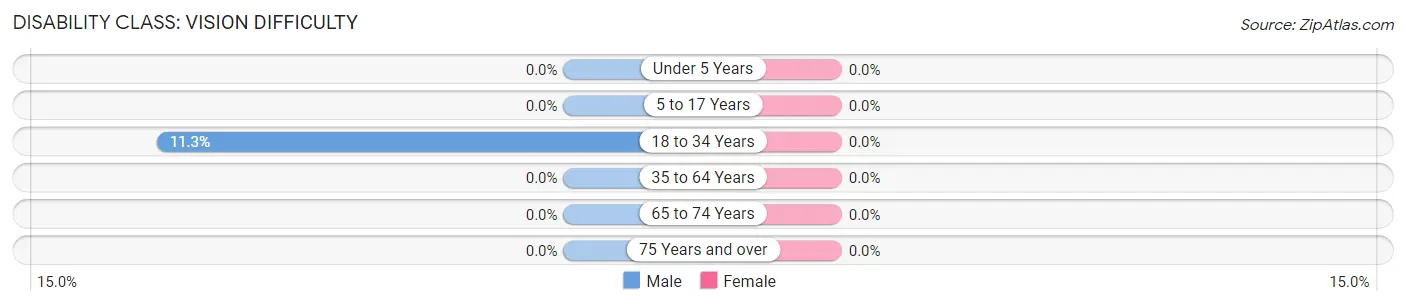
| Age Bracket | Male | Female |
| Under 5 Years | 0 (0.0%) | 0 (0.0%) |
| 5 to 17 Years | 0 (0.0%) | 0 (0.0%) |
| 18 to 34 Years | 6 (11.3%) | 0 (0.0%) |
| 35 to 64 Years | 0 (0.0%) | 0 (0.0%) |
| 65 to 74 Years | 0 (0.0%) | 0 (0.0%) |
| 75 Years and over | 0 (0.0%) | 0 (0.0%) |
Disability Class: Cognitive Difficulty
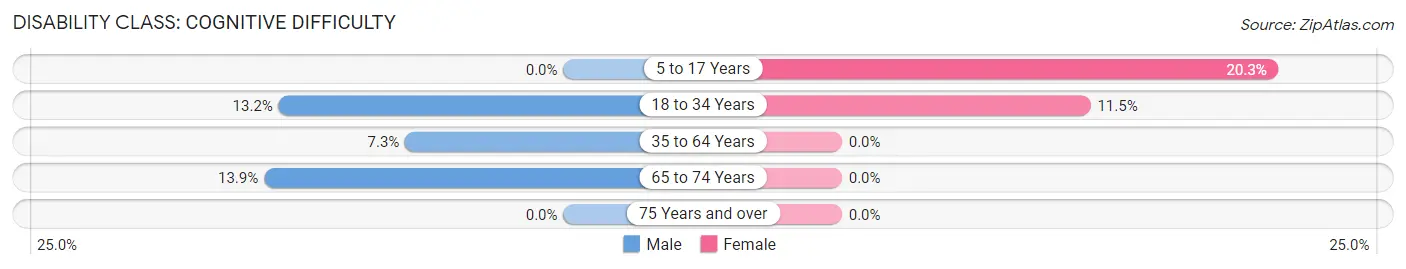
| Age Bracket | Male | Female |
| 5 to 17 Years | 0 (0.0%) | 15 (20.3%) |
| 18 to 34 Years | 7 (13.2%) | 9 (11.5%) |
| 35 to 64 Years | 8 (7.3%) | 0 (0.0%) |
| 65 to 74 Years | 5 (13.9%) | 0 (0.0%) |
| 75 Years and over | 0 (0.0%) | 0 (0.0%) |
Disability Class: Ambulatory Difficulty
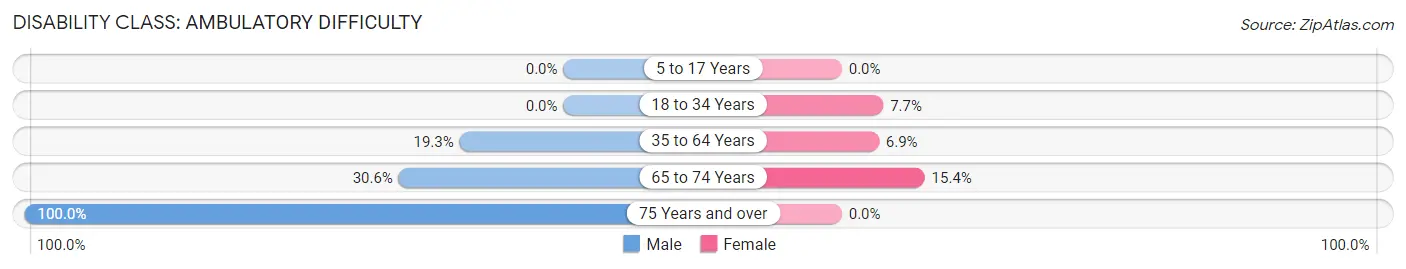
| Age Bracket | Male | Female |
| 5 to 17 Years | 0 (0.0%) | 0 (0.0%) |
| 18 to 34 Years | 0 (0.0%) | 6 (7.7%) |
| 35 to 64 Years | 21 (19.3%) | 9 (6.9%) |
| 65 to 74 Years | 11 (30.6%) | 2 (15.4%) |
| 75 Years and over | 4 (100.0%) | 0 (0.0%) |
Disability Class: Self-Care Difficulty
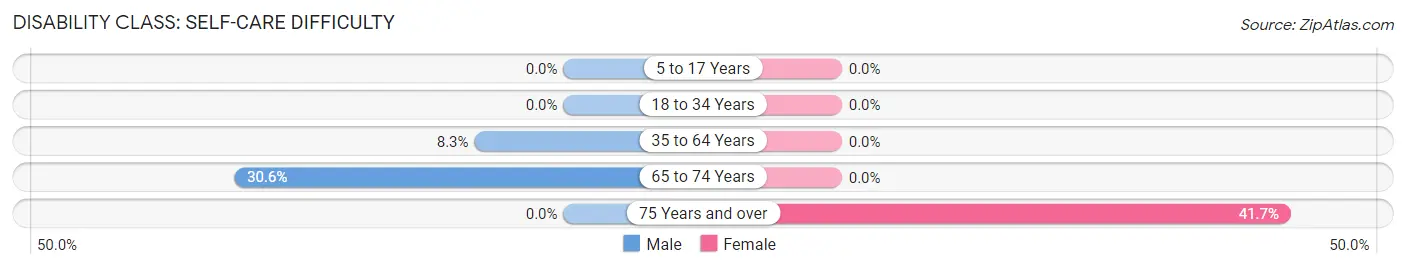
| Age Bracket | Male | Female |
| 5 to 17 Years | 0 (0.0%) | 0 (0.0%) |
| 18 to 34 Years | 0 (0.0%) | 0 (0.0%) |
| 35 to 64 Years | 9 (8.3%) | 0 (0.0%) |
| 65 to 74 Years | 11 (30.6%) | 0 (0.0%) |
| 75 Years and over | 0 (0.0%) | 5 (41.7%) |
Technology Access in Port Deposit
Computing Device Access in Port Deposit
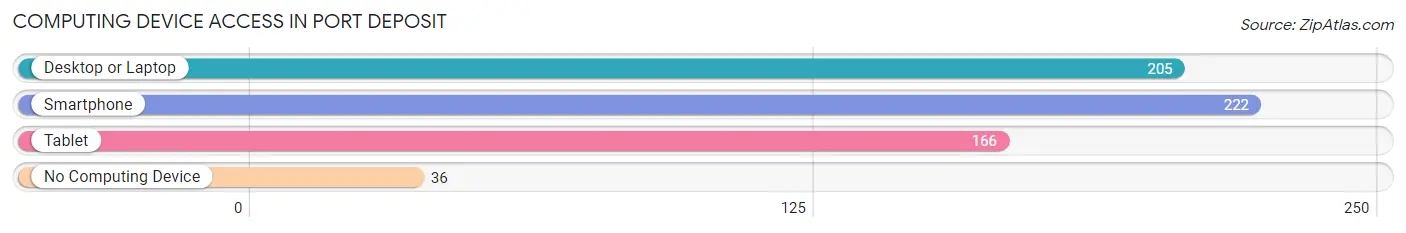
| Device Type | # Households | % Households |
| Desktop or Laptop | 205 | 71.9% |
| Smartphone | 222 | 77.9% |
| Tablet | 166 | 58.3% |
| No Computing Device | 36 | 12.6% |
| Total | 285 | 100.0% |
Internet Access in Port Deposit
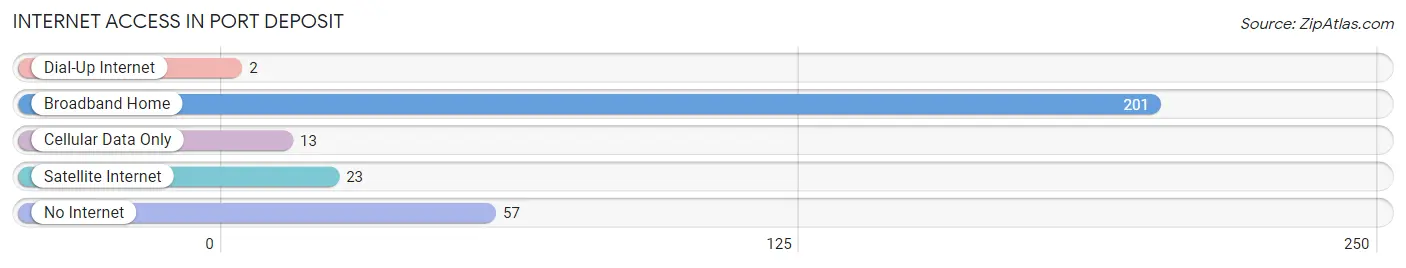
| Internet Type | # Households | % Households |
| Dial-Up Internet | 2 | 0.7% |
| Broadband Home | 201 | 70.5% |
| Cellular Data Only | 13 | 4.6% |
| Satellite Internet | 23 | 8.1% |
| No Internet | 57 | 20.0% |
| Total | 285 | 100.0% |
Port Deposit Summary
History
Port Deposit, Maryland is a small town located on the banks of the Susquehanna River in Cecil County. It was founded in 1706 by a group of Quakers from Pennsylvania and was originally known as Creswell’s Ferry. The town was renamed Port Deposit in 1732 after the British Royal Navy established a port there. The town was an important port for the shipping of tobacco, grain, and other goods to and from the Chesapeake Bay.
In the early 19th century, the town became a major center for the iron industry. The Susquehanna Iron Works was established in 1810 and the town became a major supplier of iron products to the Union Army during the Civil War. The iron industry declined after the war and the town’s economy shifted to tourism and recreation.
The town was incorporated in 1868 and the population grew to over 1,000 by the turn of the century. The town was a popular destination for tourists and vacationers, and the town’s economy was bolstered by the construction of a railroad line in the late 19th century.
The town’s economy suffered during the Great Depression and World War II, but the town’s population began to grow again in the 1950s. The town’s economy shifted to manufacturing and light industry in the 1960s and 1970s, and the town’s population grew to over 2,000 by the 1980s.
Geography
Port Deposit is located in Cecil County, Maryland, on the east bank of the Susquehanna River. The town is situated at the mouth of the Susquehanna River, where it meets the Chesapeake Bay. The town is located approximately 40 miles northeast of Baltimore and 60 miles southwest of Philadelphia.
The town is situated on a peninsula, with the Susquehanna River to the west and the Chesapeake Bay to the east. The town is surrounded by rolling hills and forests, and is home to several parks and recreational areas.
Economy
The economy of Port Deposit is largely based on manufacturing and light industry. The town is home to several manufacturing plants, including a paper mill, a plastics plant, and a metal fabrication plant. The town is also home to several small businesses, including restaurants, retail stores, and service providers.
The town’s economy is also bolstered by tourism and recreation. The town is home to several parks and recreational areas, including the Susquehanna State Park and the Susquehanna River Trail. The town is also home to several marinas and boat launches, making it a popular destination for boaters and fishermen.
Demographics
As of the 2010 census, the population of Port Deposit was 2,521. The population is largely white (90.2%), with small percentages of African American (4.2%), Hispanic (2.2%), and Asian (1.2%) residents. The median household income is $45,938, and the median home value is $164,400. The town has a poverty rate of 11.2%.
The town is served by the Cecil County Public Schools system. The town is home to one elementary school, one middle school, and one high school. The town is also home to several private schools, including a Catholic school and a Christian school.
Common Questions
What is Per Capita Income in Port Deposit?
Per Capita income in Port Deposit is $37,227.
What is the Median Family Income in Port Deposit?
Median Family Income in Port Deposit is $70,208.
What is the Median Household income in Port Deposit?
Median Household Income in Port Deposit is $46,979.
What is Income or Wage Gap in Port Deposit?
Income or Wage Gap in Port Deposit is 29.4%.
Women in Port Deposit earn 70.6 cents for every dollar earned by a man.
What is Inequality or Gini Index in Port Deposit?
Inequality or Gini Index in Port Deposit is 0.54.
What is the Total Population of Port Deposit?
Total Population of Port Deposit is 587.
What is the Total Male Population of Port Deposit?
Total Male Population of Port Deposit is 253.
What is the Total Female Population of Port Deposit?
Total Female Population of Port Deposit is 334.
What is the Ratio of Males per 100 Females in Port Deposit?
There are 75.75 Males per 100 Females in Port Deposit.
What is the Ratio of Females per 100 Males in Port Deposit?
There are 132.02 Females per 100 Males in Port Deposit.
What is the Median Population Age in Port Deposit?
Median Population Age in Port Deposit is 38.1 Years.
What is the Average Family Size in Port Deposit
Average Family Size in Port Deposit is 3.1 People.
What is the Average Household Size in Port Deposit
Average Household Size in Port Deposit is 2.0 People.
How Large is the Labor Force in Port Deposit?
There are 294 People in the Labor Forcein in Port Deposit.
What is the Percentage of People in the Labor Force in Port Deposit?
64.6% of People are in the Labor Force in Port Deposit.