Sudlersville, MD Map & Demographics
Sudlersville Map
Sudlersville Overview
$24,288
PER CAPITA INCOME
$64,167
AVG FAMILY INCOME
$40,000
AVG HOUSEHOLD INCOME
3.2%
WAGE / INCOME GAP [ % ]
96.8¢/ $1
WAGE / INCOME GAP [ $ ]
0.43
INEQUALITY / GINI INDEX
379
TOTAL POPULATION
154
MALE POPULATION
225
FEMALE POPULATION
68.44
MALES / 100 FEMALES
146.10
FEMALES / 100 MALES
44.4
MEDIAN AGE
3.4
AVG FAMILY SIZE
2.2
AVG HOUSEHOLD SIZE
177
LABOR FORCE [ PEOPLE ]
59.4%
PERCENT IN LABOR FORCE
5.1%
UNEMPLOYMENT RATE
Sudlersville Zip Codes
Sudlersville Area Codes
Income in Sudlersville
Income Overview in Sudlersville
Per Capita Income in Sudlersville is $24,288, while median incomes of families and households are $64,167 and $40,000 respectively.
| Characteristic | Number | Measure |
| Per Capita Income | 379 | $24,288 |
| Median Family Income | 82 | $64,167 |
| Mean Family Income | 82 | $70,816 |
| Median Household Income | 166 | $40,000 |
| Mean Household Income | 166 | $53,289 |
| Income Deficit | 82 | $0 |
| Wage / Income Gap (%) | 379 | 3.23% |
| Wage / Income Gap ($) | 379 | 96.77¢ per $1 |
| Gini / Inequality Index | 379 | 0.43 |
Earnings by Sex in Sudlersville
Average Earnings in Sudlersville are $28,500, $28,125 for men and $29,063 for women, a difference of 3.2%.
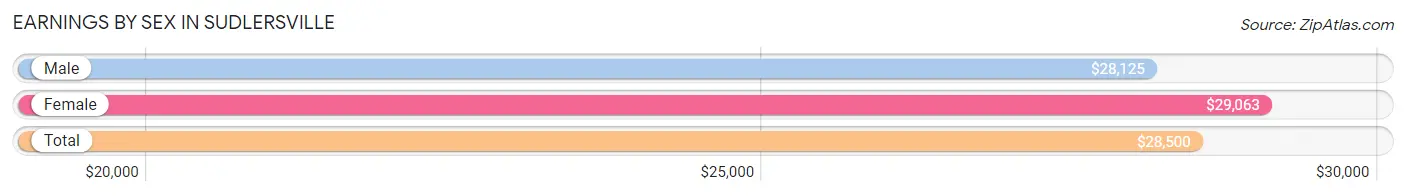
| Sex | Number | Average Earnings |
| Male | 71 (39.0%) | $28,125 |
| Female | 111 (61.0%) | $29,063 |
| Total | 182 (100.0%) | $28,500 |
Earnings by Sex by Income Bracket in Sudlersville
The most common earnings brackets in Sudlersville are $20,000 to $22,499 for men (27 | 38.0%) and $2,500 to $4,999 for women (18 | 16.2%).
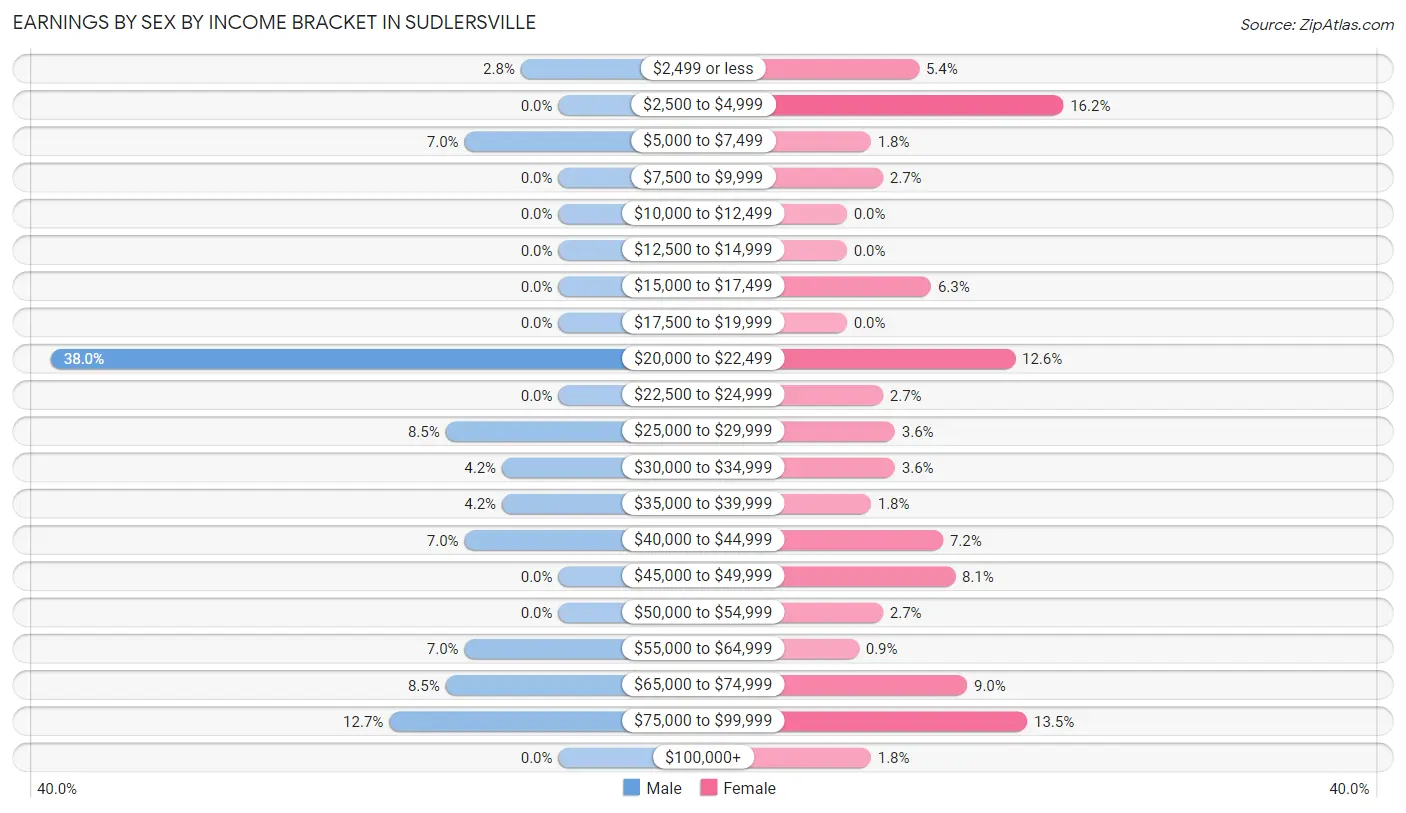
| Income | Male | Female |
| $2,499 or less | 2 (2.8%) | 6 (5.4%) |
| $2,500 to $4,999 | 0 (0.0%) | 18 (16.2%) |
| $5,000 to $7,499 | 5 (7.0%) | 2 (1.8%) |
| $7,500 to $9,999 | 0 (0.0%) | 3 (2.7%) |
| $10,000 to $12,499 | 0 (0.0%) | 0 (0.0%) |
| $12,500 to $14,999 | 0 (0.0%) | 0 (0.0%) |
| $15,000 to $17,499 | 0 (0.0%) | 7 (6.3%) |
| $17,500 to $19,999 | 0 (0.0%) | 0 (0.0%) |
| $20,000 to $22,499 | 27 (38.0%) | 14 (12.6%) |
| $22,500 to $24,999 | 0 (0.0%) | 3 (2.7%) |
| $25,000 to $29,999 | 6 (8.5%) | 4 (3.6%) |
| $30,000 to $34,999 | 3 (4.2%) | 4 (3.6%) |
| $35,000 to $39,999 | 3 (4.2%) | 2 (1.8%) |
| $40,000 to $44,999 | 5 (7.0%) | 8 (7.2%) |
| $45,000 to $49,999 | 0 (0.0%) | 9 (8.1%) |
| $50,000 to $54,999 | 0 (0.0%) | 3 (2.7%) |
| $55,000 to $64,999 | 5 (7.0%) | 1 (0.9%) |
| $65,000 to $74,999 | 6 (8.5%) | 10 (9.0%) |
| $75,000 to $99,999 | 9 (12.7%) | 15 (13.5%) |
| $100,000+ | 0 (0.0%) | 2 (1.8%) |
| Total | 71 (100.0%) | 111 (100.0%) |
Earnings by Sex by Educational Attainment in Sudlersville
Average earnings in Sudlersville are $29,583 for men and $35,000 for women, a difference of 15.5%. Men with an educational attainment of college or associate's degree enjoy the highest average annual earnings of $65,833, while those with college or associate's degree education earn the least with $65,833. Women with an educational attainment of graduate degree earn the most with the average annual earnings of $71,429, while those with college or associate's degree education have the smallest earnings of $45,972.
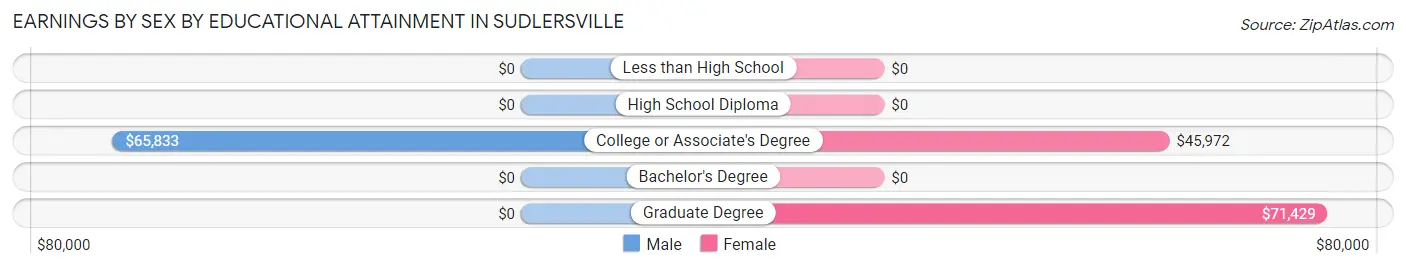
| Educational Attainment | Male Income | Female Income |
| Less than High School | - | - |
| High School Diploma | - | - |
| College or Associate's Degree | $65,833 | $45,972 |
| Bachelor's Degree | - | - |
| Graduate Degree | - | - |
| Total | $29,583 | $35,000 |
Family Income in Sudlersville
Family Income Brackets in Sudlersville
According to the Sudlersville family income data, there are 21 families falling into the $15,000 to $24,999 income range, which is the most common income bracket and makes up 25.6% of all families.
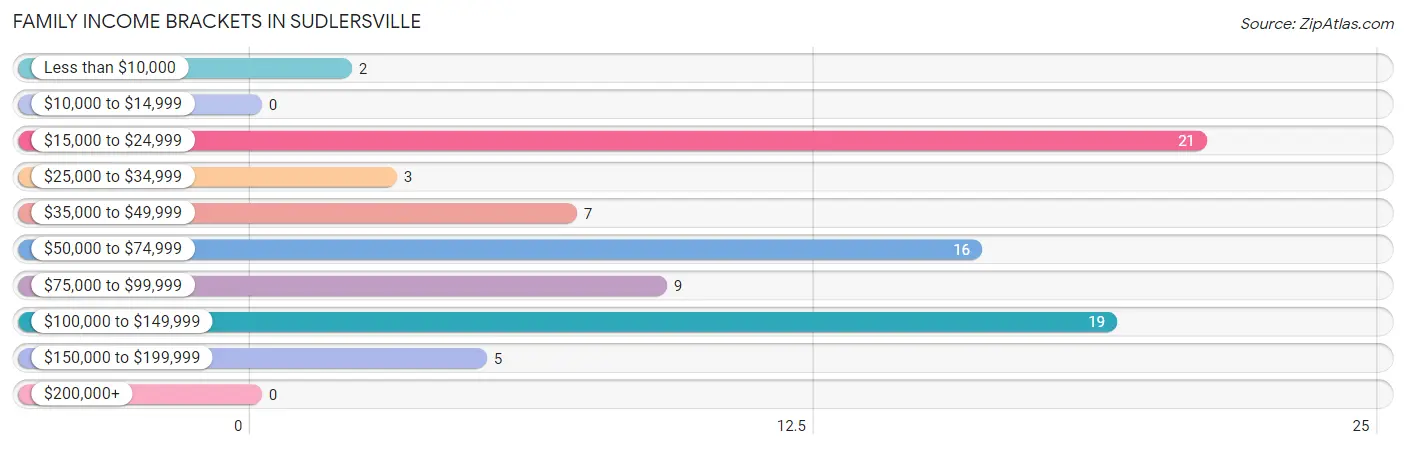
| Income Bracket | # Families | % Families |
| Less than $10,000 | 2 | 2.4% |
| $10,000 to $14,999 | 0 | 0.0% |
| $15,000 to $24,999 | 21 | 25.6% |
| $25,000 to $34,999 | 3 | 3.7% |
| $35,000 to $49,999 | 7 | 8.5% |
| $50,000 to $74,999 | 16 | 19.5% |
| $75,000 to $99,999 | 9 | 11.0% |
| $100,000 to $149,999 | 19 | 23.2% |
| $150,000 to $199,999 | 5 | 6.1% |
| $200,000+ | 0 | 0.0% |
Family Income by Famaliy Size in Sudlersville
4-person families (14 | 17.1%) account for the highest median family income in Sudlersville with $129,167 per family, while 4-person families (14 | 17.1%) have the highest median income of $32,292 per family member.
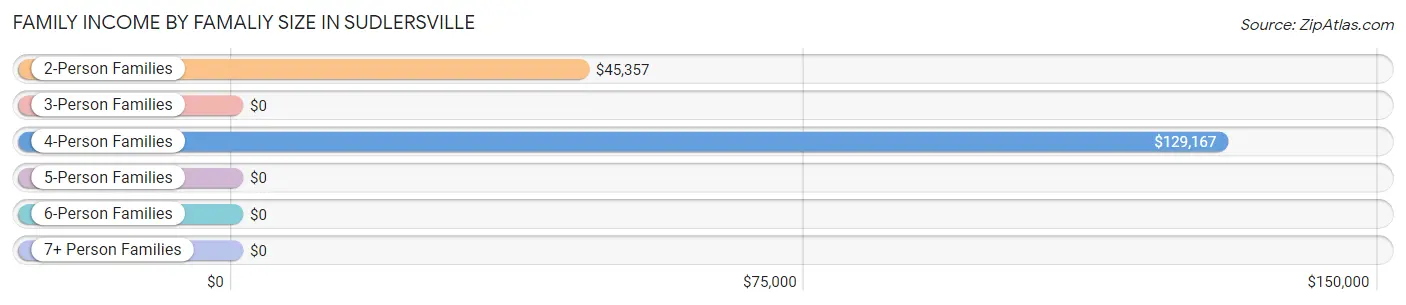
| Income Bracket | # Families | Median Income |
| 2-Person Families | 26 (31.7%) | $45,357 |
| 3-Person Families | 21 (25.6%) | $0 |
| 4-Person Families | 14 (17.1%) | $129,167 |
| 5-Person Families | 21 (25.6%) | $0 |
| 6-Person Families | 0 (0.0%) | $0 |
| 7+ Person Families | 0 (0.0%) | $0 |
| Total | 82 (100.0%) | $64,167 |
Family Income by Number of Earners in Sudlersville
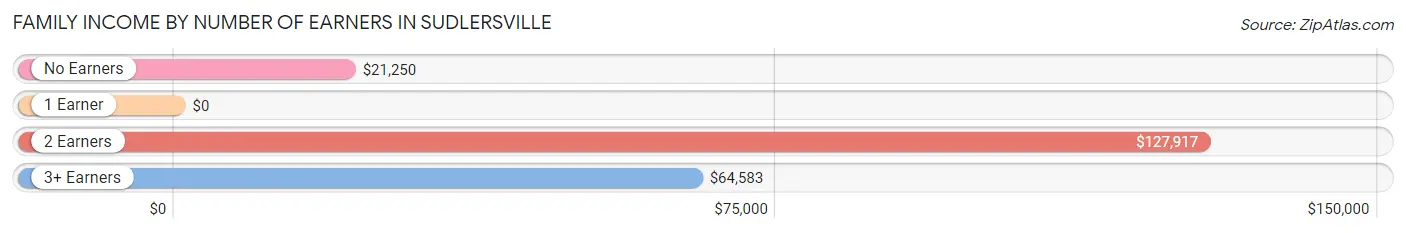
| Number of Earners | # Families | Median Income |
| No Earners | 11 (13.4%) | $21,250 |
| 1 Earner | 26 (31.7%) | $0 |
| 2 Earners | 30 (36.6%) | $127,917 |
| 3+ Earners | 15 (18.3%) | $64,583 |
| Total | 82 (100.0%) | $64,167 |
Household Income in Sudlersville
Household Income Brackets in Sudlersville
With 50 households falling in the category, the $15,000 to $24,999 income range is the most frequent in Sudlersville, accounting for 30.1% of all households. In contrast, only 2 households (1.2%) fall into the $200,000+ income bracket, making it the least populous group.
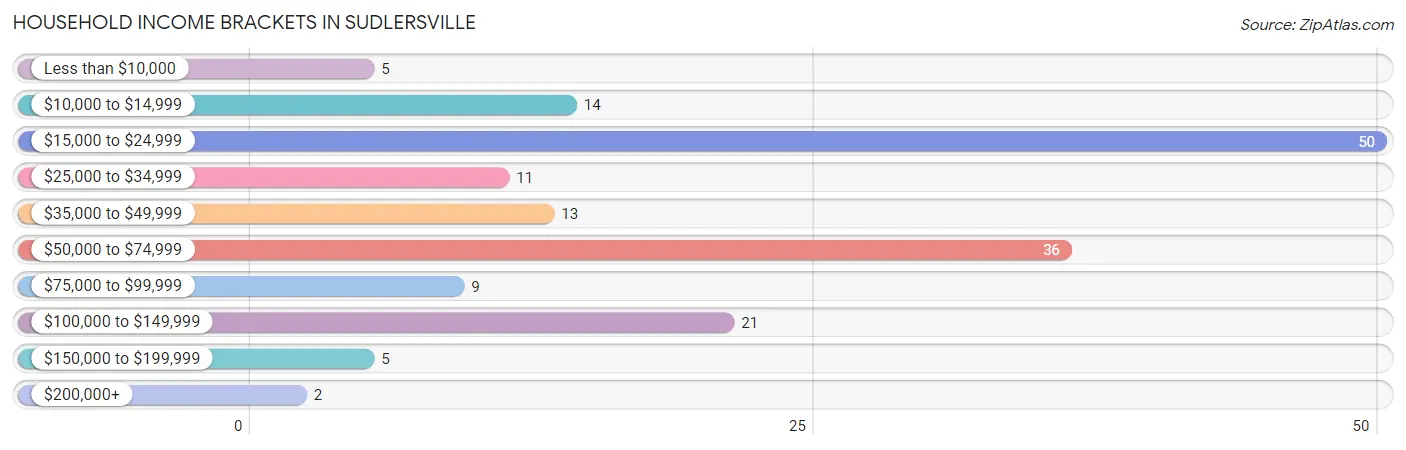
| Income Bracket | # Households | % Households |
| Less than $10,000 | 5 | 3.0% |
| $10,000 to $14,999 | 14 | 8.4% |
| $15,000 to $24,999 | 50 | 30.1% |
| $25,000 to $34,999 | 11 | 6.6% |
| $35,000 to $49,999 | 13 | 7.8% |
| $50,000 to $74,999 | 36 | 21.7% |
| $75,000 to $99,999 | 9 | 5.4% |
| $100,000 to $149,999 | 21 | 12.7% |
| $150,000 to $199,999 | 5 | 3.0% |
| $200,000+ | 2 | 1.2% |
Household Income by Householder Age in Sudlersville
The median household income in Sudlersville is $40,000, with the highest median household income of $71,250 found in the 45 to 64 years age bracket for the primary householder. A total of 28 households (16.9%) fall into this category.
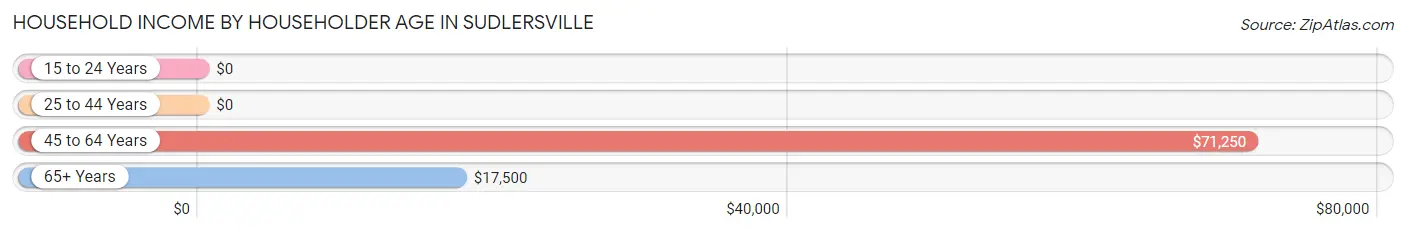
| Income Bracket | # Households | Median Income |
| 15 to 24 Years | 0 (0.0%) | $0 |
| 25 to 44 Years | 52 (31.3%) | $0 |
| 45 to 64 Years | 28 (16.9%) | $71,250 |
| 65+ Years | 86 (51.8%) | $17,500 |
| Total | 166 (100.0%) | $40,000 |
Poverty in Sudlersville
Income Below Poverty by Sex and Age in Sudlersville
With 21.4% poverty level for males and 21.8% for females among the residents of Sudlersville, 6 to 11 year old males and 65 to 74 year old females are the most vulnerable to poverty, with 16 males (84.2%) and 9 females (56.2%) in their respective age groups living below the poverty level.
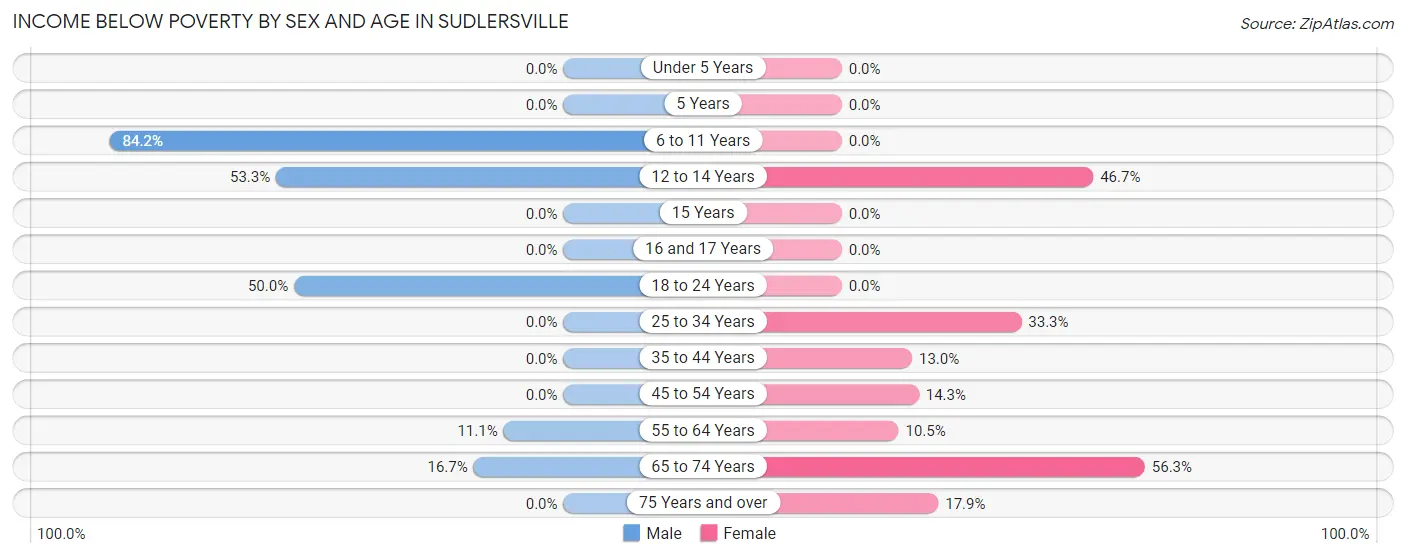
| Age Bracket | Male | Female |
| Under 5 Years | 0 (0.0%) | 0 (0.0%) |
| 5 Years | 0 (0.0%) | 0 (0.0%) |
| 6 to 11 Years | 16 (84.2%) | 0 (0.0%) |
| 12 to 14 Years | 8 (53.3%) | 7 (46.7%) |
| 15 Years | 0 (0.0%) | 0 (0.0%) |
| 16 and 17 Years | 0 (0.0%) | 0 (0.0%) |
| 18 to 24 Years | 5 (50.0%) | 0 (0.0%) |
| 25 to 34 Years | 0 (0.0%) | 14 (33.3%) |
| 35 to 44 Years | 0 (0.0%) | 3 (13.0%) |
| 45 to 54 Years | 0 (0.0%) | 2 (14.3%) |
| 55 to 64 Years | 2 (11.1%) | 2 (10.5%) |
| 65 to 74 Years | 2 (16.7%) | 9 (56.2%) |
| 75 Years and over | 0 (0.0%) | 12 (17.9%) |
| Total | 33 (21.4%) | 49 (21.8%) |
Income Above Poverty by Sex and Age in Sudlersville
According to the poverty statistics in Sudlersville, males aged under 5 years and females aged under 5 years are the age groups that are most secure financially, with 100.0% of males and 100.0% of females in these age groups living above the poverty line.
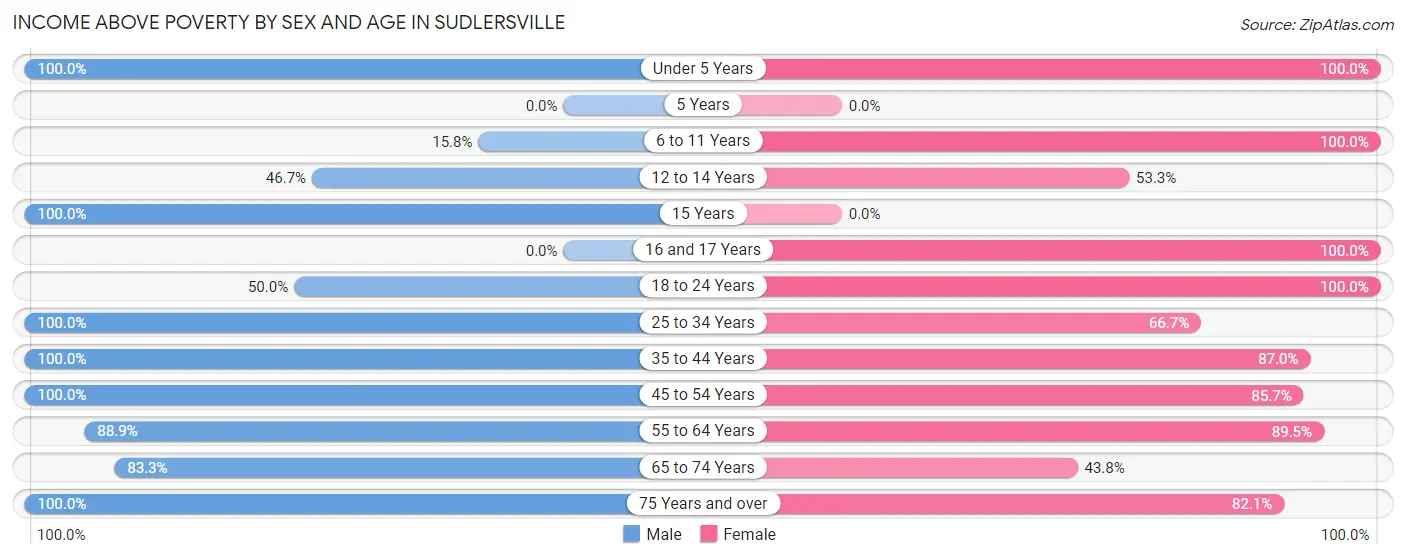
| Age Bracket | Male | Female |
| Under 5 Years | 11 (100.0%) | 9 (100.0%) |
| 5 Years | 0 (0.0%) | 0 (0.0%) |
| 6 to 11 Years | 3 (15.8%) | 8 (100.0%) |
| 12 to 14 Years | 7 (46.7%) | 8 (53.3%) |
| 15 Years | 4 (100.0%) | 0 (0.0%) |
| 16 and 17 Years | 0 (0.0%) | 1 (100.0%) |
| 18 to 24 Years | 5 (50.0%) | 11 (100.0%) |
| 25 to 34 Years | 9 (100.0%) | 28 (66.7%) |
| 35 to 44 Years | 20 (100.0%) | 20 (87.0%) |
| 45 to 54 Years | 20 (100.0%) | 12 (85.7%) |
| 55 to 64 Years | 16 (88.9%) | 17 (89.5%) |
| 65 to 74 Years | 10 (83.3%) | 7 (43.8%) |
| 75 Years and over | 16 (100.0%) | 55 (82.1%) |
| Total | 121 (78.6%) | 176 (78.2%) |
Income Below Poverty Among Married-Couple Families in Sudlersville
The poverty statistics for married-couple families in Sudlersville show that 4.4% or 2 of the total 45 families live below the poverty line. Families with no children have the highest poverty rate of 8.7%, comprising of 2 families. On the other hand, families with 1 or 2 children have the lowest poverty rate of 0.0%, which includes 0 families.
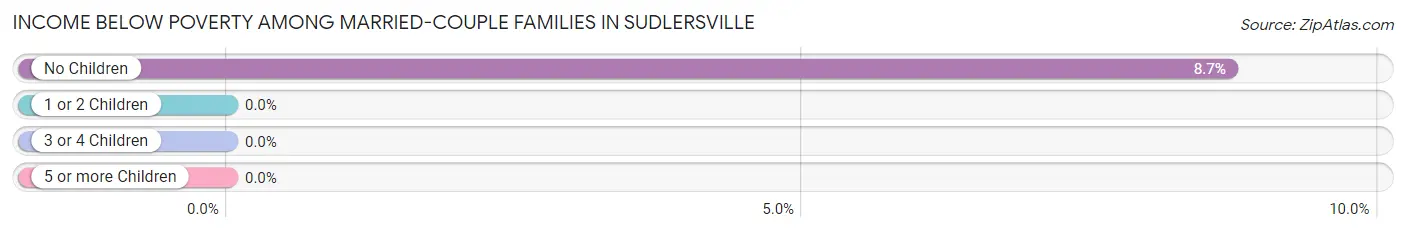
| Children | Above Poverty | Below Poverty |
| No Children | 21 (91.3%) | 2 (8.7%) |
| 1 or 2 Children | 22 (100.0%) | 0 (0.0%) |
| 3 or 4 Children | 0 (0.0%) | 0 (0.0%) |
| 5 or more Children | 0 (0.0%) | 0 (0.0%) |
| Total | 43 (95.6%) | 2 (4.4%) |
Income Below Poverty Among Single-Parent Households in Sudlersville
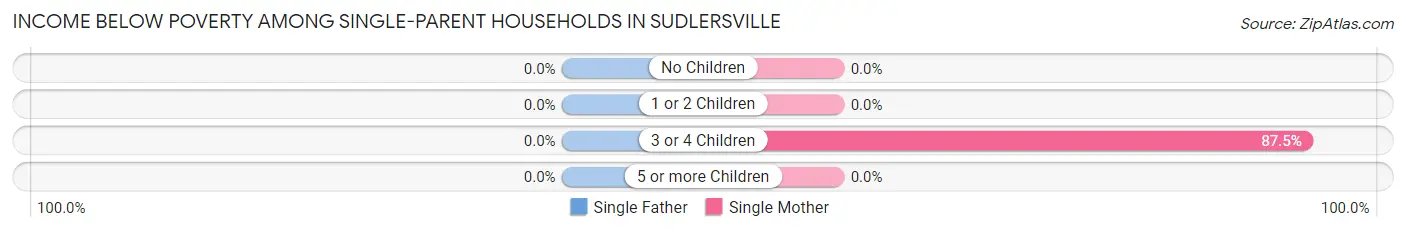
| Children | Single Father | Single Mother |
| No Children | 0 (0.0%) | 0 (0.0%) |
| 1 or 2 Children | 0 (0.0%) | 0 (0.0%) |
| 3 or 4 Children | 0 (0.0%) | 14 (87.5%) |
| 5 or more Children | 0 (0.0%) | 0 (0.0%) |
| Total | 0 (0.0%) | 14 (37.8%) |
Income Below Poverty Among Married-Couple vs Single-Parent Households in Sudlersville
The poverty data for Sudlersville shows that 2 of the married-couple family households (4.4%) and 14 of the single-parent households (37.8%) are living below the poverty level. Within the married-couple family households, those with no children have the highest poverty rate, with 2 households (8.7%) falling below the poverty line. Among the single-parent households, those with 3 or 4 children have the highest poverty rate, with 14 household (87.5%) living below poverty.
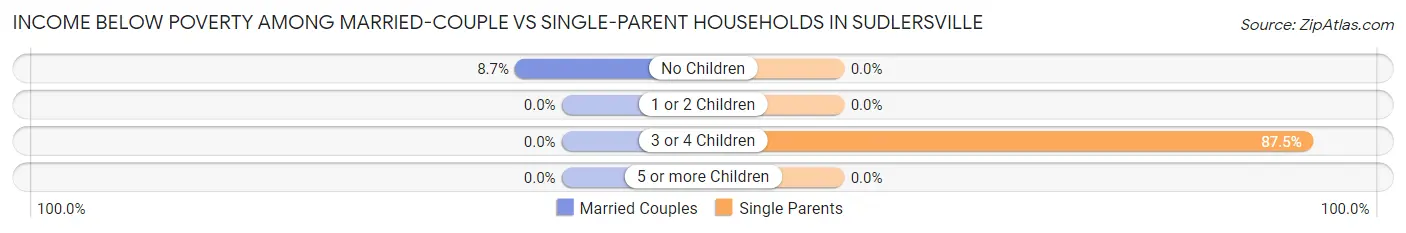
| Children | Married-Couple Families | Single-Parent Households |
| No Children | 2 (8.7%) | 0 (0.0%) |
| 1 or 2 Children | 0 (0.0%) | 0 (0.0%) |
| 3 or 4 Children | 0 (0.0%) | 14 (87.5%) |
| 5 or more Children | 0 (0.0%) | 0 (0.0%) |
| Total | 2 (4.4%) | 14 (37.8%) |
Race in Sudlersville
The most populous races in Sudlersville are White / Caucasian (299 | 78.9%), Some other Race (55 | 14.5%), and Hispanic or Latino (45 | 11.9%).
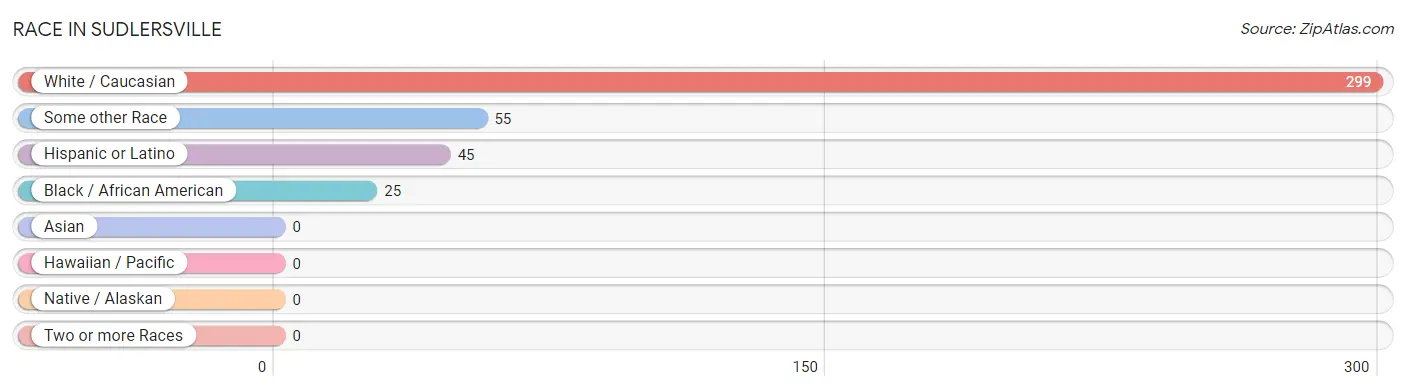
| Race | # Population | % Population |
| Asian | 0 | 0.0% |
| Black / African American | 25 | 6.6% |
| Hawaiian / Pacific | 0 | 0.0% |
| Hispanic or Latino | 45 | 11.9% |
| Native / Alaskan | 0 | 0.0% |
| White / Caucasian | 299 | 78.9% |
| Two or more Races | 0 | 0.0% |
| Some other Race | 55 | 14.5% |
| Total | 379 | 100.0% |
Ancestry in Sudlersville
The most populous ancestries reported in Sudlersville are German (50 | 13.2%), Central American (45 | 11.9%), Guatemalan (45 | 11.9%), English (39 | 10.3%), and American (28 | 7.4%), together accounting for 54.6% of all Sudlersville residents.
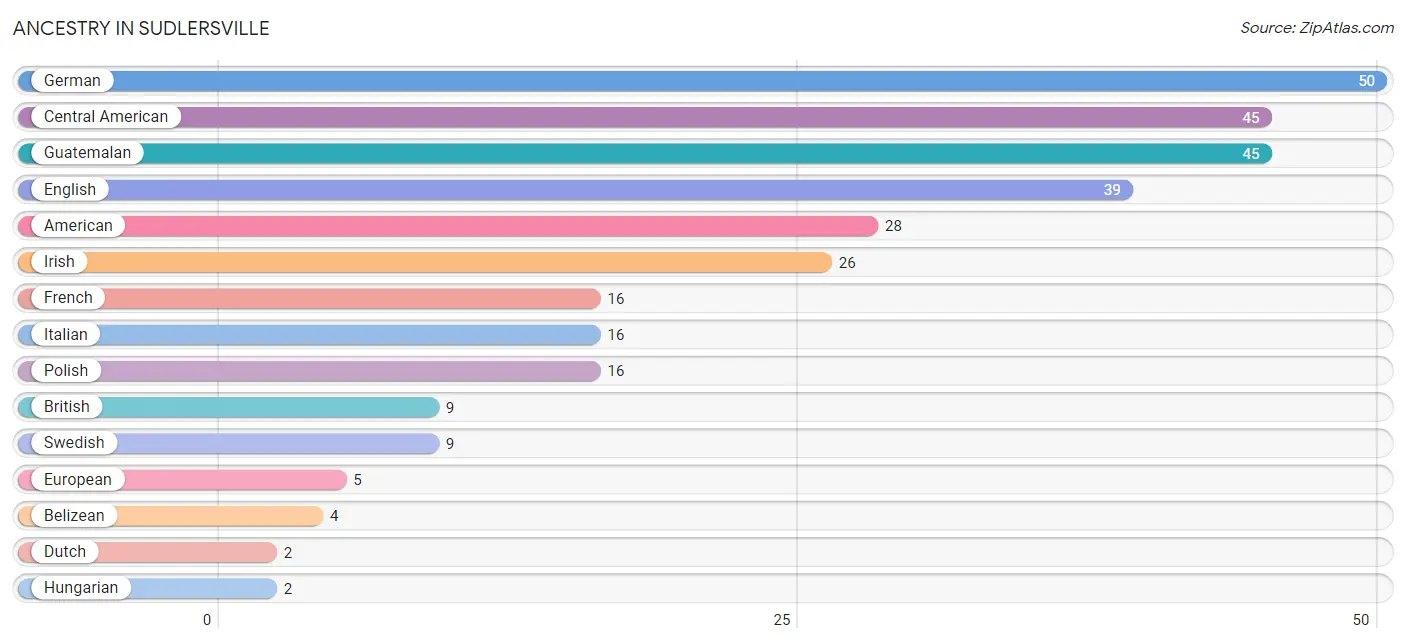
| Ancestry | # Population | % Population |
| American | 28 | 7.4% |
| Belizean | 4 | 1.1% |
| British | 9 | 2.4% |
| Central American | 45 | 11.9% |
| Dutch | 2 | 0.5% |
| English | 39 | 10.3% |
| European | 5 | 1.3% |
| French | 16 | 4.2% |
| German | 50 | 13.2% |
| Guatemalan | 45 | 11.9% |
| Hungarian | 2 | 0.5% |
| Irish | 26 | 6.9% |
| Italian | 16 | 4.2% |
| Polish | 16 | 4.2% |
| Swedish | 9 | 2.4% |
| Welsh | 2 | 0.5% | View All 16 Rows |
Immigrants in Sudlersville
The most numerous immigrant groups reported in Sudlersville came from Central America (18 | 4.8%), Latin America (18 | 4.8%), Guatemala (14 | 3.7%), and Belize (4 | 1.1%), together accounting for 14.3% of all Sudlersville residents.
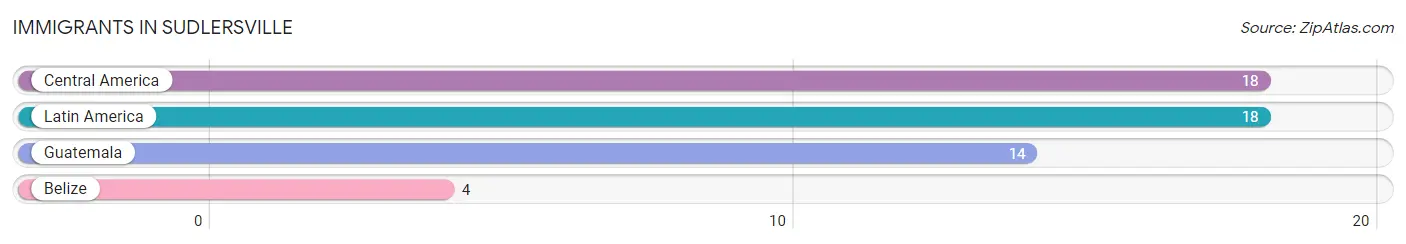
| Immigration Origin | # Population | % Population |
| Belize | 4 | 1.1% |
| Central America | 18 | 4.8% |
| Guatemala | 14 | 3.7% |
| Latin America | 18 | 4.8% | View All 4 Rows |
Sex and Age in Sudlersville
Sex and Age in Sudlersville
The most populous age groups in Sudlersville are 5 to 9 Years (19 | 12.3%) for men and 75 to 79 Years (51 | 22.7%) for women.
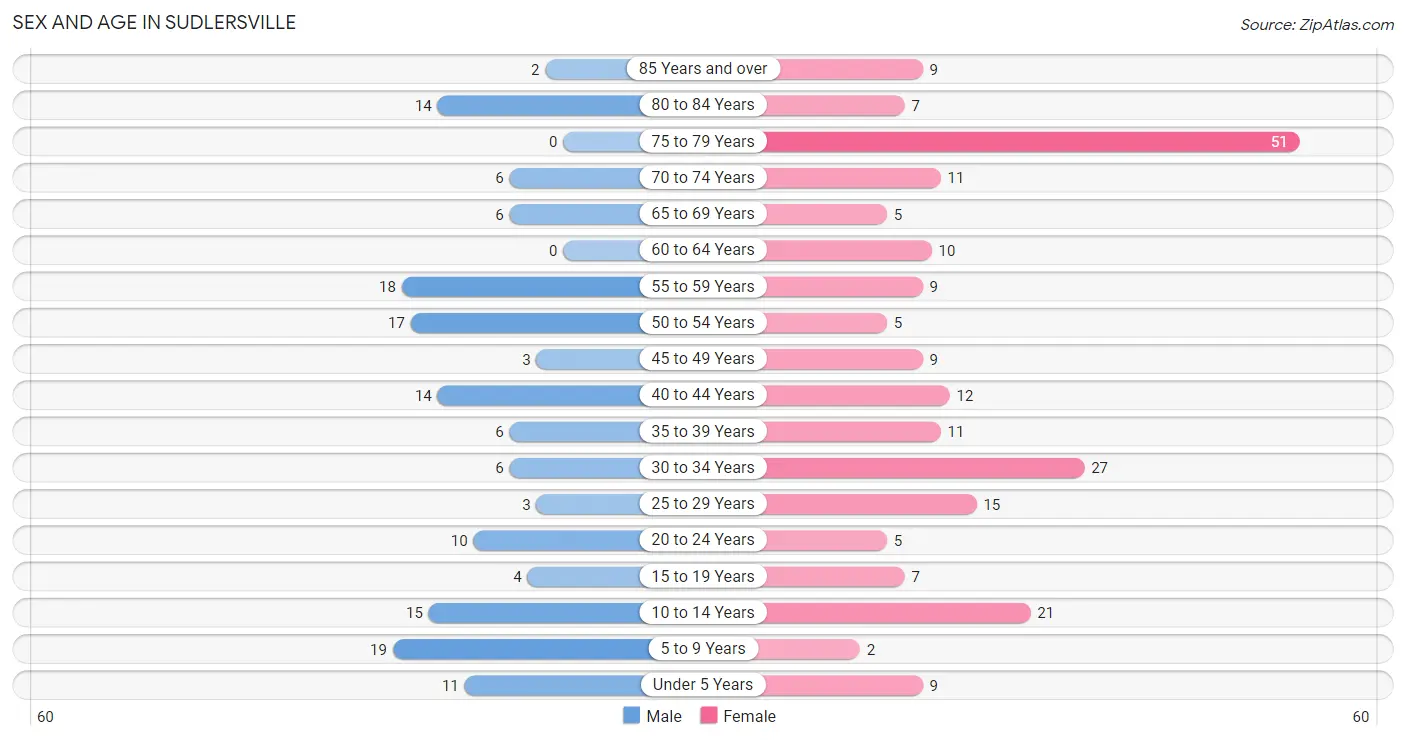
| Age Bracket | Male | Female |
| Under 5 Years | 11 (7.1%) | 9 (4.0%) |
| 5 to 9 Years | 19 (12.3%) | 2 (0.9%) |
| 10 to 14 Years | 15 (9.7%) | 21 (9.3%) |
| 15 to 19 Years | 4 (2.6%) | 7 (3.1%) |
| 20 to 24 Years | 10 (6.5%) | 5 (2.2%) |
| 25 to 29 Years | 3 (1.9%) | 15 (6.7%) |
| 30 to 34 Years | 6 (3.9%) | 27 (12.0%) |
| 35 to 39 Years | 6 (3.9%) | 11 (4.9%) |
| 40 to 44 Years | 14 (9.1%) | 12 (5.3%) |
| 45 to 49 Years | 3 (1.9%) | 9 (4.0%) |
| 50 to 54 Years | 17 (11.0%) | 5 (2.2%) |
| 55 to 59 Years | 18 (11.7%) | 9 (4.0%) |
| 60 to 64 Years | 0 (0.0%) | 10 (4.4%) |
| 65 to 69 Years | 6 (3.9%) | 5 (2.2%) |
| 70 to 74 Years | 6 (3.9%) | 11 (4.9%) |
| 75 to 79 Years | 0 (0.0%) | 51 (22.7%) |
| 80 to 84 Years | 14 (9.1%) | 7 (3.1%) |
| 85 Years and over | 2 (1.3%) | 9 (4.0%) |
| Total | 154 (100.0%) | 225 (100.0%) |
Families and Households in Sudlersville
Median Family Size in Sudlersville
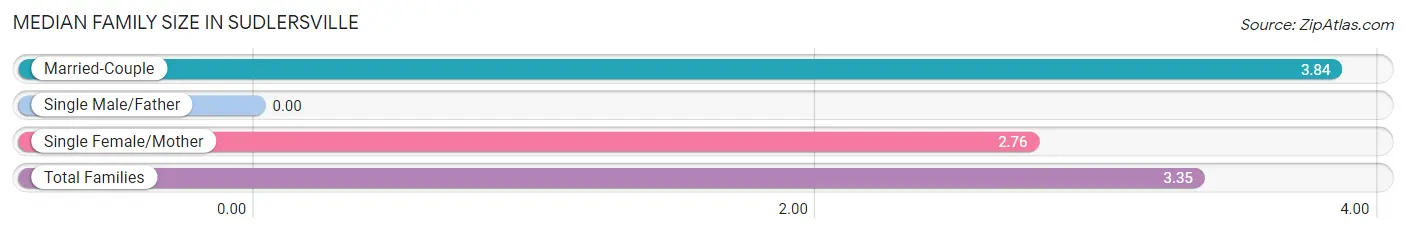
| Family Type | # Families | Family Size |
| Married-Couple | 45 (54.9%) | 3.84 |
| Single Male/Father | 0 (0.0%) | - |
| Single Female/Mother | 37 (45.1%) | 2.76 |
| Total Families | 82 (100.0%) | 3.35 |
Median Household Size in Sudlersville
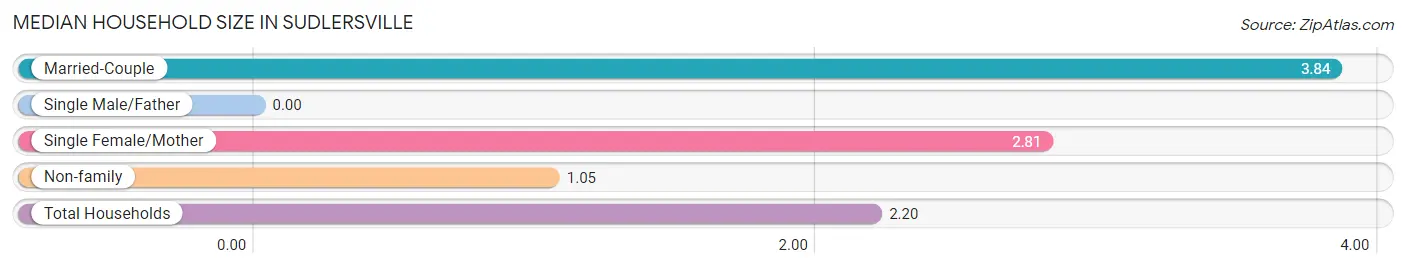
| Household Type | # Households | Household Size |
| Married-Couple | 45 (27.1%) | 3.84 |
| Single Male/Father | 0 (0.0%) | - |
| Single Female/Mother | 37 (22.3%) | 2.81 |
| Non-family | 84 (50.6%) | 1.05 |
| Total Households | 166 (100.0%) | 2.20 |
Household Size by Marriage Status in Sudlersville
Out of a total of 166 households in Sudlersville, 82 (49.4%) are family households, while 84 (50.6%) are nonfamily households. The most numerous type of family households are 2-person households, comprising 26, and the most common type of nonfamily households are 1-person households, comprising 80.
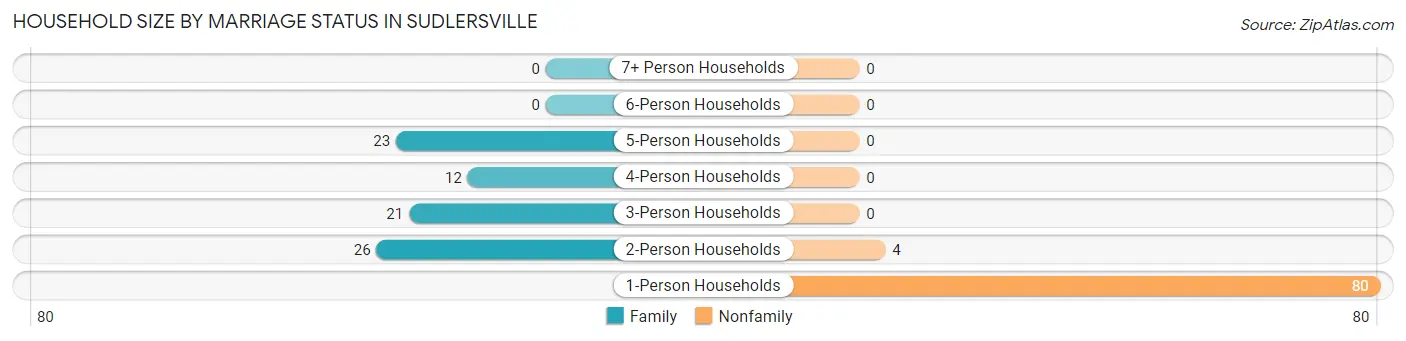
| Household Size | Family Households | Nonfamily Households |
| 1-Person Households | - | 80 (48.2%) |
| 2-Person Households | 26 (15.7%) | 4 (2.4%) |
| 3-Person Households | 21 (12.7%) | 0 (0.0%) |
| 4-Person Households | 12 (7.2%) | 0 (0.0%) |
| 5-Person Households | 23 (13.9%) | 0 (0.0%) |
| 6-Person Households | 0 (0.0%) | 0 (0.0%) |
| 7+ Person Households | 0 (0.0%) | 0 (0.0%) |
| Total | 82 (49.4%) | 84 (50.6%) |
Female Fertility in Sudlersville
Fertility by Age in Sudlersville
Average fertility rate in Sudlersville is 105.0 births per 1,000 women. Women in the age bracket of 35 to 50 years have the highest fertility rate with 125.0 births per 1,000 women. Women in the age bracket of 20 to 34 years acount for 55.6% of all women with births.
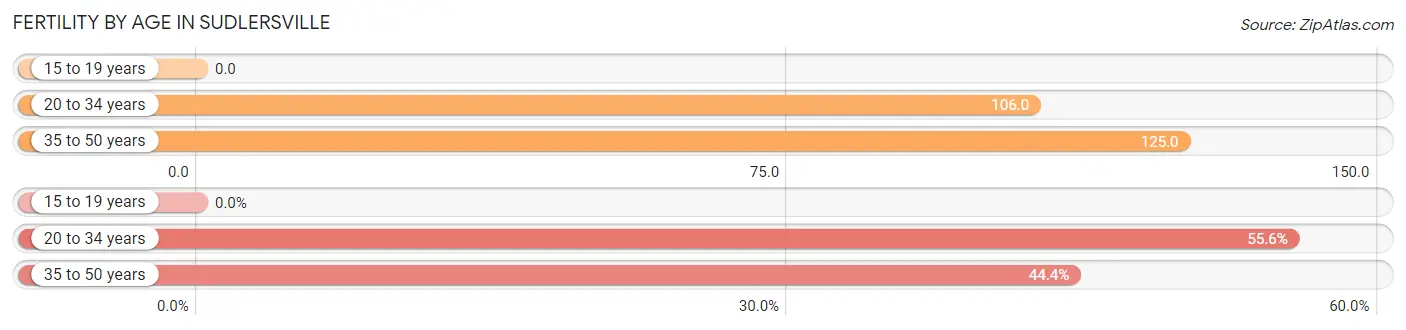
| Age Bracket | Women with Births | Births / 1,000 Women |
| 15 to 19 years | 0 (0.0%) | 0.0 |
| 20 to 34 years | 5 (55.6%) | 106.0 |
| 35 to 50 years | 4 (44.4%) | 125.0 |
| Total | 9 (100.0%) | 105.0 |
Fertility by Age by Marriage Status in Sudlersville
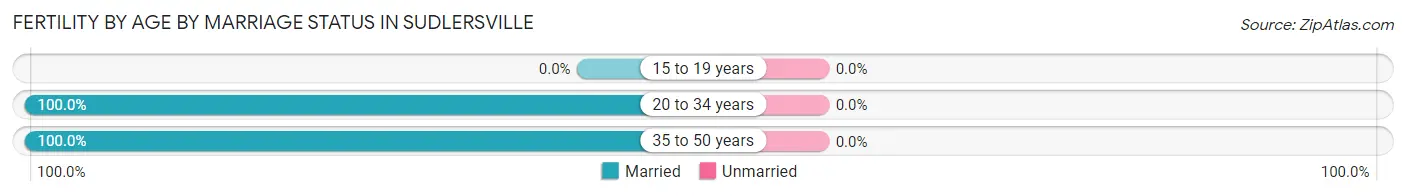
| Age Bracket | Married | Unmarried |
| 15 to 19 years | 0 (0.0%) | 0 (0.0%) |
| 20 to 34 years | 5 (100.0%) | 0 (0.0%) |
| 35 to 50 years | 4 (100.0%) | 0 (0.0%) |
| Total | 9 (100.0%) | 0 (0.0%) |
Fertility by Education in Sudlersville
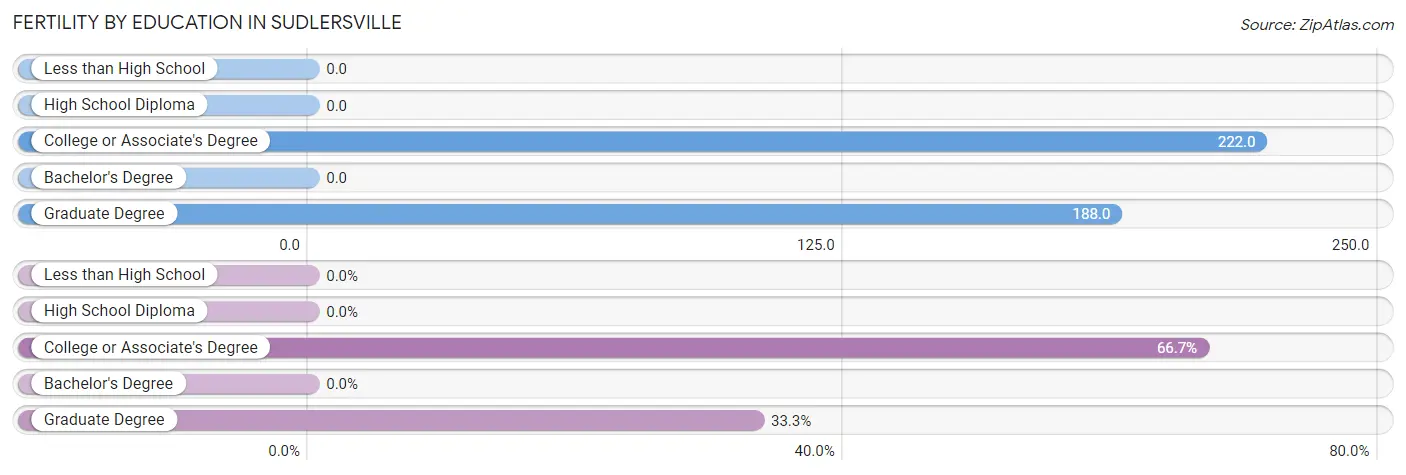
| Educational Attainment | Women with Births | Births / 1,000 Women |
| Less than High School | 0 (0.0%) | 0.0 |
| High School Diploma | 0 (0.0%) | 0.0 |
| College or Associate's Degree | 6 (66.7%) | 222.0 |
| Bachelor's Degree | 0 (0.0%) | 0.0 |
| Graduate Degree | 3 (33.3%) | 188.0 |
| Total | 9 (100.0%) | 105.0 |
Fertility by Education by Marriage Status in Sudlersville
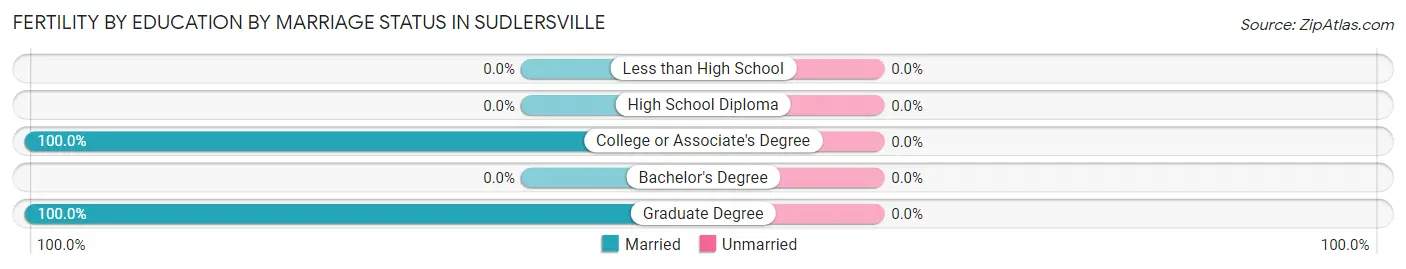
| Educational Attainment | Married | Unmarried |
| Less than High School | 0 (0.0%) | 0 (0.0%) |
| High School Diploma | 0 (0.0%) | 0 (0.0%) |
| College or Associate's Degree | 6 (100.0%) | 0 (0.0%) |
| Bachelor's Degree | 0 (0.0%) | 0 (0.0%) |
| Graduate Degree | 3 (100.0%) | 0 (0.0%) |
| Total | 9 (100.0%) | 0 (0.0%) |
Employment Characteristics in Sudlersville
Employment by Class of Employer in Sudlersville
Among the 156 employed individuals in Sudlersville, private company employees (65 | 41.7%), federal government employees (22 | 14.1%), and local government employees (21 | 13.5%) make up the most common classes of employment.
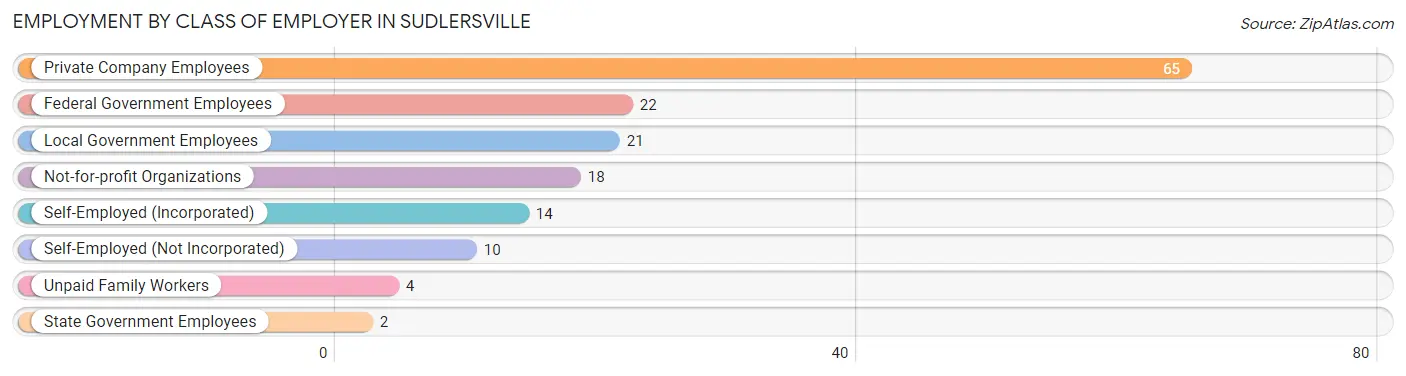
| Employer Class | # Employees | % Employees |
| Private Company Employees | 65 | 41.7% |
| Self-Employed (Incorporated) | 14 | 9.0% |
| Self-Employed (Not Incorporated) | 10 | 6.4% |
| Not-for-profit Organizations | 18 | 11.5% |
| Local Government Employees | 21 | 13.5% |
| State Government Employees | 2 | 1.3% |
| Federal Government Employees | 22 | 14.1% |
| Unpaid Family Workers | 4 | 2.6% |
| Total | 156 | 100.0% |
Employment Status by Age in Sudlersville
According to the labor force statistics for Sudlersville, out of the total population over 16 years of age (298), 59.4% or 177 individuals are in the labor force, with 5.1% or 9 of them unemployed. The age group with the highest labor force participation rate is 35 to 44 years, with 100.0% or 43 individuals in the labor force. Within the labor force, the 16 to 19 years age range has the highest percentage of unemployed individuals, with 66.7% or 4 of them being unemployed.
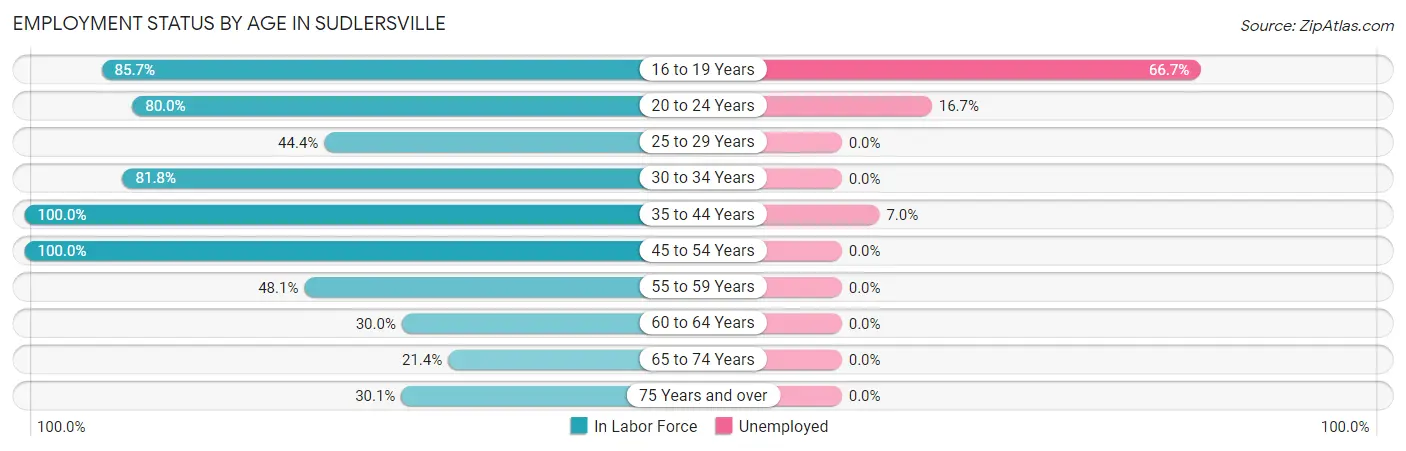
| Age Bracket | In Labor Force | Unemployed |
| 16 to 19 Years | 6 (85.7%) | 4 (66.7%) |
| 20 to 24 Years | 12 (80.0%) | 2 (16.7%) |
| 25 to 29 Years | 8 (44.4%) | 0 (0.0%) |
| 30 to 34 Years | 27 (81.8%) | 0 (0.0%) |
| 35 to 44 Years | 43 (100.0%) | 3 (7.0%) |
| 45 to 54 Years | 34 (100.0%) | 0 (0.0%) |
| 55 to 59 Years | 13 (48.1%) | 0 (0.0%) |
| 60 to 64 Years | 3 (30.0%) | 0 (0.0%) |
| 65 to 74 Years | 6 (21.4%) | 0 (0.0%) |
| 75 Years and over | 25 (30.1%) | 0 (0.0%) |
| Total | 177 (59.4%) | 9 (5.1%) |
Employment Status by Educational Attainment in Sudlersville
According to labor force statistics for Sudlersville, 77.6% of individuals (128) out of the total population between 25 and 64 years of age (165) are in the labor force, with 2.3% or 3 of them being unemployed. The group with the highest labor force participation rate are those with the educational attainment of bachelor's degree or higher, with 94.3% or 33 individuals in the labor force. Within the labor force, individuals with high school diploma education have the highest percentage of unemployment, with 5.1% or 3 of them being unemployed.
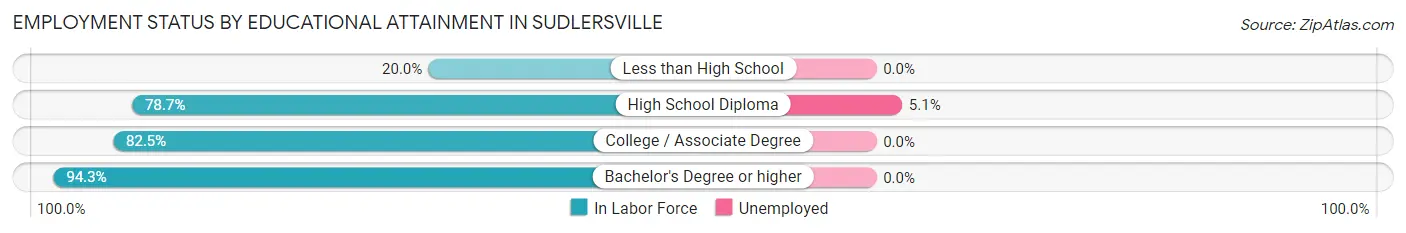
| Educational Attainment | In Labor Force | Unemployed |
| Less than High School | 3 (20.0%) | 0 (0.0%) |
| High School Diploma | 59 (78.7%) | 4 (5.1%) |
| College / Associate Degree | 33 (82.5%) | 0 (0.0%) |
| Bachelor's Degree or higher | 33 (94.3%) | 0 (0.0%) |
| Total | 128 (77.6%) | 4 (2.3%) |
Employment Occupations by Sex in Sudlersville
Management, Business, Science and Arts Occupations
The most common Management, Business, Science and Arts occupations in Sudlersville are Computers, Engineering & Science (22 | 13.1%), Health Diagnosing & Treating (21 | 12.5%), Community & Social Service (18 | 10.7%), Education Instruction & Library (17 | 10.1%), and Architecture & Engineering (16 | 9.5%).
Management, Business, Science and Arts Occupations by Sex
Within the Management, Business, Science and Arts occupations in Sudlersville, the most male-oriented occupations are Computers & Mathematics (100.0%), Architecture & Engineering (100.0%), and Computers, Engineering & Science (86.4%), while the most female-oriented occupations are Management (100.0%), Business & Financial (100.0%), and Life, Physical & Social Science (100.0%).
| Occupation | Male | Female |
| Management | 0 (0.0%) | 11 (100.0%) |
| Business & Financial | 0 (0.0%) | 2 (100.0%) |
| Computers, Engineering & Science | 19 (86.4%) | 3 (13.6%) |
| Computers & Mathematics | 3 (100.0%) | 0 (0.0%) |
| Architecture & Engineering | 16 (100.0%) | 0 (0.0%) |
| Life, Physical & Social Science | 0 (0.0%) | 3 (100.0%) |
| Community & Social Service | 6 (33.3%) | 12 (66.7%) |
| Education, Arts & Media | 0 (0.0%) | 0 (0.0%) |
| Legal Services & Support | 0 (0.0%) | 1 (100.0%) |
| Education Instruction & Library | 6 (35.3%) | 11 (64.7%) |
| Arts, Media & Entertainment | 0 (0.0%) | 0 (0.0%) |
| Health Diagnosing & Treating | 0 (0.0%) | 21 (100.0%) |
| Health Technologists | 0 (0.0%) | 11 (100.0%) |
| Total (Category) | 25 (33.8%) | 49 (66.2%) |
| Total (Overall) | 66 (39.3%) | 102 (60.7%) |
Services Occupations
The most common Services occupations in Sudlersville are Cleaning & Maintenance (25 | 14.9%), Security & Protection (5 | 3.0%), Law Enforcement (3 | 1.8%), Healthcare Support (2 | 1.2%), and Firefighting & Prevention (2 | 1.2%).
Services Occupations by Sex
Within the Services occupations in Sudlersville, the most male-oriented occupations are Security & Protection (100.0%), Firefighting & Prevention (100.0%), and Law Enforcement (100.0%), while the most female-oriented occupations are Healthcare Support (100.0%), and Cleaning & Maintenance (100.0%).
| Occupation | Male | Female |
| Healthcare Support | 0 (0.0%) | 2 (100.0%) |
| Security & Protection | 5 (100.0%) | 0 (0.0%) |
| Firefighting & Prevention | 2 (100.0%) | 0 (0.0%) |
| Law Enforcement | 3 (100.0%) | 0 (0.0%) |
| Food Preparation & Serving | 0 (0.0%) | 0 (0.0%) |
| Cleaning & Maintenance | 0 (0.0%) | 25 (100.0%) |
| Personal Care & Service | 0 (0.0%) | 0 (0.0%) |
| Total (Category) | 5 (15.6%) | 27 (84.4%) |
| Total (Overall) | 66 (39.3%) | 102 (60.7%) |
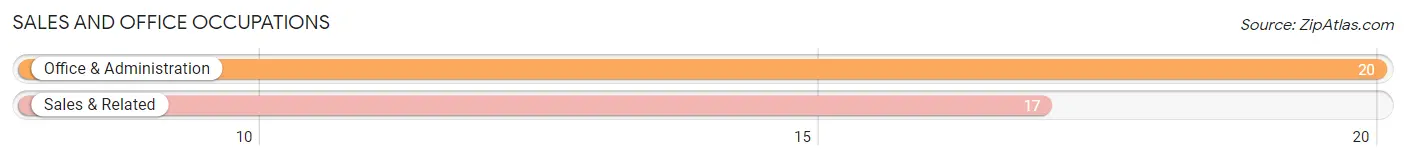
Sales and Office Occupations
The most common Sales and Office occupations in Sudlersville are Office & Administration (20 | 11.9%), and Sales & Related (17 | 10.1%).
Sales and Office Occupations by Sex
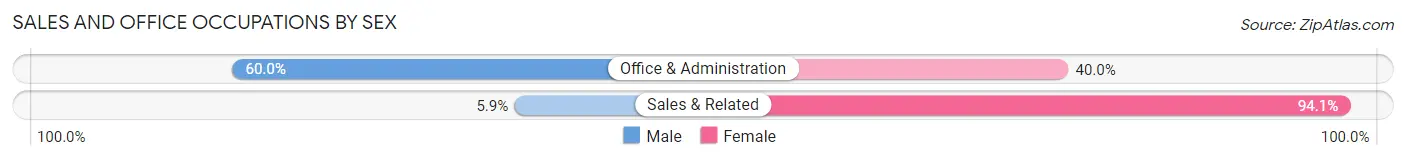
| Occupation | Male | Female |
| Sales & Related | 1 (5.9%) | 16 (94.1%) |
| Office & Administration | 12 (60.0%) | 8 (40.0%) |
| Total (Category) | 13 (35.1%) | 24 (64.9%) |
| Total (Overall) | 66 (39.3%) | 102 (60.7%) |
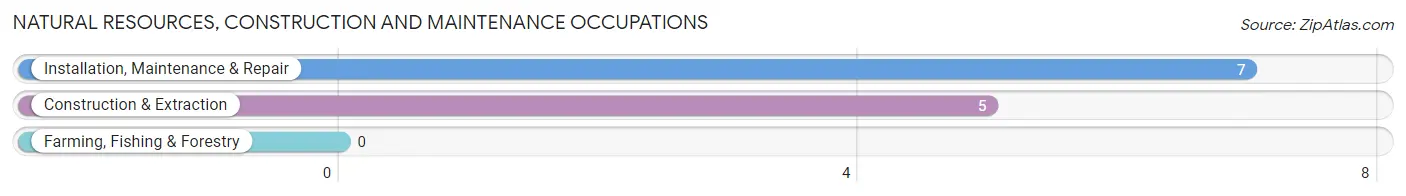
Natural Resources, Construction and Maintenance Occupations
The most common Natural Resources, Construction and Maintenance occupations in Sudlersville are Installation, Maintenance & Repair (7 | 4.2%), and Construction & Extraction (5 | 3.0%).
Natural Resources, Construction and Maintenance Occupations by Sex
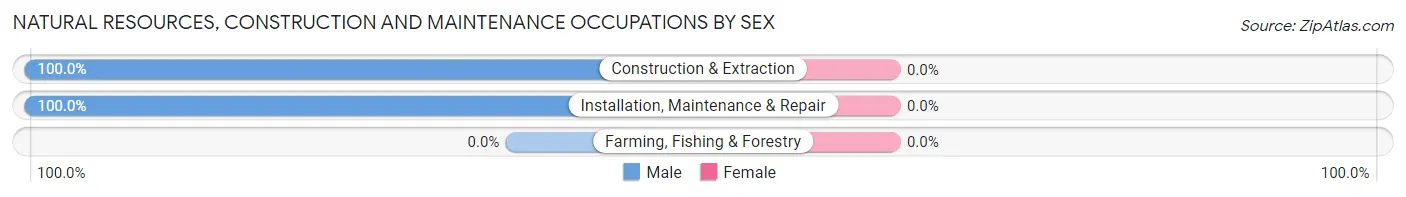
| Occupation | Male | Female |
| Farming, Fishing & Forestry | 0 (0.0%) | 0 (0.0%) |
| Construction & Extraction | 5 (100.0%) | 0 (0.0%) |
| Installation, Maintenance & Repair | 7 (100.0%) | 0 (0.0%) |
| Total (Category) | 12 (100.0%) | 0 (0.0%) |
| Total (Overall) | 66 (39.3%) | 102 (60.7%) |
Production, Transportation and Moving Occupations
The most common Production, Transportation and Moving occupations in Sudlersville are Material Moving (9 | 5.4%), and Transportation (4 | 2.4%).
Production, Transportation and Moving Occupations by Sex
| Occupation | Male | Female |
| Production | 0 (0.0%) | 0 (0.0%) |
| Transportation | 4 (100.0%) | 0 (0.0%) |
| Material Moving | 7 (77.8%) | 2 (22.2%) |
| Total (Category) | 11 (84.6%) | 2 (15.4%) |
| Total (Overall) | 66 (39.3%) | 102 (60.7%) |
Employment Industries by Sex in Sudlersville
Employment Industries in Sudlersville
The major employment industries in Sudlersville include Health Care & Social Assistance (29 | 17.3%), Public Administration (24 | 14.3%), Wholesale Trade (21 | 12.5%), Administrative & Support (19 | 11.3%), and Retail Trade (18 | 10.7%).
Employment Industries by Sex in Sudlersville
The Sudlersville industries that see more men than women are Agriculture, Fishing & Hunting (100.0%), Construction (100.0%), and Manufacturing (100.0%), whereas the industries that tend to have a higher number of women are Finance & Insurance (100.0%), Real Estate, Rental & Leasing (100.0%), and Professional & Scientific (100.0%).
| Industry | Male | Female |
| Agriculture, Fishing & Hunting | 1 (100.0%) | 0 (0.0%) |
| Mining, Quarrying, & Extraction | 0 (0.0%) | 0 (0.0%) |
| Construction | 5 (100.0%) | 0 (0.0%) |
| Manufacturing | 2 (100.0%) | 0 (0.0%) |
| Wholesale Trade | 3 (14.3%) | 18 (85.7%) |
| Retail Trade | 14 (77.8%) | 4 (22.2%) |
| Transportation & Warehousing | 7 (100.0%) | 0 (0.0%) |
| Utilities | 0 (0.0%) | 0 (0.0%) |
| Information | 0 (0.0%) | 0 (0.0%) |
| Finance & Insurance | 0 (0.0%) | 3 (100.0%) |
| Real Estate, Rental & Leasing | 0 (0.0%) | 10 (100.0%) |
| Professional & Scientific | 0 (0.0%) | 4 (100.0%) |
| Enterprise Management | 0 (0.0%) | 0 (0.0%) |
| Administrative & Support | 0 (0.0%) | 19 (100.0%) |
| Educational Services | 6 (35.3%) | 11 (64.7%) |
| Health Care & Social Assistance | 1 (3.5%) | 28 (96.6%) |
| Arts, Entertainment & Recreation | 0 (0.0%) | 2 (100.0%) |
| Accommodation & Food Services | 0 (0.0%) | 3 (100.0%) |
| Public Administration | 24 (100.0%) | 0 (0.0%) |
| Total | 66 (39.3%) | 102 (60.7%) |
Education in Sudlersville
School Enrollment in Sudlersville
The most common levels of schooling among the 70 students in Sudlersville are elementary school (21 | 30.0%), middle school (21 | 30.0%), and high school (20 | 28.6%).
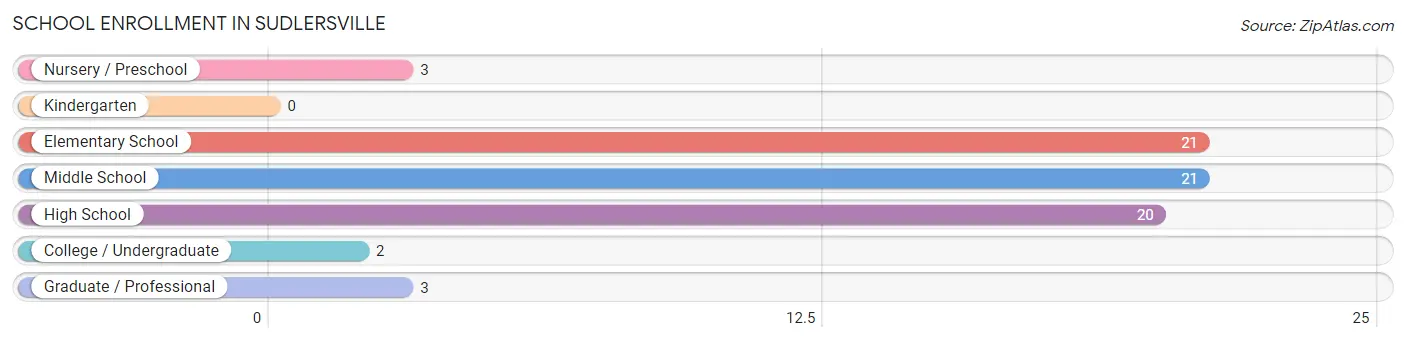
| School Level | # Students | % Students |
| Nursery / Preschool | 3 | 4.3% |
| Kindergarten | 0 | 0.0% |
| Elementary School | 21 | 30.0% |
| Middle School | 21 | 30.0% |
| High School | 20 | 28.6% |
| College / Undergraduate | 2 | 2.9% |
| Graduate / Professional | 3 | 4.3% |
| Total | 70 | 100.0% |
School Enrollment by Age by Funding Source in Sudlersville
Out of a total of 70 students who are enrolled in schools in Sudlersville, 4 (5.7%) attend a private institution, while the remaining 66 (94.3%) are enrolled in public schools. The age group of 35 years and over has the highest likelihood of being enrolled in private schools, with 3 (100.0% in the age bracket) enrolled. Conversely, the age group of 3 to 4 year olds has the lowest likelihood of being enrolled in a private school, with 3 (100.0% in the age bracket) attending a public institution.
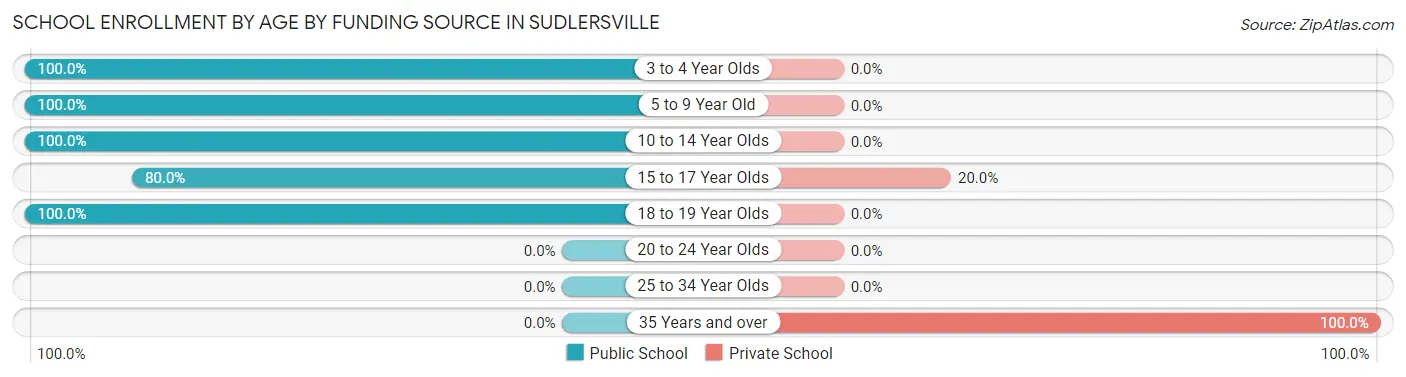
| Age Bracket | Public School | Private School |
| 3 to 4 Year Olds | 3 (100.0%) | 0 (0.0%) |
| 5 to 9 Year Old | 21 (100.0%) | 0 (0.0%) |
| 10 to 14 Year Olds | 36 (100.0%) | 0 (0.0%) |
| 15 to 17 Year Olds | 4 (80.0%) | 1 (20.0%) |
| 18 to 19 Year Olds | 2 (100.0%) | 0 (0.0%) |
| 20 to 24 Year Olds | 0 (0.0%) | 0 (0.0%) |
| 25 to 34 Year Olds | 0 (0.0%) | 0 (0.0%) |
| 35 Years and over | 0 (0.0%) | 3 (100.0%) |
| Total | 66 (94.3%) | 4 (5.7%) |
Educational Attainment by Field of Study in Sudlersville
Education (17 | 34.0%), science & technology (6 | 12.0%), liberal arts & history (6 | 12.0%), bio, nature & agricultural (5 | 10.0%), and physical & health sciences (5 | 10.0%) are the most common fields of study among 50 individuals in Sudlersville who have obtained a bachelor's degree or higher.
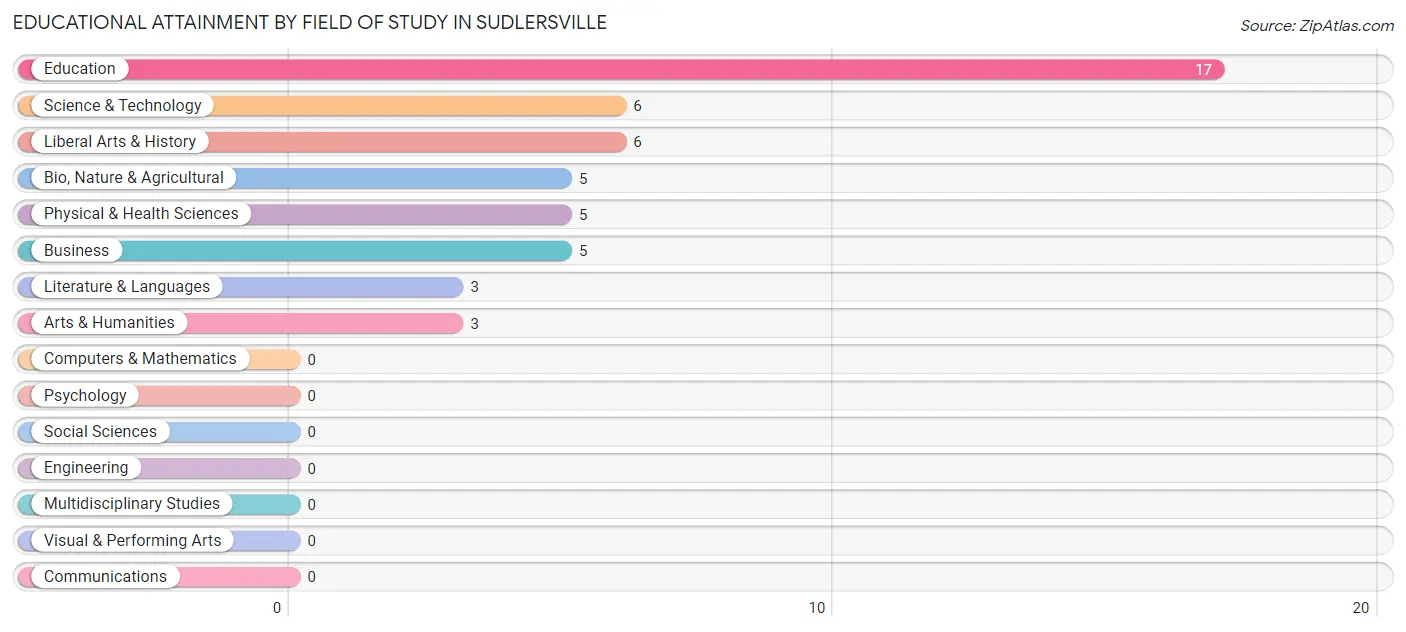
| Field of Study | # Graduates | % Graduates |
| Computers & Mathematics | 0 | 0.0% |
| Bio, Nature & Agricultural | 5 | 10.0% |
| Physical & Health Sciences | 5 | 10.0% |
| Psychology | 0 | 0.0% |
| Social Sciences | 0 | 0.0% |
| Engineering | 0 | 0.0% |
| Multidisciplinary Studies | 0 | 0.0% |
| Science & Technology | 6 | 12.0% |
| Business | 5 | 10.0% |
| Education | 17 | 34.0% |
| Literature & Languages | 3 | 6.0% |
| Liberal Arts & History | 6 | 12.0% |
| Visual & Performing Arts | 0 | 0.0% |
| Communications | 0 | 0.0% |
| Arts & Humanities | 3 | 6.0% |
| Total | 50 | 100.0% |
Transportation & Commute in Sudlersville
Vehicle Availability by Sex in Sudlersville
The most prevalent vehicle ownership categories in Sudlersville are males with 3 vehicles (37, accounting for 57.8%) and females with 3 vehicles (26, making up 40.2%).
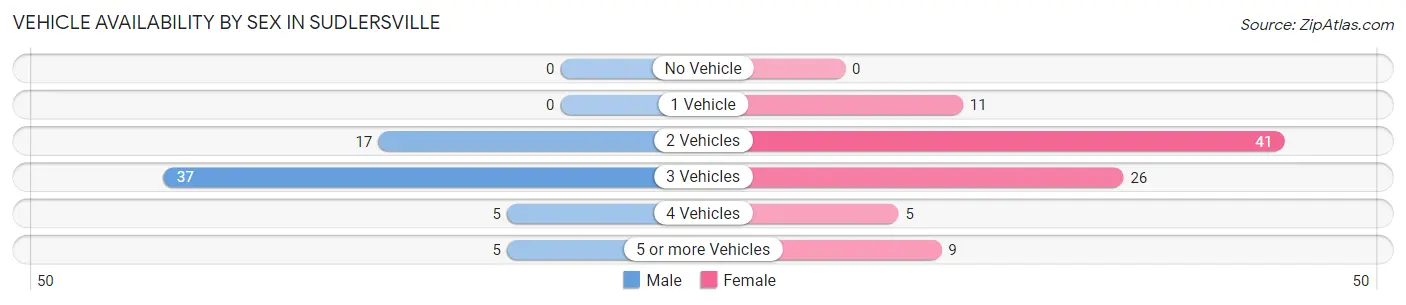
| Vehicles Available | Male | Female |
| No Vehicle | 0 (0.0%) | 0 (0.0%) |
| 1 Vehicle | 0 (0.0%) | 11 (12.0%) |
| 2 Vehicles | 17 (26.6%) | 41 (44.6%) |
| 3 Vehicles | 37 (57.8%) | 26 (28.3%) |
| 4 Vehicles | 5 (7.8%) | 5 (5.4%) |
| 5 or more Vehicles | 5 (7.8%) | 9 (9.8%) |
| Total | 64 (100.0%) | 92 (100.0%) |
Commute Time in Sudlersville
The most frequently occuring commute durations in Sudlersville are 30 to 34 minutes (44 commuters, 38.3%), 60 to 89 minutes (22 commuters, 19.1%), and 15 to 19 minutes (8 commuters, 7.0%).
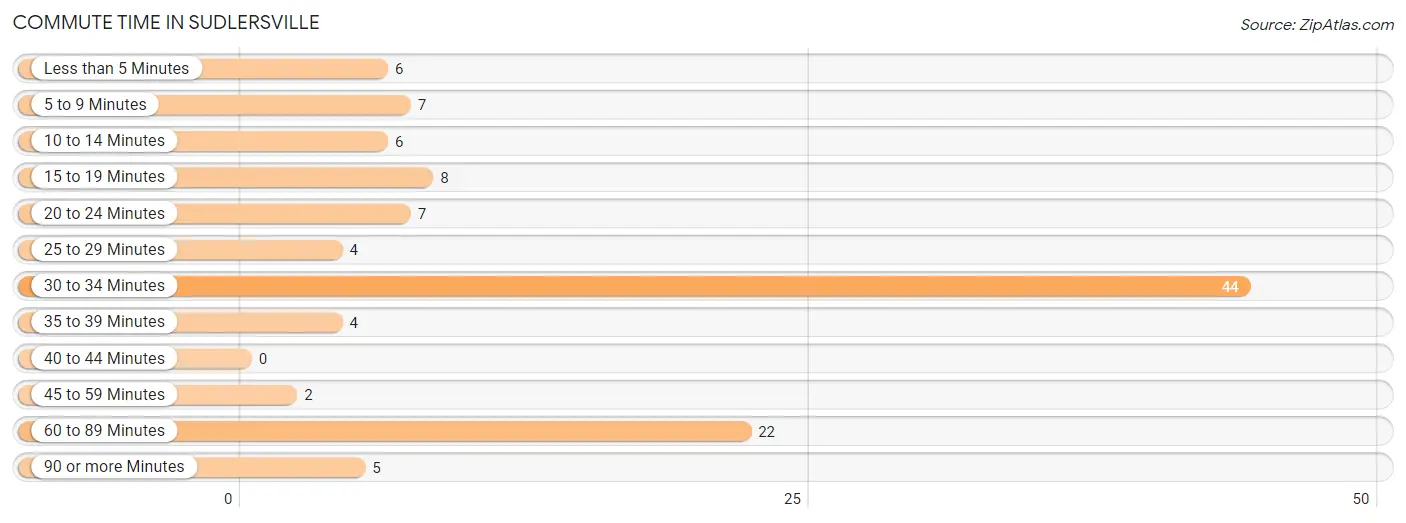
| Commute Time | # Commuters | % Commuters |
| Less than 5 Minutes | 6 | 5.2% |
| 5 to 9 Minutes | 7 | 6.1% |
| 10 to 14 Minutes | 6 | 5.2% |
| 15 to 19 Minutes | 8 | 7.0% |
| 20 to 24 Minutes | 7 | 6.1% |
| 25 to 29 Minutes | 4 | 3.5% |
| 30 to 34 Minutes | 44 | 38.3% |
| 35 to 39 Minutes | 4 | 3.5% |
| 40 to 44 Minutes | 0 | 0.0% |
| 45 to 59 Minutes | 2 | 1.7% |
| 60 to 89 Minutes | 22 | 19.1% |
| 90 or more Minutes | 5 | 4.3% |
Commute Time by Sex in Sudlersville
The most common commute times in Sudlersville are 30 to 34 minutes (17 commuters, 43.6%) for males and 30 to 34 minutes (27 commuters, 35.5%) for females.
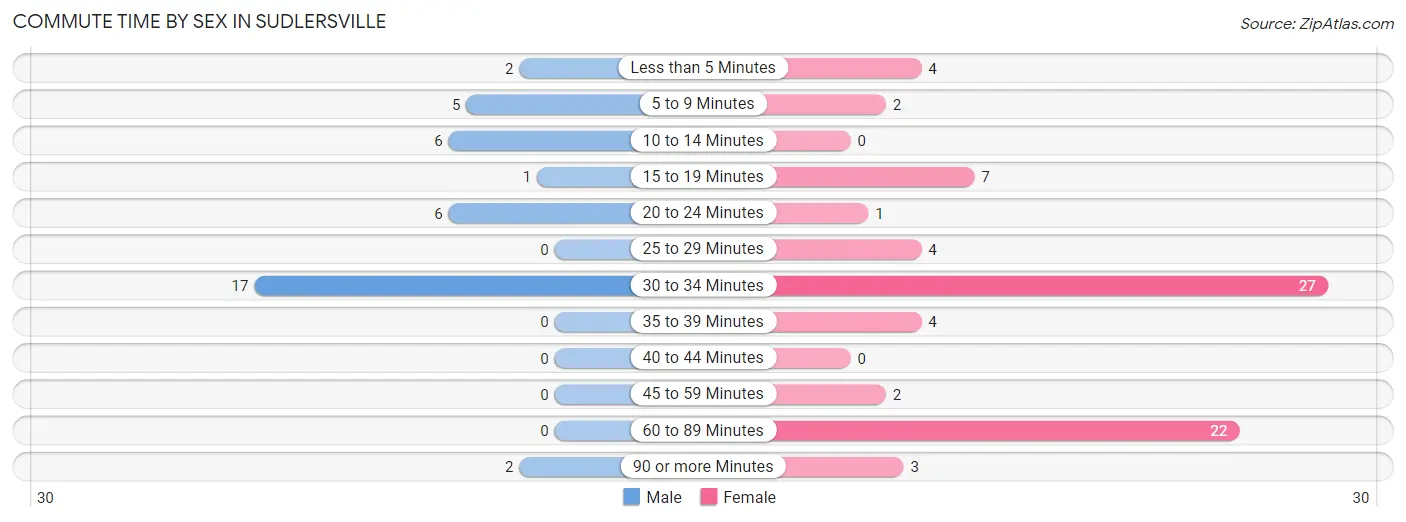
| Commute Time | Male | Female |
| Less than 5 Minutes | 2 (5.1%) | 4 (5.3%) |
| 5 to 9 Minutes | 5 (12.8%) | 2 (2.6%) |
| 10 to 14 Minutes | 6 (15.4%) | 0 (0.0%) |
| 15 to 19 Minutes | 1 (2.6%) | 7 (9.2%) |
| 20 to 24 Minutes | 6 (15.4%) | 1 (1.3%) |
| 25 to 29 Minutes | 0 (0.0%) | 4 (5.3%) |
| 30 to 34 Minutes | 17 (43.6%) | 27 (35.5%) |
| 35 to 39 Minutes | 0 (0.0%) | 4 (5.3%) |
| 40 to 44 Minutes | 0 (0.0%) | 0 (0.0%) |
| 45 to 59 Minutes | 0 (0.0%) | 2 (2.6%) |
| 60 to 89 Minutes | 0 (0.0%) | 22 (28.9%) |
| 90 or more Minutes | 2 (5.1%) | 3 (4.0%) |
Time of Departure to Work by Sex in Sudlersville
The most frequent times of departure to work in Sudlersville are 7:00 AM to 7:29 AM (10, 25.6%) for males and 6:30 AM to 6:59 AM (22, 28.9%) for females.
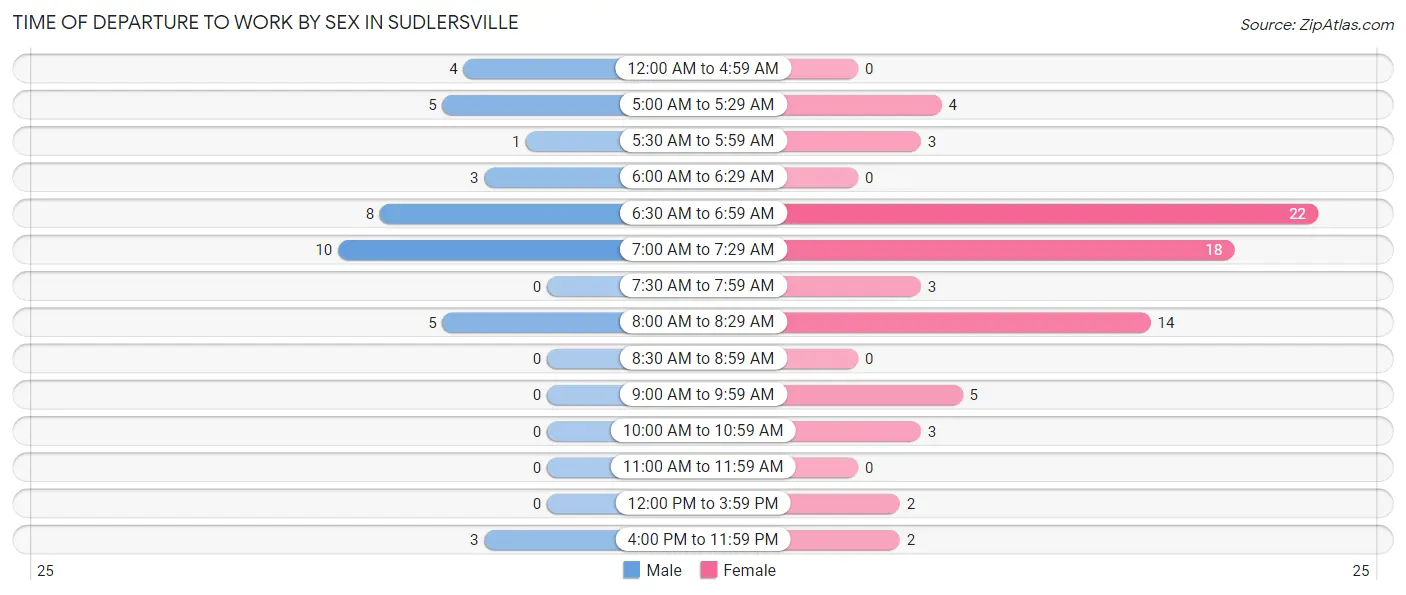
| Time of Departure | Male | Female |
| 12:00 AM to 4:59 AM | 4 (10.3%) | 0 (0.0%) |
| 5:00 AM to 5:29 AM | 5 (12.8%) | 4 (5.3%) |
| 5:30 AM to 5:59 AM | 1 (2.6%) | 3 (4.0%) |
| 6:00 AM to 6:29 AM | 3 (7.7%) | 0 (0.0%) |
| 6:30 AM to 6:59 AM | 8 (20.5%) | 22 (28.9%) |
| 7:00 AM to 7:29 AM | 10 (25.6%) | 18 (23.7%) |
| 7:30 AM to 7:59 AM | 0 (0.0%) | 3 (4.0%) |
| 8:00 AM to 8:29 AM | 5 (12.8%) | 14 (18.4%) |
| 8:30 AM to 8:59 AM | 0 (0.0%) | 0 (0.0%) |
| 9:00 AM to 9:59 AM | 0 (0.0%) | 5 (6.6%) |
| 10:00 AM to 10:59 AM | 0 (0.0%) | 3 (4.0%) |
| 11:00 AM to 11:59 AM | 0 (0.0%) | 0 (0.0%) |
| 12:00 PM to 3:59 PM | 0 (0.0%) | 2 (2.6%) |
| 4:00 PM to 11:59 PM | 3 (7.7%) | 2 (2.6%) |
| Total | 39 (100.0%) | 76 (100.0%) |
Housing Occupancy in Sudlersville
Occupancy by Ownership in Sudlersville
Of the total 166 dwellings in Sudlersville, owner-occupied units account for 75 (45.2%), while renter-occupied units make up 91 (54.8%).
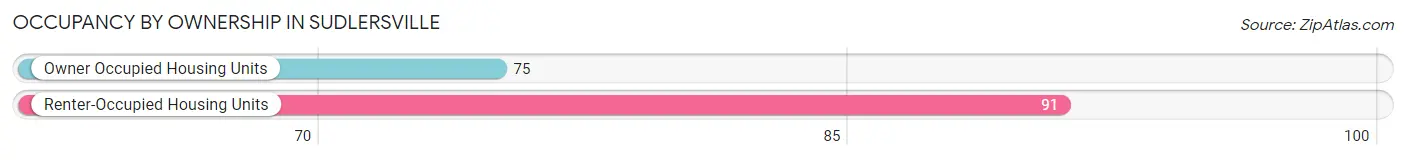
| Occupancy | # Housing Units | % Housing Units |
| Owner Occupied Housing Units | 75 | 45.2% |
| Renter-Occupied Housing Units | 91 | 54.8% |
| Total Occupied Housing Units | 166 | 100.0% |
Occupancy by Household Size in Sudlersville
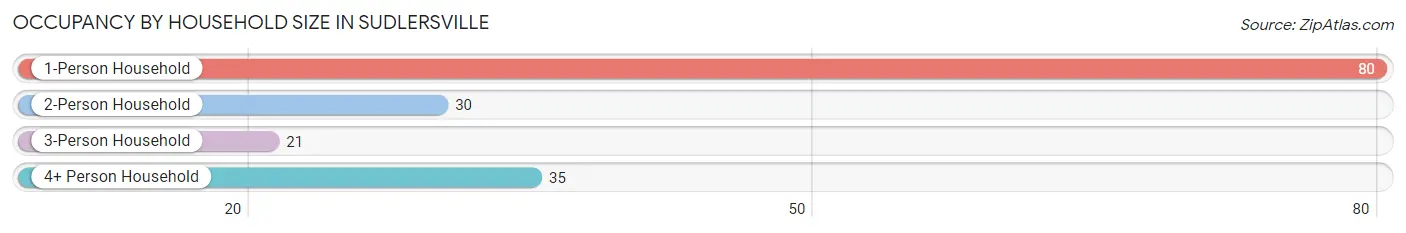
| Household Size | # Housing Units | % Housing Units |
| 1-Person Household | 80 | 48.2% |
| 2-Person Household | 30 | 18.1% |
| 3-Person Household | 21 | 12.7% |
| 4+ Person Household | 35 | 21.1% |
| Total Housing Units | 166 | 100.0% |
Occupancy by Ownership by Household Size in Sudlersville
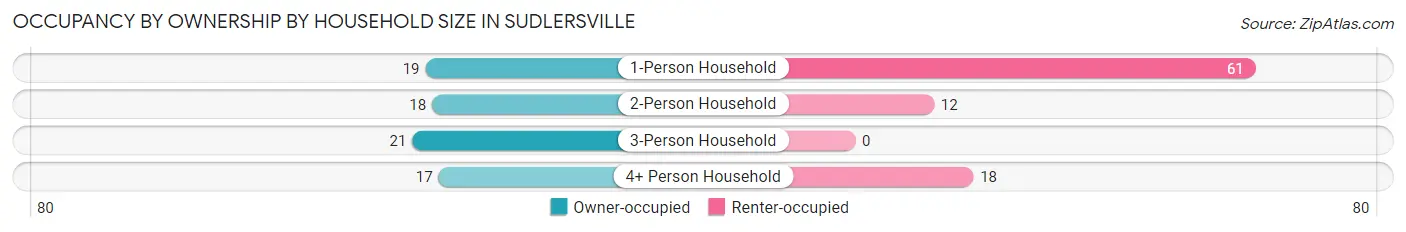
| Household Size | Owner-occupied | Renter-occupied |
| 1-Person Household | 19 (23.7%) | 61 (76.2%) |
| 2-Person Household | 18 (60.0%) | 12 (40.0%) |
| 3-Person Household | 21 (100.0%) | 0 (0.0%) |
| 4+ Person Household | 17 (48.6%) | 18 (51.4%) |
| Total Housing Units | 75 (45.2%) | 91 (54.8%) |
Occupancy by Educational Attainment in Sudlersville
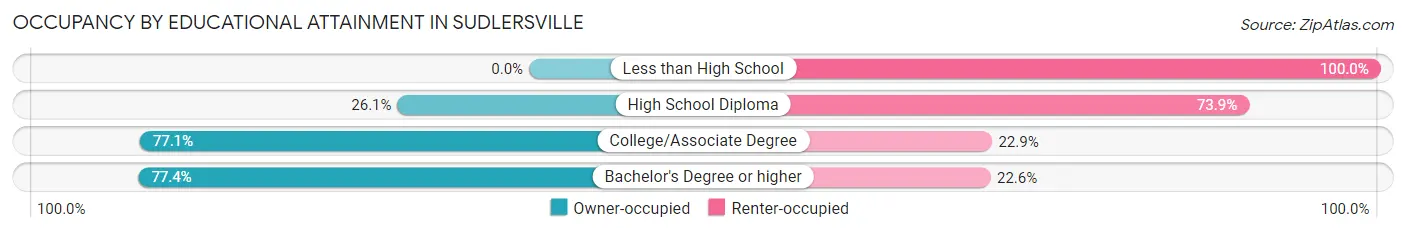
| Household Size | Owner-occupied | Renter-occupied |
| Less than High School | 0 (0.0%) | 8 (100.0%) |
| High School Diploma | 24 (26.1%) | 68 (73.9%) |
| College/Associate Degree | 27 (77.1%) | 8 (22.9%) |
| Bachelor's Degree or higher | 24 (77.4%) | 7 (22.6%) |
Occupancy by Age of Householder in Sudlersville
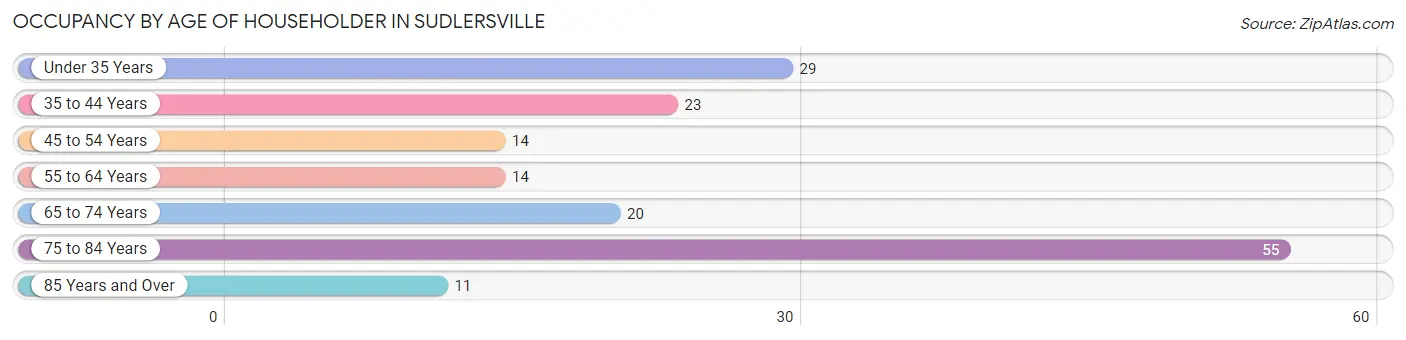
| Age Bracket | # Households | % Households |
| Under 35 Years | 29 | 17.5% |
| 35 to 44 Years | 23 | 13.9% |
| 45 to 54 Years | 14 | 8.4% |
| 55 to 64 Years | 14 | 8.4% |
| 65 to 74 Years | 20 | 12.0% |
| 75 to 84 Years | 55 | 33.1% |
| 85 Years and Over | 11 | 6.6% |
| Total | 166 | 100.0% |
Housing Finances in Sudlersville
Median Income by Occupancy in Sudlersville
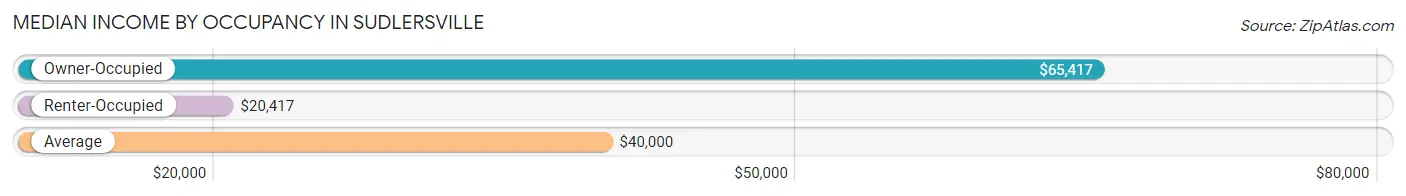
| Occupancy Type | # Households | Median Income |
| Owner-Occupied | 75 (45.2%) | $65,417 |
| Renter-Occupied | 91 (54.8%) | $20,417 |
| Average | 166 (100.0%) | $40,000 |
Occupancy by Householder Income Bracket in Sudlersville
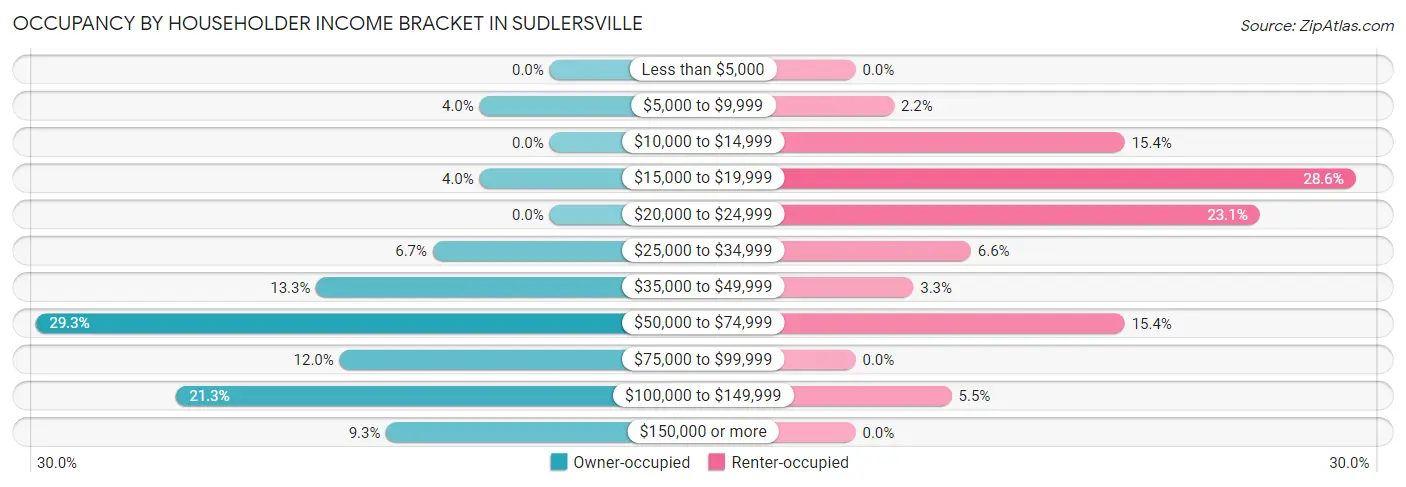
| Income Bracket | Owner-occupied | Renter-occupied |
| Less than $5,000 | 0 (0.0%) | 0 (0.0%) |
| $5,000 to $9,999 | 3 (4.0%) | 2 (2.2%) |
| $10,000 to $14,999 | 0 (0.0%) | 14 (15.4%) |
| $15,000 to $19,999 | 3 (4.0%) | 26 (28.6%) |
| $20,000 to $24,999 | 0 (0.0%) | 21 (23.1%) |
| $25,000 to $34,999 | 5 (6.7%) | 6 (6.6%) |
| $35,000 to $49,999 | 10 (13.3%) | 3 (3.3%) |
| $50,000 to $74,999 | 22 (29.3%) | 14 (15.4%) |
| $75,000 to $99,999 | 9 (12.0%) | 0 (0.0%) |
| $100,000 to $149,999 | 16 (21.3%) | 5 (5.5%) |
| $150,000 or more | 7 (9.3%) | 0 (0.0%) |
| Total | 75 (100.0%) | 91 (100.0%) |
Monthly Housing Cost Tiers in Sudlersville
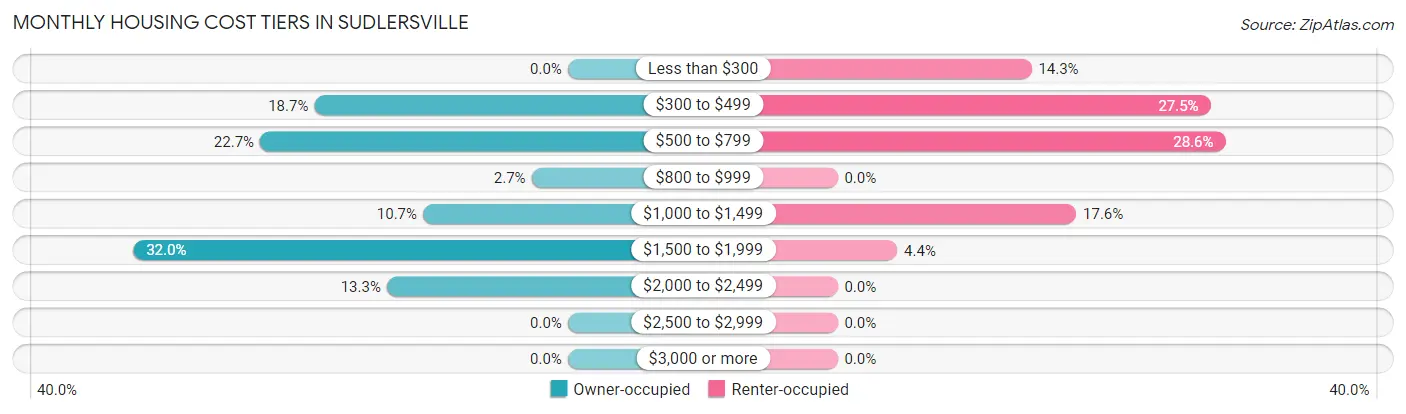
| Monthly Cost | Owner-occupied | Renter-occupied |
| Less than $300 | 0 (0.0%) | 13 (14.3%) |
| $300 to $499 | 14 (18.7%) | 25 (27.5%) |
| $500 to $799 | 17 (22.7%) | 26 (28.6%) |
| $800 to $999 | 2 (2.7%) | 0 (0.0%) |
| $1,000 to $1,499 | 8 (10.7%) | 16 (17.6%) |
| $1,500 to $1,999 | 24 (32.0%) | 4 (4.4%) |
| $2,000 to $2,499 | 10 (13.3%) | 0 (0.0%) |
| $2,500 to $2,999 | 0 (0.0%) | 0 (0.0%) |
| $3,000 or more | 0 (0.0%) | 0 (0.0%) |
| Total | 75 (100.0%) | 91 (100.0%) |
Physical Housing Characteristics in Sudlersville
Housing Structures in Sudlersville
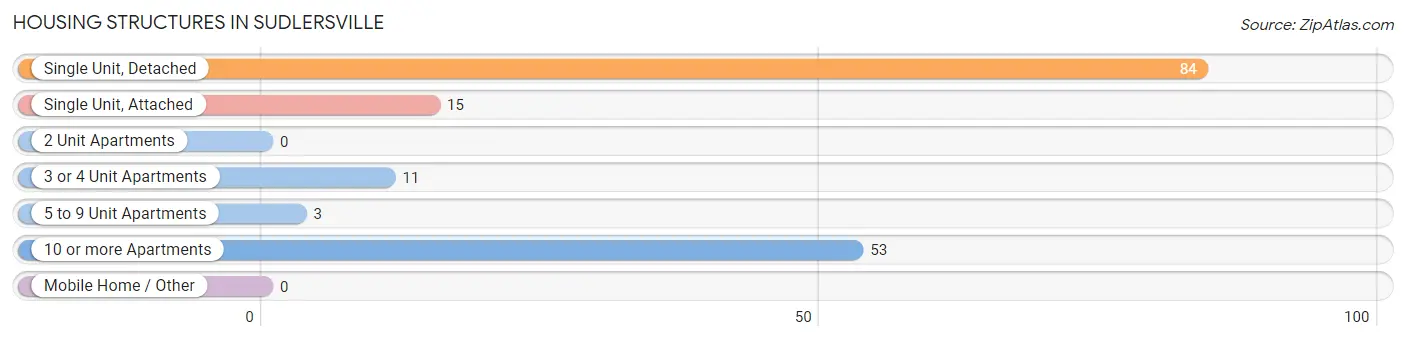
| Structure Type | # Housing Units | % Housing Units |
| Single Unit, Detached | 84 | 50.6% |
| Single Unit, Attached | 15 | 9.0% |
| 2 Unit Apartments | 0 | 0.0% |
| 3 or 4 Unit Apartments | 11 | 6.6% |
| 5 to 9 Unit Apartments | 3 | 1.8% |
| 10 or more Apartments | 53 | 31.9% |
| Mobile Home / Other | 0 | 0.0% |
| Total | 166 | 100.0% |
Housing Structures by Occupancy in Sudlersville
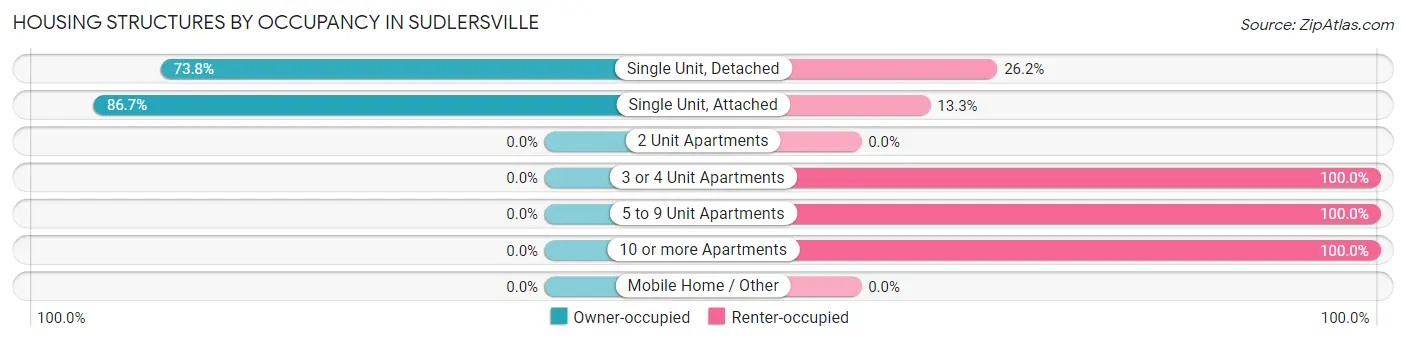
| Structure Type | Owner-occupied | Renter-occupied |
| Single Unit, Detached | 62 (73.8%) | 22 (26.2%) |
| Single Unit, Attached | 13 (86.7%) | 2 (13.3%) |
| 2 Unit Apartments | 0 (0.0%) | 0 (0.0%) |
| 3 or 4 Unit Apartments | 0 (0.0%) | 11 (100.0%) |
| 5 to 9 Unit Apartments | 0 (0.0%) | 3 (100.0%) |
| 10 or more Apartments | 0 (0.0%) | 53 (100.0%) |
| Mobile Home / Other | 0 (0.0%) | 0 (0.0%) |
| Total | 75 (45.2%) | 91 (54.8%) |
Housing Structures by Number of Rooms in Sudlersville
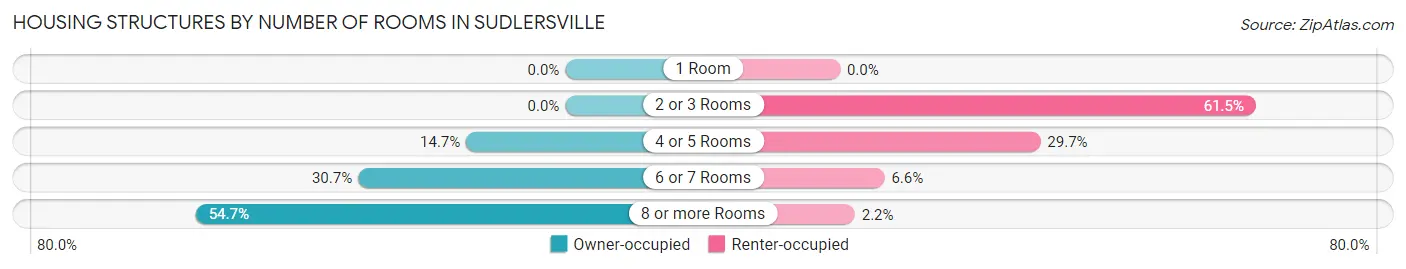
| Number of Rooms | Owner-occupied | Renter-occupied |
| 1 Room | 0 (0.0%) | 0 (0.0%) |
| 2 or 3 Rooms | 0 (0.0%) | 56 (61.5%) |
| 4 or 5 Rooms | 11 (14.7%) | 27 (29.7%) |
| 6 or 7 Rooms | 23 (30.7%) | 6 (6.6%) |
| 8 or more Rooms | 41 (54.7%) | 2 (2.2%) |
| Total | 75 (100.0%) | 91 (100.0%) |
Housing Structure by Heating Type in Sudlersville
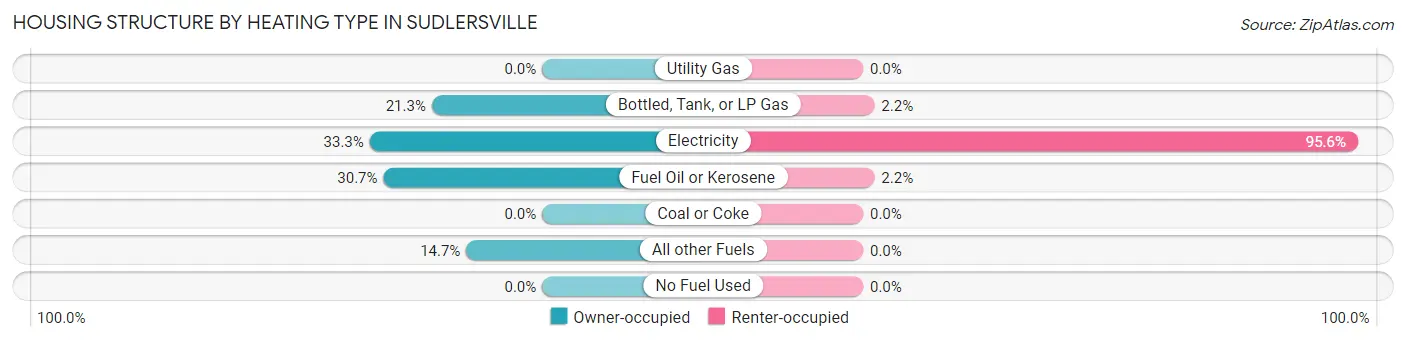
| Heating Type | Owner-occupied | Renter-occupied |
| Utility Gas | 0 (0.0%) | 0 (0.0%) |
| Bottled, Tank, or LP Gas | 16 (21.3%) | 2 (2.2%) |
| Electricity | 25 (33.3%) | 87 (95.6%) |
| Fuel Oil or Kerosene | 23 (30.7%) | 2 (2.2%) |
| Coal or Coke | 0 (0.0%) | 0 (0.0%) |
| All other Fuels | 11 (14.7%) | 0 (0.0%) |
| No Fuel Used | 0 (0.0%) | 0 (0.0%) |
| Total | 75 (100.0%) | 91 (100.0%) |
Household Vehicle Usage in Sudlersville
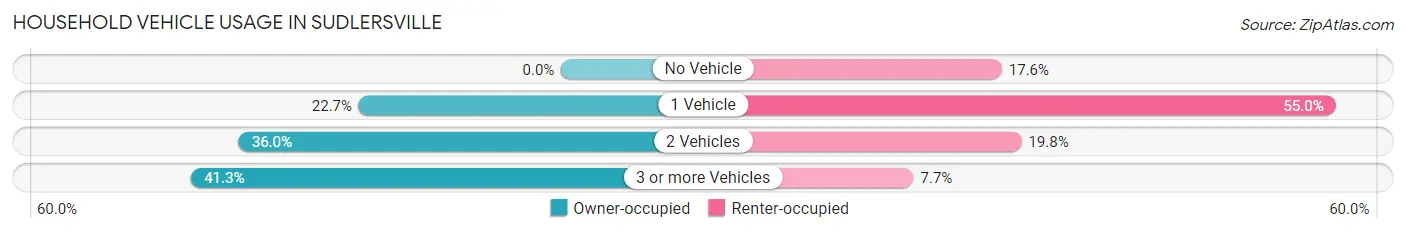
| Vehicles per Household | Owner-occupied | Renter-occupied |
| No Vehicle | 0 (0.0%) | 16 (17.6%) |
| 1 Vehicle | 17 (22.7%) | 50 (54.9%) |
| 2 Vehicles | 27 (36.0%) | 18 (19.8%) |
| 3 or more Vehicles | 31 (41.3%) | 7 (7.7%) |
| Total | 75 (100.0%) | 91 (100.0%) |
Real Estate & Mortgages in Sudlersville
Real Estate and Mortgage Overview in Sudlersville
| Characteristic | Without Mortgage | With Mortgage |
| Housing Units | 38 | 37 |
| Median Property Value | $227,300 | $205,800 |
| Median Household Income | $52,500 | $5 |
| Monthly Housing Costs | $656 | $0 |
| Real Estate Taxes | $1,896 | $2 |
Property Value by Mortgage Status in Sudlersville
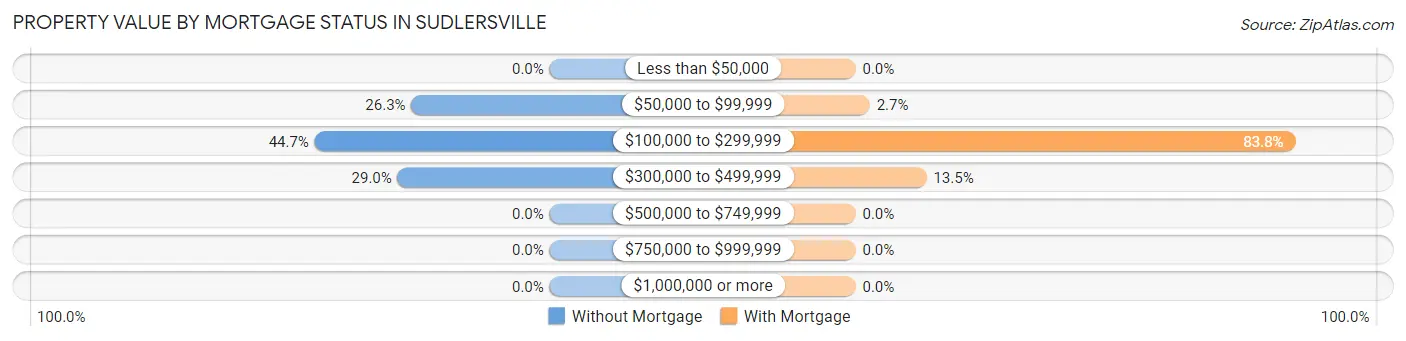
| Property Value | Without Mortgage | With Mortgage |
| Less than $50,000 | 0 (0.0%) | 0 (0.0%) |
| $50,000 to $99,999 | 10 (26.3%) | 1 (2.7%) |
| $100,000 to $299,999 | 17 (44.7%) | 31 (83.8%) |
| $300,000 to $499,999 | 11 (28.9%) | 5 (13.5%) |
| $500,000 to $749,999 | 0 (0.0%) | 0 (0.0%) |
| $750,000 to $999,999 | 0 (0.0%) | 0 (0.0%) |
| $1,000,000 or more | 0 (0.0%) | 0 (0.0%) |
| Total | 38 (100.0%) | 37 (100.0%) |
Household Income by Mortgage Status in Sudlersville
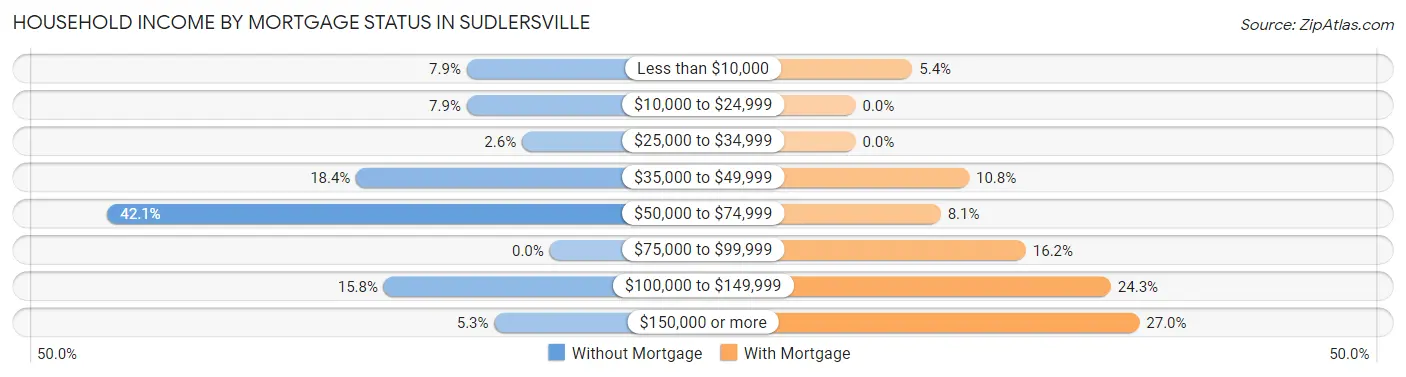
| Household Income | Without Mortgage | With Mortgage |
| Less than $10,000 | 3 (7.9%) | 2 (5.4%) |
| $10,000 to $24,999 | 3 (7.9%) | 0 (0.0%) |
| $25,000 to $34,999 | 1 (2.6%) | 0 (0.0%) |
| $35,000 to $49,999 | 7 (18.4%) | 4 (10.8%) |
| $50,000 to $74,999 | 16 (42.1%) | 3 (8.1%) |
| $75,000 to $99,999 | 0 (0.0%) | 6 (16.2%) |
| $100,000 to $149,999 | 6 (15.8%) | 9 (24.3%) |
| $150,000 or more | 2 (5.3%) | 10 (27.0%) |
| Total | 38 (100.0%) | 37 (100.0%) |
Property Value to Household Income Ratio in Sudlersville
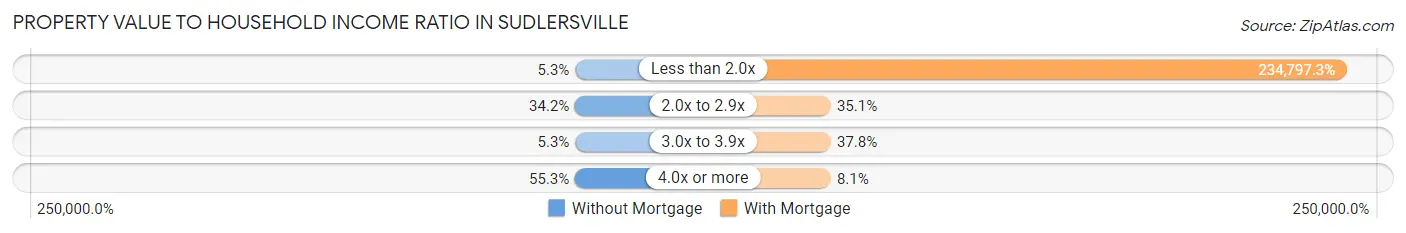
| Value-to-Income Ratio | Without Mortgage | With Mortgage |
| Less than 2.0x | 2 (5.3%) | 86,875 (234,797.3%) |
| 2.0x to 2.9x | 13 (34.2%) | 13 (35.1%) |
| 3.0x to 3.9x | 2 (5.3%) | 14 (37.8%) |
| 4.0x or more | 21 (55.3%) | 3 (8.1%) |
| Total | 38 (100.0%) | 37 (100.0%) |
Real Estate Taxes by Mortgage Status in Sudlersville
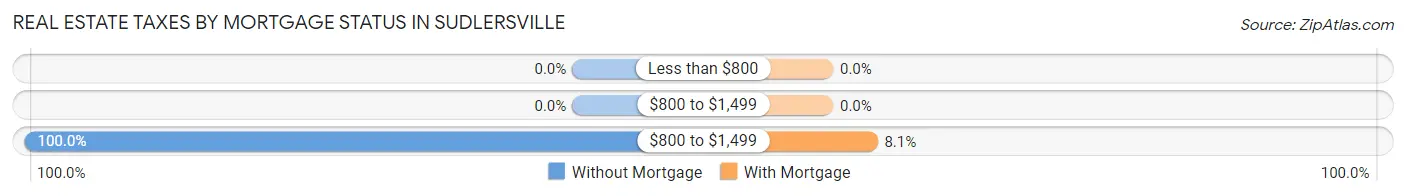
| Property Taxes | Without Mortgage | With Mortgage |
| Less than $800 | 0 (0.0%) | 0 (0.0%) |
| $800 to $1,499 | 0 (0.0%) | 0 (0.0%) |
| $800 to $1,499 | 38 (100.0%) | 3 (8.1%) |
| Total | 38 (100.0%) | 37 (100.0%) |
Health & Disability in Sudlersville
Health Insurance Coverage by Age in Sudlersville
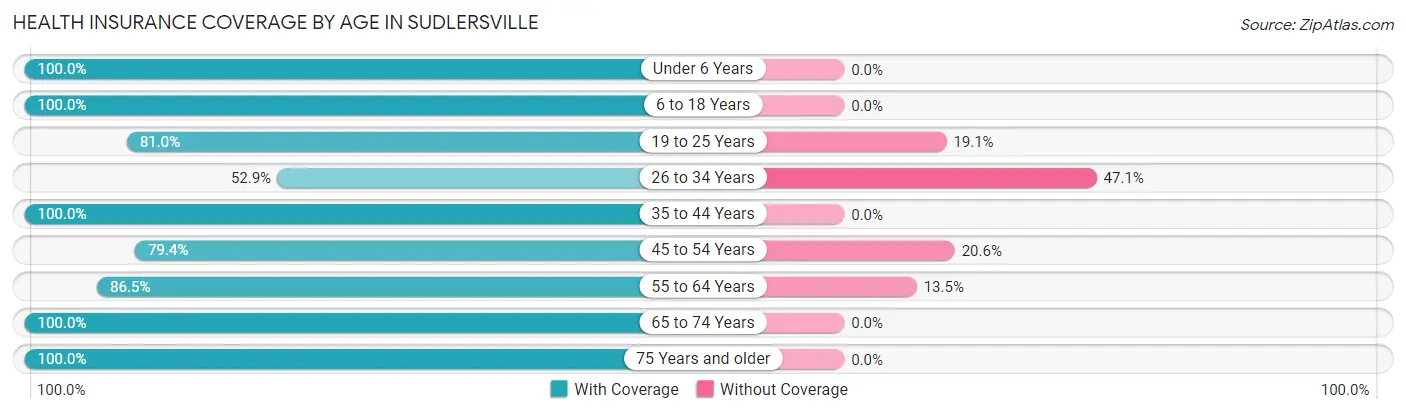
| Age Bracket | With Coverage | Without Coverage |
| Under 6 Years | 20 (100.0%) | 0 (0.0%) |
| 6 to 18 Years | 62 (100.0%) | 0 (0.0%) |
| 19 to 25 Years | 17 (80.9%) | 4 (19.1%) |
| 26 to 34 Years | 27 (52.9%) | 24 (47.1%) |
| 35 to 44 Years | 43 (100.0%) | 0 (0.0%) |
| 45 to 54 Years | 27 (79.4%) | 7 (20.6%) |
| 55 to 64 Years | 32 (86.5%) | 5 (13.5%) |
| 65 to 74 Years | 28 (100.0%) | 0 (0.0%) |
| 75 Years and older | 83 (100.0%) | 0 (0.0%) |
| Total | 339 (89.4%) | 40 (10.5%) |
Health Insurance Coverage by Citizenship Status in Sudlersville
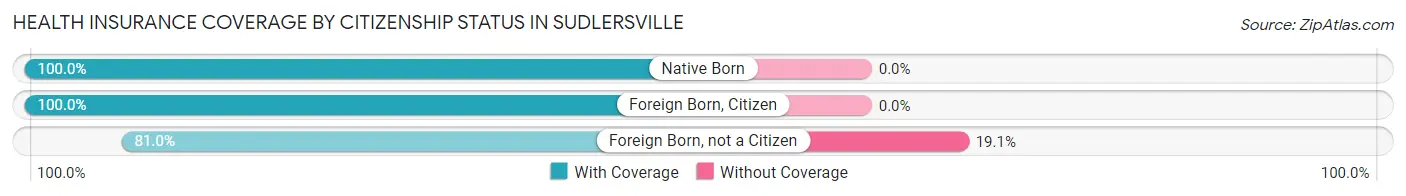
| Citizenship Status | With Coverage | Without Coverage |
| Native Born | 20 (100.0%) | 0 (0.0%) |
| Foreign Born, Citizen | 62 (100.0%) | 0 (0.0%) |
| Foreign Born, not a Citizen | 17 (80.9%) | 4 (19.1%) |
Health Insurance Coverage by Household Income in Sudlersville
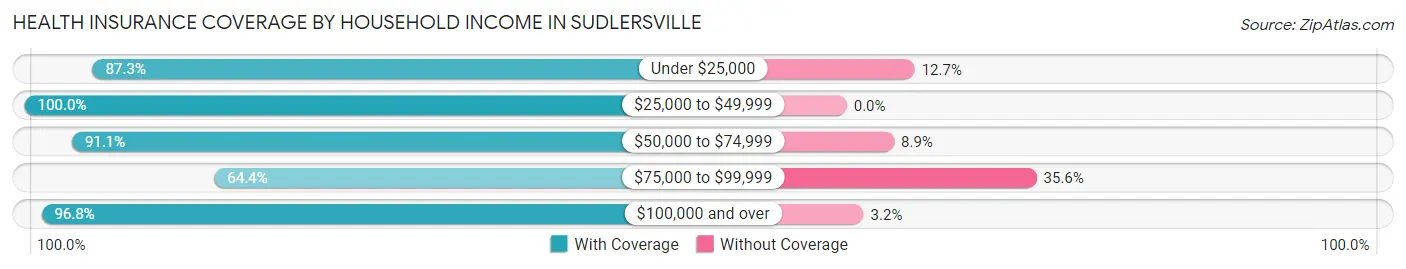
| Household Income | With Coverage | Without Coverage |
| Under $25,000 | 96 (87.3%) | 14 (12.7%) |
| $25,000 to $49,999 | 36 (100.0%) | 0 (0.0%) |
| $50,000 to $74,999 | 72 (91.1%) | 7 (8.9%) |
| $75,000 to $99,999 | 29 (64.4%) | 16 (35.6%) |
| $100,000 and over | 92 (96.8%) | 3 (3.2%) |
Public vs Private Health Insurance Coverage by Age in Sudlersville
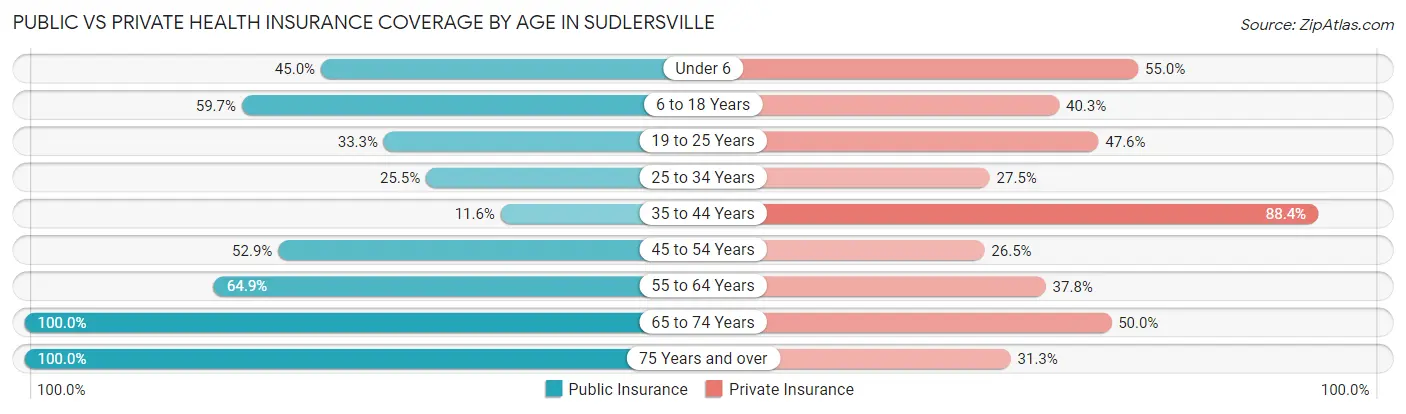
| Age Bracket | Public Insurance | Private Insurance |
| Under 6 | 9 (45.0%) | 11 (55.0%) |
| 6 to 18 Years | 37 (59.7%) | 25 (40.3%) |
| 19 to 25 Years | 7 (33.3%) | 10 (47.6%) |
| 25 to 34 Years | 13 (25.5%) | 14 (27.5%) |
| 35 to 44 Years | 5 (11.6%) | 38 (88.4%) |
| 45 to 54 Years | 18 (52.9%) | 9 (26.5%) |
| 55 to 64 Years | 24 (64.9%) | 14 (37.8%) |
| 65 to 74 Years | 28 (100.0%) | 14 (50.0%) |
| 75 Years and over | 83 (100.0%) | 26 (31.3%) |
| Total | 224 (59.1%) | 161 (42.5%) |
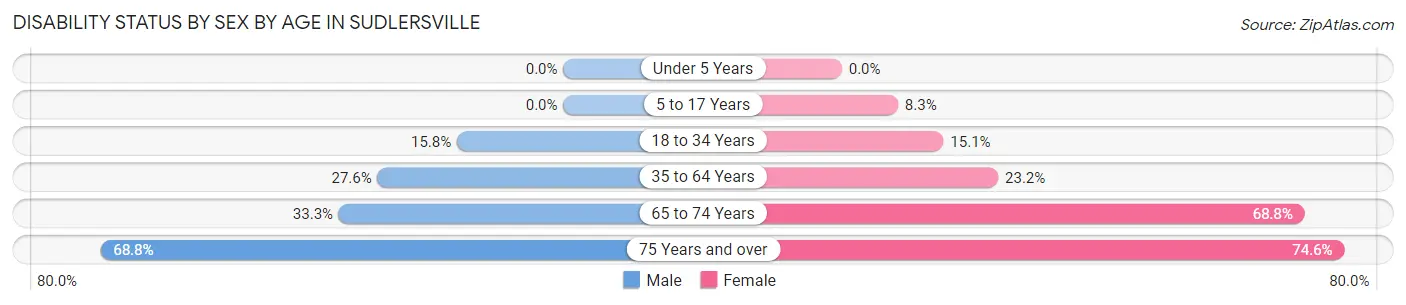
Disability Status by Sex by Age in Sudlersville
| Age Bracket | Male | Female |
| Under 5 Years | 0 (0.0%) | 0 (0.0%) |
| 5 to 17 Years | 0 (0.0%) | 2 (8.3%) |
| 18 to 34 Years | 3 (15.8%) | 8 (15.1%) |
| 35 to 64 Years | 16 (27.6%) | 13 (23.2%) |
| 65 to 74 Years | 4 (33.3%) | 11 (68.8%) |
| 75 Years and over | 11 (68.8%) | 50 (74.6%) |
Disability Class by Sex by Age in Sudlersville
Disability Class: Hearing Difficulty
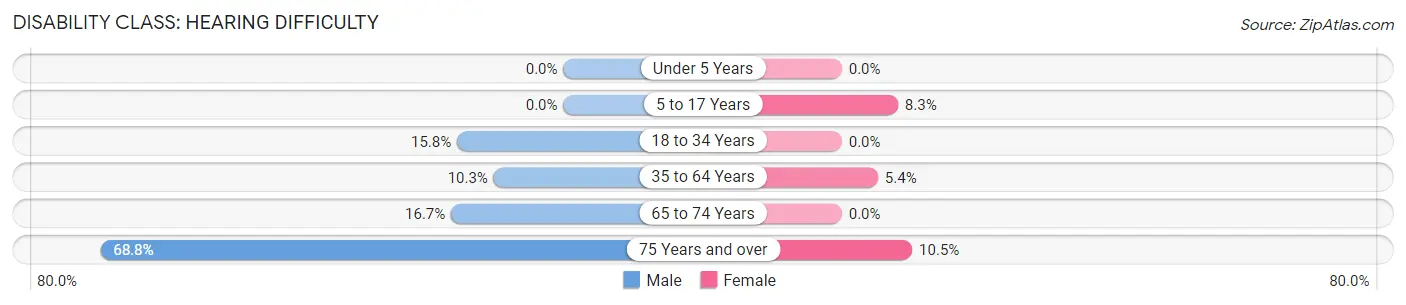
| Age Bracket | Male | Female |
| Under 5 Years | 0 (0.0%) | 0 (0.0%) |
| 5 to 17 Years | 0 (0.0%) | 2 (8.3%) |
| 18 to 34 Years | 3 (15.8%) | 0 (0.0%) |
| 35 to 64 Years | 6 (10.3%) | 3 (5.4%) |
| 65 to 74 Years | 2 (16.7%) | 0 (0.0%) |
| 75 Years and over | 11 (68.8%) | 7 (10.4%) |
Disability Class: Vision Difficulty
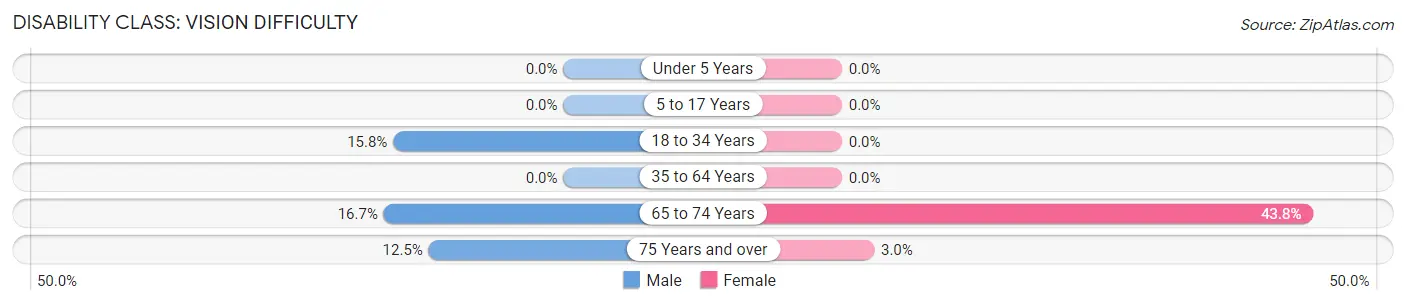
| Age Bracket | Male | Female |
| Under 5 Years | 0 (0.0%) | 0 (0.0%) |
| 5 to 17 Years | 0 (0.0%) | 0 (0.0%) |
| 18 to 34 Years | 3 (15.8%) | 0 (0.0%) |
| 35 to 64 Years | 0 (0.0%) | 0 (0.0%) |
| 65 to 74 Years | 2 (16.7%) | 7 (43.8%) |
| 75 Years and over | 2 (12.5%) | 2 (3.0%) |
Disability Class: Cognitive Difficulty
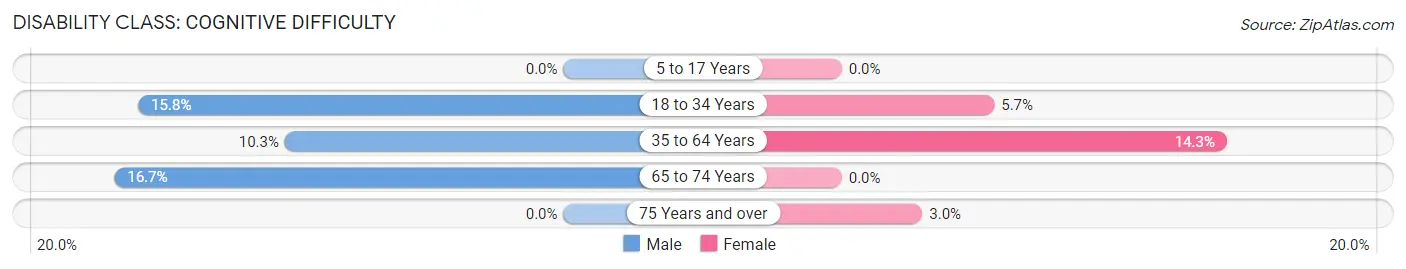
| Age Bracket | Male | Female |
| 5 to 17 Years | 0 (0.0%) | 0 (0.0%) |
| 18 to 34 Years | 3 (15.8%) | 3 (5.7%) |
| 35 to 64 Years | 6 (10.3%) | 8 (14.3%) |
| 65 to 74 Years | 2 (16.7%) | 0 (0.0%) |
| 75 Years and over | 0 (0.0%) | 2 (3.0%) |
Disability Class: Ambulatory Difficulty
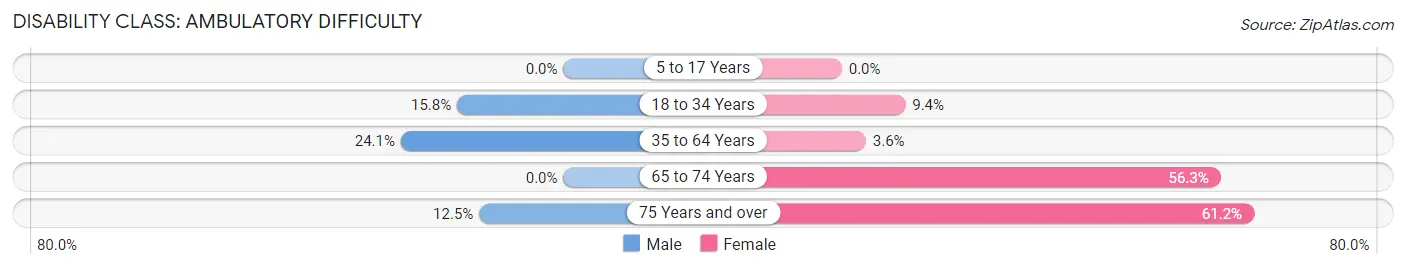
| Age Bracket | Male | Female |
| 5 to 17 Years | 0 (0.0%) | 0 (0.0%) |
| 18 to 34 Years | 3 (15.8%) | 5 (9.4%) |
| 35 to 64 Years | 14 (24.1%) | 2 (3.6%) |
| 65 to 74 Years | 0 (0.0%) | 9 (56.2%) |
| 75 Years and over | 2 (12.5%) | 41 (61.2%) |
Disability Class: Self-Care Difficulty
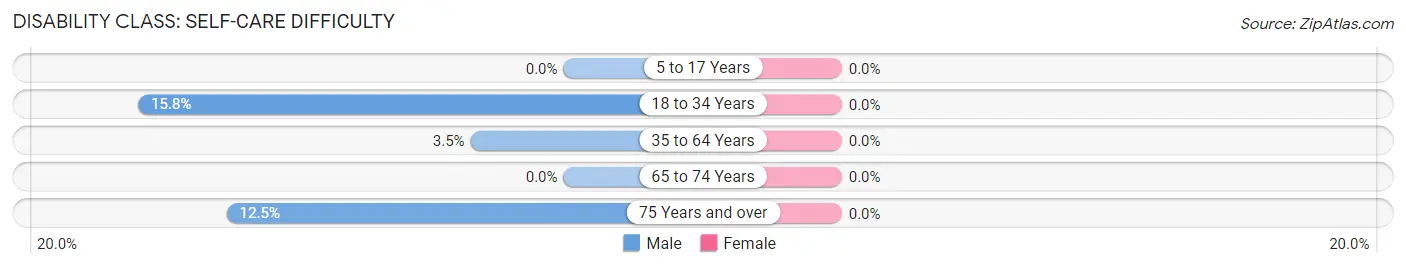
| Age Bracket | Male | Female |
| 5 to 17 Years | 0 (0.0%) | 0 (0.0%) |
| 18 to 34 Years | 3 (15.8%) | 0 (0.0%) |
| 35 to 64 Years | 2 (3.5%) | 0 (0.0%) |
| 65 to 74 Years | 0 (0.0%) | 0 (0.0%) |
| 75 Years and over | 2 (12.5%) | 0 (0.0%) |
Technology Access in Sudlersville
Computing Device Access in Sudlersville
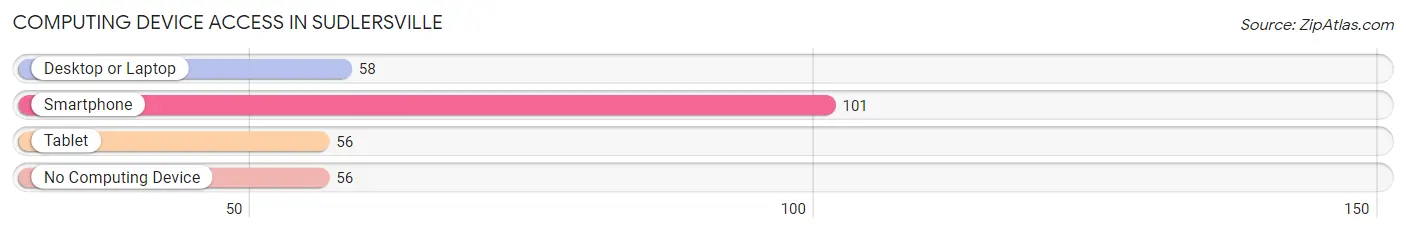
| Device Type | # Households | % Households |
| Desktop or Laptop | 58 | 34.9% |
| Smartphone | 101 | 60.8% |
| Tablet | 56 | 33.7% |
| No Computing Device | 56 | 33.7% |
| Total | 166 | 100.0% |
Internet Access in Sudlersville
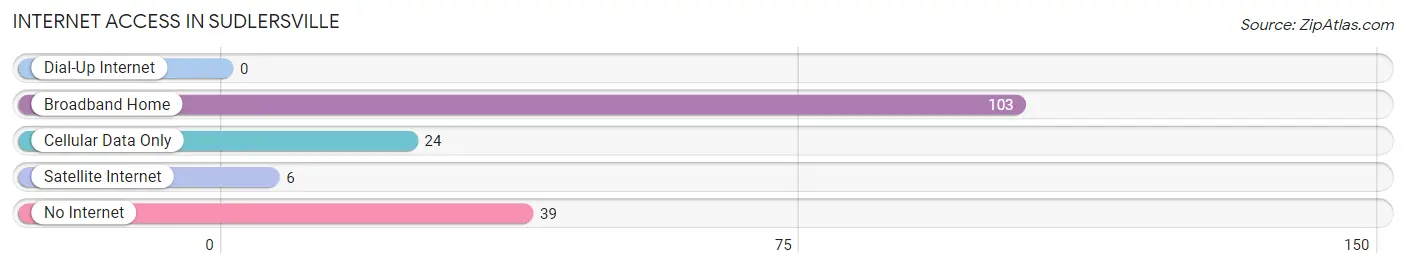
| Internet Type | # Households | % Households |
| Dial-Up Internet | 0 | 0.0% |
| Broadband Home | 103 | 62.1% |
| Cellular Data Only | 24 | 14.5% |
| Satellite Internet | 6 | 3.6% |
| No Internet | 39 | 23.5% |
| Total | 166 | 100.0% |
Sudlersville Summary
Sudlersville is a small town located in Queen Anne’s County, Maryland. It is situated on the Eastern Shore of the Chesapeake Bay, approximately 25 miles south of the state capital of Annapolis. The town was founded in 1810 and named after the Sudler family, who were among the first settlers in the area. The population of Sudlersville was 1,093 at the 2010 census.
History
The area that is now Sudlersville was first settled in the early 1700s by the Sudler family, who were among the first settlers in the area. The town was officially founded in 1810 and named after the Sudler family. The town was originally a farming community, but it soon developed into a small industrial center. The town was home to several factories, including a canning factory, a brickyard, and a sawmill.
In the late 19th century, the town was a popular stop on the Baltimore and Ohio Railroad. The railroad brought tourists and visitors to the town, and it also provided a convenient way for local farmers to transport their goods to market.
Geography
Sudlersville is located in Queen Anne’s County, Maryland. It is situated on the Eastern Shore of the Chesapeake Bay, approximately 25 miles south of the state capital of Annapolis. The town is located at the intersection of Maryland Route 313 and Maryland Route 309.
The town is located in a rural area, and it is surrounded by farmland and woodlands. The nearest major city is Baltimore, which is approximately 50 miles to the north.
Economy
The economy of Sudlersville is largely based on agriculture and tourism. The town is home to several farms, which produce a variety of crops, including corn, soybeans, and wheat. The town is also home to several wineries, which produce a variety of wines.
The town is also a popular tourist destination. The town is home to several historic sites, including the Sudlersville Historic District, which is listed on the National Register of Historic Places. The town is also home to several parks and recreational areas, including the Sudlersville Park and the Sudlersville Nature Center.
Demographics
As of the 2010 census, the population of Sudlersville was 1,093. The racial makeup of the town was 94.3% White, 2.7% African American, 0.2% Native American, 0.7% Asian, 0.1% Pacific Islander, 0.7% from other races, and 1.2% from two or more races. Hispanic or Latino of any race were 1.7% of the population.
The median income for a household in the town was $50,000, and the median income for a family was $54,375. The per capita income for the town was $20,945. About 8.3% of families and 10.2% of the population were below the poverty line, including 14.3% of those under age 18 and 8.3% of those age 65 or over.
Common Questions
What is Per Capita Income in Sudlersville?
Per Capita income in Sudlersville is $24,288.
What is the Median Family Income in Sudlersville?
Median Family Income in Sudlersville is $64,167.
What is the Median Household income in Sudlersville?
Median Household Income in Sudlersville is $40,000.
What is Income or Wage Gap in Sudlersville?
Income or Wage Gap in Sudlersville is 3.2%.
Women in Sudlersville earn 96.8 cents for every dollar earned by a man.
What is Inequality or Gini Index in Sudlersville?
Inequality or Gini Index in Sudlersville is 0.43.
What is the Total Population of Sudlersville?
Total Population of Sudlersville is 379.
What is the Total Male Population of Sudlersville?
Total Male Population of Sudlersville is 154.
What is the Total Female Population of Sudlersville?
Total Female Population of Sudlersville is 225.
What is the Ratio of Males per 100 Females in Sudlersville?
There are 68.44 Males per 100 Females in Sudlersville.
What is the Ratio of Females per 100 Males in Sudlersville?
There are 146.10 Females per 100 Males in Sudlersville.
What is the Median Population Age in Sudlersville?
Median Population Age in Sudlersville is 44.4 Years.
What is the Average Family Size in Sudlersville
Average Family Size in Sudlersville is 3.4 People.
What is the Average Household Size in Sudlersville
Average Household Size in Sudlersville is 2.2 People.
How Large is the Labor Force in Sudlersville?
There are 177 People in the Labor Forcein in Sudlersville.
What is the Percentage of People in the Labor Force in Sudlersville?
59.4% of People are in the Labor Force in Sudlersville.
What is the Unemployment Rate in Sudlersville?
Unemployment Rate in Sudlersville is 5.1%.