Cities with the Highest Percentage of Swedish Population in Alabama
RELATED REPORTS & OPTIONS
Swedish
Alabama
Compare Cities
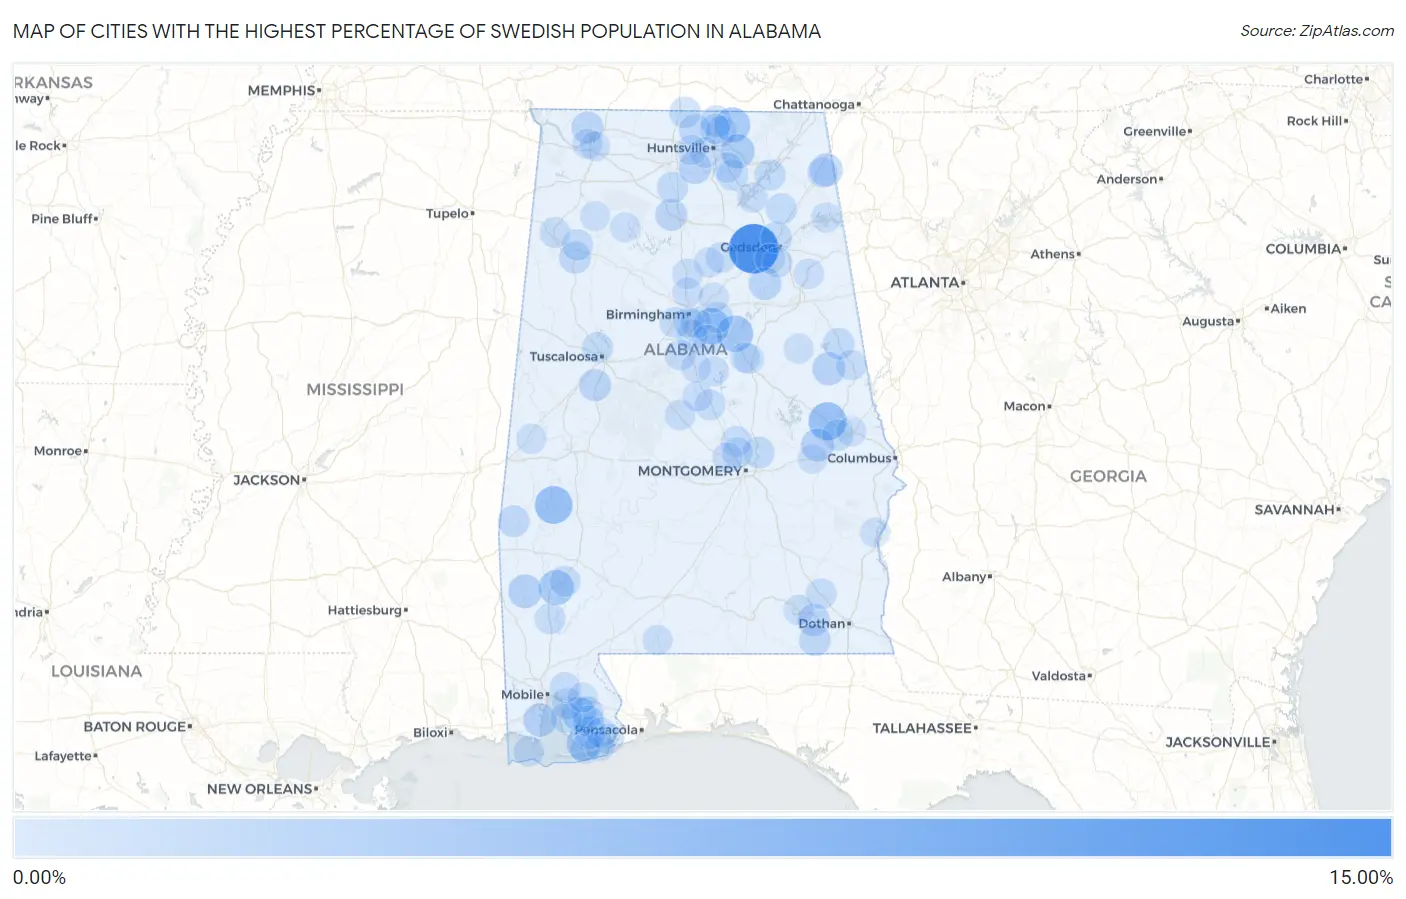
Map of Cities with the Highest Percentage of Swedish Population in Alabama
0.00%
15.00%
Cities with the Highest Percentage of Swedish Population in Alabama
| City | Swedish | vs State | vs National | |
| 1. | Gallant | 10.89% | 0.30%(+10.6)#1 | 1.05%(+9.84)#556 |
| 2. | Pea Ridge | 7.43% | 0.30%(+7.14)#2 | 1.05%(+6.39)#1,083 |
| 3. | Waverly | 4.44% | 0.30%(+4.14)#3 | 1.05%(+3.39)#2,350 |
| 4. | Nanafalia | 4.35% | 0.30%(+4.05)#4 | 1.05%(+3.30)#2,410 |
| 5. | Vincent | 3.57% | 0.30%(+3.28)#5 | 1.05%(+2.53)#3,082 |
| 6. | Shoal Creek | 3.50% | 0.30%(+3.21)#6 | 1.05%(+2.45)#3,157 |
| 7. | New Market | 3.01% | 0.30%(+2.72)#7 | 1.05%(+1.97)#3,787 |
| 8. | Leroy | 2.92% | 0.30%(+2.63)#8 | 1.05%(+1.87)#3,922 |
| 9. | Gurley | 2.59% | 0.30%(+2.29)#9 | 1.05%(+1.54)#4,485 |
| 10. | Bon Secour | 2.58% | 0.30%(+2.28)#10 | 1.05%(+1.53)#4,503 |
| 11. | Silverhill | 2.25% | 0.30%(+1.95)#11 | 1.05%(+1.20)#5,163 |
| 12. | Chatom | 2.14% | 0.30%(+1.84)#12 | 1.05%(+1.09)#5,432 |
| 13. | Belle Fontaine | 2.00% | 0.30%(+1.71)#13 | 1.05%(+0.954)#5,776 |
| 14. | Wadley | 1.89% | 0.30%(+1.60)#14 | 1.05%(+0.846)#6,113 |
| 15. | Notasulga | 1.86% | 0.30%(+1.57)#15 | 1.05%(+0.815)#6,215 |
| 16. | Mentone | 1.75% | 0.30%(+1.46)#16 | 1.05%(+0.706)#6,535 |
| 17. | Triana | 1.73% | 0.30%(+1.44)#17 | 1.05%(+0.686)#6,591 |
| 18. | Ragland | 1.61% | 0.30%(+1.32)#18 | 1.05%(+0.562)#7,002 |
| 19. | Foley | 1.51% | 0.30%(+1.22)#19 | 1.05%(+0.463)#7,363 |
| 20. | Clayhatchee | 1.41% | 0.30%(+1.11)#20 | 1.05%(+0.357)#7,769 |
| 21. | Moundville | 1.39% | 0.30%(+1.09)#21 | 1.05%(+0.338)#7,863 |
| 22. | West Point | 1.31% | 0.30%(+1.01)#22 | 1.05%(+0.257)#8,220 |
| 23. | Underwood Petersville | 1.30% | 0.30%(+1.00)#23 | 1.05%(+0.252)#8,243 |
| 24. | Winfield | 1.26% | 0.30%(+0.967)#24 | 1.05%(+0.214)#8,439 |
| 25. | Hartford | 1.24% | 0.30%(+0.945)#25 | 1.05%(+0.192)#8,521 |
| 26. | Harvest | 1.17% | 0.30%(+0.874)#26 | 1.05%(+0.121)#8,839 |
| 27. | Robertsdale | 1.16% | 0.30%(+0.867)#27 | 1.05%(+0.115)#8,863 |
| 28. | Needham | 1.12% | 0.30%(+0.828)#28 | 1.05%(+0.075)#9,085 |
| 29. | Blue Ridge | 1.09% | 0.30%(+0.796)#29 | 1.05%(+0.044)#9,252 |
| 30. | Hazel Green | 1.06% | 0.30%(+0.762)#30 | 1.05%(+0.009)#9,440 |
| 31. | Summerdale | 1.00% | 0.30%(+0.706)#31 | 1.05%(-0.046)#9,746 |
| 32. | Ardmore | 1.00% | 0.30%(+0.701)#32 | 1.05%(-0.051)#9,779 |
| 33. | Wedowee | 0.99% | 0.30%(+0.698)#33 | 1.05%(-0.055)#9,803 |
| 34. | Reece City | 0.98% | 0.30%(+0.689)#34 | 1.05%(-0.064)#9,845 |
| 35. | New Hope | 0.94% | 0.30%(+0.643)#35 | 1.05%(-0.109)#10,105 |
| 36. | Moores Mill | 0.88% | 0.30%(+0.587)#36 | 1.05%(-0.166)#10,411 |
| 37. | Auburn | 0.88% | 0.30%(+0.586)#37 | 1.05%(-0.167)#10,415 |
| 38. | Brilliant | 0.87% | 0.30%(+0.578)#38 | 1.05%(-0.175)#10,461 |
| 39. | Langston | 0.83% | 0.30%(+0.538)#39 | 1.05%(-0.215)#10,741 |
| 40. | Hoover | 0.82% | 0.30%(+0.525)#40 | 1.05%(-0.228)#10,819 |
| 41. | Hartselle | 0.81% | 0.30%(+0.515)#41 | 1.05%(-0.237)#10,875 |
| 42. | Dunnavant | 0.79% | 0.30%(+0.498)#42 | 1.05%(-0.255)#10,974 |
| 43. | Daphne | 0.79% | 0.30%(+0.494)#43 | 1.05%(-0.259)#11,000 |
| 44. | Crossville | 0.78% | 0.30%(+0.487)#44 | 1.05%(-0.265)#11,051 |
| 45. | Fairhope | 0.78% | 0.30%(+0.483)#45 | 1.05%(-0.270)#11,080 |
| 46. | Northport | 0.77% | 0.30%(+0.479)#46 | 1.05%(-0.274)#11,100 |
| 47. | Spanish Fort | 0.75% | 0.30%(+0.458)#47 | 1.05%(-0.295)#11,246 |
| 48. | Jackson | 0.74% | 0.30%(+0.446)#48 | 1.05%(-0.307)#11,342 |
| 49. | Brantleyville | 0.70% | 0.30%(+0.403)#49 | 1.05%(-0.350)#11,626 |
| 50. | Vestavia Hills | 0.69% | 0.30%(+0.399)#50 | 1.05%(-0.354)#11,655 |
| 51. | Oneonta | 0.69% | 0.30%(+0.397)#51 | 1.05%(-0.355)#11,662 |
| 52. | Hamilton | 0.68% | 0.30%(+0.387)#52 | 1.05%(-0.365)#11,731 |
| 53. | Midfield | 0.68% | 0.30%(+0.383)#53 | 1.05%(-0.370)#11,764 |
| 54. | Deatsville | 0.68% | 0.30%(+0.380)#54 | 1.05%(-0.372)#11,778 |
| 55. | Dauphin Island | 0.67% | 0.30%(+0.373)#55 | 1.05%(-0.379)#11,832 |
| 56. | Millbrook | 0.67% | 0.30%(+0.372)#56 | 1.05%(-0.381)#11,847 |
| 57. | Eagle Point | 0.66% | 0.30%(+0.360)#57 | 1.05%(-0.393)#11,923 |
| 58. | Mcintosh | 0.63% | 0.30%(+0.339)#58 | 1.05%(-0.413)#12,082 |
| 59. | Ozark | 0.62% | 0.30%(+0.323)#59 | 1.05%(-0.429)#12,196 |
| 60. | Maplesville | 0.62% | 0.30%(+0.320)#60 | 1.05%(-0.433)#12,213 |
| 61. | Clanton | 0.62% | 0.30%(+0.320)#61 | 1.05%(-0.433)#12,220 |
| 62. | Roanoke | 0.60% | 0.30%(+0.303)#62 | 1.05%(-0.450)#12,339 |
| 63. | Homewood | 0.59% | 0.30%(+0.296)#63 | 1.05%(-0.457)#12,405 |
| 64. | Huntsville | 0.59% | 0.30%(+0.290)#64 | 1.05%(-0.462)#12,448 |
| 65. | Prattville | 0.58% | 0.30%(+0.289)#65 | 1.05%(-0.463)#12,451 |
| 66. | Chelsea | 0.58% | 0.30%(+0.283)#66 | 1.05%(-0.469)#12,488 |
| 67. | Jacksonville | 0.58% | 0.30%(+0.281)#67 | 1.05%(-0.472)#12,512 |
| 68. | Elberta | 0.56% | 0.30%(+0.265)#68 | 1.05%(-0.488)#12,630 |
| 69. | Owens Cross Roads | 0.55% | 0.30%(+0.250)#69 | 1.05%(-0.503)#12,770 |
| 70. | Guntersville | 0.53% | 0.30%(+0.236)#70 | 1.05%(-0.516)#12,878 |
| 71. | Sylacauga | 0.52% | 0.30%(+0.226)#71 | 1.05%(-0.527)#12,974 |
| 72. | Thorsby | 0.51% | 0.30%(+0.214)#72 | 1.05%(-0.539)#13,079 |
| 73. | Sheffield | 0.50% | 0.30%(+0.208)#73 | 1.05%(-0.545)#13,136 |
| 74. | Shelby | 0.50% | 0.30%(+0.205)#74 | 1.05%(-0.548)#13,156 |
| 75. | Warrior | 0.50% | 0.30%(+0.203)#75 | 1.05%(-0.549)#13,181 |
| 76. | Valley Head | 0.49% | 0.30%(+0.198)#76 | 1.05%(-0.555)#13,229 |
| 77. | Madison | 0.46% | 0.30%(+0.168)#77 | 1.05%(-0.585)#13,508 |
| 78. | Calera | 0.46% | 0.30%(+0.167)#78 | 1.05%(-0.586)#13,514 |
| 79. | Southside | 0.46% | 0.30%(+0.164)#79 | 1.05%(-0.589)#13,536 |
| 80. | Enterprise | 0.46% | 0.30%(+0.164)#80 | 1.05%(-0.589)#13,537 |
| 81. | Perdido Beach | 0.43% | 0.30%(+0.135)#81 | 1.05%(-0.617)#13,807 |
| 82. | Meridianville | 0.43% | 0.30%(+0.135)#82 | 1.05%(-0.618)#13,818 |
| 83. | Brewton | 0.42% | 0.30%(+0.123)#83 | 1.05%(-0.630)#13,935 |
| 84. | Gardendale | 0.41% | 0.30%(+0.115)#84 | 1.05%(-0.637)#13,998 |
| 85. | Rainbow City | 0.39% | 0.30%(+0.097)#85 | 1.05%(-0.656)#14,211 |
| 86. | Haleyville | 0.39% | 0.30%(+0.096)#86 | 1.05%(-0.657)#14,231 |
| 87. | Locust Fork | 0.38% | 0.30%(+0.084)#87 | 1.05%(-0.668)#14,340 |
| 88. | Opelika | 0.37% | 0.30%(+0.074)#88 | 1.05%(-0.679)#14,433 |
| 89. | Eufaula | 0.37% | 0.30%(+0.073)#89 | 1.05%(-0.680)#14,443 |
| 90. | Double Springs | 0.37% | 0.30%(+0.072)#90 | 1.05%(-0.681)#14,453 |
| 91. | Livingston | 0.36% | 0.30%(+0.068)#91 | 1.05%(-0.684)#14,497 |
| 92. | Gulf Shores | 0.36% | 0.30%(+0.067)#92 | 1.05%(-0.686)#14,518 |
| 93. | Orange Beach | 0.36% | 0.30%(+0.065)#93 | 1.05%(-0.688)#14,538 |
| 94. | Cedar Bluff | 0.36% | 0.30%(+0.063)#94 | 1.05%(-0.690)#14,555 |
| 95. | Ashland | 0.36% | 0.30%(+0.063)#95 | 1.05%(-0.690)#14,564 |
| 96. | Trussville | 0.35% | 0.30%(+0.052)#96 | 1.05%(-0.701)#14,664 |
| 97. | Loxley | 0.35% | 0.30%(+0.050)#97 | 1.05%(-0.702)#14,675 |
| 98. | Muscle Shoals | 0.34% | 0.30%(+0.047)#98 | 1.05%(-0.706)#14,707 |
| 99. | Tuskegee | 0.33% | 0.30%(+0.031)#99 | 1.05%(-0.721)#14,852 |
| 100. | Oak Grove | 0.32% | 0.30%(+0.027)#100 | 1.05%(-0.726)#14,888 |
Common Questions
What are the Top 10 Cities with the Highest Percentage of Swedish Population in Alabama?
Top 10 Cities with the Highest Percentage of Swedish Population in Alabama are:
#1
10.89%
#2
4.44%
#3
4.35%
#4
3.57%
#5
3.50%
#6
3.01%
#7
2.92%
#8
2.59%
#9
2.58%
#10
2.25%
What city has the Highest Percentage of Swedish Population in Alabama?
Gallant has the Highest Percentage of Swedish Population in Alabama with 10.89%.
What is the Percentage of Swedish Population in the State of Alabama?
Percentage of Swedish Population in Alabama is 0.30%.
What is the Percentage of Swedish Population in the United States?
Percentage of Swedish Population in the United States is 1.05%.