Sharpsburg, MD Map & Demographics
Sharpsburg Map
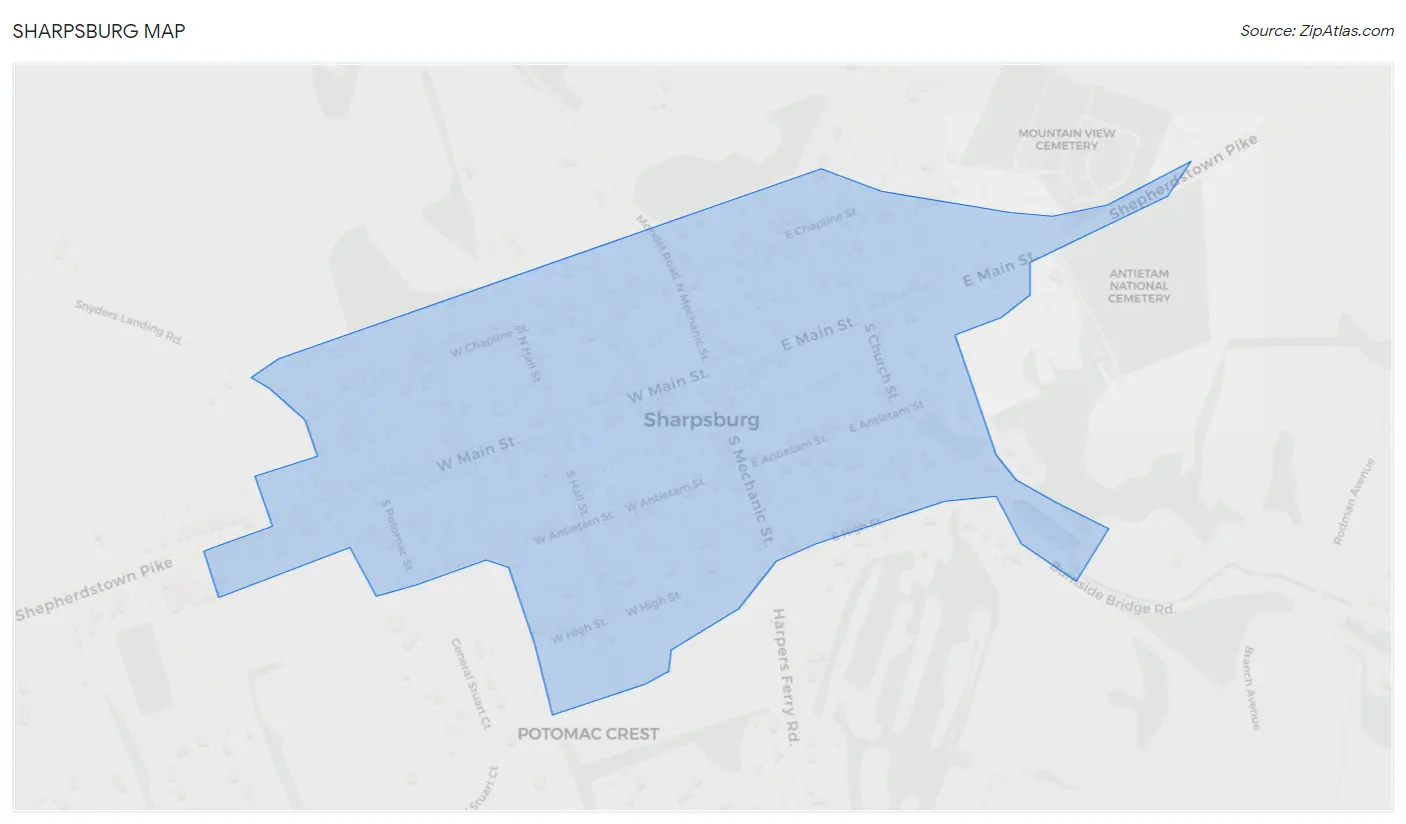
Sharpsburg Overview
$41,050
PER CAPITA INCOME
$88,594
AVG FAMILY INCOME
$69,722
AVG HOUSEHOLD INCOME
11.7%
WAGE / INCOME GAP [ % ]
88.3¢/ $1
WAGE / INCOME GAP [ $ ]
0.37
INEQUALITY / GINI INDEX
722
TOTAL POPULATION
412
MALE POPULATION
310
FEMALE POPULATION
132.90
MALES / 100 FEMALES
75.24
FEMALES / 100 MALES
47.3
MEDIAN AGE
2.8
AVG FAMILY SIZE
2.1
AVG HOUSEHOLD SIZE
417
LABOR FORCE [ PEOPLE ]
66.6%
PERCENT IN LABOR FORCE
0.7%
UNEMPLOYMENT RATE
Sharpsburg Zip Codes
Sharpsburg Area Codes
Income in Sharpsburg
Income Overview in Sharpsburg
Per Capita Income in Sharpsburg is $41,050, while median incomes of families and households are $88,594 and $69,722 respectively.
| Characteristic | Number | Measure |
| Per Capita Income | 722 | $41,050 |
| Median Family Income | 185 | $88,594 |
| Mean Family Income | 185 | $92,765 |
| Median Household Income | 338 | $69,722 |
| Mean Household Income | 338 | $86,244 |
| Income Deficit | 185 | $0 |
| Wage / Income Gap (%) | 722 | 11.69% |
| Wage / Income Gap ($) | 722 | 88.31¢ per $1 |
| Gini / Inequality Index | 722 | 0.37 |
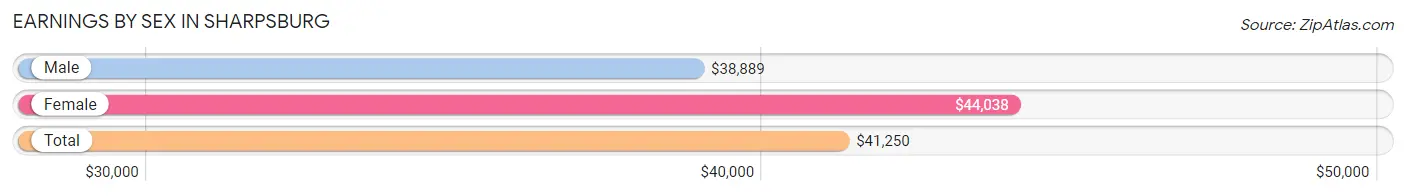
Earnings by Sex in Sharpsburg
Average Earnings in Sharpsburg are $41,250, $38,889 for men and $44,038 for women, a difference of 11.7%.
| Sex | Number | Average Earnings |
| Male | 250 (56.8%) | $38,889 |
| Female | 190 (43.2%) | $44,038 |
| Total | 440 (100.0%) | $41,250 |
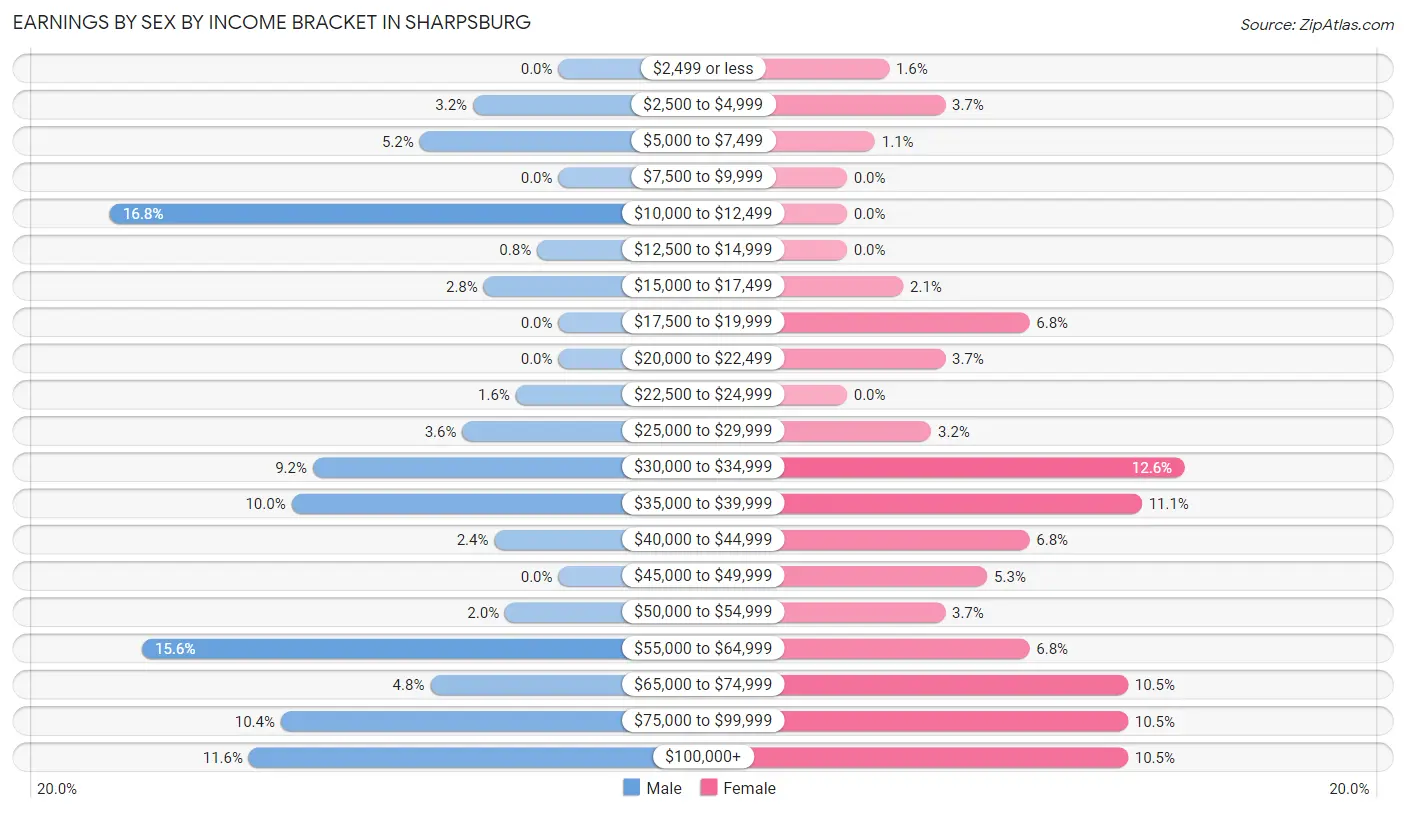
Earnings by Sex by Income Bracket in Sharpsburg
The most common earnings brackets in Sharpsburg are $10,000 to $12,499 for men (42 | 16.8%) and $30,000 to $34,999 for women (24 | 12.6%).
| Income | Male | Female |
| $2,499 or less | 0 (0.0%) | 3 (1.6%) |
| $2,500 to $4,999 | 8 (3.2%) | 7 (3.7%) |
| $5,000 to $7,499 | 13 (5.2%) | 2 (1.1%) |
| $7,500 to $9,999 | 0 (0.0%) | 0 (0.0%) |
| $10,000 to $12,499 | 42 (16.8%) | 0 (0.0%) |
| $12,500 to $14,999 | 2 (0.8%) | 0 (0.0%) |
| $15,000 to $17,499 | 7 (2.8%) | 4 (2.1%) |
| $17,500 to $19,999 | 0 (0.0%) | 13 (6.8%) |
| $20,000 to $22,499 | 0 (0.0%) | 7 (3.7%) |
| $22,500 to $24,999 | 4 (1.6%) | 0 (0.0%) |
| $25,000 to $29,999 | 9 (3.6%) | 6 (3.2%) |
| $30,000 to $34,999 | 23 (9.2%) | 24 (12.6%) |
| $35,000 to $39,999 | 25 (10.0%) | 21 (11.1%) |
| $40,000 to $44,999 | 6 (2.4%) | 13 (6.8%) |
| $45,000 to $49,999 | 0 (0.0%) | 10 (5.3%) |
| $50,000 to $54,999 | 5 (2.0%) | 7 (3.7%) |
| $55,000 to $64,999 | 39 (15.6%) | 13 (6.8%) |
| $65,000 to $74,999 | 12 (4.8%) | 20 (10.5%) |
| $75,000 to $99,999 | 26 (10.4%) | 20 (10.5%) |
| $100,000+ | 29 (11.6%) | 20 (10.5%) |
| Total | 250 (100.0%) | 190 (100.0%) |
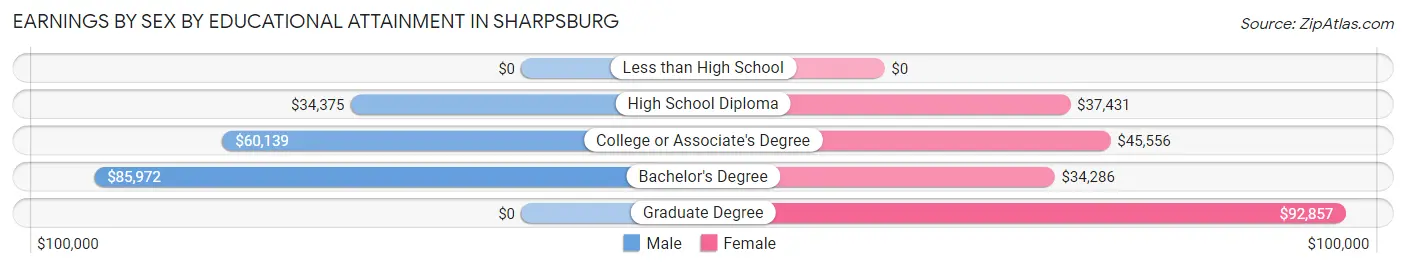
Earnings by Sex by Educational Attainment in Sharpsburg
Average earnings in Sharpsburg are $44,167 for men and $45,278 for women, a difference of 2.5%. Men with an educational attainment of bachelor's degree enjoy the highest average annual earnings of $85,972, while those with high school diploma education earn the least with $34,375. Women with an educational attainment of graduate degree earn the most with the average annual earnings of $92,857, while those with bachelor's degree education have the smallest earnings of $34,286.
| Educational Attainment | Male Income | Female Income |
| Less than High School | - | - |
| High School Diploma | $34,375 | $37,431 |
| College or Associate's Degree | $60,139 | $45,556 |
| Bachelor's Degree | $85,972 | $34,286 |
| Graduate Degree | - | - |
| Total | $44,167 | $45,278 |
Family Income in Sharpsburg
Family Income Brackets in Sharpsburg
According to the Sharpsburg family income data, there are 46 families falling into the $75,000 to $99,999 income range, which is the most common income bracket and makes up 24.9% of all families.
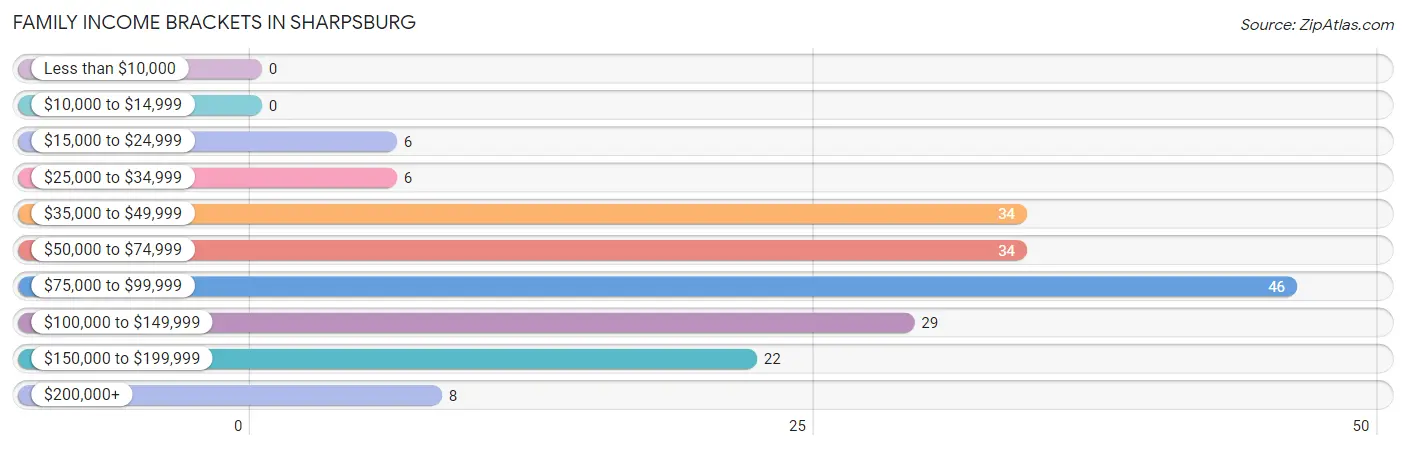
| Income Bracket | # Families | % Families |
| Less than $10,000 | 0 | 0.0% |
| $10,000 to $14,999 | 0 | 0.0% |
| $15,000 to $24,999 | 6 | 3.2% |
| $25,000 to $34,999 | 6 | 3.2% |
| $35,000 to $49,999 | 34 | 18.4% |
| $50,000 to $74,999 | 34 | 18.4% |
| $75,000 to $99,999 | 46 | 24.9% |
| $100,000 to $149,999 | 29 | 15.7% |
| $150,000 to $199,999 | 22 | 11.9% |
| $200,000+ | 8 | 4.3% |
Family Income by Famaliy Size in Sharpsburg
4-person families (22 | 11.9%) account for the highest median family income in Sharpsburg with $119,375 per family, while 3-person families (42 | 22.7%) have the highest median income of $31,806 per family member.
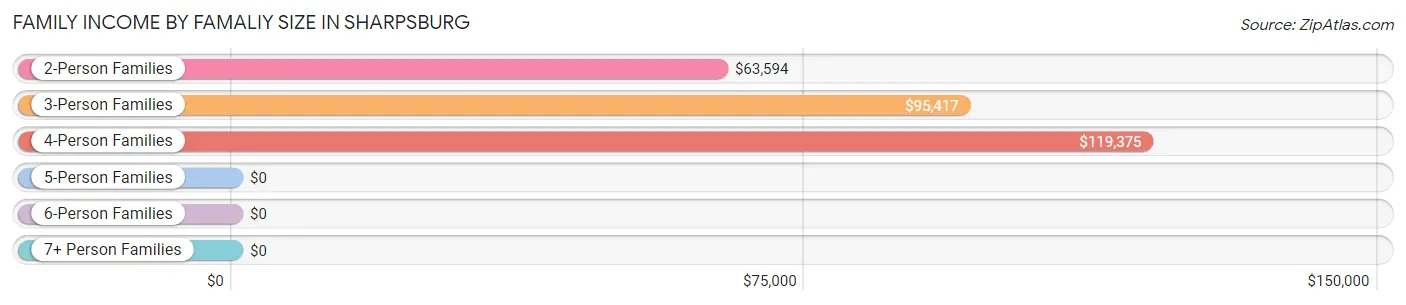
| Income Bracket | # Families | Median Income |
| 2-Person Families | 115 (62.2%) | $63,594 |
| 3-Person Families | 42 (22.7%) | $95,417 |
| 4-Person Families | 22 (11.9%) | $119,375 |
| 5-Person Families | 6 (3.2%) | $0 |
| 6-Person Families | 0 (0.0%) | $0 |
| 7+ Person Families | 0 (0.0%) | $0 |
| Total | 185 (100.0%) | $88,594 |
Family Income by Number of Earners in Sharpsburg
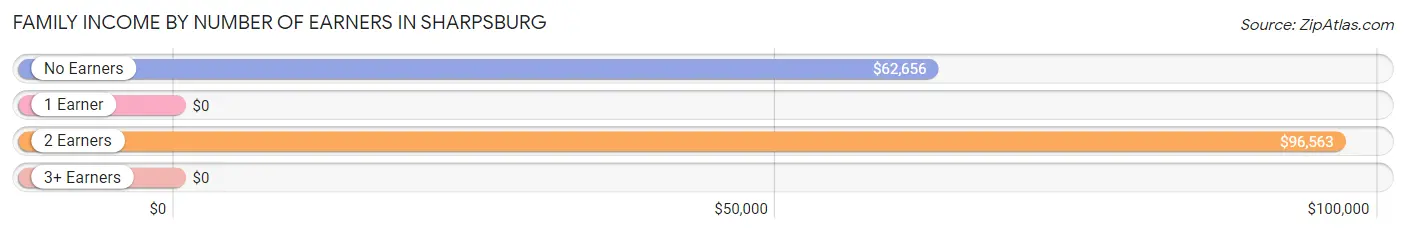
| Number of Earners | # Families | Median Income |
| No Earners | 17 (9.2%) | $62,656 |
| 1 Earner | 86 (46.5%) | $0 |
| 2 Earners | 77 (41.6%) | $96,563 |
| 3+ Earners | 5 (2.7%) | $0 |
| Total | 185 (100.0%) | $88,594 |
Household Income in Sharpsburg
Household Income Brackets in Sharpsburg
With 93 households falling in the category, the $50,000 to $74,999 income range is the most frequent in Sharpsburg, accounting for 27.5% of all households.
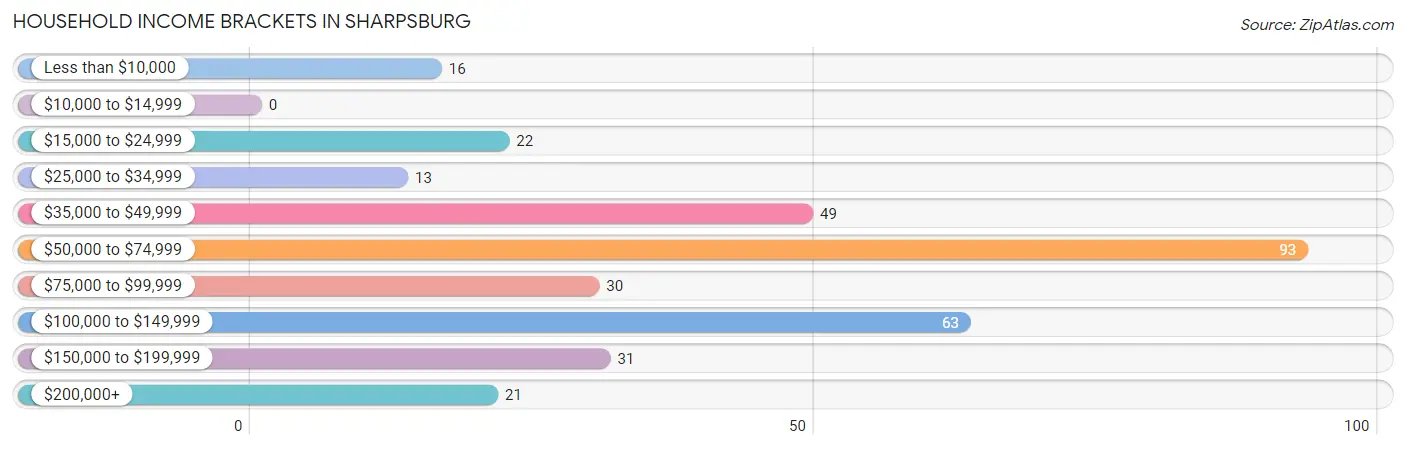
| Income Bracket | # Households | % Households |
| Less than $10,000 | 16 | 4.7% |
| $10,000 to $14,999 | 0 | 0.0% |
| $15,000 to $24,999 | 22 | 6.5% |
| $25,000 to $34,999 | 13 | 3.8% |
| $35,000 to $49,999 | 49 | 14.5% |
| $50,000 to $74,999 | 93 | 27.5% |
| $75,000 to $99,999 | 30 | 8.9% |
| $100,000 to $149,999 | 63 | 18.6% |
| $150,000 to $199,999 | 31 | 9.2% |
| $200,000+ | 21 | 6.2% |
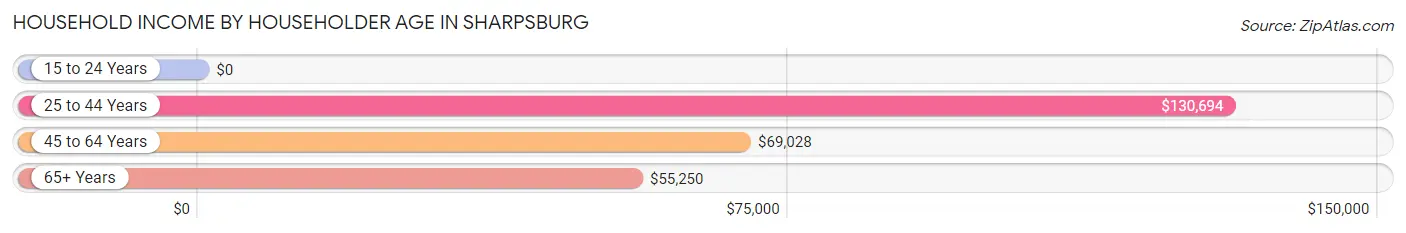
Household Income by Householder Age in Sharpsburg
The median household income in Sharpsburg is $69,722, with the highest median household income of $130,694 found in the 25 to 44 years age bracket for the primary householder. A total of 62 households (18.3%) fall into this category. Meanwhile, the 15 to 24 years age bracket for the primary householder has the lowest median household income of $0, with 8 households (2.4%) in this group.
| Income Bracket | # Households | Median Income |
| 15 to 24 Years | 8 (2.4%) | $0 |
| 25 to 44 Years | 62 (18.3%) | $130,694 |
| 45 to 64 Years | 135 (39.9%) | $69,028 |
| 65+ Years | 133 (39.4%) | $55,250 |
| Total | 338 (100.0%) | $69,722 |
Poverty in Sharpsburg
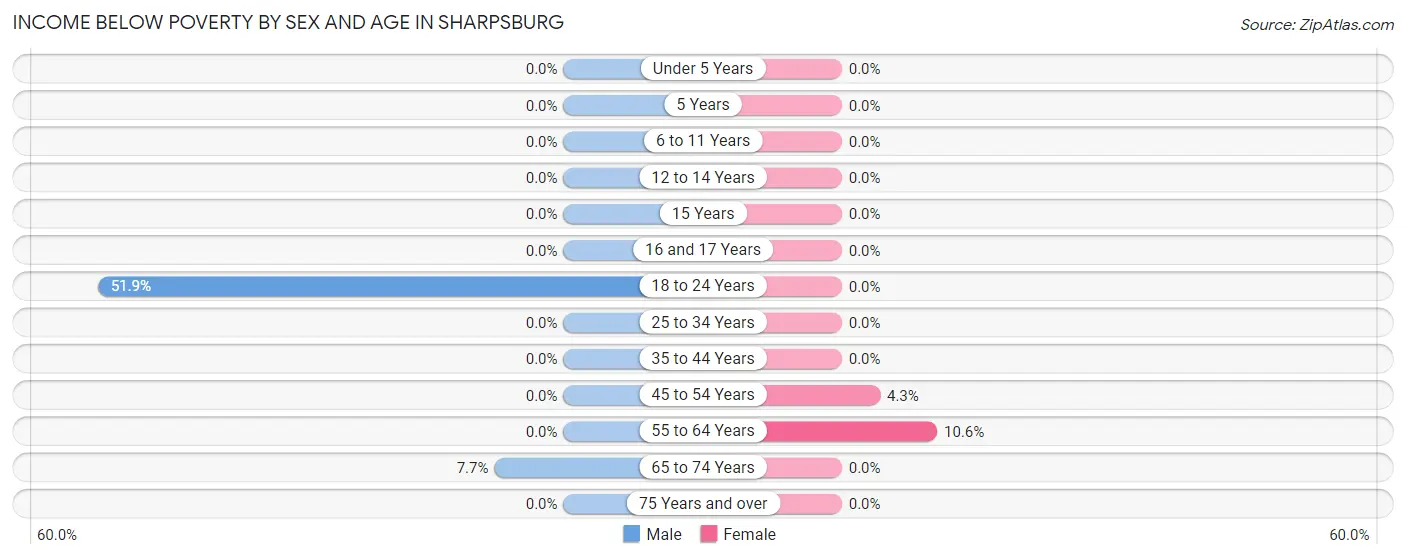
Income Below Poverty by Sex and Age in Sharpsburg
With 5.3% poverty level for males and 2.9% for females among the residents of Sharpsburg, 18 to 24 year old males and 55 to 64 year old females are the most vulnerable to poverty, with 14 males (51.8%) and 7 females (10.6%) in their respective age groups living below the poverty level.
| Age Bracket | Male | Female |
| Under 5 Years | 0 (0.0%) | 0 (0.0%) |
| 5 Years | 0 (0.0%) | 0 (0.0%) |
| 6 to 11 Years | 0 (0.0%) | 0 (0.0%) |
| 12 to 14 Years | 0 (0.0%) | 0 (0.0%) |
| 15 Years | 0 (0.0%) | 0 (0.0%) |
| 16 and 17 Years | 0 (0.0%) | 0 (0.0%) |
| 18 to 24 Years | 14 (51.8%) | 0 (0.0%) |
| 25 to 34 Years | 0 (0.0%) | 0 (0.0%) |
| 35 to 44 Years | 0 (0.0%) | 0 (0.0%) |
| 45 to 54 Years | 0 (0.0%) | 2 (4.3%) |
| 55 to 64 Years | 0 (0.0%) | 7 (10.6%) |
| 65 to 74 Years | 8 (7.7%) | 0 (0.0%) |
| 75 Years and over | 0 (0.0%) | 0 (0.0%) |
| Total | 22 (5.3%) | 9 (2.9%) |
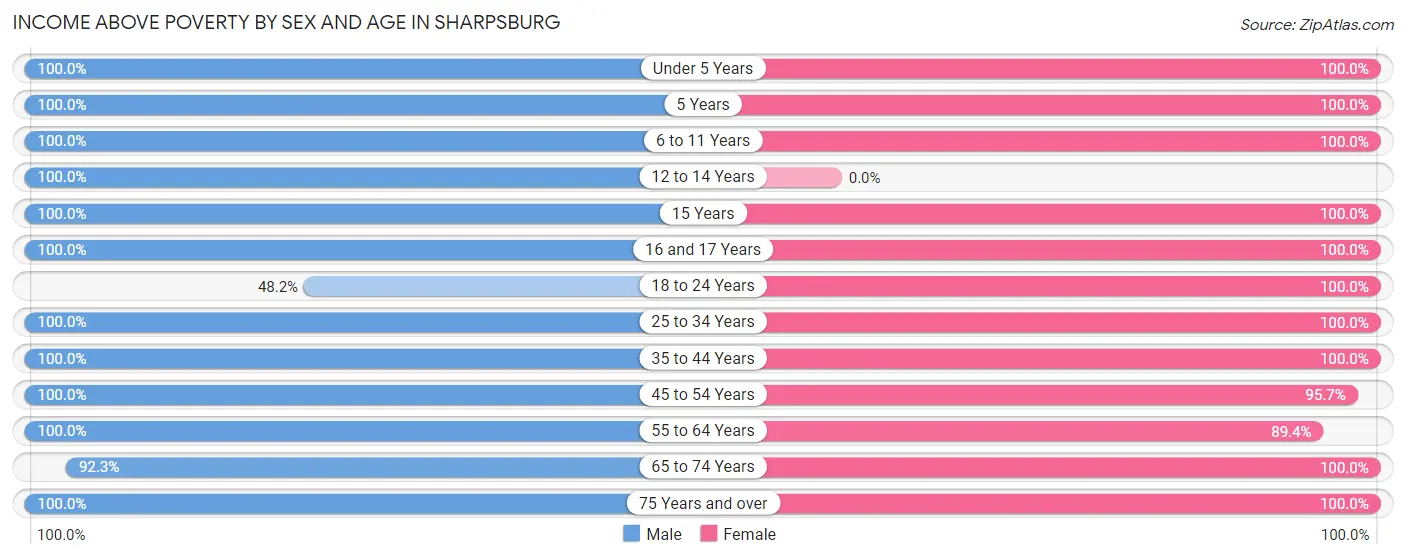
Income Above Poverty by Sex and Age in Sharpsburg
According to the poverty statistics in Sharpsburg, males aged under 5 years and females aged under 5 years are the age groups that are most secure financially, with 100.0% of males and 100.0% of females in these age groups living above the poverty line.
| Age Bracket | Male | Female |
| Under 5 Years | 15 (100.0%) | 9 (100.0%) |
| 5 Years | 3 (100.0%) | 3 (100.0%) |
| 6 to 11 Years | 5 (100.0%) | 27 (100.0%) |
| 12 to 14 Years | 18 (100.0%) | 0 (0.0%) |
| 15 Years | 11 (100.0%) | 5 (100.0%) |
| 16 and 17 Years | 7 (100.0%) | 11 (100.0%) |
| 18 to 24 Years | 13 (48.1%) | 9 (100.0%) |
| 25 to 34 Years | 23 (100.0%) | 28 (100.0%) |
| 35 to 44 Years | 73 (100.0%) | 65 (100.0%) |
| 45 to 54 Years | 72 (100.0%) | 45 (95.7%) |
| 55 to 64 Years | 41 (100.0%) | 59 (89.4%) |
| 65 to 74 Years | 96 (92.3%) | 35 (100.0%) |
| 75 Years and over | 13 (100.0%) | 5 (100.0%) |
| Total | 390 (94.7%) | 301 (97.1%) |
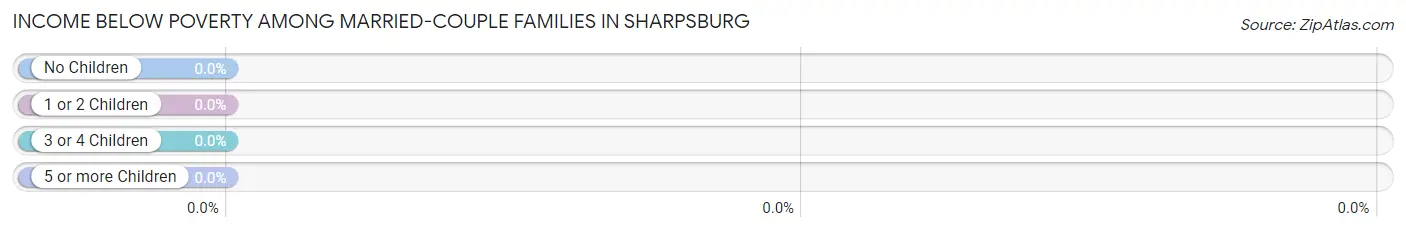
Income Below Poverty Among Married-Couple Families in Sharpsburg
| Children | Above Poverty | Below Poverty |
| No Children | 62 (100.0%) | 0 (0.0%) |
| 1 or 2 Children | 46 (100.0%) | 0 (0.0%) |
| 3 or 4 Children | 3 (100.0%) | 0 (0.0%) |
| 5 or more Children | 0 (0.0%) | 0 (0.0%) |
| Total | 111 (100.0%) | 0 (0.0%) |
Income Below Poverty Among Single-Parent Households in Sharpsburg
| Children | Single Father | Single Mother |
| No Children | 0 (0.0%) | 0 (0.0%) |
| 1 or 2 Children | 0 (0.0%) | 0 (0.0%) |
| 3 or 4 Children | 0 (0.0%) | 0 (0.0%) |
| 5 or more Children | 0 (0.0%) | 0 (0.0%) |
| Total | 0 (0.0%) | 0 (0.0%) |
Income Below Poverty Among Married-Couple vs Single-Parent Households in Sharpsburg
| Children | Married-Couple Families | Single-Parent Households |
| No Children | 0 (0.0%) | 0 (0.0%) |
| 1 or 2 Children | 0 (0.0%) | 0 (0.0%) |
| 3 or 4 Children | 0 (0.0%) | 0 (0.0%) |
| 5 or more Children | 0 (0.0%) | 0 (0.0%) |
| Total | 0 (0.0%) | 0 (0.0%) |
Race in Sharpsburg
The most populous races in Sharpsburg are White / Caucasian (629 | 87.1%), Two or more Races (60 | 8.3%), and Hispanic or Latino (23 | 3.2%).
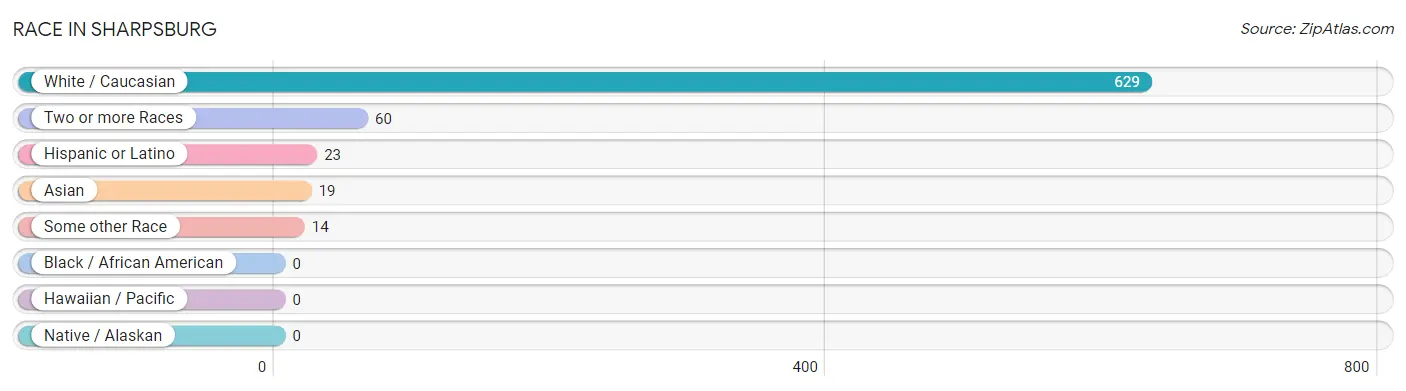
| Race | # Population | % Population |
| Asian | 19 | 2.6% |
| Black / African American | 0 | 0.0% |
| Hawaiian / Pacific | 0 | 0.0% |
| Hispanic or Latino | 23 | 3.2% |
| Native / Alaskan | 0 | 0.0% |
| White / Caucasian | 629 | 87.1% |
| Two or more Races | 60 | 8.3% |
| Some other Race | 14 | 1.9% |
| Total | 722 | 100.0% |
Ancestry in Sharpsburg
The most populous ancestries reported in Sharpsburg are German (171 | 23.7%), Irish (120 | 16.6%), English (77 | 10.7%), European (60 | 8.3%), and American (56 | 7.8%), together accounting for 67.0% of all Sharpsburg residents.
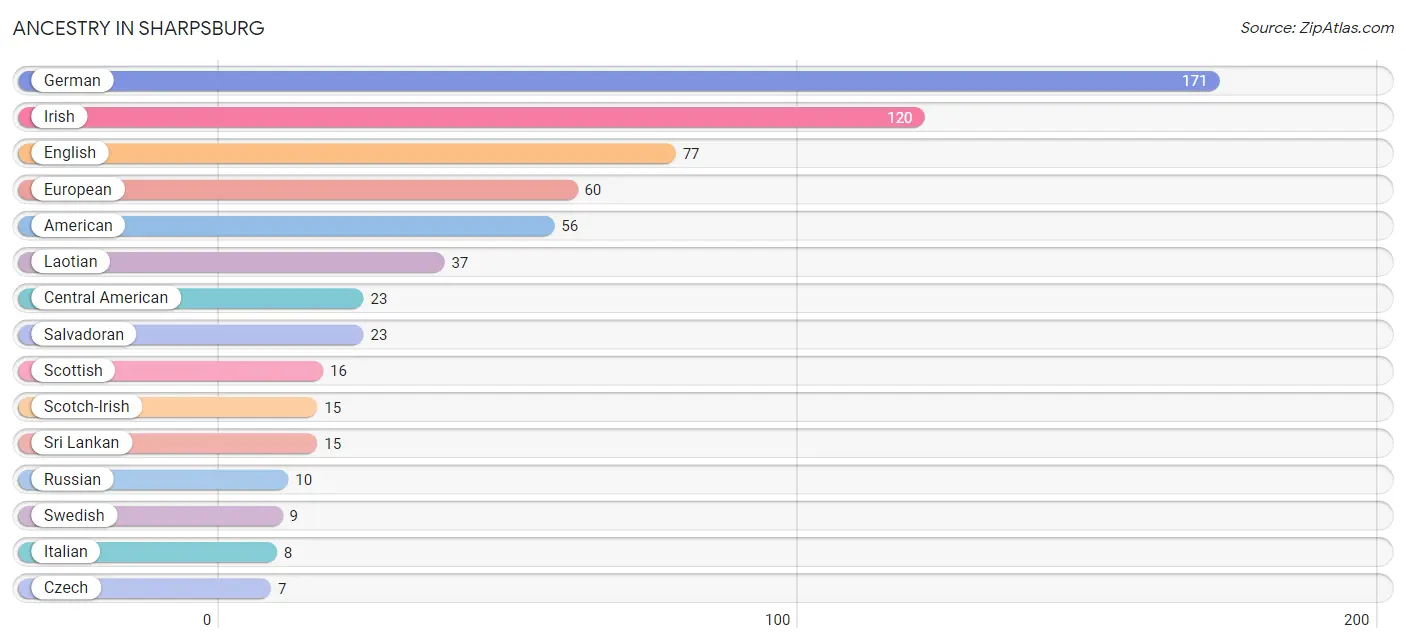
| Ancestry | # Population | % Population |
| American | 56 | 7.8% |
| Central American | 23 | 3.2% |
| Czech | 7 | 1.0% |
| Dutch | 4 | 0.5% |
| English | 77 | 10.7% |
| European | 60 | 8.3% |
| French | 2 | 0.3% |
| German | 171 | 23.7% |
| Irish | 120 | 16.6% |
| Italian | 8 | 1.1% |
| Korean | 6 | 0.8% |
| Laotian | 37 | 5.1% |
| Pennsylvania German | 5 | 0.7% |
| Polish | 3 | 0.4% |
| Russian | 10 | 1.4% |
| Salvadoran | 23 | 3.2% |
| Scotch-Irish | 15 | 2.1% |
| Scottish | 16 | 2.2% |
| Sri Lankan | 15 | 2.1% |
| Swedish | 9 | 1.3% | View All 20 Rows |
Immigrants in Sharpsburg
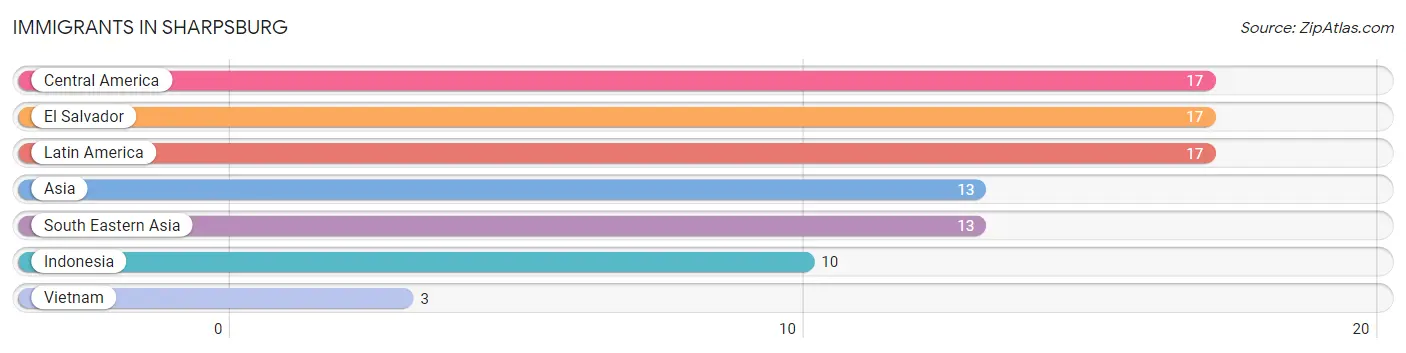
The most numerous immigrant groups reported in Sharpsburg came from Central America (17 | 2.4%), El Salvador (17 | 2.4%), Latin America (17 | 2.4%), Asia (13 | 1.8%), and South Eastern Asia (13 | 1.8%), together accounting for 10.7% of all Sharpsburg residents.
| Immigration Origin | # Population | % Population |
| Asia | 13 | 1.8% |
| Central America | 17 | 2.4% |
| El Salvador | 17 | 2.4% |
| Indonesia | 10 | 1.4% |
| Latin America | 17 | 2.4% |
| South Eastern Asia | 13 | 1.8% |
| Vietnam | 3 | 0.4% | View All 7 Rows |
Sex and Age in Sharpsburg
Sex and Age in Sharpsburg
The most populous age groups in Sharpsburg are 40 to 44 Years (62 | 15.0%) for men and 50 to 54 Years (40 | 12.9%) for women.
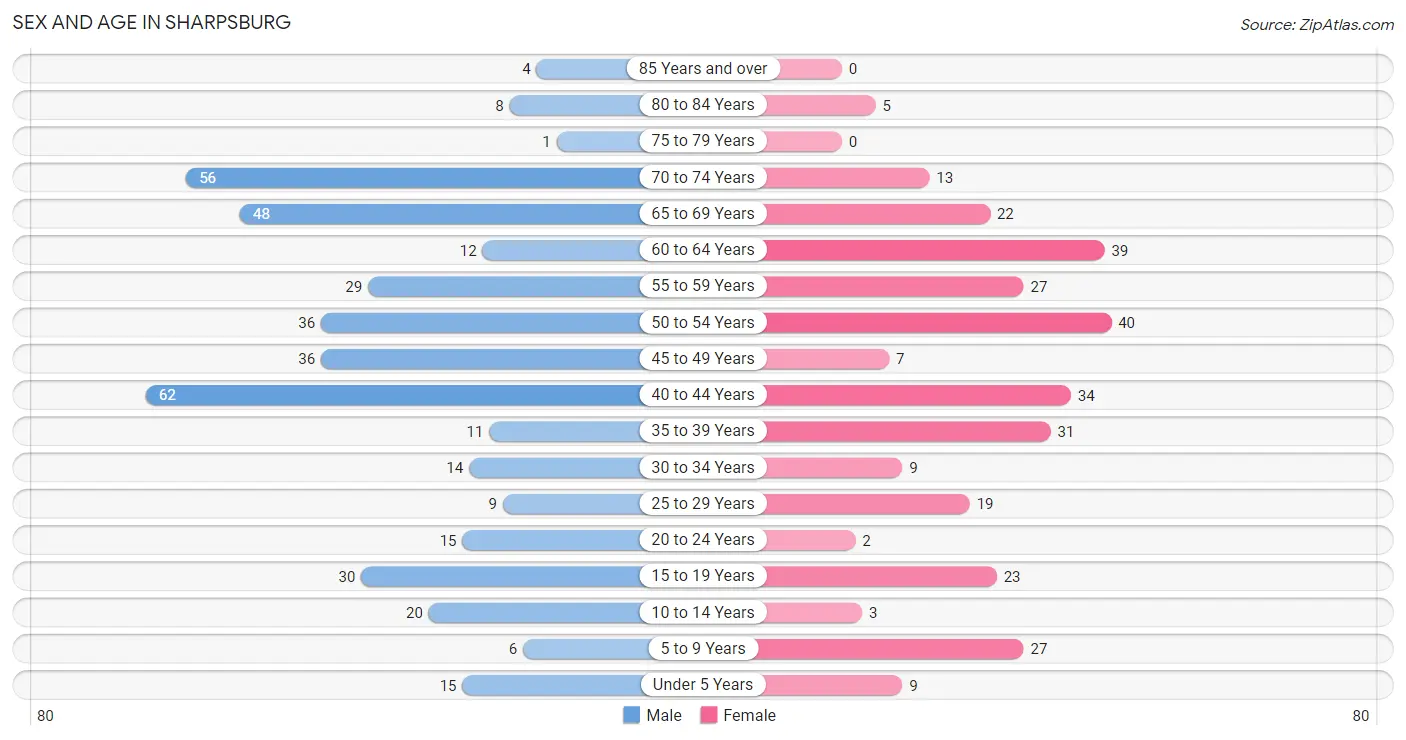
| Age Bracket | Male | Female |
| Under 5 Years | 15 (3.6%) | 9 (2.9%) |
| 5 to 9 Years | 6 (1.5%) | 27 (8.7%) |
| 10 to 14 Years | 20 (4.9%) | 3 (1.0%) |
| 15 to 19 Years | 30 (7.3%) | 23 (7.4%) |
| 20 to 24 Years | 15 (3.6%) | 2 (0.6%) |
| 25 to 29 Years | 9 (2.2%) | 19 (6.1%) |
| 30 to 34 Years | 14 (3.4%) | 9 (2.9%) |
| 35 to 39 Years | 11 (2.7%) | 31 (10.0%) |
| 40 to 44 Years | 62 (15.0%) | 34 (11.0%) |
| 45 to 49 Years | 36 (8.7%) | 7 (2.3%) |
| 50 to 54 Years | 36 (8.7%) | 40 (12.9%) |
| 55 to 59 Years | 29 (7.0%) | 27 (8.7%) |
| 60 to 64 Years | 12 (2.9%) | 39 (12.6%) |
| 65 to 69 Years | 48 (11.7%) | 22 (7.1%) |
| 70 to 74 Years | 56 (13.6%) | 13 (4.2%) |
| 75 to 79 Years | 1 (0.2%) | 0 (0.0%) |
| 80 to 84 Years | 8 (1.9%) | 5 (1.6%) |
| 85 Years and over | 4 (1.0%) | 0 (0.0%) |
| Total | 412 (100.0%) | 310 (100.0%) |
Families and Households in Sharpsburg
Median Family Size in Sharpsburg
The median family size in Sharpsburg is 2.80 persons per family, with married-couple families (111 | 60.0%) accounting for the largest median family size of 3.16 persons per family. On the other hand, single male/father families (43 | 23.2%) represent the smallest median family size with 2.05 persons per family.
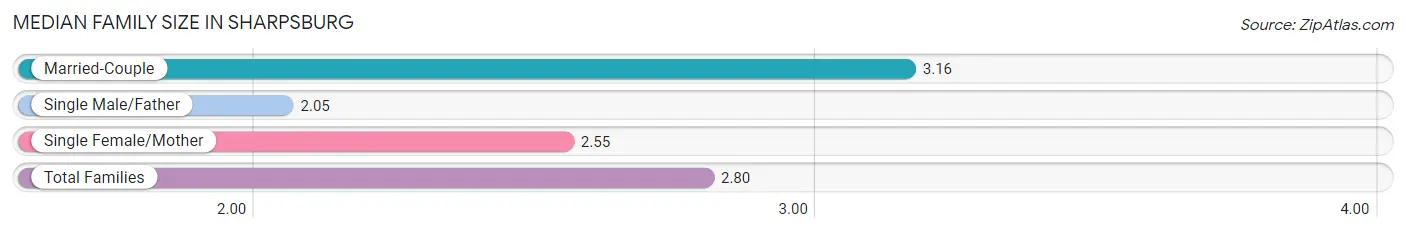
| Family Type | # Families | Family Size |
| Married-Couple | 111 (60.0%) | 3.16 |
| Single Male/Father | 43 (23.2%) | 2.05 |
| Single Female/Mother | 31 (16.8%) | 2.55 |
| Total Families | 185 (100.0%) | 2.80 |
Median Household Size in Sharpsburg
The median household size in Sharpsburg is 2.14 persons per household, with married-couple households (111 | 32.8%) accounting for the largest median household size of 3.32 persons per household. non-family households (153 | 45.3%) represent the smallest median household size with 1.18 persons per household.
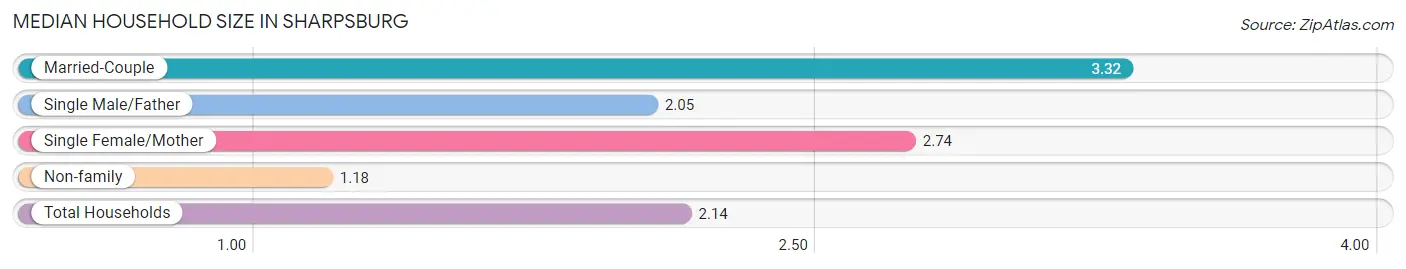
| Household Type | # Households | Household Size |
| Married-Couple | 111 (32.8%) | 3.32 |
| Single Male/Father | 43 (12.7%) | 2.05 |
| Single Female/Mother | 31 (9.2%) | 2.74 |
| Non-family | 153 (45.3%) | 1.18 |
| Total Households | 338 (100.0%) | 2.14 |
Household Size by Marriage Status in Sharpsburg
Out of a total of 338 households in Sharpsburg, 185 (54.7%) are family households, while 153 (45.3%) are nonfamily households. The most numerous type of family households are 2-person households, comprising 109, and the most common type of nonfamily households are 1-person households, comprising 127.
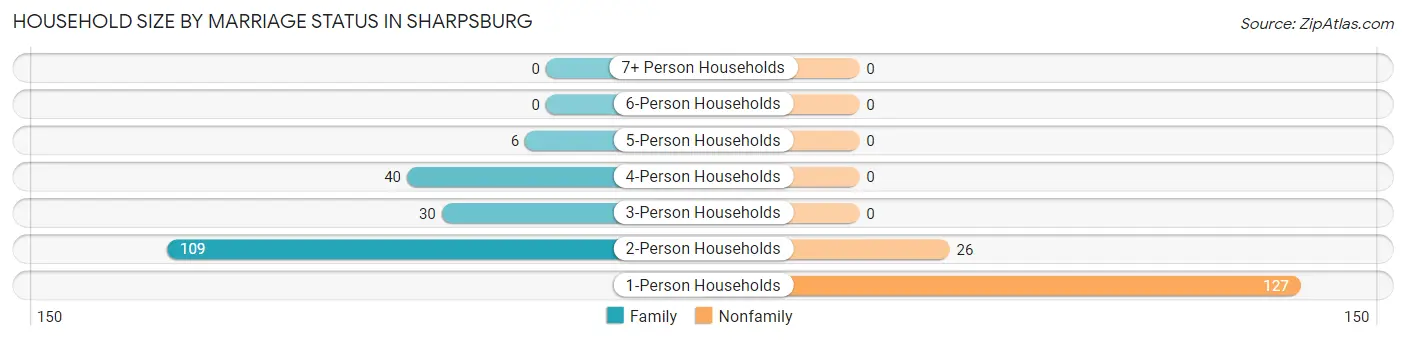
| Household Size | Family Households | Nonfamily Households |
| 1-Person Households | - | 127 (37.6%) |
| 2-Person Households | 109 (32.3%) | 26 (7.7%) |
| 3-Person Households | 30 (8.9%) | 0 (0.0%) |
| 4-Person Households | 40 (11.8%) | 0 (0.0%) |
| 5-Person Households | 6 (1.8%) | 0 (0.0%) |
| 6-Person Households | 0 (0.0%) | 0 (0.0%) |
| 7+ Person Households | 0 (0.0%) | 0 (0.0%) |
| Total | 185 (54.7%) | 153 (45.3%) |
Female Fertility in Sharpsburg
Fertility by Age in Sharpsburg
| Age Bracket | Women with Births | Births / 1,000 Women |
| 15 to 19 years | 0 (0.0%) | 0.0 |
| 20 to 34 years | 0 (0.0%) | 0.0 |
| 35 to 50 years | 0 (0.0%) | 0.0 |
| Total | 0 (0.0%) | 0.0 |
Fertility by Age by Marriage Status in Sharpsburg
| Age Bracket | Married | Unmarried |
| 15 to 19 years | 0 (0.0%) | 0 (0.0%) |
| 20 to 34 years | 0 (0.0%) | 0 (0.0%) |
| 35 to 50 years | 0 (0.0%) | 0 (0.0%) |
| Total | 0 (0.0%) | 0 (0.0%) |
Fertility by Education in Sharpsburg
| Educational Attainment | Women with Births | Births / 1,000 Women |
| Less than High School | 0 (0.0%) | 0.0 |
| High School Diploma | 0 (0.0%) | 0.0 |
| College or Associate's Degree | 0 (0.0%) | 0.0 |
| Bachelor's Degree | 0 (0.0%) | 0.0 |
| Graduate Degree | 0 (0.0%) | 0.0 |
| Total | 0 (0.0%) | 0.0 |
Fertility by Education by Marriage Status in Sharpsburg
| Educational Attainment | Married | Unmarried |
| Less than High School | 0 (0.0%) | 0 (0.0%) |
| High School Diploma | 0 (0.0%) | 0 (0.0%) |
| College or Associate's Degree | 0 (0.0%) | 0 (0.0%) |
| Bachelor's Degree | 0 (0.0%) | 0 (0.0%) |
| Graduate Degree | 0 (0.0%) | 0 (0.0%) |
| Total | 0 (0.0%) | 0 (0.0%) |
Employment Characteristics in Sharpsburg
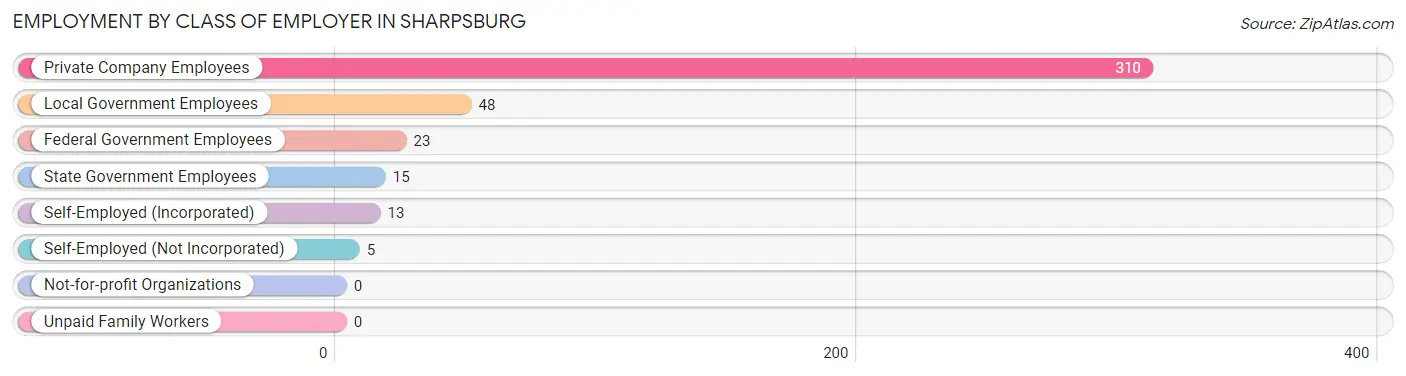
Employment by Class of Employer in Sharpsburg
Among the 414 employed individuals in Sharpsburg, private company employees (310 | 74.9%), local government employees (48 | 11.6%), and federal government employees (23 | 5.6%) make up the most common classes of employment.
| Employer Class | # Employees | % Employees |
| Private Company Employees | 310 | 74.9% |
| Self-Employed (Incorporated) | 13 | 3.1% |
| Self-Employed (Not Incorporated) | 5 | 1.2% |
| Not-for-profit Organizations | 0 | 0.0% |
| Local Government Employees | 48 | 11.6% |
| State Government Employees | 15 | 3.6% |
| Federal Government Employees | 23 | 5.6% |
| Unpaid Family Workers | 0 | 0.0% |
| Total | 414 | 100.0% |
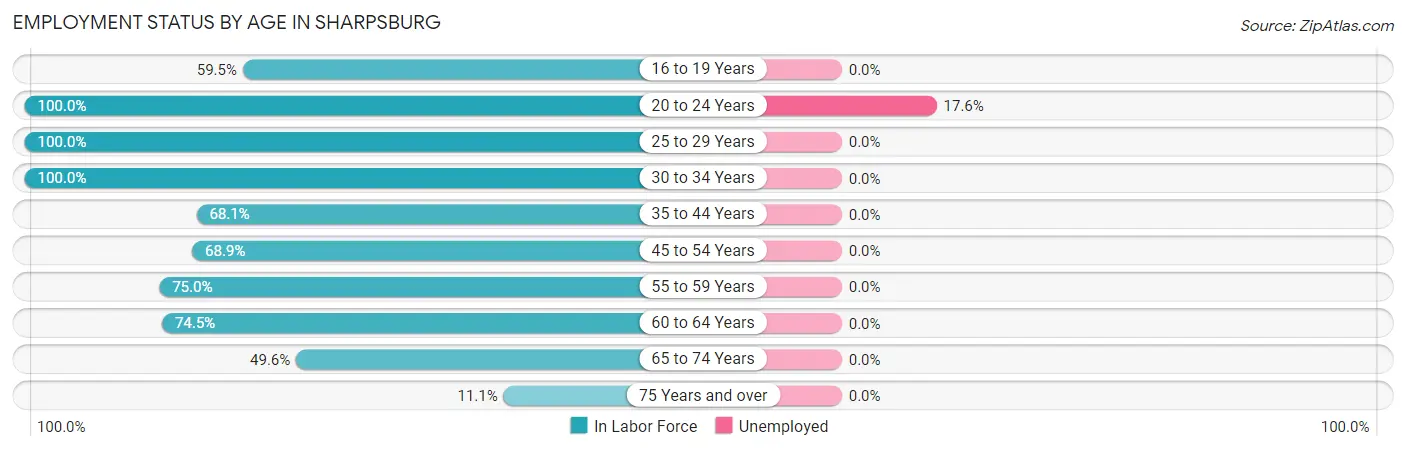
Employment Status by Age in Sharpsburg
According to the labor force statistics for Sharpsburg, out of the total population over 16 years of age (626), 66.6% or 417 individuals are in the labor force, with 0.7% or 3 of them unemployed. The age group with the highest labor force participation rate is 20 to 24 years, with 100.0% or 17 individuals in the labor force. Within the labor force, the 20 to 24 years age range has the highest percentage of unemployed individuals, with 17.6% or 3 of them being unemployed.
| Age Bracket | In Labor Force | Unemployed |
| 16 to 19 Years | 22 (59.5%) | 0 (0.0%) |
| 20 to 24 Years | 17 (100.0%) | 3 (17.6%) |
| 25 to 29 Years | 28 (100.0%) | 0 (0.0%) |
| 30 to 34 Years | 23 (100.0%) | 0 (0.0%) |
| 35 to 44 Years | 94 (68.1%) | 0 (0.0%) |
| 45 to 54 Years | 82 (68.9%) | 0 (0.0%) |
| 55 to 59 Years | 42 (75.0%) | 0 (0.0%) |
| 60 to 64 Years | 38 (74.5%) | 0 (0.0%) |
| 65 to 74 Years | 69 (49.6%) | 0 (0.0%) |
| 75 Years and over | 2 (11.1%) | 0 (0.0%) |
| Total | 417 (66.6%) | 3 (0.7%) |
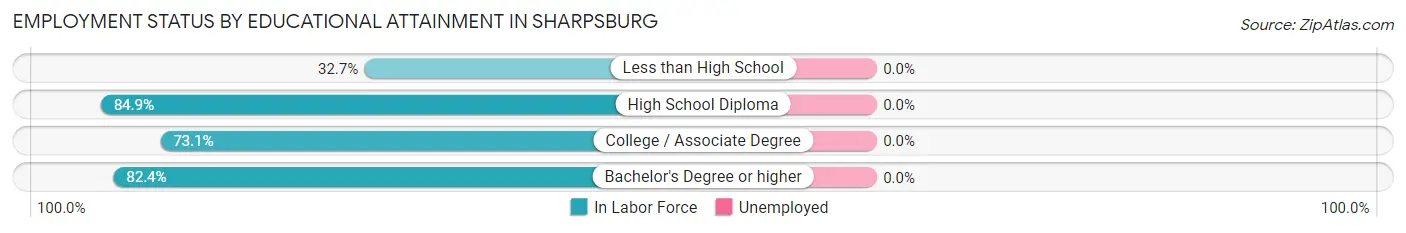
Employment Status by Educational Attainment in Sharpsburg
| Educational Attainment | In Labor Force | Unemployed |
| Less than High School | 18 (32.7%) | 0 (0.0%) |
| High School Diploma | 118 (84.9%) | 0 (0.0%) |
| College / Associate Degree | 87 (73.1%) | 0 (0.0%) |
| Bachelor's Degree or higher | 84 (82.4%) | 0 (0.0%) |
| Total | 307 (74.0%) | 0 (0.0%) |
Employment Occupations by Sex in Sharpsburg
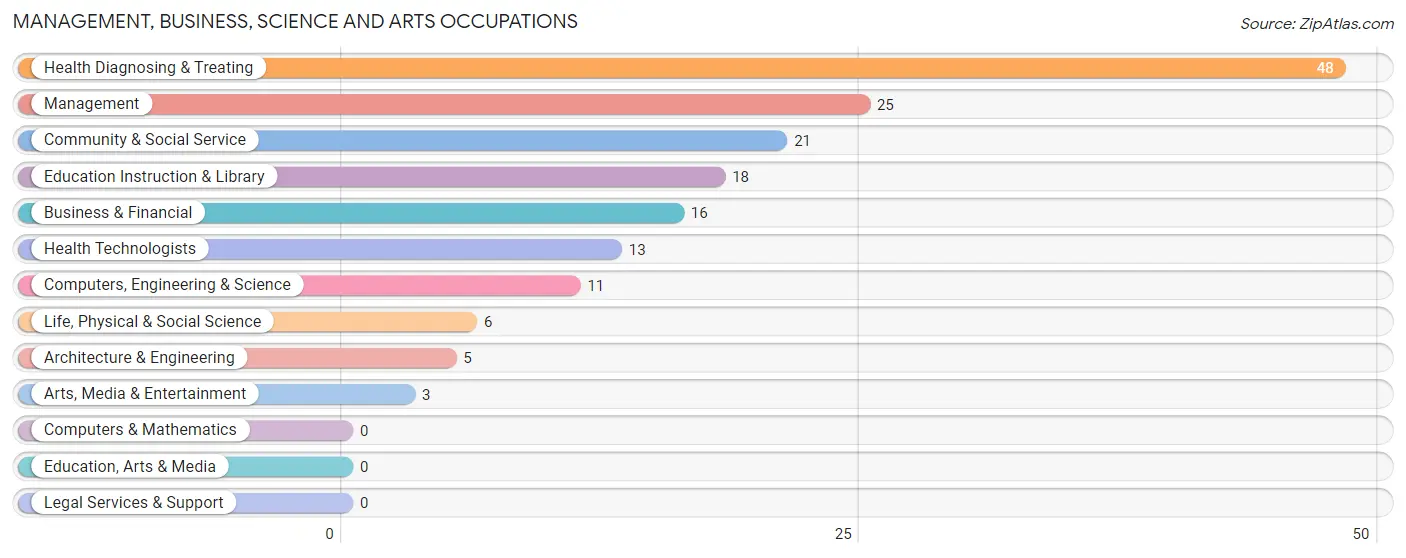
Management, Business, Science and Arts Occupations
The most common Management, Business, Science and Arts occupations in Sharpsburg are Health Diagnosing & Treating (48 | 11.6%), Management (25 | 6.0%), Community & Social Service (21 | 5.1%), Education Instruction & Library (18 | 4.3%), and Business & Financial (16 | 3.9%).
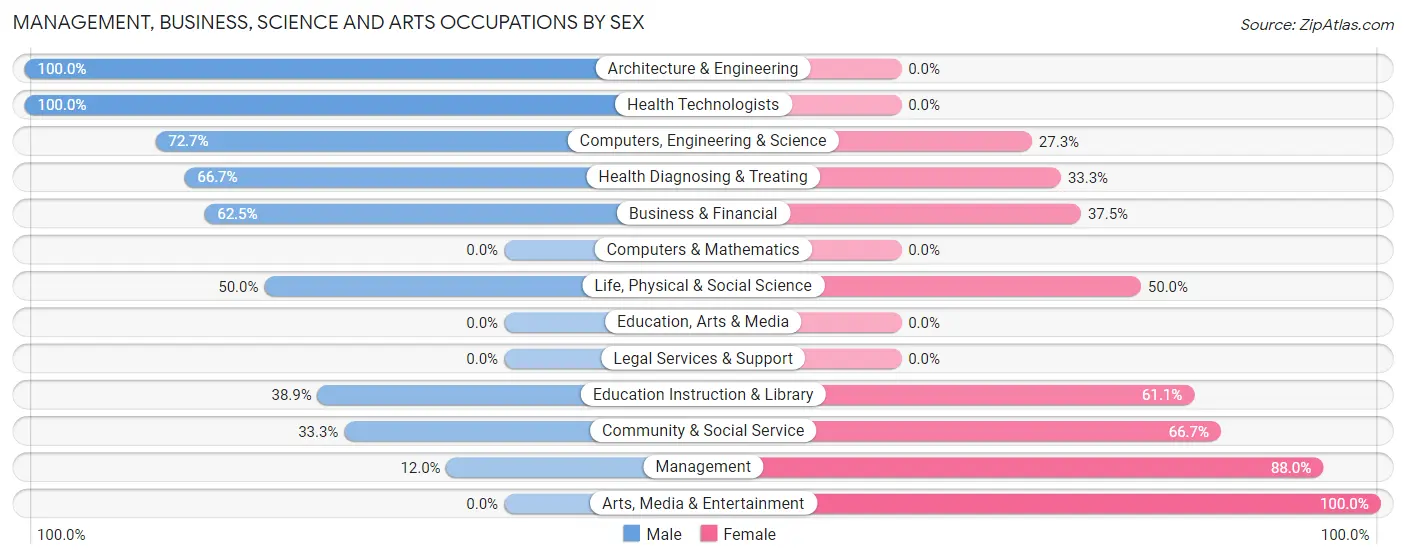
Management, Business, Science and Arts Occupations by Sex
Within the Management, Business, Science and Arts occupations in Sharpsburg, the most male-oriented occupations are Architecture & Engineering (100.0%), Health Technologists (100.0%), and Computers, Engineering & Science (72.7%), while the most female-oriented occupations are Arts, Media & Entertainment (100.0%), Management (88.0%), and Community & Social Service (66.7%).
| Occupation | Male | Female |
| Management | 3 (12.0%) | 22 (88.0%) |
| Business & Financial | 10 (62.5%) | 6 (37.5%) |
| Computers, Engineering & Science | 8 (72.7%) | 3 (27.3%) |
| Computers & Mathematics | 0 (0.0%) | 0 (0.0%) |
| Architecture & Engineering | 5 (100.0%) | 0 (0.0%) |
| Life, Physical & Social Science | 3 (50.0%) | 3 (50.0%) |
| Community & Social Service | 7 (33.3%) | 14 (66.7%) |
| Education, Arts & Media | 0 (0.0%) | 0 (0.0%) |
| Legal Services & Support | 0 (0.0%) | 0 (0.0%) |
| Education Instruction & Library | 7 (38.9%) | 11 (61.1%) |
| Arts, Media & Entertainment | 0 (0.0%) | 3 (100.0%) |
| Health Diagnosing & Treating | 32 (66.7%) | 16 (33.3%) |
| Health Technologists | 13 (100.0%) | 0 (0.0%) |
| Total (Category) | 60 (49.6%) | 61 (50.4%) |
| Total (Overall) | 230 (55.6%) | 184 (44.4%) |
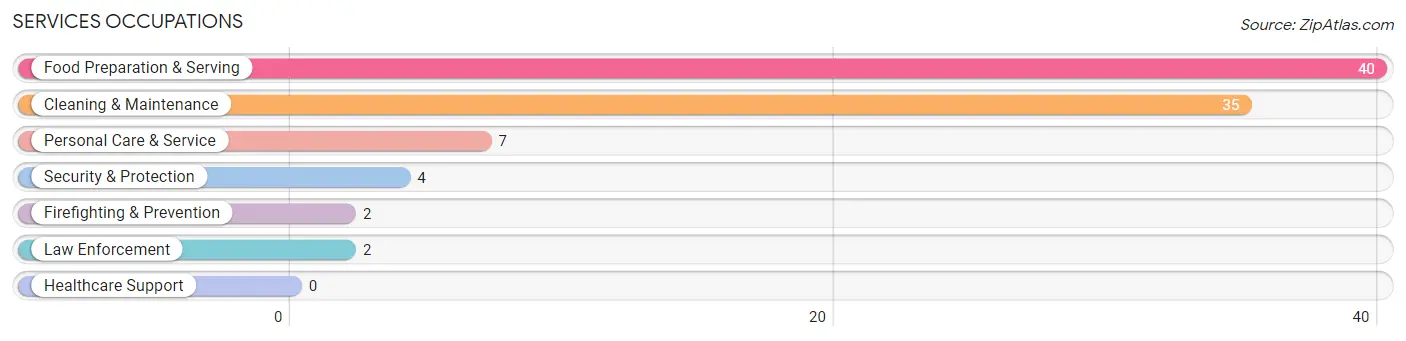
Services Occupations
The most common Services occupations in Sharpsburg are Food Preparation & Serving (40 | 9.7%), Cleaning & Maintenance (35 | 8.5%), Personal Care & Service (7 | 1.7%), Security & Protection (4 | 1.0%), and Firefighting & Prevention (2 | 0.5%).
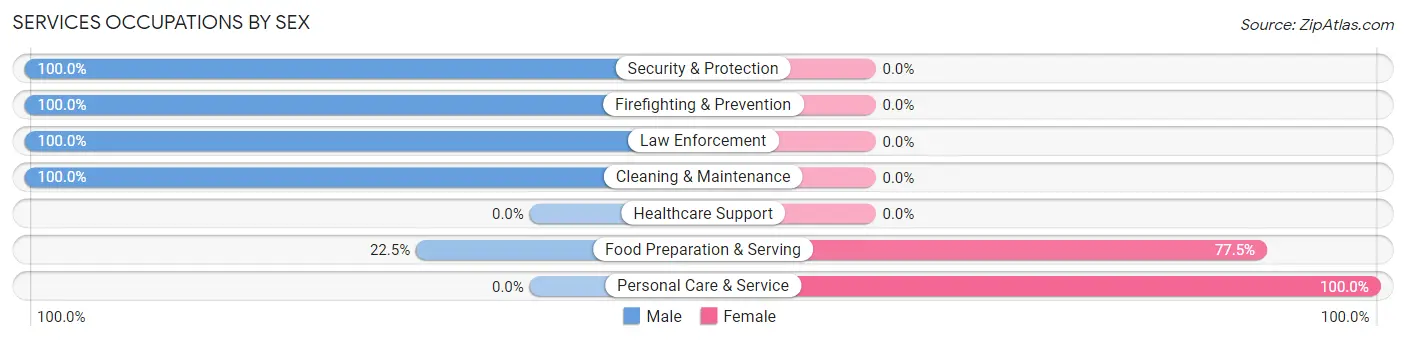
Services Occupations by Sex
Within the Services occupations in Sharpsburg, the most male-oriented occupations are Security & Protection (100.0%), Firefighting & Prevention (100.0%), and Law Enforcement (100.0%), while the most female-oriented occupations are Personal Care & Service (100.0%), and Food Preparation & Serving (77.5%).
| Occupation | Male | Female |
| Healthcare Support | 0 (0.0%) | 0 (0.0%) |
| Security & Protection | 4 (100.0%) | 0 (0.0%) |
| Firefighting & Prevention | 2 (100.0%) | 0 (0.0%) |
| Law Enforcement | 2 (100.0%) | 0 (0.0%) |
| Food Preparation & Serving | 9 (22.5%) | 31 (77.5%) |
| Cleaning & Maintenance | 35 (100.0%) | 0 (0.0%) |
| Personal Care & Service | 0 (0.0%) | 7 (100.0%) |
| Total (Category) | 48 (55.8%) | 38 (44.2%) |
| Total (Overall) | 230 (55.6%) | 184 (44.4%) |
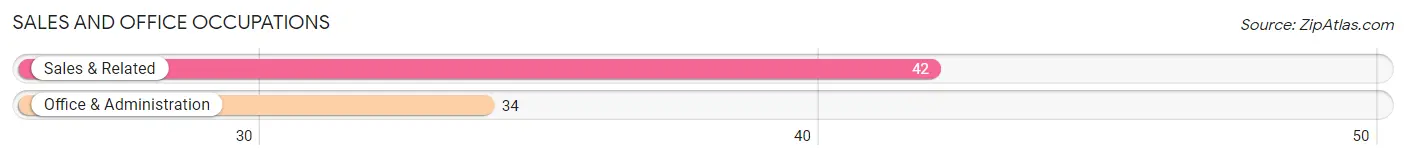
Sales and Office Occupations
The most common Sales and Office occupations in Sharpsburg are Sales & Related (42 | 10.1%), and Office & Administration (34 | 8.2%).
Sales and Office Occupations by Sex
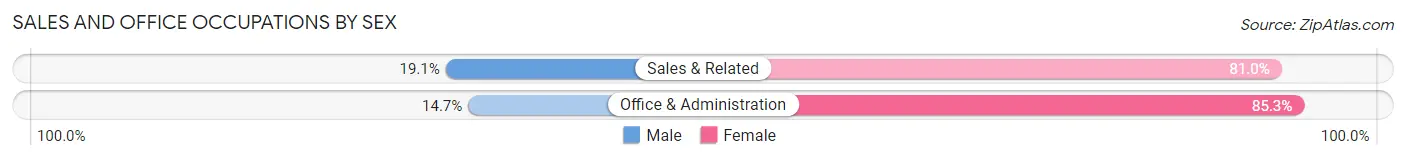
| Occupation | Male | Female |
| Sales & Related | 8 (19.1%) | 34 (80.9%) |
| Office & Administration | 5 (14.7%) | 29 (85.3%) |
| Total (Category) | 13 (17.1%) | 63 (82.9%) |
| Total (Overall) | 230 (55.6%) | 184 (44.4%) |
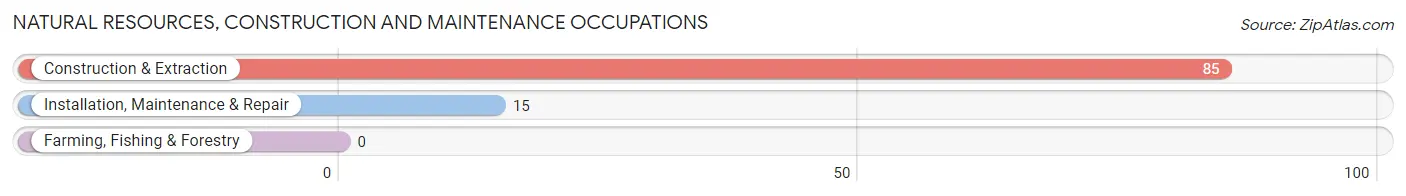
Natural Resources, Construction and Maintenance Occupations
The most common Natural Resources, Construction and Maintenance occupations in Sharpsburg are Construction & Extraction (85 | 20.5%), and Installation, Maintenance & Repair (15 | 3.6%).
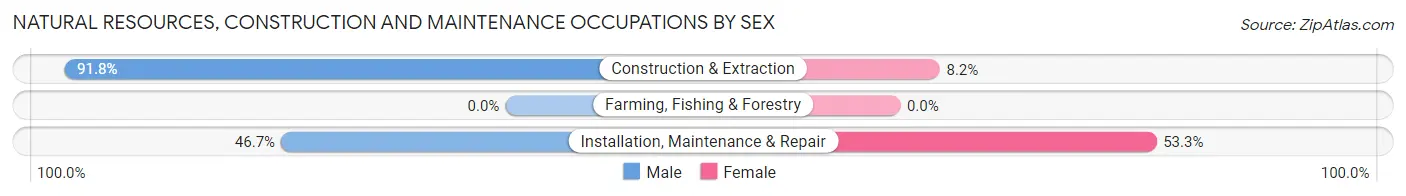
Natural Resources, Construction and Maintenance Occupations by Sex
| Occupation | Male | Female |
| Farming, Fishing & Forestry | 0 (0.0%) | 0 (0.0%) |
| Construction & Extraction | 78 (91.8%) | 7 (8.2%) |
| Installation, Maintenance & Repair | 7 (46.7%) | 8 (53.3%) |
| Total (Category) | 85 (85.0%) | 15 (15.0%) |
| Total (Overall) | 230 (55.6%) | 184 (44.4%) |
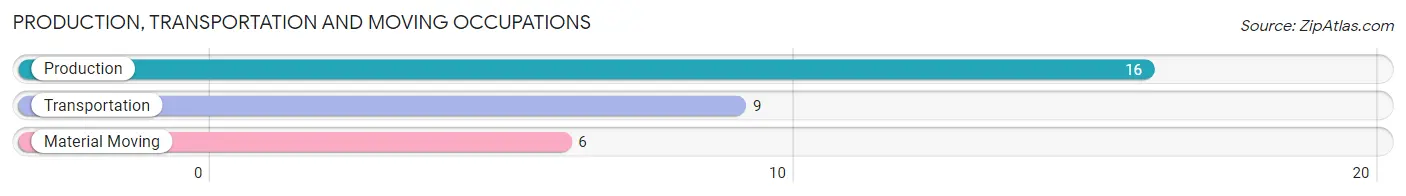
Production, Transportation and Moving Occupations
The most common Production, Transportation and Moving occupations in Sharpsburg are Production (16 | 3.9%), Transportation (9 | 2.2%), and Material Moving (6 | 1.5%).
Production, Transportation and Moving Occupations by Sex
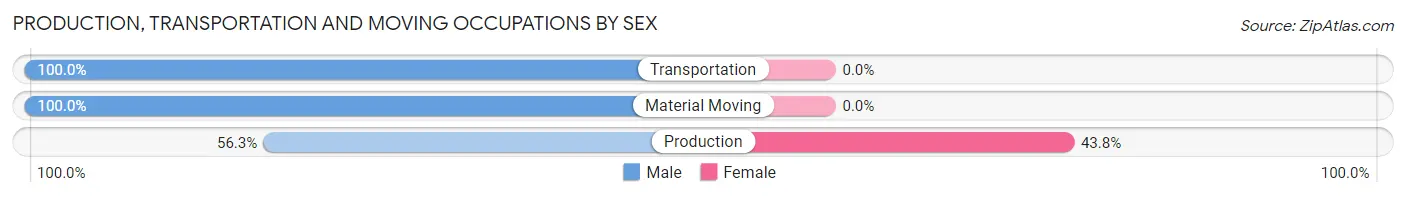
| Occupation | Male | Female |
| Production | 9 (56.2%) | 7 (43.8%) |
| Transportation | 9 (100.0%) | 0 (0.0%) |
| Material Moving | 6 (100.0%) | 0 (0.0%) |
| Total (Category) | 24 (77.4%) | 7 (22.6%) |
| Total (Overall) | 230 (55.6%) | 184 (44.4%) |
Employment Industries by Sex in Sharpsburg
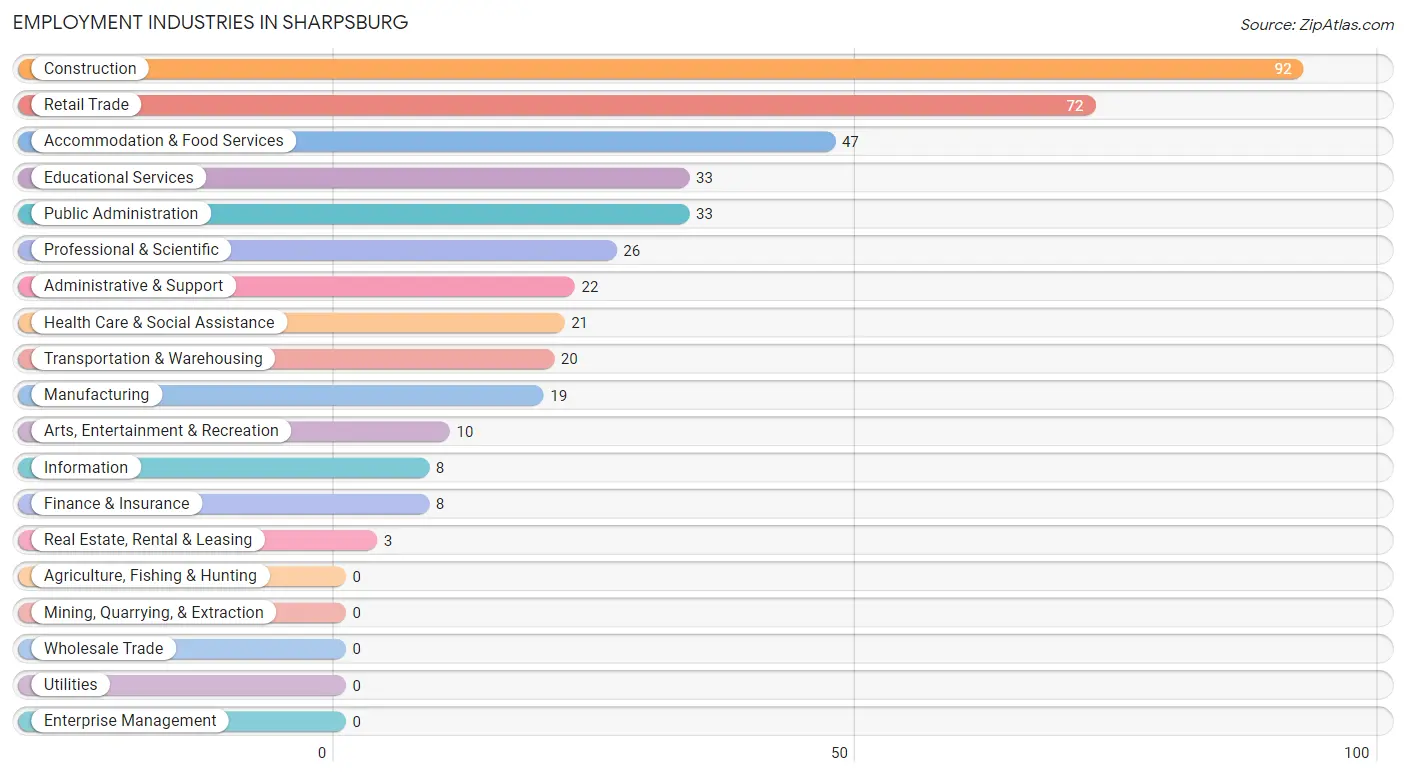
Employment Industries in Sharpsburg
The major employment industries in Sharpsburg include Construction (92 | 22.2%), Retail Trade (72 | 17.4%), Accommodation & Food Services (47 | 11.4%), Educational Services (33 | 8.0%), and Public Administration (33 | 8.0%).
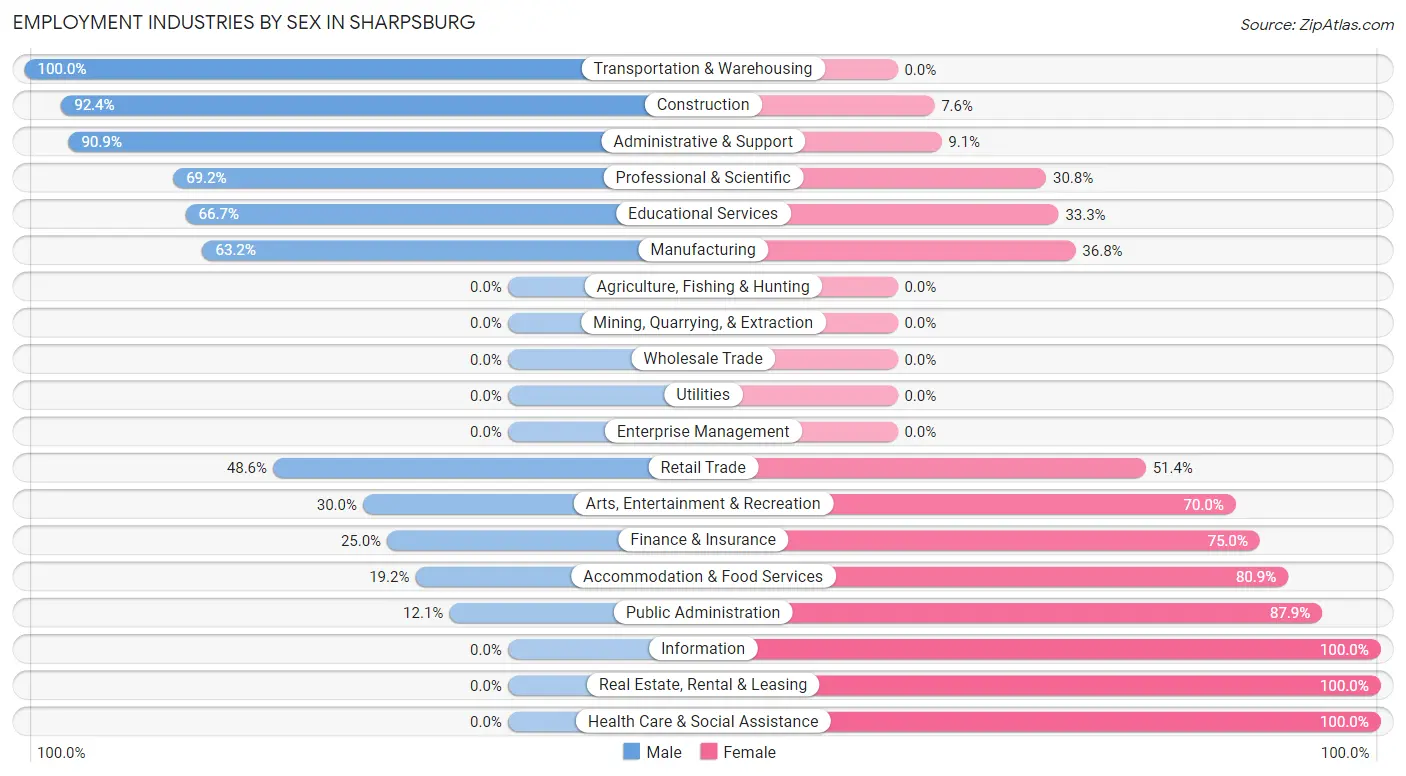
Employment Industries by Sex in Sharpsburg
The Sharpsburg industries that see more men than women are Transportation & Warehousing (100.0%), Construction (92.4%), and Administrative & Support (90.9%), whereas the industries that tend to have a higher number of women are Information (100.0%), Real Estate, Rental & Leasing (100.0%), and Health Care & Social Assistance (100.0%).
| Industry | Male | Female |
| Agriculture, Fishing & Hunting | 0 (0.0%) | 0 (0.0%) |
| Mining, Quarrying, & Extraction | 0 (0.0%) | 0 (0.0%) |
| Construction | 85 (92.4%) | 7 (7.6%) |
| Manufacturing | 12 (63.2%) | 7 (36.8%) |
| Wholesale Trade | 0 (0.0%) | 0 (0.0%) |
| Retail Trade | 35 (48.6%) | 37 (51.4%) |
| Transportation & Warehousing | 20 (100.0%) | 0 (0.0%) |
| Utilities | 0 (0.0%) | 0 (0.0%) |
| Information | 0 (0.0%) | 8 (100.0%) |
| Finance & Insurance | 2 (25.0%) | 6 (75.0%) |
| Real Estate, Rental & Leasing | 0 (0.0%) | 3 (100.0%) |
| Professional & Scientific | 18 (69.2%) | 8 (30.8%) |
| Enterprise Management | 0 (0.0%) | 0 (0.0%) |
| Administrative & Support | 20 (90.9%) | 2 (9.1%) |
| Educational Services | 22 (66.7%) | 11 (33.3%) |
| Health Care & Social Assistance | 0 (0.0%) | 21 (100.0%) |
| Arts, Entertainment & Recreation | 3 (30.0%) | 7 (70.0%) |
| Accommodation & Food Services | 9 (19.2%) | 38 (80.8%) |
| Public Administration | 4 (12.1%) | 29 (87.9%) |
| Total | 230 (55.6%) | 184 (44.4%) |
Education in Sharpsburg
School Enrollment in Sharpsburg
The most common levels of schooling among the 133 students in Sharpsburg are high school (41 | 30.8%), college / undergraduate (30 | 22.6%), and kindergarten (21 | 15.8%).
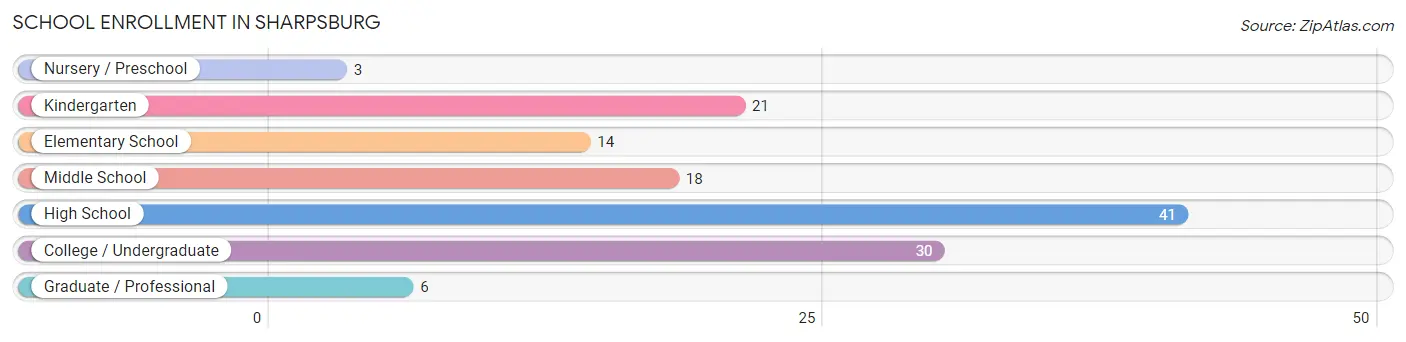
| School Level | # Students | % Students |
| Nursery / Preschool | 3 | 2.3% |
| Kindergarten | 21 | 15.8% |
| Elementary School | 14 | 10.5% |
| Middle School | 18 | 13.5% |
| High School | 41 | 30.8% |
| College / Undergraduate | 30 | 22.6% |
| Graduate / Professional | 6 | 4.5% |
| Total | 133 | 100.0% |
School Enrollment by Age by Funding Source in Sharpsburg
Out of a total of 133 students who are enrolled in schools in Sharpsburg, 6 (4.5%) attend a private institution, while the remaining 127 (95.5%) are enrolled in public schools. The age group of 35 years and over has the highest likelihood of being enrolled in private schools, with 6 (31.6% in the age bracket) enrolled. Conversely, the age group of 5 to 9 year old has the lowest likelihood of being enrolled in a private school, with 33 (100.0% in the age bracket) attending a public institution.
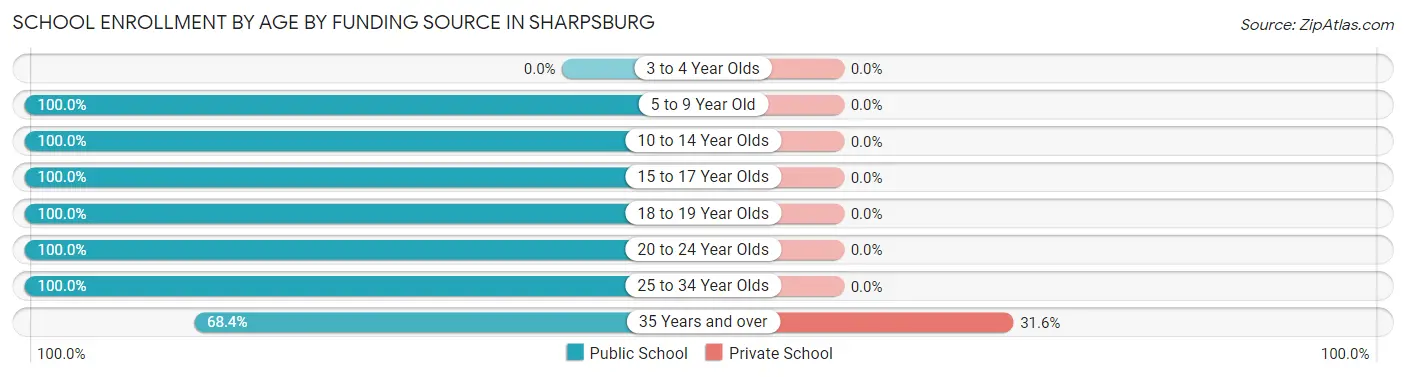
| Age Bracket | Public School | Private School |
| 3 to 4 Year Olds | 0 (0.0%) | 0 (0.0%) |
| 5 to 9 Year Old | 33 (100.0%) | 0 (0.0%) |
| 10 to 14 Year Olds | 23 (100.0%) | 0 (0.0%) |
| 15 to 17 Year Olds | 34 (100.0%) | 0 (0.0%) |
| 18 to 19 Year Olds | 7 (100.0%) | 0 (0.0%) |
| 20 to 24 Year Olds | 8 (100.0%) | 0 (0.0%) |
| 25 to 34 Year Olds | 9 (100.0%) | 0 (0.0%) |
| 35 Years and over | 13 (68.4%) | 6 (31.6%) |
| Total | 127 (95.5%) | 6 (4.5%) |
Educational Attainment by Field of Study in Sharpsburg
Liberal arts & history (26 | 15.3%), bio, nature & agricultural (25 | 14.7%), social sciences (25 | 14.7%), education (22 | 12.9%), and computers & mathematics (16 | 9.4%) are the most common fields of study among 170 individuals in Sharpsburg who have obtained a bachelor's degree or higher.
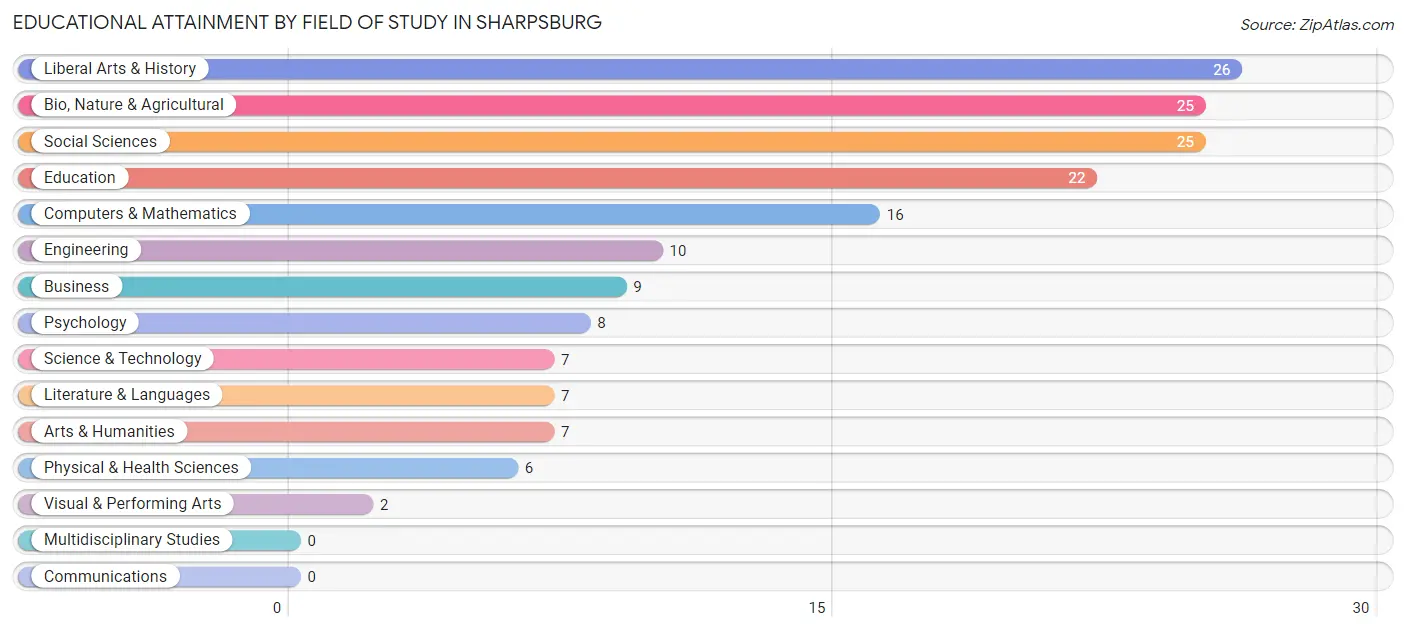
| Field of Study | # Graduates | % Graduates |
| Computers & Mathematics | 16 | 9.4% |
| Bio, Nature & Agricultural | 25 | 14.7% |
| Physical & Health Sciences | 6 | 3.5% |
| Psychology | 8 | 4.7% |
| Social Sciences | 25 | 14.7% |
| Engineering | 10 | 5.9% |
| Multidisciplinary Studies | 0 | 0.0% |
| Science & Technology | 7 | 4.1% |
| Business | 9 | 5.3% |
| Education | 22 | 12.9% |
| Literature & Languages | 7 | 4.1% |
| Liberal Arts & History | 26 | 15.3% |
| Visual & Performing Arts | 2 | 1.2% |
| Communications | 0 | 0.0% |
| Arts & Humanities | 7 | 4.1% |
| Total | 170 | 100.0% |
Transportation & Commute in Sharpsburg
Vehicle Availability by Sex in Sharpsburg
The most prevalent vehicle ownership categories in Sharpsburg are males with 2 vehicles (70, accounting for 30.4%) and females with 2 vehicles (73, making up 38.0%).
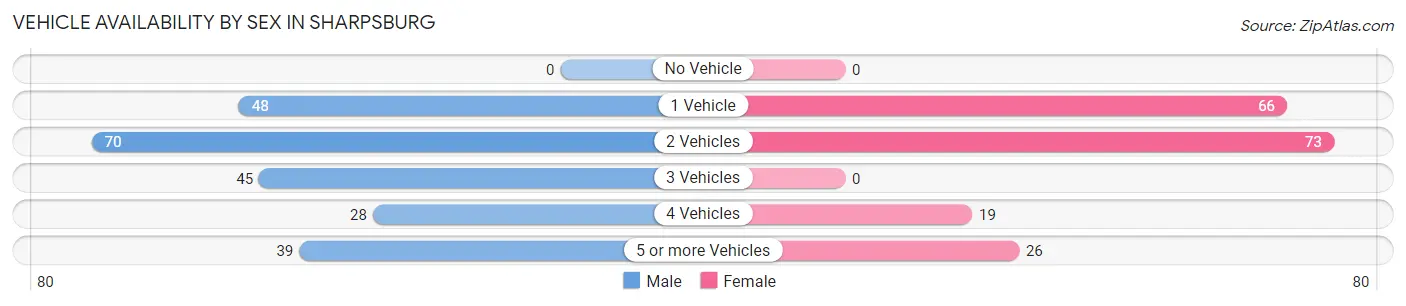
| Vehicles Available | Male | Female |
| No Vehicle | 0 (0.0%) | 0 (0.0%) |
| 1 Vehicle | 48 (20.9%) | 66 (35.9%) |
| 2 Vehicles | 70 (30.4%) | 73 (39.7%) |
| 3 Vehicles | 45 (19.6%) | 0 (0.0%) |
| 4 Vehicles | 28 (12.2%) | 19 (10.3%) |
| 5 or more Vehicles | 39 (17.0%) | 26 (14.1%) |
| Total | 230 (100.0%) | 184 (100.0%) |
Commute Time in Sharpsburg
The most frequently occuring commute durations in Sharpsburg are 45 to 59 minutes (67 commuters, 18.1%), 30 to 34 minutes (54 commuters, 14.6%), and 20 to 24 minutes (43 commuters, 11.6%).
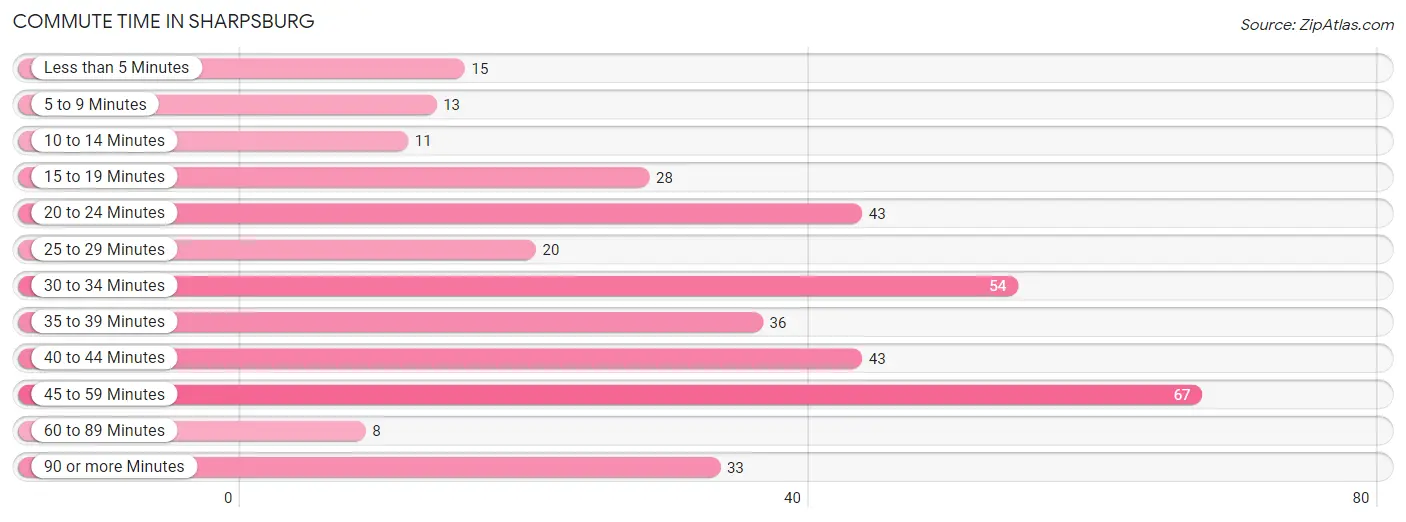
| Commute Time | # Commuters | % Commuters |
| Less than 5 Minutes | 15 | 4.0% |
| 5 to 9 Minutes | 13 | 3.5% |
| 10 to 14 Minutes | 11 | 3.0% |
| 15 to 19 Minutes | 28 | 7.5% |
| 20 to 24 Minutes | 43 | 11.6% |
| 25 to 29 Minutes | 20 | 5.4% |
| 30 to 34 Minutes | 54 | 14.6% |
| 35 to 39 Minutes | 36 | 9.7% |
| 40 to 44 Minutes | 43 | 11.6% |
| 45 to 59 Minutes | 67 | 18.1% |
| 60 to 89 Minutes | 8 | 2.2% |
| 90 or more Minutes | 33 | 8.9% |
Commute Time by Sex in Sharpsburg
The most common commute times in Sharpsburg are 45 to 59 minutes (42 commuters, 19.7%) for males and 40 to 44 minutes (27 commuters, 17.1%) for females.
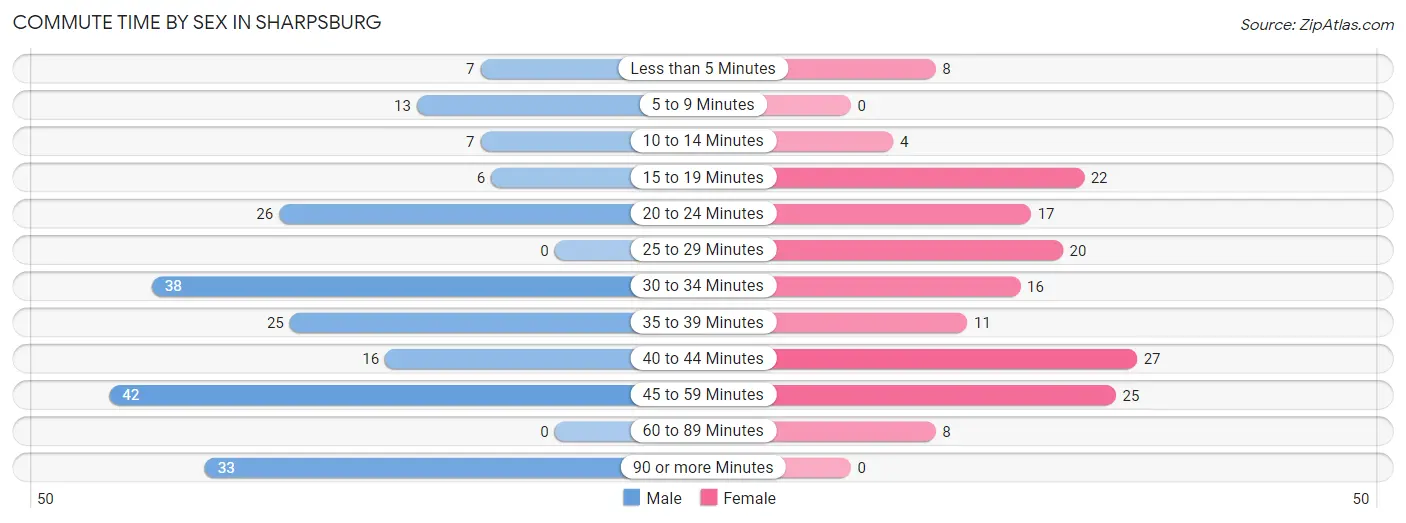
| Commute Time | Male | Female |
| Less than 5 Minutes | 7 (3.3%) | 8 (5.1%) |
| 5 to 9 Minutes | 13 (6.1%) | 0 (0.0%) |
| 10 to 14 Minutes | 7 (3.3%) | 4 (2.5%) |
| 15 to 19 Minutes | 6 (2.8%) | 22 (13.9%) |
| 20 to 24 Minutes | 26 (12.2%) | 17 (10.8%) |
| 25 to 29 Minutes | 0 (0.0%) | 20 (12.7%) |
| 30 to 34 Minutes | 38 (17.8%) | 16 (10.1%) |
| 35 to 39 Minutes | 25 (11.7%) | 11 (7.0%) |
| 40 to 44 Minutes | 16 (7.5%) | 27 (17.1%) |
| 45 to 59 Minutes | 42 (19.7%) | 25 (15.8%) |
| 60 to 89 Minutes | 0 (0.0%) | 8 (5.1%) |
| 90 or more Minutes | 33 (15.5%) | 0 (0.0%) |
Time of Departure to Work by Sex in Sharpsburg
The most frequent times of departure to work in Sharpsburg are 6:00 AM to 6:29 AM (52, 24.4%) for males and 7:00 AM to 7:29 AM (41, 26.0%) for females.
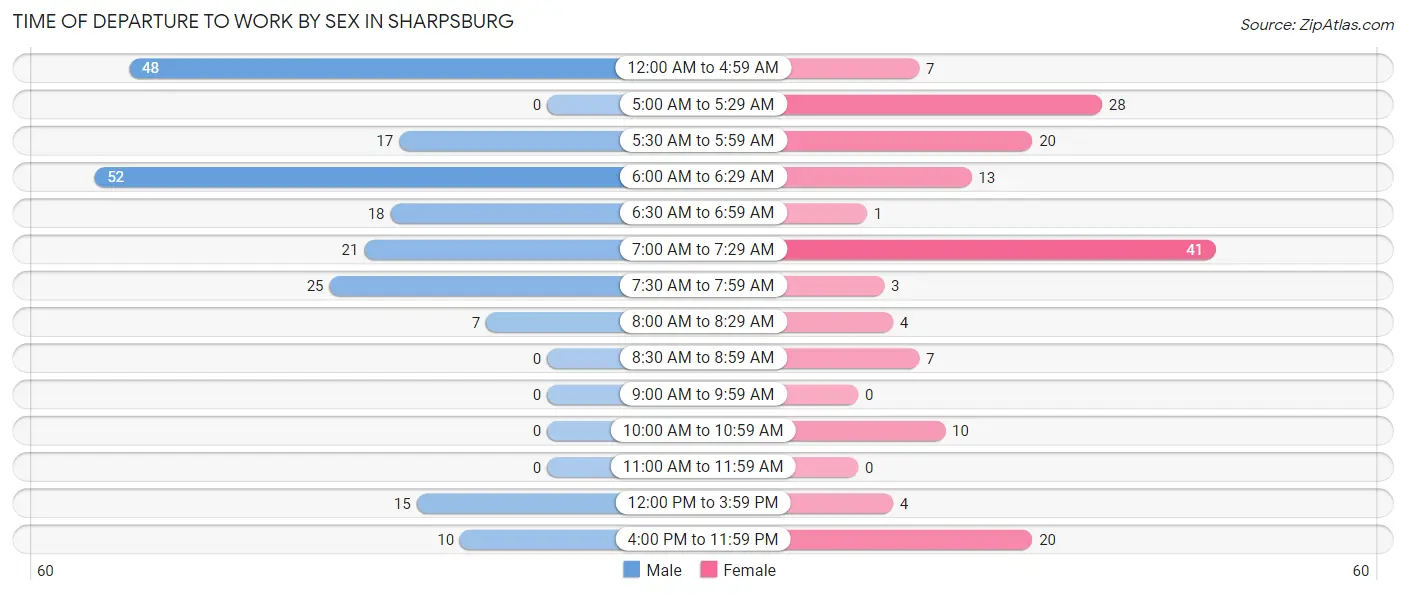
| Time of Departure | Male | Female |
| 12:00 AM to 4:59 AM | 48 (22.5%) | 7 (4.4%) |
| 5:00 AM to 5:29 AM | 0 (0.0%) | 28 (17.7%) |
| 5:30 AM to 5:59 AM | 17 (8.0%) | 20 (12.7%) |
| 6:00 AM to 6:29 AM | 52 (24.4%) | 13 (8.2%) |
| 6:30 AM to 6:59 AM | 18 (8.5%) | 1 (0.6%) |
| 7:00 AM to 7:29 AM | 21 (9.9%) | 41 (26.0%) |
| 7:30 AM to 7:59 AM | 25 (11.7%) | 3 (1.9%) |
| 8:00 AM to 8:29 AM | 7 (3.3%) | 4 (2.5%) |
| 8:30 AM to 8:59 AM | 0 (0.0%) | 7 (4.4%) |
| 9:00 AM to 9:59 AM | 0 (0.0%) | 0 (0.0%) |
| 10:00 AM to 10:59 AM | 0 (0.0%) | 10 (6.3%) |
| 11:00 AM to 11:59 AM | 0 (0.0%) | 0 (0.0%) |
| 12:00 PM to 3:59 PM | 15 (7.0%) | 4 (2.5%) |
| 4:00 PM to 11:59 PM | 10 (4.7%) | 20 (12.7%) |
| Total | 213 (100.0%) | 158 (100.0%) |
Housing Occupancy in Sharpsburg
Occupancy by Ownership in Sharpsburg
Of the total 338 dwellings in Sharpsburg, owner-occupied units account for 248 (73.4%), while renter-occupied units make up 90 (26.6%).
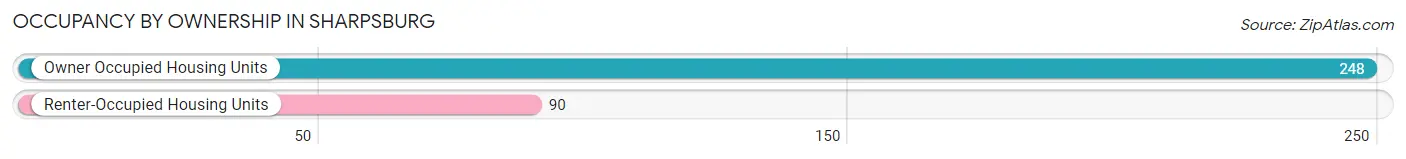
| Occupancy | # Housing Units | % Housing Units |
| Owner Occupied Housing Units | 248 | 73.4% |
| Renter-Occupied Housing Units | 90 | 26.6% |
| Total Occupied Housing Units | 338 | 100.0% |
Occupancy by Household Size in Sharpsburg
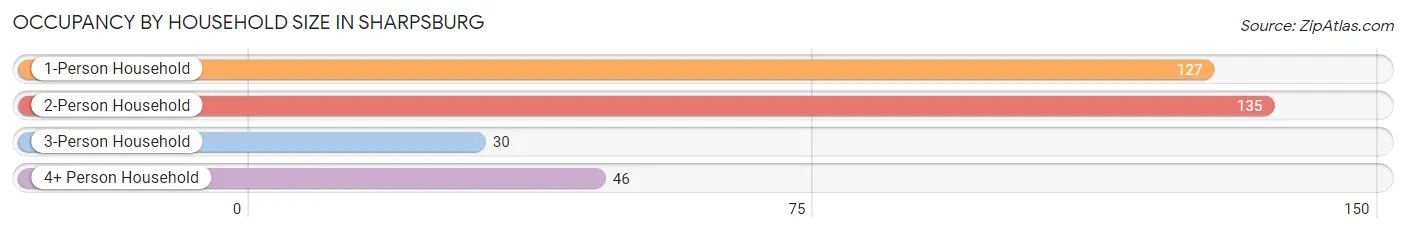
| Household Size | # Housing Units | % Housing Units |
| 1-Person Household | 127 | 37.6% |
| 2-Person Household | 135 | 39.9% |
| 3-Person Household | 30 | 8.9% |
| 4+ Person Household | 46 | 13.6% |
| Total Housing Units | 338 | 100.0% |
Occupancy by Ownership by Household Size in Sharpsburg
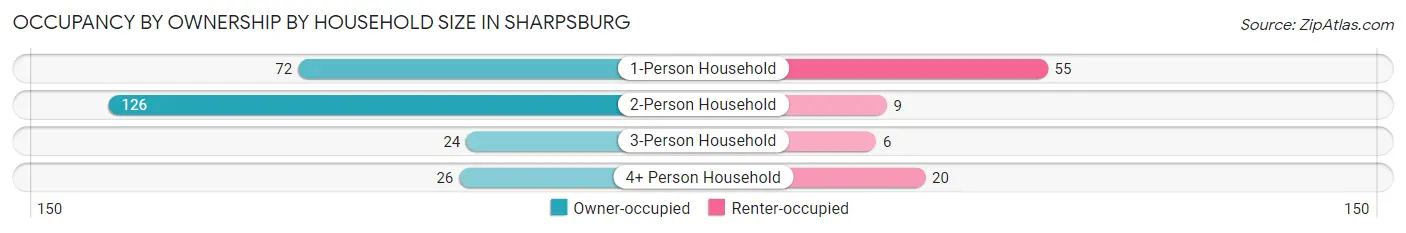
| Household Size | Owner-occupied | Renter-occupied |
| 1-Person Household | 72 (56.7%) | 55 (43.3%) |
| 2-Person Household | 126 (93.3%) | 9 (6.7%) |
| 3-Person Household | 24 (80.0%) | 6 (20.0%) |
| 4+ Person Household | 26 (56.5%) | 20 (43.5%) |
| Total Housing Units | 248 (73.4%) | 90 (26.6%) |
Occupancy by Educational Attainment in Sharpsburg
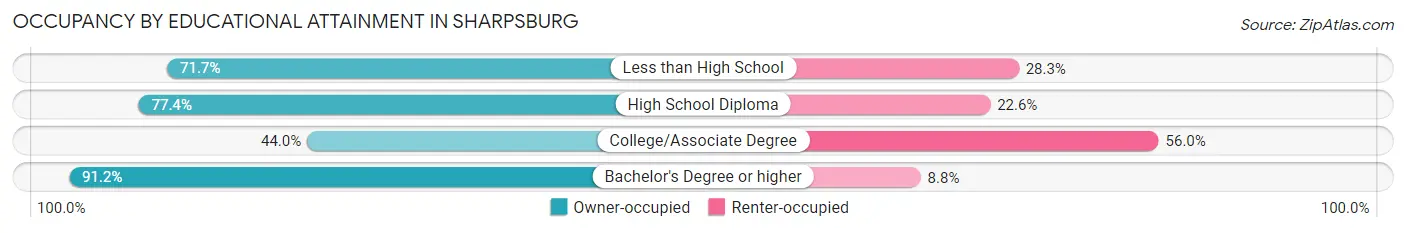
| Household Size | Owner-occupied | Renter-occupied |
| Less than High School | 33 (71.7%) | 13 (28.3%) |
| High School Diploma | 89 (77.4%) | 26 (22.6%) |
| College/Associate Degree | 33 (44.0%) | 42 (56.0%) |
| Bachelor's Degree or higher | 93 (91.2%) | 9 (8.8%) |
Occupancy by Age of Householder in Sharpsburg
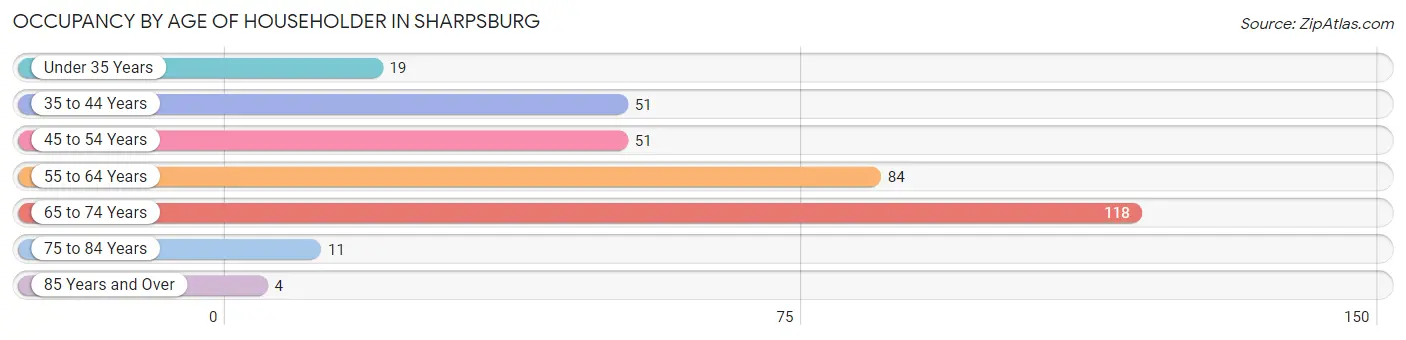
| Age Bracket | # Households | % Households |
| Under 35 Years | 19 | 5.6% |
| 35 to 44 Years | 51 | 15.1% |
| 45 to 54 Years | 51 | 15.1% |
| 55 to 64 Years | 84 | 24.8% |
| 65 to 74 Years | 118 | 34.9% |
| 75 to 84 Years | 11 | 3.3% |
| 85 Years and Over | 4 | 1.2% |
| Total | 338 | 100.0% |
Housing Finances in Sharpsburg
Median Income by Occupancy in Sharpsburg
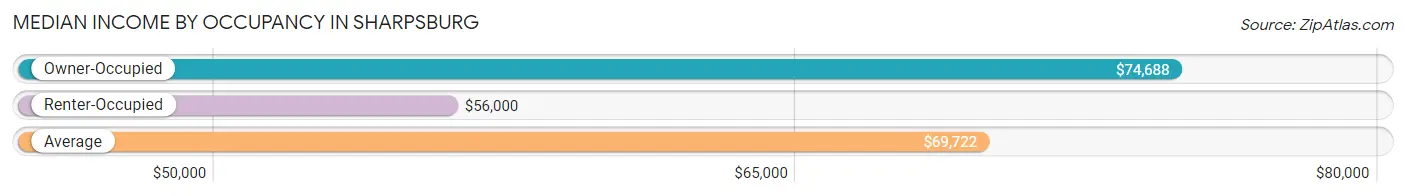
| Occupancy Type | # Households | Median Income |
| Owner-Occupied | 248 (73.4%) | $74,688 |
| Renter-Occupied | 90 (26.6%) | $56,000 |
| Average | 338 (100.0%) | $69,722 |
Occupancy by Householder Income Bracket in Sharpsburg
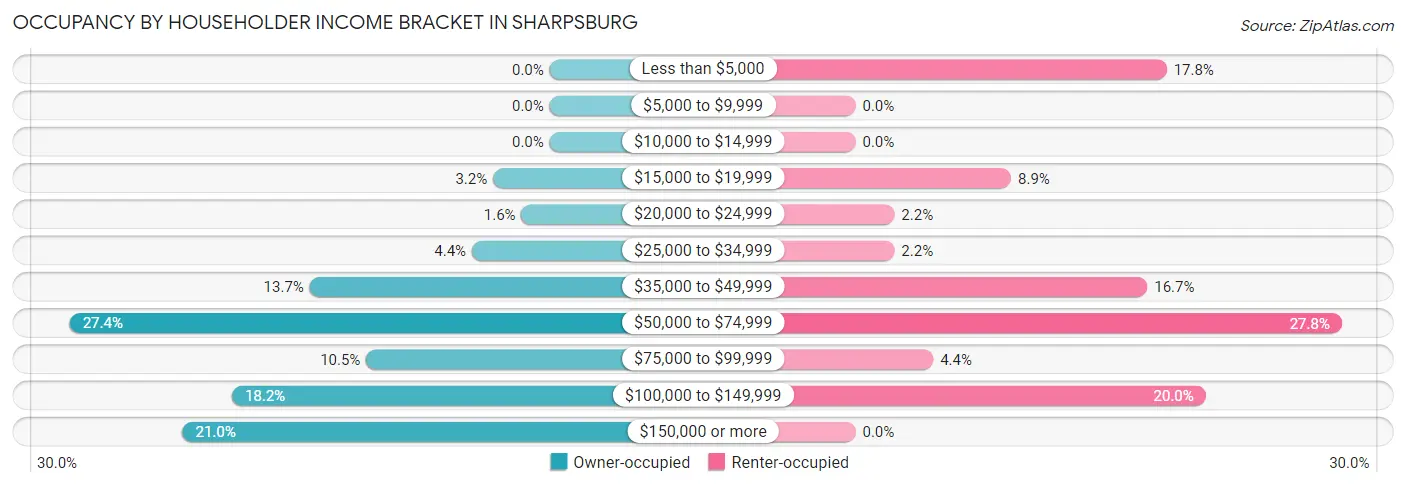
| Income Bracket | Owner-occupied | Renter-occupied |
| Less than $5,000 | 0 (0.0%) | 16 (17.8%) |
| $5,000 to $9,999 | 0 (0.0%) | 0 (0.0%) |
| $10,000 to $14,999 | 0 (0.0%) | 0 (0.0%) |
| $15,000 to $19,999 | 8 (3.2%) | 8 (8.9%) |
| $20,000 to $24,999 | 4 (1.6%) | 2 (2.2%) |
| $25,000 to $34,999 | 11 (4.4%) | 2 (2.2%) |
| $35,000 to $49,999 | 34 (13.7%) | 15 (16.7%) |
| $50,000 to $74,999 | 68 (27.4%) | 25 (27.8%) |
| $75,000 to $99,999 | 26 (10.5%) | 4 (4.4%) |
| $100,000 to $149,999 | 45 (18.1%) | 18 (20.0%) |
| $150,000 or more | 52 (21.0%) | 0 (0.0%) |
| Total | 248 (100.0%) | 90 (100.0%) |
Monthly Housing Cost Tiers in Sharpsburg
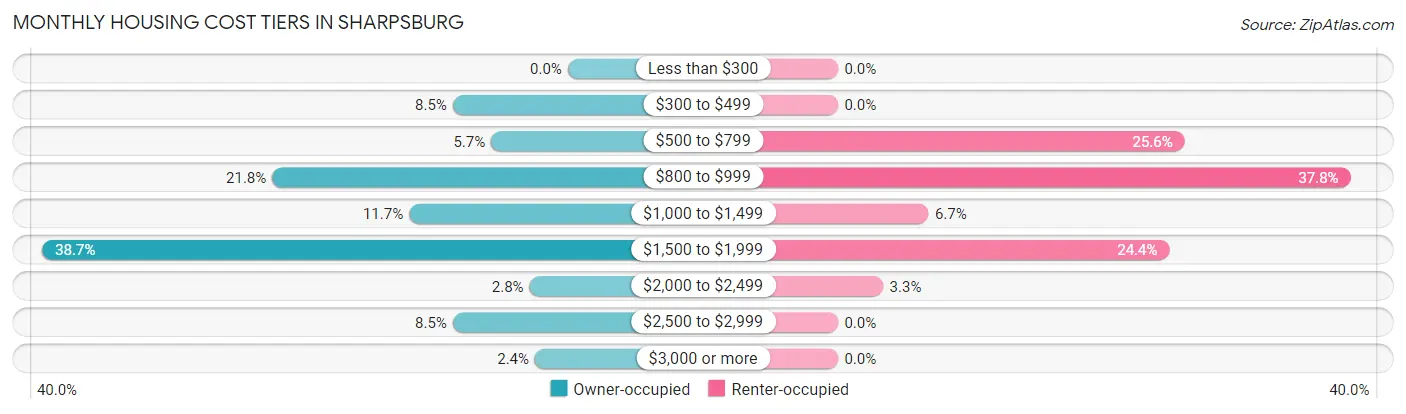
| Monthly Cost | Owner-occupied | Renter-occupied |
| Less than $300 | 0 (0.0%) | 0 (0.0%) |
| $300 to $499 | 21 (8.5%) | 0 (0.0%) |
| $500 to $799 | 14 (5.7%) | 23 (25.6%) |
| $800 to $999 | 54 (21.8%) | 34 (37.8%) |
| $1,000 to $1,499 | 29 (11.7%) | 6 (6.7%) |
| $1,500 to $1,999 | 96 (38.7%) | 22 (24.4%) |
| $2,000 to $2,499 | 7 (2.8%) | 3 (3.3%) |
| $2,500 to $2,999 | 21 (8.5%) | 0 (0.0%) |
| $3,000 or more | 6 (2.4%) | 0 (0.0%) |
| Total | 248 (100.0%) | 90 (100.0%) |
Physical Housing Characteristics in Sharpsburg
Housing Structures in Sharpsburg
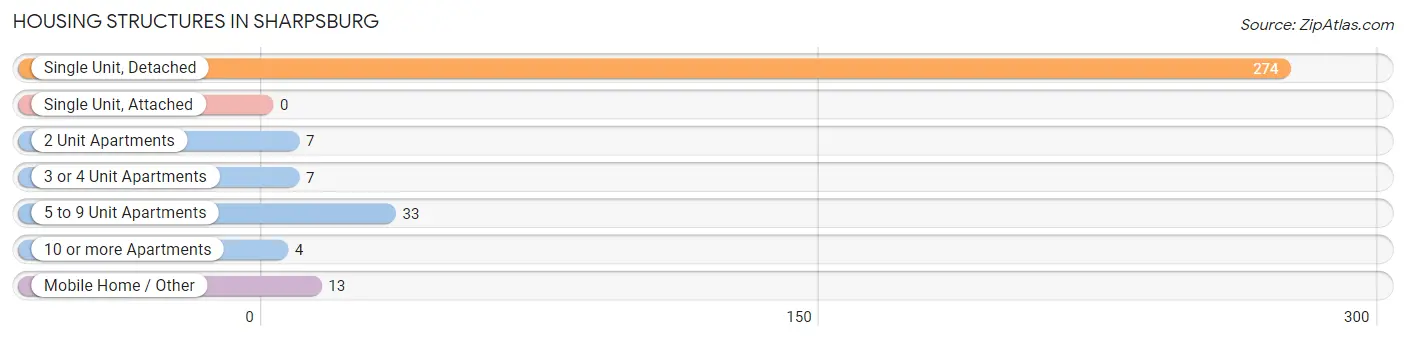
| Structure Type | # Housing Units | % Housing Units |
| Single Unit, Detached | 274 | 81.1% |
| Single Unit, Attached | 0 | 0.0% |
| 2 Unit Apartments | 7 | 2.1% |
| 3 or 4 Unit Apartments | 7 | 2.1% |
| 5 to 9 Unit Apartments | 33 | 9.8% |
| 10 or more Apartments | 4 | 1.2% |
| Mobile Home / Other | 13 | 3.8% |
| Total | 338 | 100.0% |
Housing Structures by Occupancy in Sharpsburg
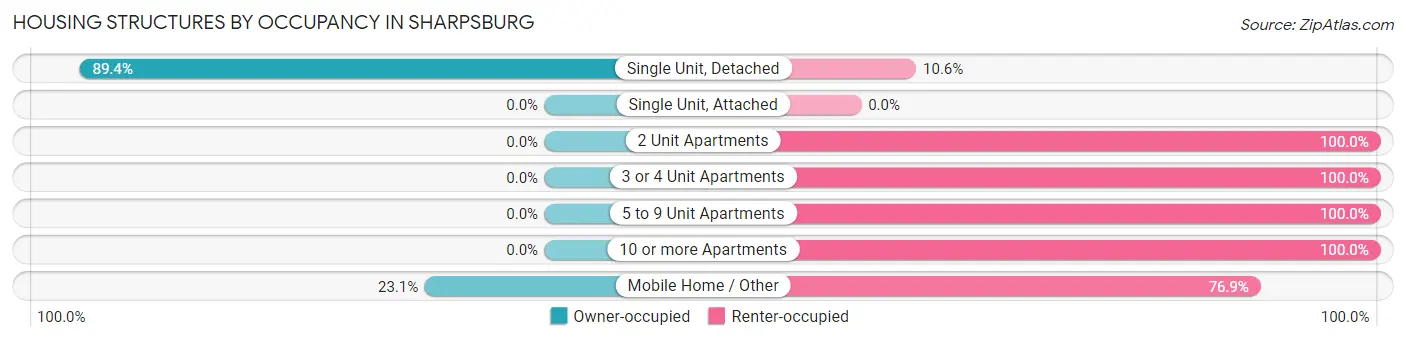
| Structure Type | Owner-occupied | Renter-occupied |
| Single Unit, Detached | 245 (89.4%) | 29 (10.6%) |
| Single Unit, Attached | 0 (0.0%) | 0 (0.0%) |
| 2 Unit Apartments | 0 (0.0%) | 7 (100.0%) |
| 3 or 4 Unit Apartments | 0 (0.0%) | 7 (100.0%) |
| 5 to 9 Unit Apartments | 0 (0.0%) | 33 (100.0%) |
| 10 or more Apartments | 0 (0.0%) | 4 (100.0%) |
| Mobile Home / Other | 3 (23.1%) | 10 (76.9%) |
| Total | 248 (73.4%) | 90 (26.6%) |
Housing Structures by Number of Rooms in Sharpsburg
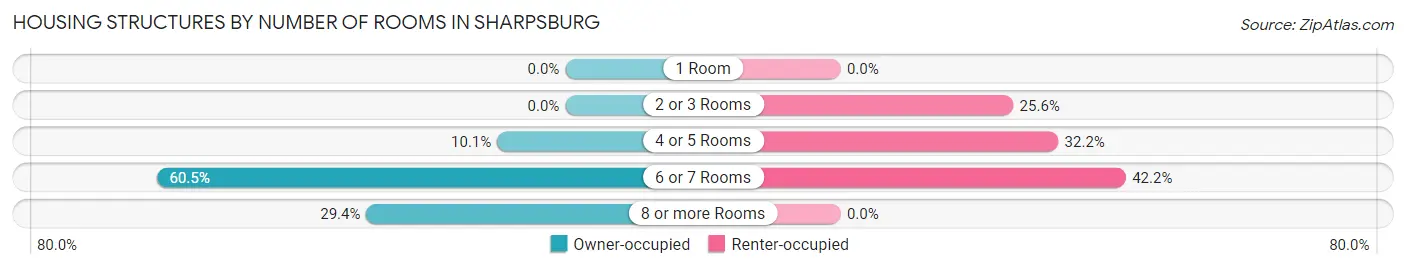
| Number of Rooms | Owner-occupied | Renter-occupied |
| 1 Room | 0 (0.0%) | 0 (0.0%) |
| 2 or 3 Rooms | 0 (0.0%) | 23 (25.6%) |
| 4 or 5 Rooms | 25 (10.1%) | 29 (32.2%) |
| 6 or 7 Rooms | 150 (60.5%) | 38 (42.2%) |
| 8 or more Rooms | 73 (29.4%) | 0 (0.0%) |
| Total | 248 (100.0%) | 90 (100.0%) |
Housing Structure by Heating Type in Sharpsburg
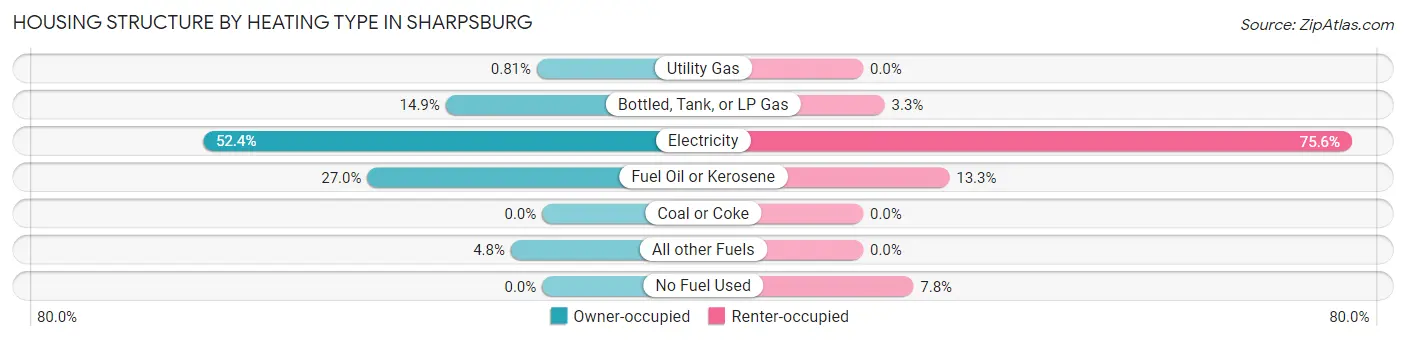
| Heating Type | Owner-occupied | Renter-occupied |
| Utility Gas | 2 (0.8%) | 0 (0.0%) |
| Bottled, Tank, or LP Gas | 37 (14.9%) | 3 (3.3%) |
| Electricity | 130 (52.4%) | 68 (75.6%) |
| Fuel Oil or Kerosene | 67 (27.0%) | 12 (13.3%) |
| Coal or Coke | 0 (0.0%) | 0 (0.0%) |
| All other Fuels | 12 (4.8%) | 0 (0.0%) |
| No Fuel Used | 0 (0.0%) | 7 (7.8%) |
| Total | 248 (100.0%) | 90 (100.0%) |
Household Vehicle Usage in Sharpsburg
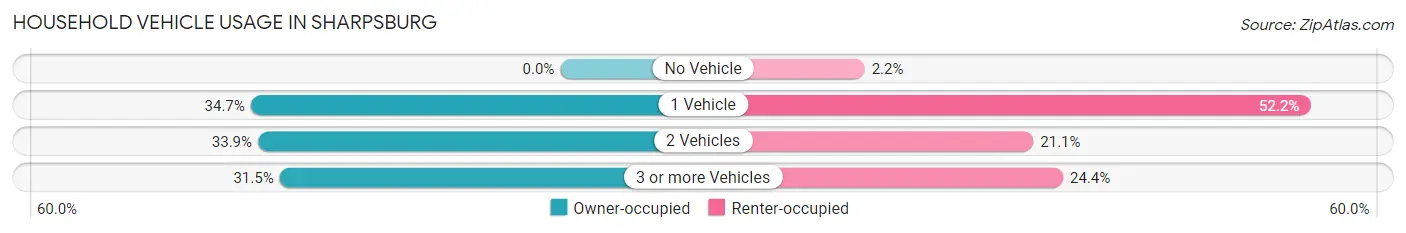
| Vehicles per Household | Owner-occupied | Renter-occupied |
| No Vehicle | 0 (0.0%) | 2 (2.2%) |
| 1 Vehicle | 86 (34.7%) | 47 (52.2%) |
| 2 Vehicles | 84 (33.9%) | 19 (21.1%) |
| 3 or more Vehicles | 78 (31.5%) | 22 (24.4%) |
| Total | 248 (100.0%) | 90 (100.0%) |
Real Estate & Mortgages in Sharpsburg
Real Estate and Mortgage Overview in Sharpsburg
| Characteristic | Without Mortgage | With Mortgage |
| Housing Units | 44 | 204 |
| Median Property Value | $300,000 | $216,100 |
| Median Household Income | $87,500 | $42 |
| Monthly Housing Costs | $507 | $6 |
| Real Estate Taxes | $2,043 | $0 |
Property Value by Mortgage Status in Sharpsburg
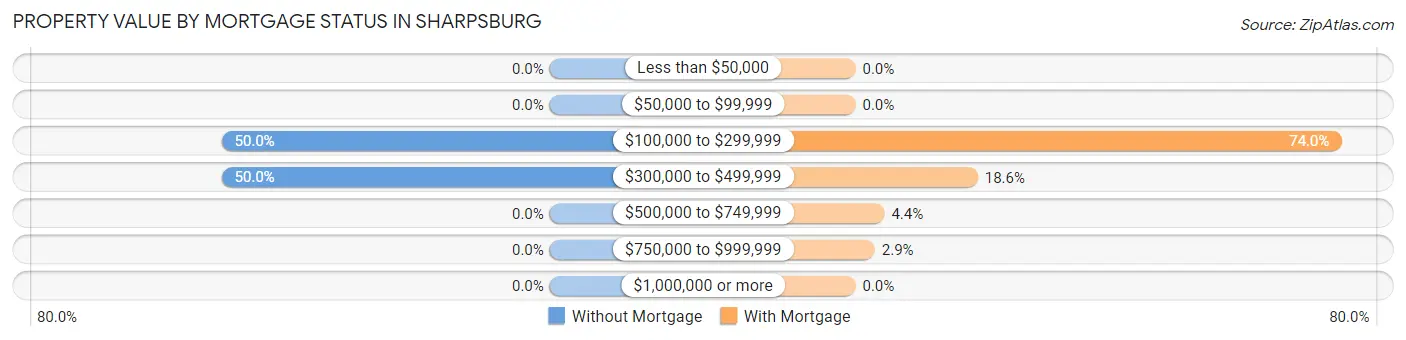
| Property Value | Without Mortgage | With Mortgage |
| Less than $50,000 | 0 (0.0%) | 0 (0.0%) |
| $50,000 to $99,999 | 0 (0.0%) | 0 (0.0%) |
| $100,000 to $299,999 | 22 (50.0%) | 151 (74.0%) |
| $300,000 to $499,999 | 22 (50.0%) | 38 (18.6%) |
| $500,000 to $749,999 | 0 (0.0%) | 9 (4.4%) |
| $750,000 to $999,999 | 0 (0.0%) | 6 (2.9%) |
| $1,000,000 or more | 0 (0.0%) | 0 (0.0%) |
| Total | 44 (100.0%) | 204 (100.0%) |
Household Income by Mortgage Status in Sharpsburg
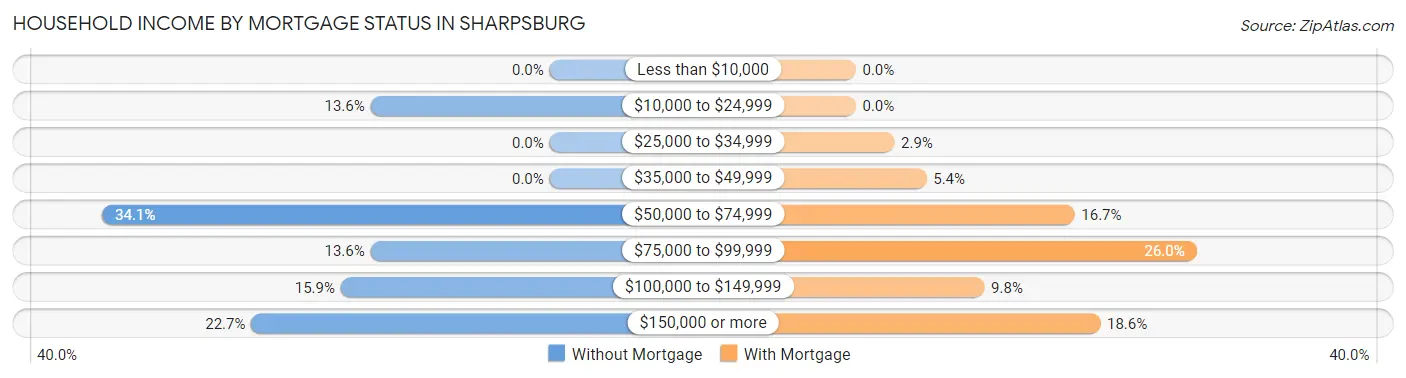
| Household Income | Without Mortgage | With Mortgage |
| Less than $10,000 | 0 (0.0%) | 0 (0.0%) |
| $10,000 to $24,999 | 6 (13.6%) | 0 (0.0%) |
| $25,000 to $34,999 | 0 (0.0%) | 6 (2.9%) |
| $35,000 to $49,999 | 0 (0.0%) | 11 (5.4%) |
| $50,000 to $74,999 | 15 (34.1%) | 34 (16.7%) |
| $75,000 to $99,999 | 6 (13.6%) | 53 (26.0%) |
| $100,000 to $149,999 | 7 (15.9%) | 20 (9.8%) |
| $150,000 or more | 10 (22.7%) | 38 (18.6%) |
| Total | 44 (100.0%) | 204 (100.0%) |
Property Value to Household Income Ratio in Sharpsburg
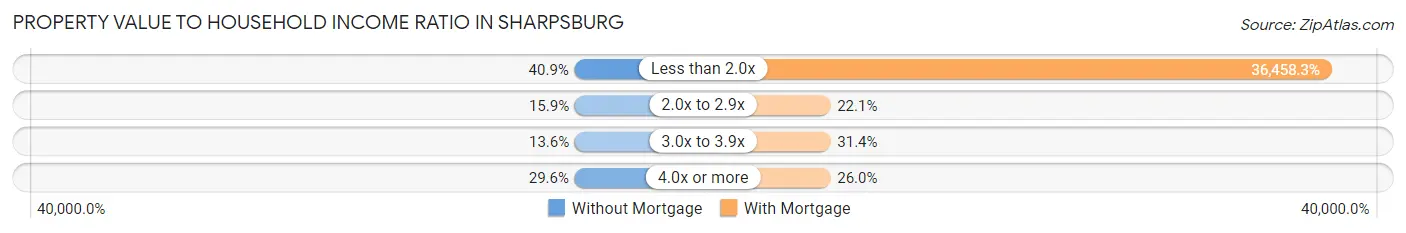
| Value-to-Income Ratio | Without Mortgage | With Mortgage |
| Less than 2.0x | 18 (40.9%) | 74,375 (36,458.3%) |
| 2.0x to 2.9x | 7 (15.9%) | 45 (22.1%) |
| 3.0x to 3.9x | 6 (13.6%) | 64 (31.4%) |
| 4.0x or more | 13 (29.5%) | 53 (26.0%) |
| Total | 44 (100.0%) | 204 (100.0%) |
Real Estate Taxes by Mortgage Status in Sharpsburg
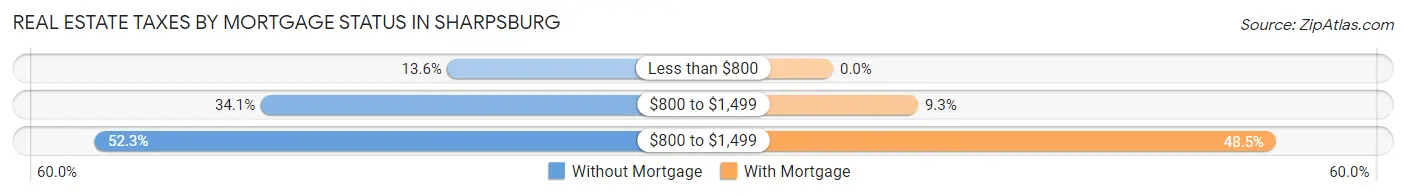
| Property Taxes | Without Mortgage | With Mortgage |
| Less than $800 | 6 (13.6%) | 0 (0.0%) |
| $800 to $1,499 | 15 (34.1%) | 19 (9.3%) |
| $800 to $1,499 | 23 (52.3%) | 99 (48.5%) |
| Total | 44 (100.0%) | 204 (100.0%) |
Health & Disability in Sharpsburg
Health Insurance Coverage by Age in Sharpsburg
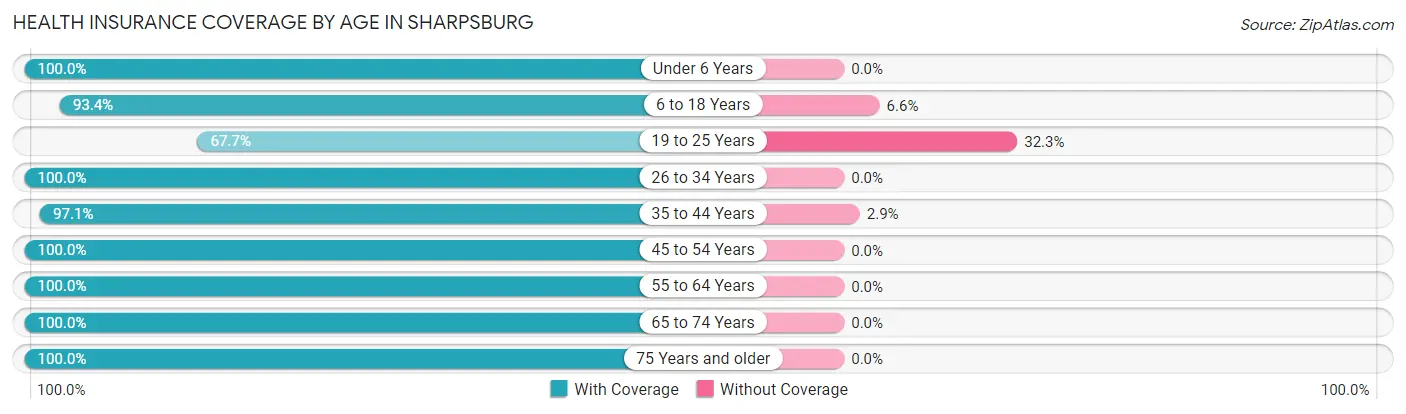
| Age Bracket | With Coverage | Without Coverage |
| Under 6 Years | 30 (100.0%) | 0 (0.0%) |
| 6 to 18 Years | 85 (93.4%) | 6 (6.6%) |
| 19 to 25 Years | 21 (67.7%) | 10 (32.3%) |
| 26 to 34 Years | 49 (100.0%) | 0 (0.0%) |
| 35 to 44 Years | 134 (97.1%) | 4 (2.9%) |
| 45 to 54 Years | 119 (100.0%) | 0 (0.0%) |
| 55 to 64 Years | 107 (100.0%) | 0 (0.0%) |
| 65 to 74 Years | 139 (100.0%) | 0 (0.0%) |
| 75 Years and older | 18 (100.0%) | 0 (0.0%) |
| Total | 702 (97.2%) | 20 (2.8%) |
Health Insurance Coverage by Citizenship Status in Sharpsburg
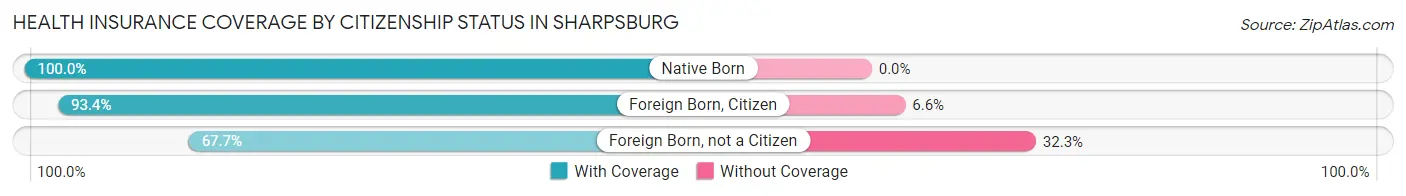
| Citizenship Status | With Coverage | Without Coverage |
| Native Born | 30 (100.0%) | 0 (0.0%) |
| Foreign Born, Citizen | 85 (93.4%) | 6 (6.6%) |
| Foreign Born, not a Citizen | 21 (67.7%) | 10 (32.3%) |
Health Insurance Coverage by Household Income in Sharpsburg
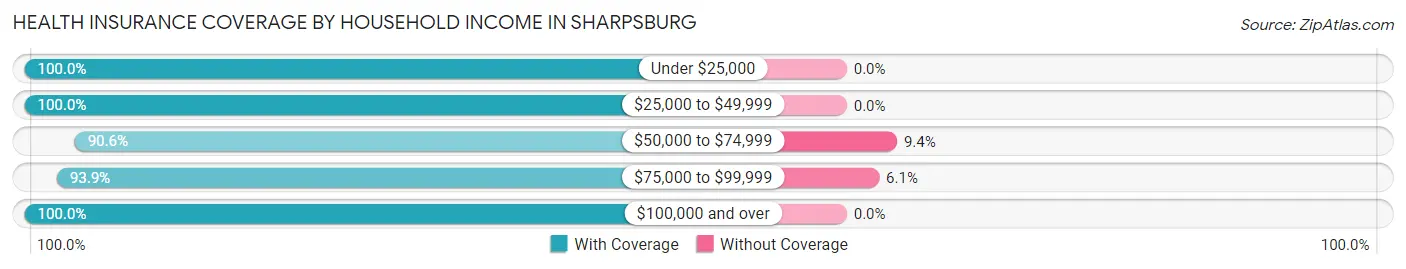
| Household Income | With Coverage | Without Coverage |
| Under $25,000 | 45 (100.0%) | 0 (0.0%) |
| $25,000 to $49,999 | 110 (100.0%) | 0 (0.0%) |
| $50,000 to $74,999 | 135 (90.6%) | 14 (9.4%) |
| $75,000 to $99,999 | 93 (93.9%) | 6 (6.1%) |
| $100,000 and over | 319 (100.0%) | 0 (0.0%) |
Public vs Private Health Insurance Coverage by Age in Sharpsburg
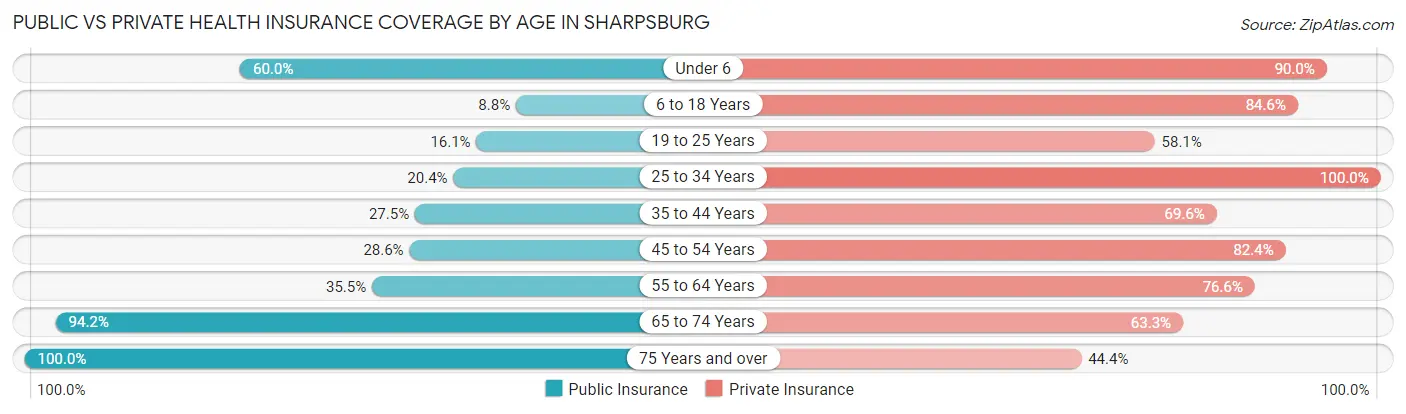
| Age Bracket | Public Insurance | Private Insurance |
| Under 6 | 18 (60.0%) | 27 (90.0%) |
| 6 to 18 Years | 8 (8.8%) | 77 (84.6%) |
| 19 to 25 Years | 5 (16.1%) | 18 (58.1%) |
| 25 to 34 Years | 10 (20.4%) | 49 (100.0%) |
| 35 to 44 Years | 38 (27.5%) | 96 (69.6%) |
| 45 to 54 Years | 34 (28.6%) | 98 (82.4%) |
| 55 to 64 Years | 38 (35.5%) | 82 (76.6%) |
| 65 to 74 Years | 131 (94.2%) | 88 (63.3%) |
| 75 Years and over | 18 (100.0%) | 8 (44.4%) |
| Total | 300 (41.5%) | 543 (75.2%) |
Disability Status by Sex by Age in Sharpsburg
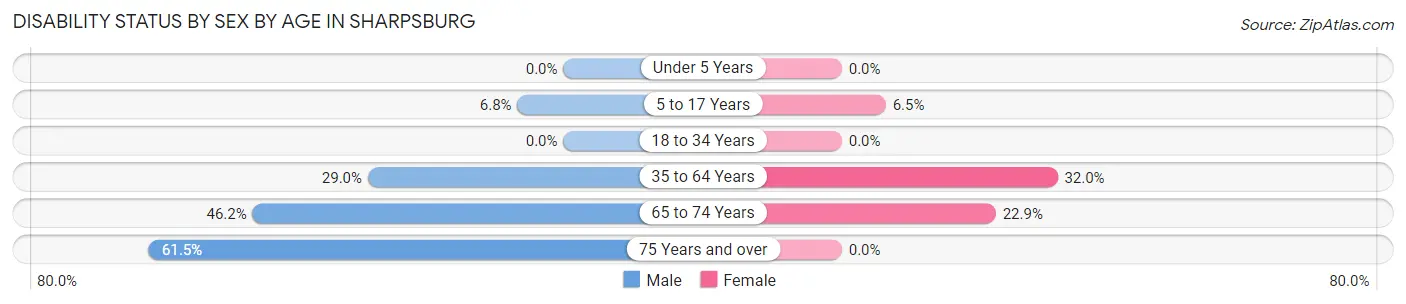
| Age Bracket | Male | Female |
| Under 5 Years | 0 (0.0%) | 0 (0.0%) |
| 5 to 17 Years | 3 (6.8%) | 3 (6.5%) |
| 18 to 34 Years | 0 (0.0%) | 0 (0.0%) |
| 35 to 64 Years | 54 (29.0%) | 57 (32.0%) |
| 65 to 74 Years | 48 (46.2%) | 8 (22.9%) |
| 75 Years and over | 8 (61.5%) | 0 (0.0%) |
Disability Class by Sex by Age in Sharpsburg
Disability Class: Hearing Difficulty
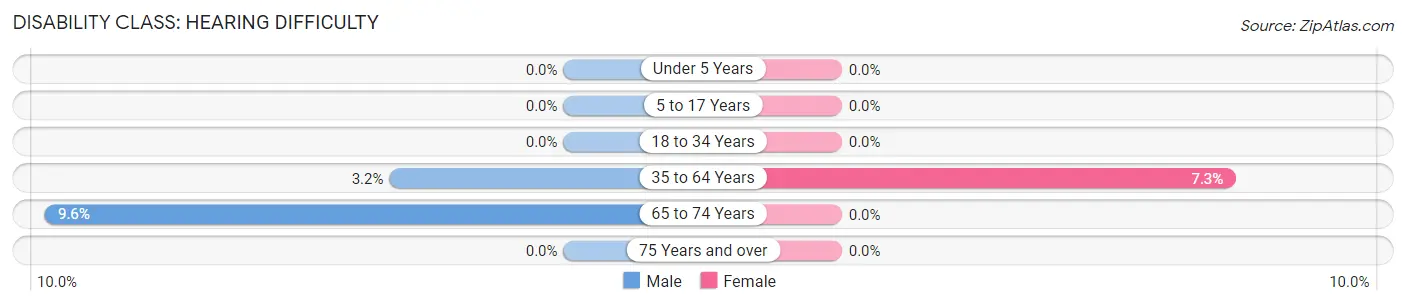
| Age Bracket | Male | Female |
| Under 5 Years | 0 (0.0%) | 0 (0.0%) |
| 5 to 17 Years | 0 (0.0%) | 0 (0.0%) |
| 18 to 34 Years | 0 (0.0%) | 0 (0.0%) |
| 35 to 64 Years | 6 (3.2%) | 13 (7.3%) |
| 65 to 74 Years | 10 (9.6%) | 0 (0.0%) |
| 75 Years and over | 0 (0.0%) | 0 (0.0%) |
Disability Class: Vision Difficulty
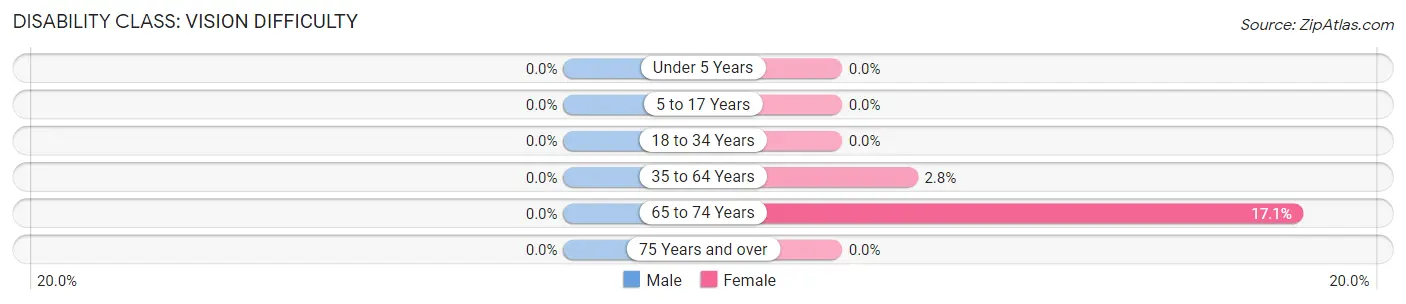
| Age Bracket | Male | Female |
| Under 5 Years | 0 (0.0%) | 0 (0.0%) |
| 5 to 17 Years | 0 (0.0%) | 0 (0.0%) |
| 18 to 34 Years | 0 (0.0%) | 0 (0.0%) |
| 35 to 64 Years | 0 (0.0%) | 5 (2.8%) |
| 65 to 74 Years | 0 (0.0%) | 6 (17.1%) |
| 75 Years and over | 0 (0.0%) | 0 (0.0%) |
Disability Class: Cognitive Difficulty
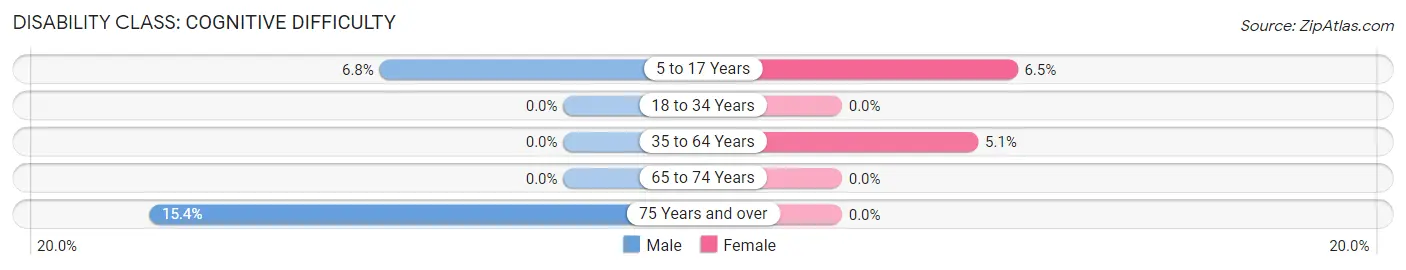
| Age Bracket | Male | Female |
| 5 to 17 Years | 3 (6.8%) | 3 (6.5%) |
| 18 to 34 Years | 0 (0.0%) | 0 (0.0%) |
| 35 to 64 Years | 0 (0.0%) | 9 (5.1%) |
| 65 to 74 Years | 0 (0.0%) | 0 (0.0%) |
| 75 Years and over | 2 (15.4%) | 0 (0.0%) |
Disability Class: Ambulatory Difficulty
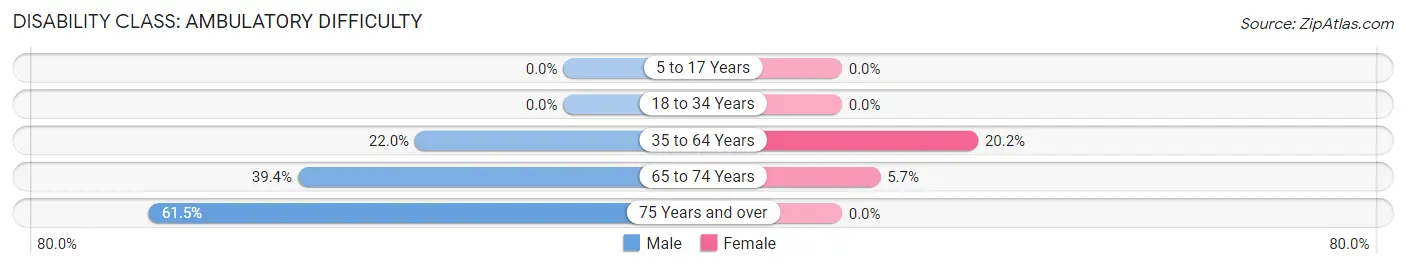
| Age Bracket | Male | Female |
| 5 to 17 Years | 0 (0.0%) | 0 (0.0%) |
| 18 to 34 Years | 0 (0.0%) | 0 (0.0%) |
| 35 to 64 Years | 41 (22.0%) | 36 (20.2%) |
| 65 to 74 Years | 41 (39.4%) | 2 (5.7%) |
| 75 Years and over | 8 (61.5%) | 0 (0.0%) |
Disability Class: Self-Care Difficulty
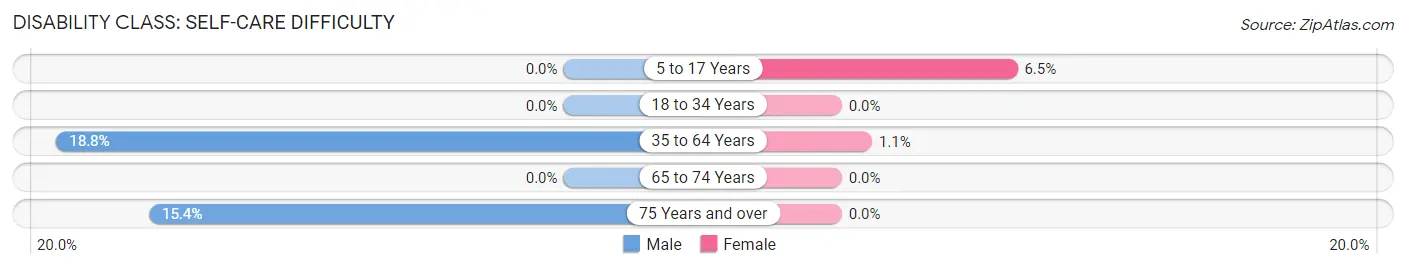
| Age Bracket | Male | Female |
| 5 to 17 Years | 0 (0.0%) | 3 (6.5%) |
| 18 to 34 Years | 0 (0.0%) | 0 (0.0%) |
| 35 to 64 Years | 35 (18.8%) | 2 (1.1%) |
| 65 to 74 Years | 0 (0.0%) | 0 (0.0%) |
| 75 Years and over | 2 (15.4%) | 0 (0.0%) |
Technology Access in Sharpsburg
Computing Device Access in Sharpsburg
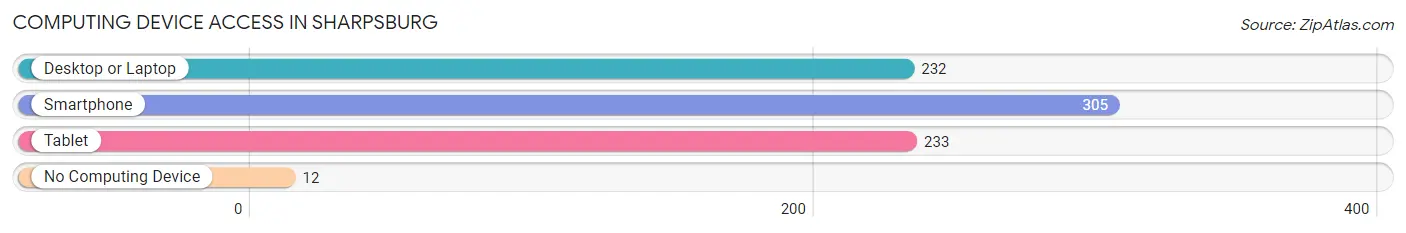
| Device Type | # Households | % Households |
| Desktop or Laptop | 232 | 68.6% |
| Smartphone | 305 | 90.2% |
| Tablet | 233 | 68.9% |
| No Computing Device | 12 | 3.5% |
| Total | 338 | 100.0% |
Internet Access in Sharpsburg
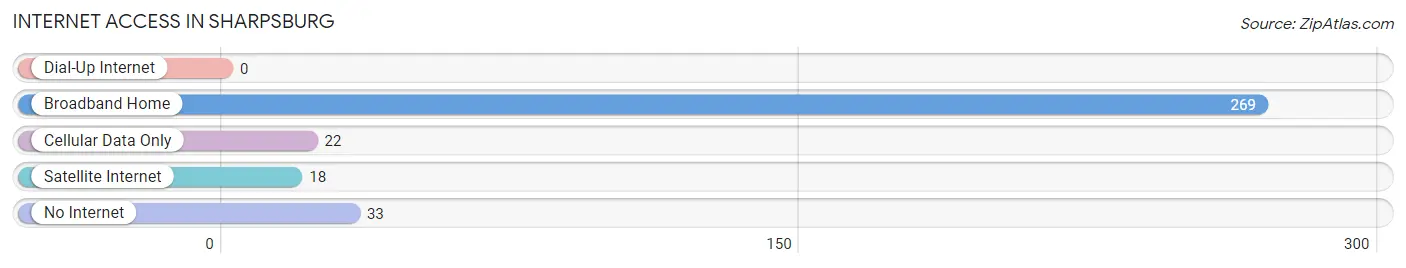
| Internet Type | # Households | % Households |
| Dial-Up Internet | 0 | 0.0% |
| Broadband Home | 269 | 79.6% |
| Cellular Data Only | 22 | 6.5% |
| Satellite Internet | 18 | 5.3% |
| No Internet | 33 | 9.8% |
| Total | 338 | 100.0% |
Sharpsburg Summary
Sharpburg, MD is a small town located in Washington County, Maryland. It is situated along the Antietam Creek, which is a tributary of the Potomac River. The town is best known for its role in the Battle of Antietam, which was the bloodiest single-day battle in American history. The town is also home to the National Cemetery, which is the final resting place for many of the soldiers who fought in the battle.
History
Sharpburg was founded in 1763 by German settlers. The town was originally known as Sharpsburg, but the name was changed to Sharpburg in 1832. The town was an important stop on the National Road, which was the first federally funded highway in the United States. The town was also an important stop on the Baltimore and Ohio Railroad.
The town was the site of the Battle of Antietam, which took place on September 17, 1862. The battle was fought between the Union and Confederate forces and resulted in a Union victory. The battle was the bloodiest single-day battle in American history, with over 23,000 casualties.
Geography
Sharpburg is located in Washington County, Maryland. The town is situated along the Antietam Creek, which is a tributary of the Potomac River. The town is located in the Appalachian Mountains and is surrounded by rolling hills and farmland. The town is located approximately 40 miles from Washington, D.C. and Baltimore.
Economy
Sharpburg’s economy is largely based on agriculture and tourism. The town is home to several farms, which produce a variety of crops, including corn, soybeans, and wheat. The town is also home to several wineries, which produce a variety of wines.
The town is also a popular tourist destination. The town is home to the Antietam National Battlefield, which is a popular tourist attraction. The town is also home to several museums, including the Sharpsburg Historical Museum and the Antietam National Cemetery.
Demographics
As of the 2010 census, Sharpburg had a population of 1,232. The town has a median household income of $45,000 and a median age of 44. The town is predominantly white, with 92.3% of the population identifying as white. The town is also home to a small Hispanic population, with 4.2% of the population identifying as Hispanic or Latino.
Sharpburg is a small town with a rich history and a vibrant economy. The town is home to several farms, wineries, and tourist attractions, which make it a popular destination for visitors. The town is also home to the Antietam National Battlefield, which is a popular tourist attraction. The town has a diverse population and a median household income of $45,000.
Common Questions
What is Per Capita Income in Sharpsburg?
Per Capita income in Sharpsburg is $41,050.
What is the Median Family Income in Sharpsburg?
Median Family Income in Sharpsburg is $88,594.
What is the Median Household income in Sharpsburg?
Median Household Income in Sharpsburg is $69,722.
What is Income or Wage Gap in Sharpsburg?
Income or Wage Gap in Sharpsburg is 11.7%.
Women in Sharpsburg earn 88.3 cents for every dollar earned by a man.
What is Inequality or Gini Index in Sharpsburg?
Inequality or Gini Index in Sharpsburg is 0.37.
What is the Total Population of Sharpsburg?
Total Population of Sharpsburg is 722.
What is the Total Male Population of Sharpsburg?
Total Male Population of Sharpsburg is 412.
What is the Total Female Population of Sharpsburg?
Total Female Population of Sharpsburg is 310.
What is the Ratio of Males per 100 Females in Sharpsburg?
There are 132.90 Males per 100 Females in Sharpsburg.
What is the Ratio of Females per 100 Males in Sharpsburg?
There are 75.24 Females per 100 Males in Sharpsburg.
What is the Median Population Age in Sharpsburg?
Median Population Age in Sharpsburg is 47.3 Years.
What is the Average Family Size in Sharpsburg
Average Family Size in Sharpsburg is 2.8 People.
What is the Average Household Size in Sharpsburg
Average Household Size in Sharpsburg is 2.1 People.
How Large is the Labor Force in Sharpsburg?
There are 417 People in the Labor Forcein in Sharpsburg.
What is the Percentage of People in the Labor Force in Sharpsburg?
66.6% of People are in the Labor Force in Sharpsburg.
What is the Unemployment Rate in Sharpsburg?
Unemployment Rate in Sharpsburg is 0.7%.