Delmar, MD Map & Demographics
Delmar Map
Delmar Overview
$36,360
PER CAPITA INCOME
$78,348
AVG FAMILY INCOME
$69,028
AVG HOUSEHOLD INCOME
0.44
INEQUALITY / GINI INDEX
3,897
TOTAL POPULATION
1,820
MALE POPULATION
2,077
FEMALE POPULATION
87.63
MALES / 100 FEMALES
114.12
FEMALES / 100 MALES
32.1
MEDIAN AGE
3.0
AVG FAMILY SIZE
2.4
AVG HOUSEHOLD SIZE
2,276
LABOR FORCE [ PEOPLE ]
72.5%
PERCENT IN LABOR FORCE
8.7%
UNEMPLOYMENT RATE
Delmar Zip Codes
Income in Delmar
Income Overview in Delmar
Per Capita Income in Delmar is $36,360, while median incomes of families and households are $78,348 and $69,028 respectively.
| Characteristic | Number | Measure |
| Per Capita Income | 3,897 | $36,360 |
| Median Family Income | 1,047 | $78,348 |
| Mean Family Income | 1,047 | $85,986 |
| Median Household Income | 1,628 | $69,028 |
| Mean Household Income | 1,628 | $83,442 |
| Income Deficit | 1,047 | $0 |
| Wage / Income Gap (%) | 3,897 | 0.00% |
| Wage / Income Gap ($) | 3,897 | 100.00¢ per $1 |
| Gini / Inequality Index | 3,897 | 0.44 |
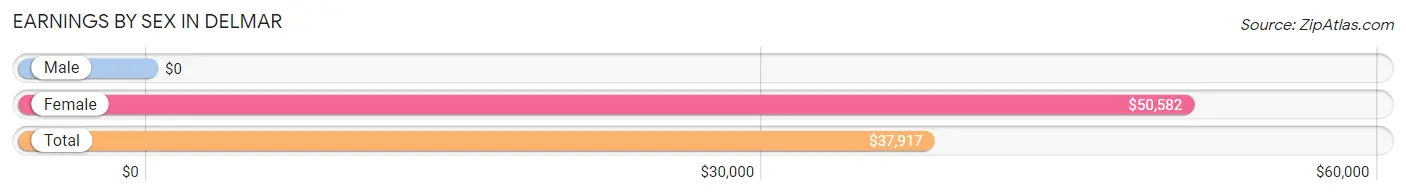
Earnings by Sex in Delmar
| Sex | Number | Average Earnings |
| Male | 1,018 (44.2%) | $0 |
| Female | 1,283 (55.8%) | $50,582 |
| Total | 2,301 (100.0%) | $37,917 |
Earnings by Sex by Income Bracket in Delmar
The most common earnings brackets in Delmar are $100,000+ for men (173 | 17.0%) and $10,000 to $12,499 for women (268 | 20.9%).
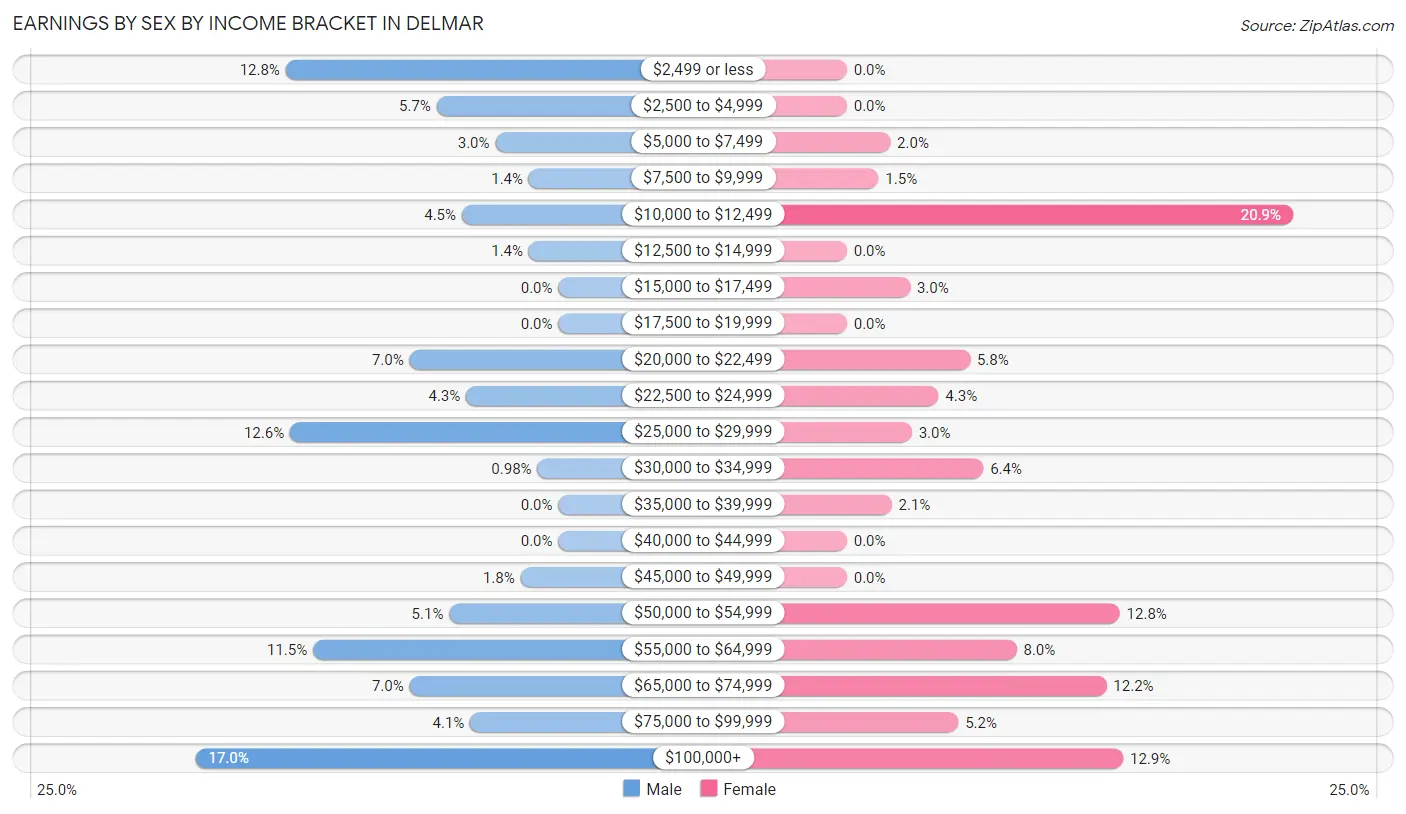
| Income | Male | Female |
| $2,499 or less | 130 (12.8%) | 0 (0.0%) |
| $2,500 to $4,999 | 58 (5.7%) | 0 (0.0%) |
| $5,000 to $7,499 | 30 (2.9%) | 26 (2.0%) |
| $7,500 to $9,999 | 14 (1.4%) | 19 (1.5%) |
| $10,000 to $12,499 | 46 (4.5%) | 268 (20.9%) |
| $12,500 to $14,999 | 14 (1.4%) | 0 (0.0%) |
| $15,000 to $17,499 | 0 (0.0%) | 38 (3.0%) |
| $17,500 to $19,999 | 0 (0.0%) | 0 (0.0%) |
| $20,000 to $22,499 | 71 (7.0%) | 74 (5.8%) |
| $22,500 to $24,999 | 44 (4.3%) | 55 (4.3%) |
| $25,000 to $29,999 | 128 (12.6%) | 39 (3.0%) |
| $30,000 to $34,999 | 10 (1.0%) | 82 (6.4%) |
| $35,000 to $39,999 | 0 (0.0%) | 27 (2.1%) |
| $40,000 to $44,999 | 0 (0.0%) | 0 (0.0%) |
| $45,000 to $49,999 | 18 (1.8%) | 0 (0.0%) |
| $50,000 to $54,999 | 52 (5.1%) | 164 (12.8%) |
| $55,000 to $64,999 | 117 (11.5%) | 102 (8.0%) |
| $65,000 to $74,999 | 71 (7.0%) | 156 (12.2%) |
| $75,000 to $99,999 | 42 (4.1%) | 67 (5.2%) |
| $100,000+ | 173 (17.0%) | 166 (12.9%) |
| Total | 1,018 (100.0%) | 1,283 (100.0%) |
Earnings by Sex by Educational Attainment in Delmar
Average earnings in Delmar are $56,667 for men and $53,502 for women, a difference of 5.6%. Men with an educational attainment of bachelor's degree enjoy the highest average annual earnings of $63,884, while those with college or associate's degree education earn the least with $21,563. Women with an educational attainment of bachelor's degree earn the most with the average annual earnings of $68,667, while those with college or associate's degree education have the smallest earnings of $50,862.
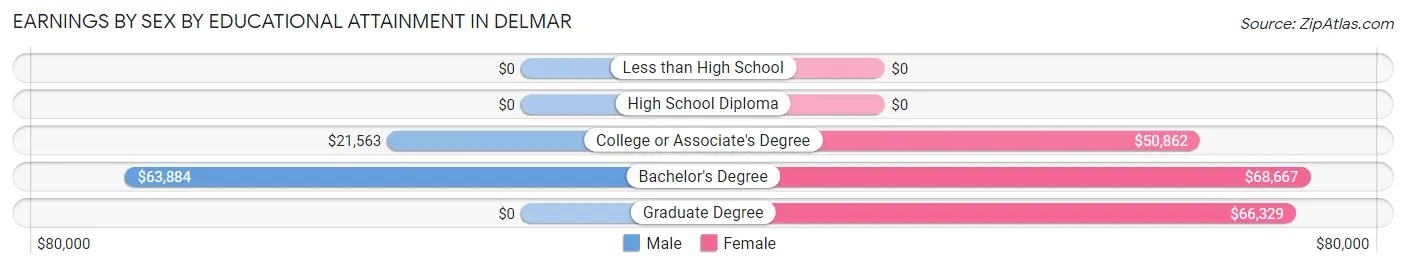
| Educational Attainment | Male Income | Female Income |
| Less than High School | - | - |
| High School Diploma | - | - |
| College or Associate's Degree | $21,563 | $50,862 |
| Bachelor's Degree | $63,884 | $68,667 |
| Graduate Degree | - | - |
| Total | $56,667 | $53,502 |
Family Income in Delmar
Family Income Brackets in Delmar
According to the Delmar family income data, there are 270 families falling into the $75,000 to $99,999 income range, which is the most common income bracket and makes up 25.8% of all families. Conversely, the less than $10,000 income bracket is the least frequent group with only 14 families (1.3%) belonging to this category.
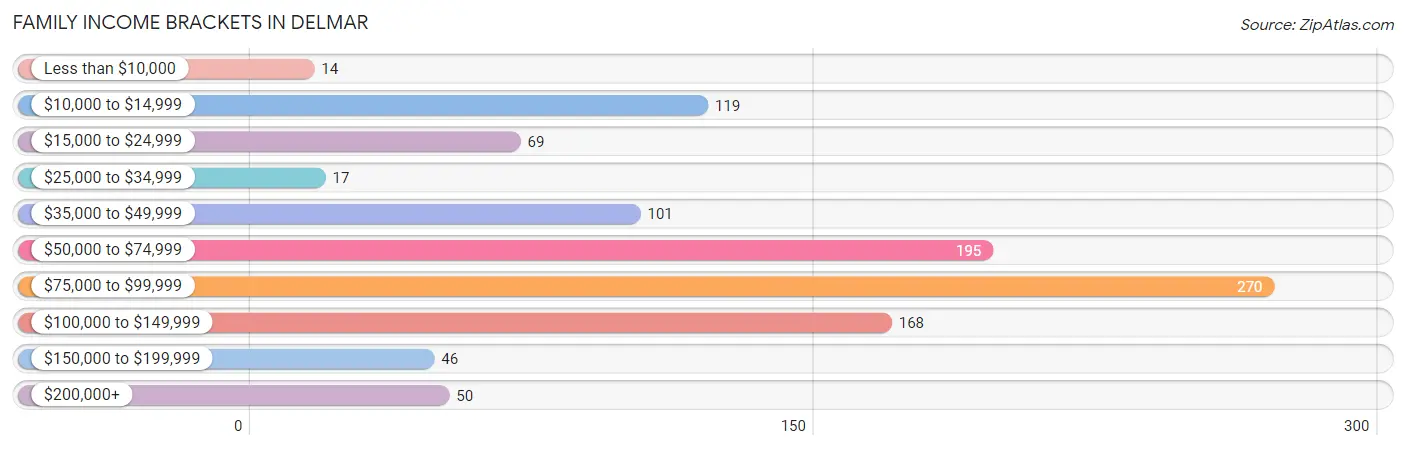
| Income Bracket | # Families | % Families |
| Less than $10,000 | 14 | 1.3% |
| $10,000 to $14,999 | 119 | 11.4% |
| $15,000 to $24,999 | 69 | 6.6% |
| $25,000 to $34,999 | 17 | 1.6% |
| $35,000 to $49,999 | 101 | 9.6% |
| $50,000 to $74,999 | 195 | 18.6% |
| $75,000 to $99,999 | 270 | 25.8% |
| $100,000 to $149,999 | 168 | 16.0% |
| $150,000 to $199,999 | 46 | 4.4% |
| $200,000+ | 50 | 4.8% |
Family Income by Famaliy Size in Delmar
4-person families (422 | 40.3%) account for the highest median family income in Delmar with $92,627 per family, while 2-person families (366 | 35.0%) have the highest median income of $39,107 per family member.
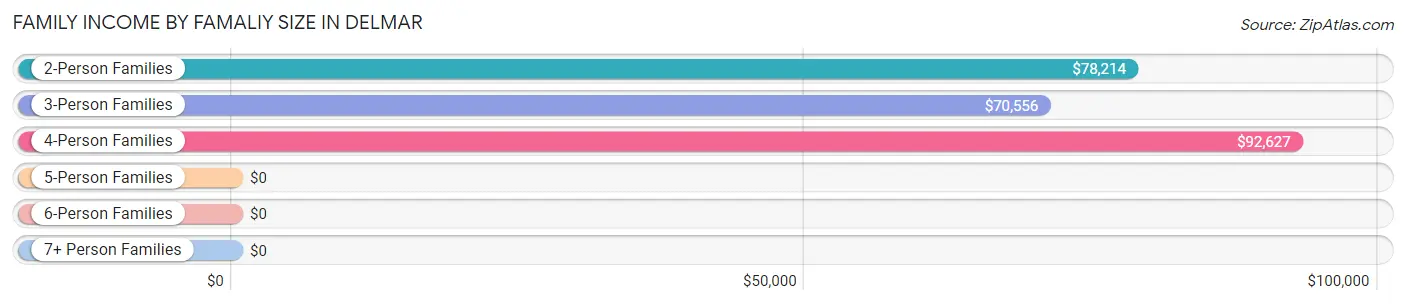
| Income Bracket | # Families | Median Income |
| 2-Person Families | 366 (35.0%) | $78,214 |
| 3-Person Families | 228 (21.8%) | $70,556 |
| 4-Person Families | 422 (40.3%) | $92,627 |
| 5-Person Families | 0 (0.0%) | $0 |
| 6-Person Families | 31 (3.0%) | $0 |
| 7+ Person Families | 0 (0.0%) | $0 |
| Total | 1,047 (100.0%) | $78,348 |
Family Income by Number of Earners in Delmar
The median family income in Delmar is $78,348, with families comprising 2 earners (396) having the highest median family income of $95,521, while families with no earners (57) have the lowest median family income of $32,279, accounting for 37.8% and 5.4% of families, respectively.
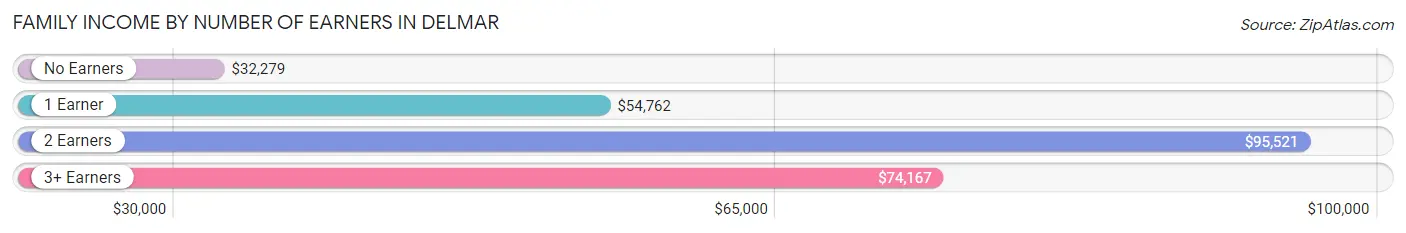
| Number of Earners | # Families | Median Income |
| No Earners | 57 (5.4%) | $32,279 |
| 1 Earner | 454 (43.4%) | $54,762 |
| 2 Earners | 396 (37.8%) | $95,521 |
| 3+ Earners | 140 (13.4%) | $74,167 |
| Total | 1,047 (100.0%) | $78,348 |
Household Income in Delmar
Household Income Brackets in Delmar
With 344 households falling in the category, the $50,000 to $74,999 income range is the most frequent in Delmar, accounting for 21.1% of all households. In contrast, only 46 households (2.8%) fall into the $150,000 to $199,999 income bracket, making it the least populous group.
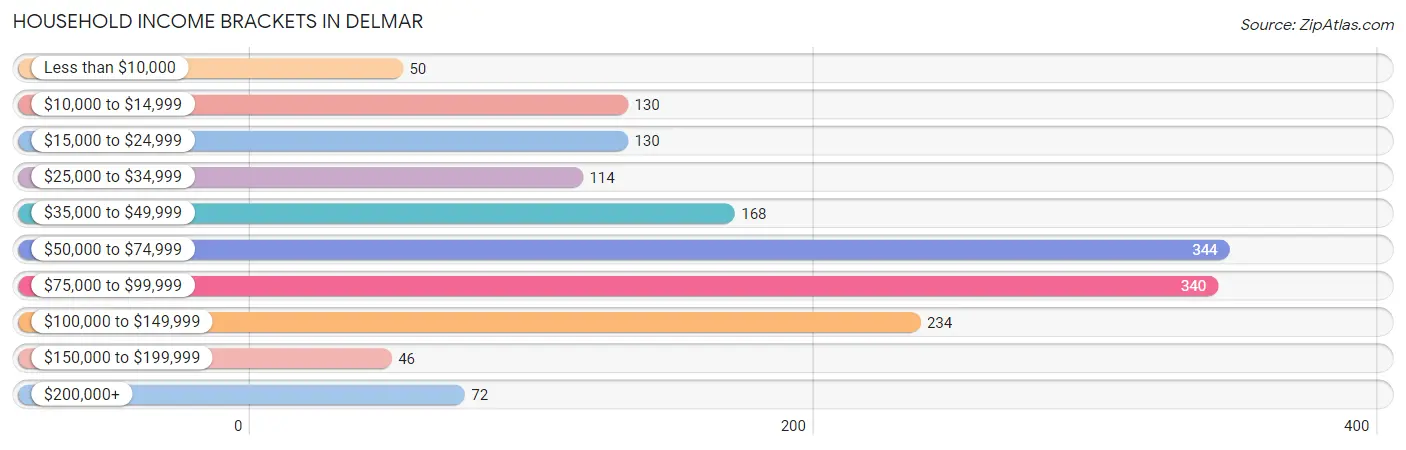
| Income Bracket | # Households | % Households |
| Less than $10,000 | 50 | 3.1% |
| $10,000 to $14,999 | 130 | 8.0% |
| $15,000 to $24,999 | 130 | 8.0% |
| $25,000 to $34,999 | 114 | 7.0% |
| $35,000 to $49,999 | 168 | 10.3% |
| $50,000 to $74,999 | 344 | 21.1% |
| $75,000 to $99,999 | 340 | 20.9% |
| $100,000 to $149,999 | 234 | 14.4% |
| $150,000 to $199,999 | 46 | 2.8% |
| $200,000+ | 72 | 4.4% |
Household Income by Householder Age in Delmar
The median household income in Delmar is $69,028, with the highest median household income of $74,714 found in the 45 to 64 years age bracket for the primary householder. A total of 747 households (45.9%) fall into this category. Meanwhile, the 15 to 24 years age bracket for the primary householder has the lowest median household income of $0, with 151 households (9.3%) in this group.
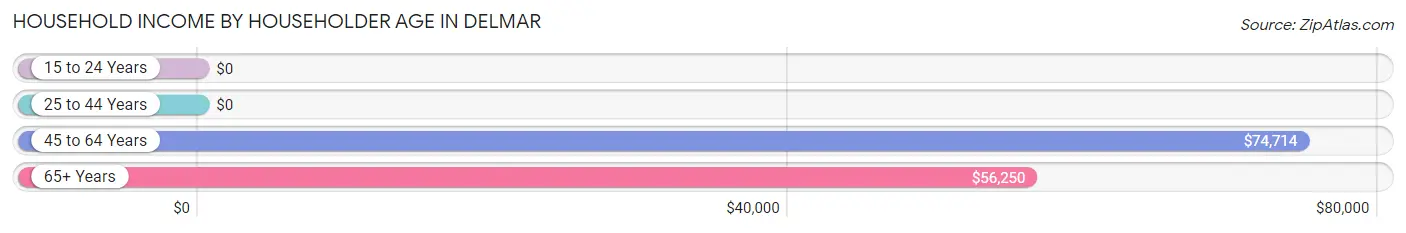
| Income Bracket | # Households | Median Income |
| 15 to 24 Years | 151 (9.3%) | $0 |
| 25 to 44 Years | 517 (31.8%) | $0 |
| 45 to 64 Years | 747 (45.9%) | $74,714 |
| 65+ Years | 213 (13.1%) | $56,250 |
| Total | 1,628 (100.0%) | $69,028 |
Poverty in Delmar
Income Below Poverty by Sex and Age in Delmar
With 22.8% poverty level for males and 13.6% for females among the residents of Delmar, 6 to 11 year old males and 25 to 34 year old females are the most vulnerable to poverty, with 229 males (83.3%) and 131 females (38.8%) in their respective age groups living below the poverty level.
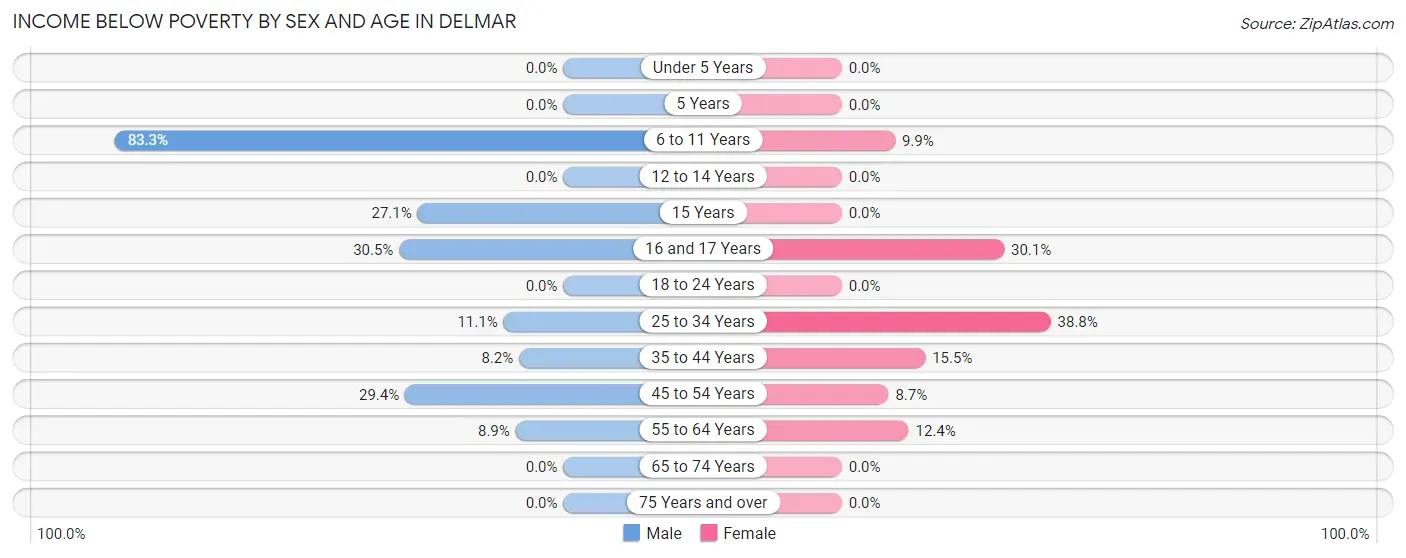
| Age Bracket | Male | Female |
| Under 5 Years | 0 (0.0%) | 0 (0.0%) |
| 5 Years | 0 (0.0%) | 0 (0.0%) |
| 6 to 11 Years | 229 (83.3%) | 15 (9.9%) |
| 12 to 14 Years | 0 (0.0%) | 0 (0.0%) |
| 15 Years | 23 (27.1%) | 0 (0.0%) |
| 16 and 17 Years | 39 (30.5%) | 28 (30.1%) |
| 18 to 24 Years | 0 (0.0%) | 0 (0.0%) |
| 25 to 34 Years | 21 (11.1%) | 131 (38.8%) |
| 35 to 44 Years | 16 (8.2%) | 33 (15.5%) |
| 45 to 54 Years | 72 (29.4%) | 28 (8.7%) |
| 55 to 64 Years | 14 (8.9%) | 48 (12.4%) |
| 65 to 74 Years | 0 (0.0%) | 0 (0.0%) |
| 75 Years and over | 0 (0.0%) | 0 (0.0%) |
| Total | 414 (22.8%) | 283 (13.6%) |
Income Above Poverty by Sex and Age in Delmar
According to the poverty statistics in Delmar, males aged under 5 years and females aged under 5 years are the age groups that are most secure financially, with 100.0% of males and 100.0% of females in these age groups living above the poverty line.
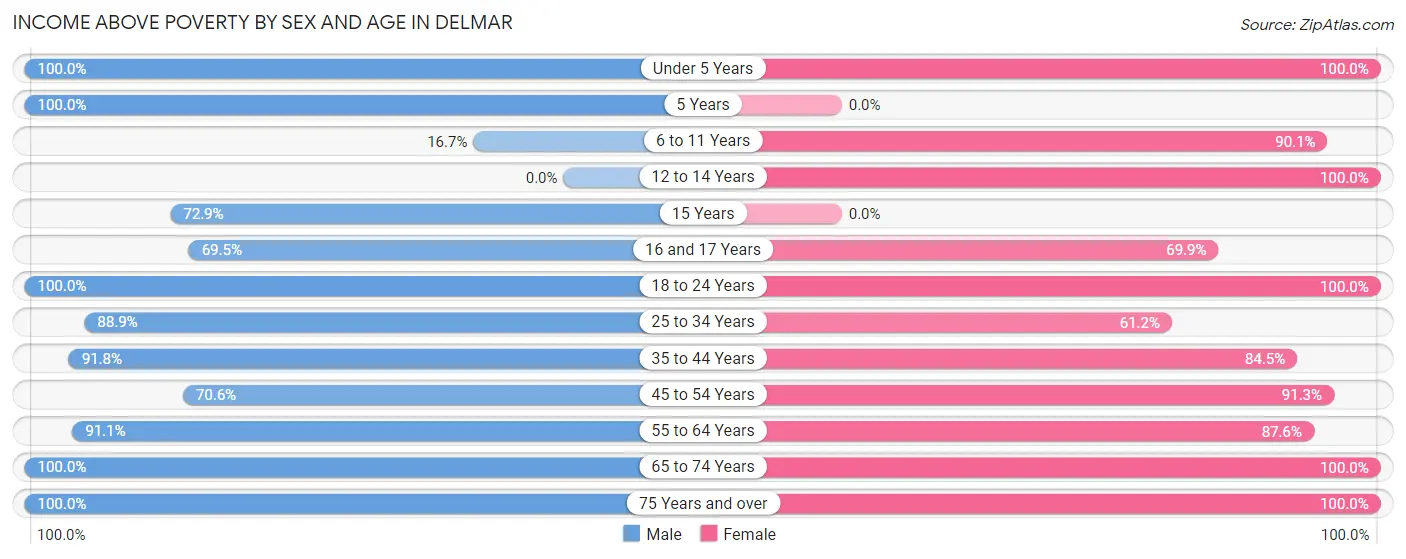
| Age Bracket | Male | Female |
| Under 5 Years | 95 (100.0%) | 94 (100.0%) |
| 5 Years | 35 (100.0%) | 0 (0.0%) |
| 6 to 11 Years | 46 (16.7%) | 137 (90.1%) |
| 12 to 14 Years | 0 (0.0%) | 21 (100.0%) |
| 15 Years | 62 (72.9%) | 0 (0.0%) |
| 16 and 17 Years | 89 (69.5%) | 65 (69.9%) |
| 18 to 24 Years | 257 (100.0%) | 250 (100.0%) |
| 25 to 34 Years | 168 (88.9%) | 207 (61.2%) |
| 35 to 44 Years | 179 (91.8%) | 180 (84.5%) |
| 45 to 54 Years | 173 (70.6%) | 295 (91.3%) |
| 55 to 64 Years | 144 (91.1%) | 339 (87.6%) |
| 65 to 74 Years | 131 (100.0%) | 106 (100.0%) |
| 75 Years and over | 27 (100.0%) | 100 (100.0%) |
| Total | 1,406 (77.2%) | 1,794 (86.4%) |
Income Below Poverty Among Married-Couple Families in Delmar
The poverty statistics for married-couple families in Delmar show that 5.8% or 37 of the total 637 families live below the poverty line. Families with 1 or 2 children have the highest poverty rate of 8.8%, comprising of 23 families. On the other hand, families with no children have the lowest poverty rate of 3.7%, which includes 14 families.
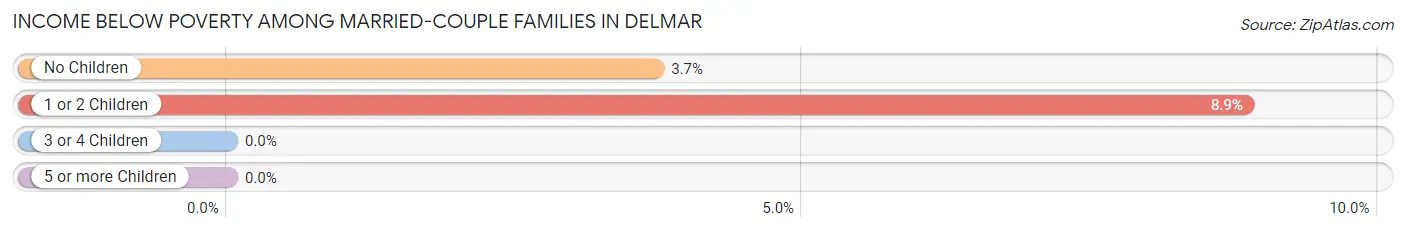
| Children | Above Poverty | Below Poverty |
| No Children | 363 (96.3%) | 14 (3.7%) |
| 1 or 2 Children | 237 (91.1%) | 23 (8.8%) |
| 3 or 4 Children | 0 (0.0%) | 0 (0.0%) |
| 5 or more Children | 0 (0.0%) | 0 (0.0%) |
| Total | 600 (94.2%) | 37 (5.8%) |
Income Below Poverty Among Single-Parent Households in Delmar

| Children | Single Father | Single Mother |
| No Children | 0 (0.0%) | 0 (0.0%) |
| 1 or 2 Children | 0 (0.0%) | 33 (16.8%) |
| 3 or 4 Children | 0 (0.0%) | 119 (100.0%) |
| 5 or more Children | 0 (0.0%) | 0 (0.0%) |
| Total | 0 (0.0%) | 152 (38.3%) |
Income Below Poverty Among Married-Couple vs Single-Parent Households in Delmar
The poverty data for Delmar shows that 37 of the married-couple family households (5.8%) and 152 of the single-parent households (37.1%) are living below the poverty level. Within the married-couple family households, those with 1 or 2 children have the highest poverty rate, with 23 households (8.8%) falling below the poverty line. Among the single-parent households, those with 3 or 4 children have the highest poverty rate, with 119 household (100.0%) living below poverty.
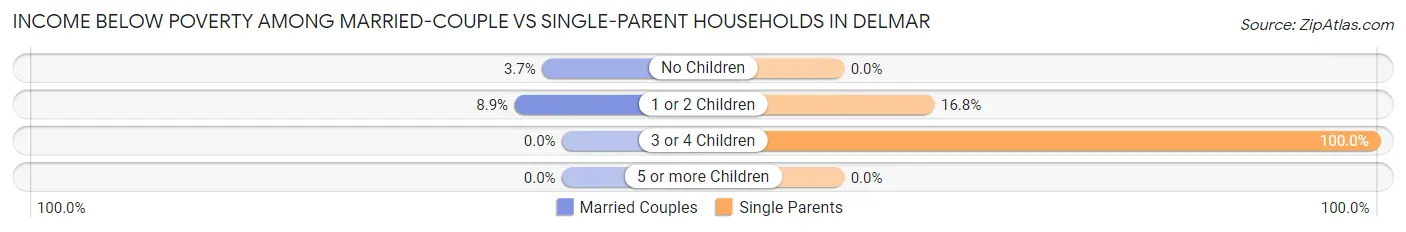
| Children | Married-Couple Families | Single-Parent Households |
| No Children | 14 (3.7%) | 0 (0.0%) |
| 1 or 2 Children | 23 (8.8%) | 33 (16.8%) |
| 3 or 4 Children | 0 (0.0%) | 119 (100.0%) |
| 5 or more Children | 0 (0.0%) | 0 (0.0%) |
| Total | 37 (5.8%) | 152 (37.1%) |
Race in Delmar
The most populous races in Delmar are White / Caucasian (2,233 | 57.3%), Black / African American (647 | 16.6%), and Two or more Races (551 | 14.1%).
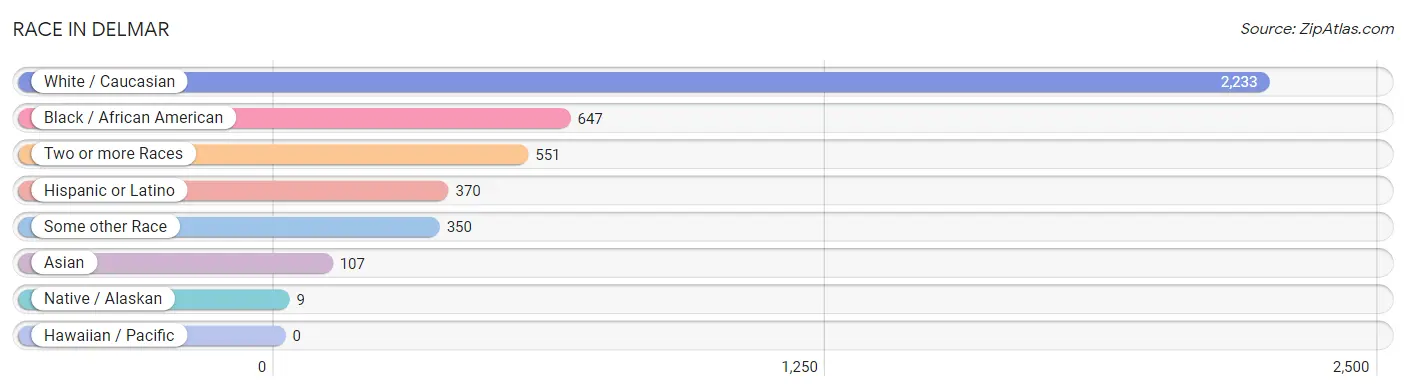
| Race | # Population | % Population |
| Asian | 107 | 2.8% |
| Black / African American | 647 | 16.6% |
| Hawaiian / Pacific | 0 | 0.0% |
| Hispanic or Latino | 370 | 9.5% |
| Native / Alaskan | 9 | 0.2% |
| White / Caucasian | 2,233 | 57.3% |
| Two or more Races | 551 | 14.1% |
| Some other Race | 350 | 9.0% |
| Total | 3,897 | 100.0% |
Ancestry in Delmar
The most populous ancestries reported in Delmar are English (616 | 15.8%), Irish (364 | 9.3%), Native Hawaiian (348 | 8.9%), Mexican (319 | 8.2%), and Italian (287 | 7.4%), together accounting for 49.6% of all Delmar residents.
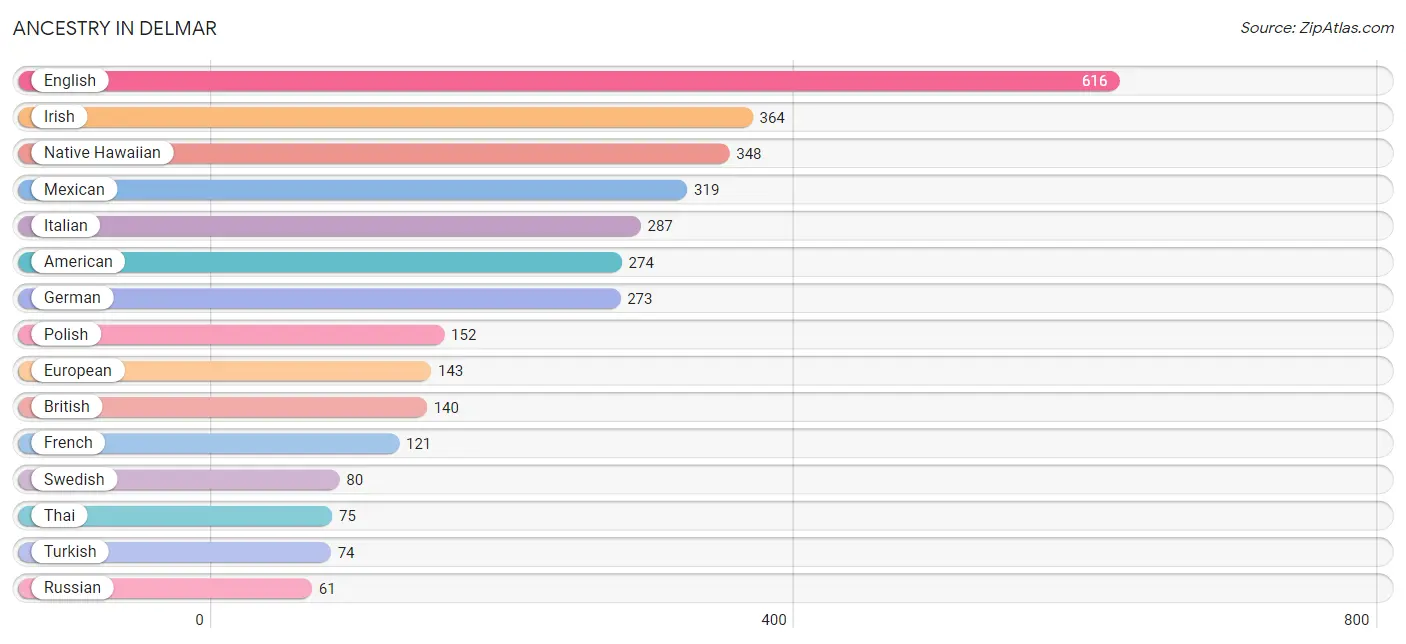
| Ancestry | # Population | % Population |
| American | 274 | 7.0% |
| British | 140 | 3.6% |
| Cherokee | 9 | 0.2% |
| Danish | 6 | 0.2% |
| Dominican | 51 | 1.3% |
| Dutch | 11 | 0.3% |
| Eastern European | 29 | 0.7% |
| English | 616 | 15.8% |
| European | 143 | 3.7% |
| Finnish | 9 | 0.2% |
| French | 121 | 3.1% |
| German | 273 | 7.0% |
| Irish | 364 | 9.3% |
| Italian | 287 | 7.4% |
| Mexican | 319 | 8.2% |
| Native Hawaiian | 348 | 8.9% |
| Polish | 152 | 3.9% |
| Russian | 61 | 1.6% |
| Scandinavian | 21 | 0.5% |
| Scotch-Irish | 13 | 0.3% |
| Sri Lankan | 32 | 0.8% |
| Swedish | 80 | 2.1% |
| Thai | 75 | 1.9% |
| Turkish | 74 | 1.9% | View All 24 Rows |
Immigrants in Delmar
The most numerous immigrant groups reported in Delmar came from Latin America (155 | 4.0%), Central America (104 | 2.7%), Mexico (104 | 2.7%), Asia (85 | 2.2%), and Caribbean (51 | 1.3%), together accounting for 12.8% of all Delmar residents.
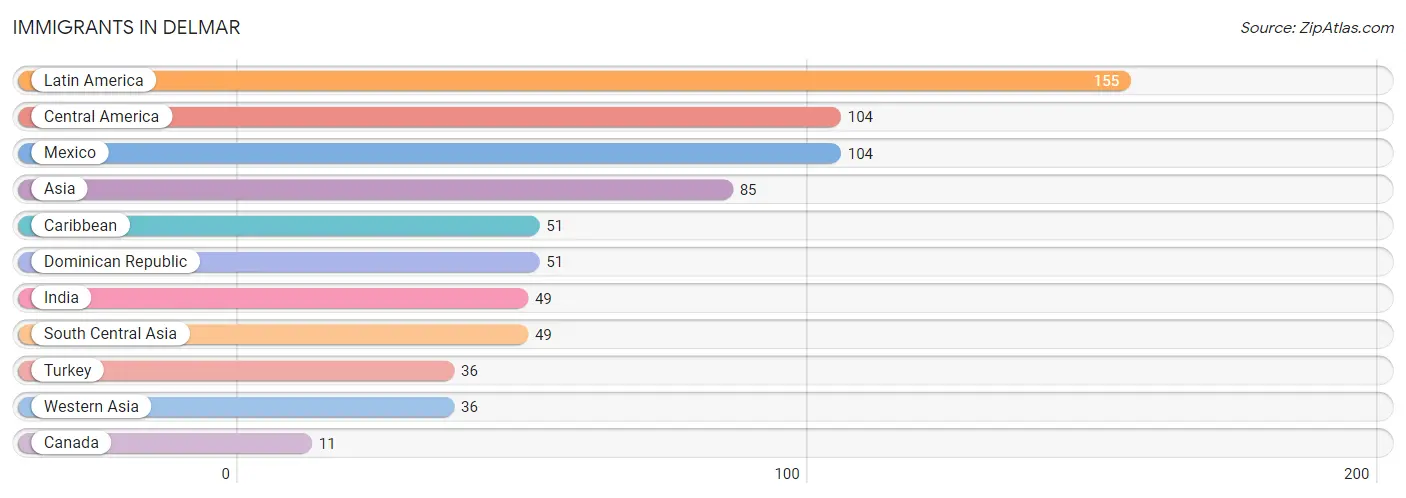
| Immigration Origin | # Population | % Population |
| Asia | 85 | 2.2% |
| Canada | 11 | 0.3% |
| Caribbean | 51 | 1.3% |
| Central America | 104 | 2.7% |
| Dominican Republic | 51 | 1.3% |
| India | 49 | 1.3% |
| Latin America | 155 | 4.0% |
| Mexico | 104 | 2.7% |
| South Central Asia | 49 | 1.3% |
| Turkey | 36 | 0.9% |
| Western Asia | 36 | 0.9% | View All 11 Rows |
Sex and Age in Delmar
Sex and Age in Delmar
The most populous age groups in Delmar are 15 to 19 Years (267 | 14.7%) for men and 20 to 24 Years (250 | 12.0%) for women.
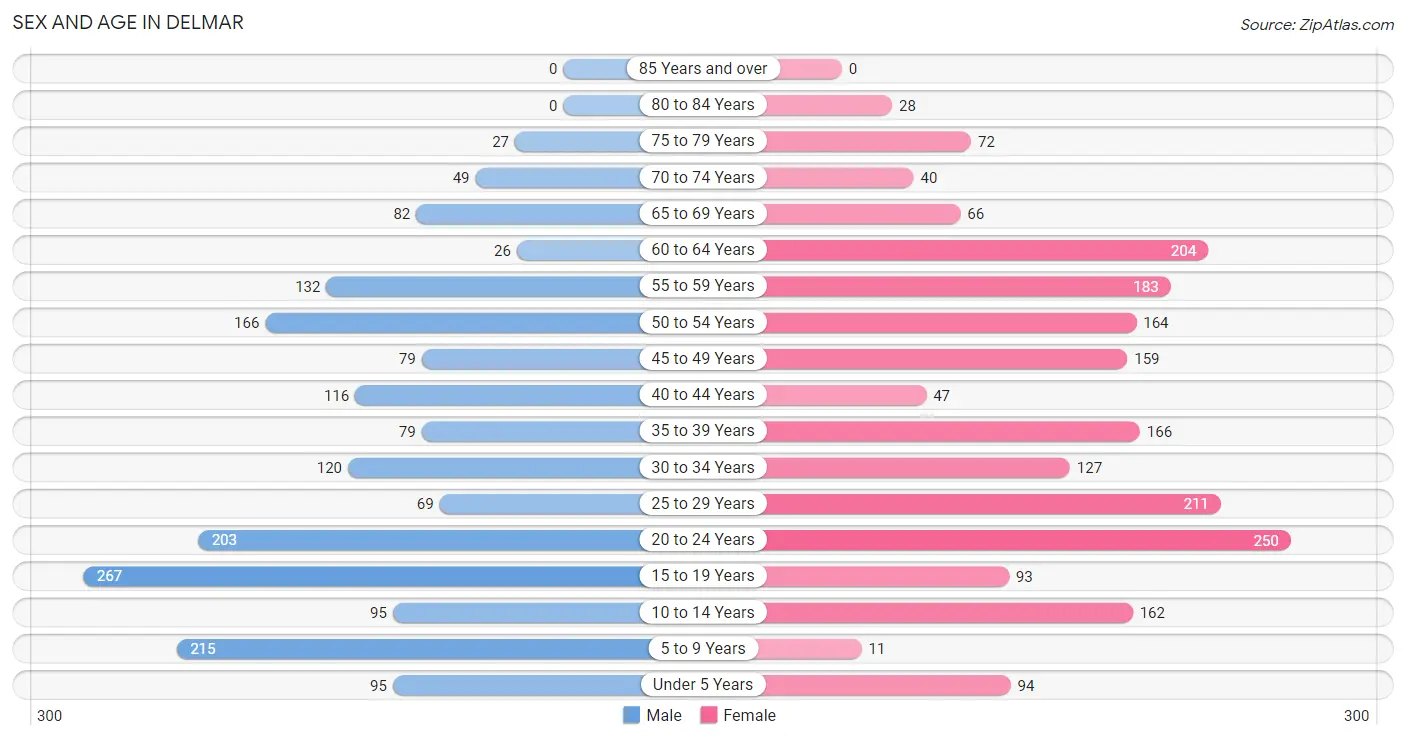
| Age Bracket | Male | Female |
| Under 5 Years | 95 (5.2%) | 94 (4.5%) |
| 5 to 9 Years | 215 (11.8%) | 11 (0.5%) |
| 10 to 14 Years | 95 (5.2%) | 162 (7.8%) |
| 15 to 19 Years | 267 (14.7%) | 93 (4.5%) |
| 20 to 24 Years | 203 (11.2%) | 250 (12.0%) |
| 25 to 29 Years | 69 (3.8%) | 211 (10.2%) |
| 30 to 34 Years | 120 (6.6%) | 127 (6.1%) |
| 35 to 39 Years | 79 (4.3%) | 166 (8.0%) |
| 40 to 44 Years | 116 (6.4%) | 47 (2.3%) |
| 45 to 49 Years | 79 (4.3%) | 159 (7.7%) |
| 50 to 54 Years | 166 (9.1%) | 164 (7.9%) |
| 55 to 59 Years | 132 (7.2%) | 183 (8.8%) |
| 60 to 64 Years | 26 (1.4%) | 204 (9.8%) |
| 65 to 69 Years | 82 (4.5%) | 66 (3.2%) |
| 70 to 74 Years | 49 (2.7%) | 40 (1.9%) |
| 75 to 79 Years | 27 (1.5%) | 72 (3.5%) |
| 80 to 84 Years | 0 (0.0%) | 28 (1.3%) |
| 85 Years and over | 0 (0.0%) | 0 (0.0%) |
| Total | 1,820 (100.0%) | 2,077 (100.0%) |
Families and Households in Delmar
Median Family Size in Delmar
The median family size in Delmar is 3.00 persons per family, with single female/mother families (397 | 37.9%) accounting for the largest median family size of 3.18 persons per family. On the other hand, single male/father families (13 | 1.2%) represent the smallest median family size with 1.77 persons per family.
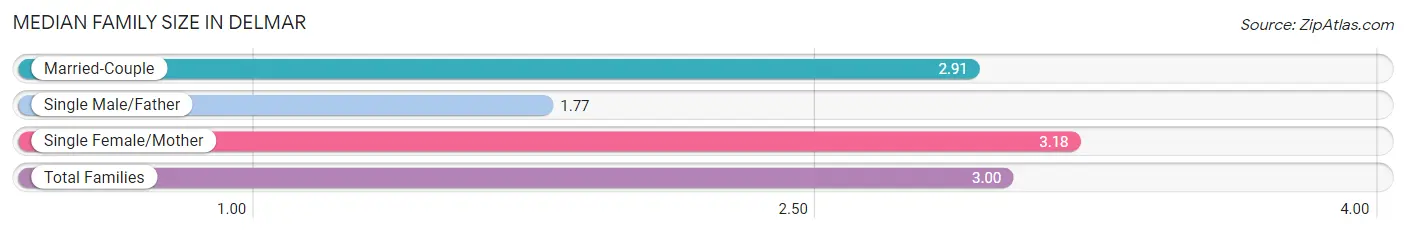
| Family Type | # Families | Family Size |
| Married-Couple | 637 (60.8%) | 2.91 |
| Single Male/Father | 13 (1.2%) | 1.77 |
| Single Female/Mother | 397 (37.9%) | 3.18 |
| Total Families | 1,047 (100.0%) | 3.00 |
Median Household Size in Delmar
The median household size in Delmar is 2.39 persons per household, with single female/mother households (397 | 24.4%) accounting for the largest median household size of 3.36 persons per household. non-family households (581 | 35.7%) represent the smallest median household size with 1.15 persons per household.
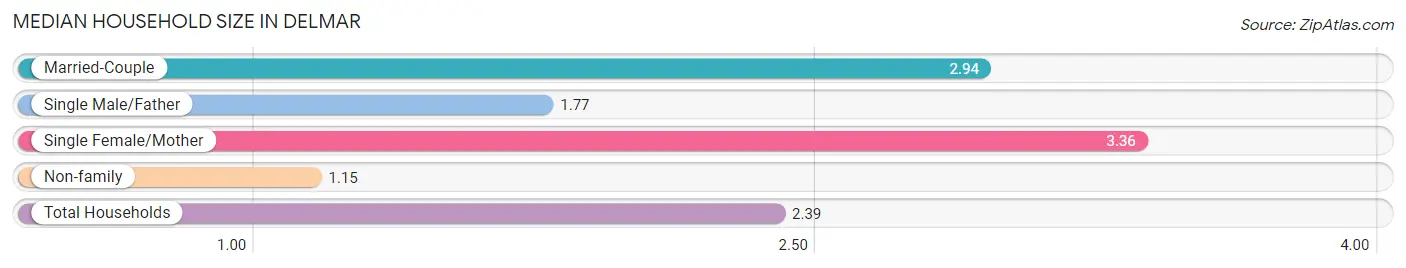
| Household Type | # Households | Household Size |
| Married-Couple | 637 (39.1%) | 2.94 |
| Single Male/Father | 13 (0.8%) | 1.77 |
| Single Female/Mother | 397 (24.4%) | 3.36 |
| Non-family | 581 (35.7%) | 1.15 |
| Total Households | 1,628 (100.0%) | 2.39 |
Household Size by Marriage Status in Delmar
Out of a total of 1,628 households in Delmar, 1,047 (64.3%) are family households, while 581 (35.7%) are nonfamily households. The most numerous type of family households are 4-person households, comprising 392, and the most common type of nonfamily households are 1-person households, comprising 518.
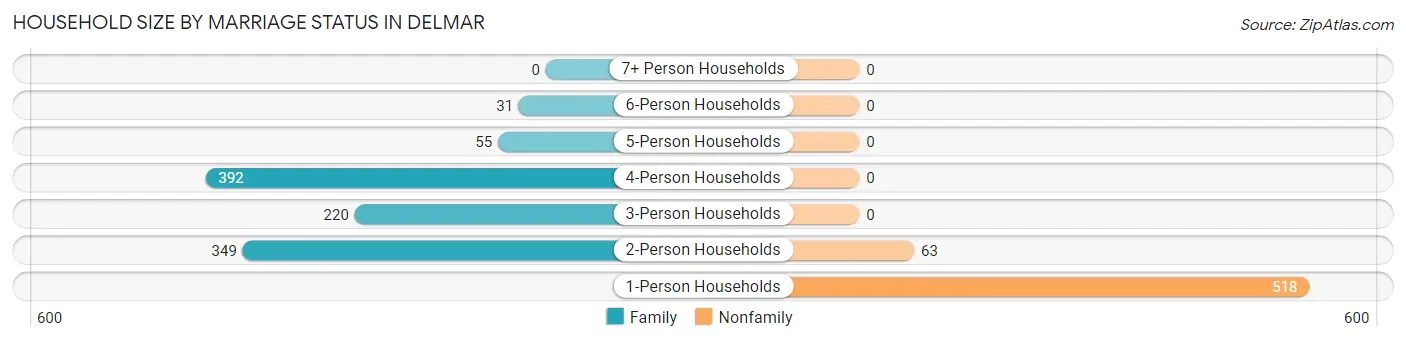
| Household Size | Family Households | Nonfamily Households |
| 1-Person Households | - | 518 (31.8%) |
| 2-Person Households | 349 (21.4%) | 63 (3.9%) |
| 3-Person Households | 220 (13.5%) | 0 (0.0%) |
| 4-Person Households | 392 (24.1%) | 0 (0.0%) |
| 5-Person Households | 55 (3.4%) | 0 (0.0%) |
| 6-Person Households | 31 (1.9%) | 0 (0.0%) |
| 7+ Person Households | 0 (0.0%) | 0 (0.0%) |
| Total | 1,047 (64.3%) | 581 (35.7%) |
Female Fertility in Delmar
Fertility by Age in Delmar
Average fertility rate in Delmar is 29.0 births per 1,000 women. Women in the age bracket of 35 to 50 years have the highest fertility rate with 75.0 births per 1,000 women. Women in the age bracket of 35 to 50 years acount for 100.0% of all women with births.
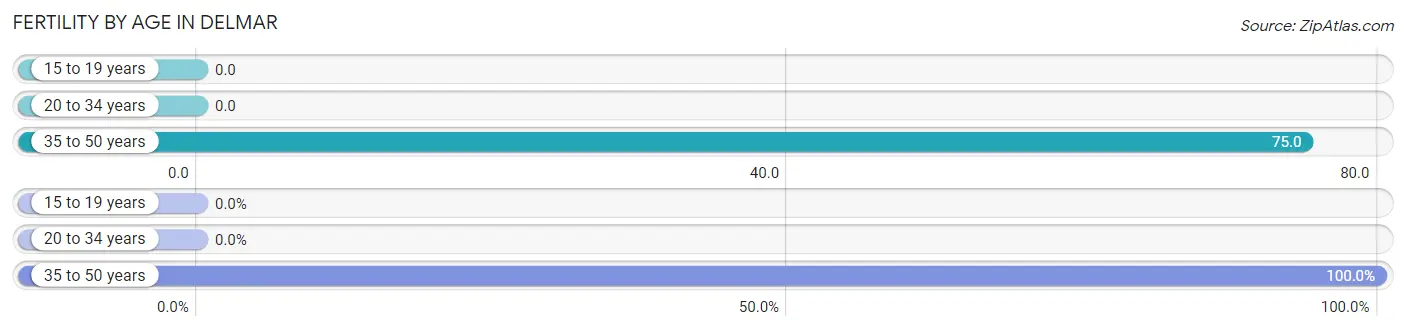
| Age Bracket | Women with Births | Births / 1,000 Women |
| 15 to 19 years | 0 (0.0%) | 0.0 |
| 20 to 34 years | 0 (0.0%) | 0.0 |
| 35 to 50 years | 32 (100.0%) | 75.0 |
| Total | 32 (100.0%) | 29.0 |
Fertility by Age by Marriage Status in Delmar
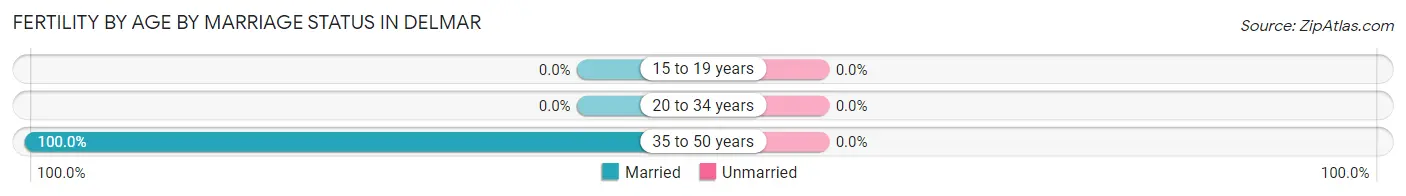
| Age Bracket | Married | Unmarried |
| 15 to 19 years | 0 (0.0%) | 0 (0.0%) |
| 20 to 34 years | 0 (0.0%) | 0 (0.0%) |
| 35 to 50 years | 32 (100.0%) | 0 (0.0%) |
| Total | 32 (100.0%) | 0 (0.0%) |
Fertility by Education in Delmar
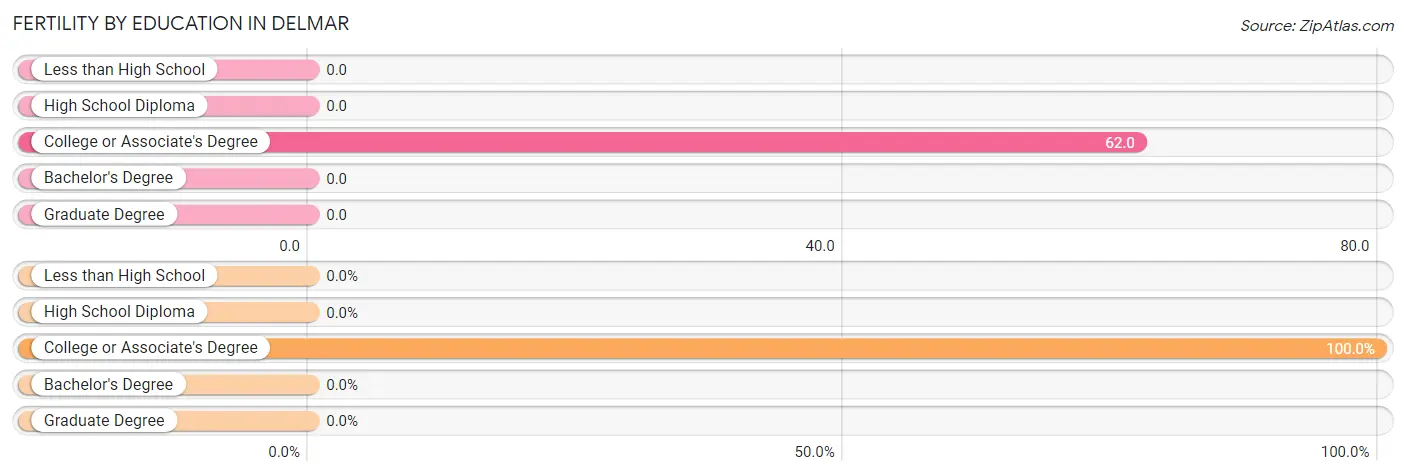
| Educational Attainment | Women with Births | Births / 1,000 Women |
| Less than High School | 0 (0.0%) | 0.0 |
| High School Diploma | 0 (0.0%) | 0.0 |
| College or Associate's Degree | 32 (100.0%) | 62.0 |
| Bachelor's Degree | 0 (0.0%) | 0.0 |
| Graduate Degree | 0 (0.0%) | 0.0 |
| Total | 32 (100.0%) | 29.0 |
Fertility by Education by Marriage Status in Delmar
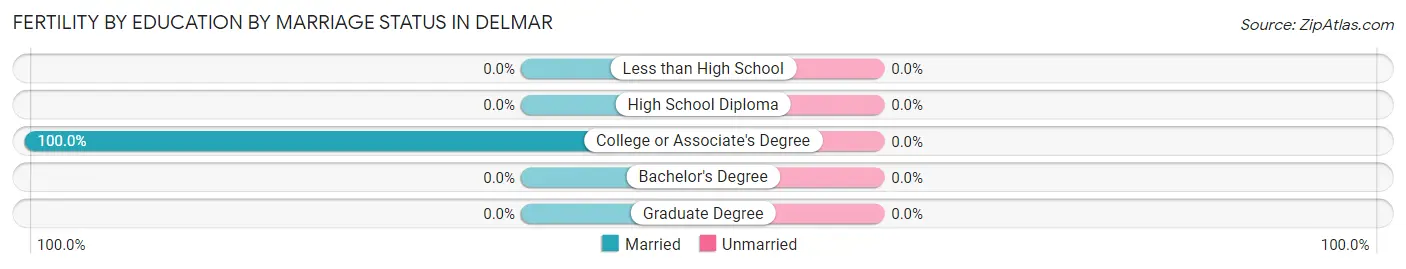
| Educational Attainment | Married | Unmarried |
| Less than High School | 0 (0.0%) | 0 (0.0%) |
| High School Diploma | 0 (0.0%) | 0 (0.0%) |
| College or Associate's Degree | 32 (100.0%) | 0 (0.0%) |
| Bachelor's Degree | 0 (0.0%) | 0 (0.0%) |
| Graduate Degree | 0 (0.0%) | 0 (0.0%) |
| Total | 32 (100.0%) | 0 (0.0%) |
Employment Characteristics in Delmar
Employment by Class of Employer in Delmar
Among the 2,068 employed individuals in Delmar, private company employees (1,343 | 64.9%), state government employees (242 | 11.7%), and not-for-profit organizations (188 | 9.1%) make up the most common classes of employment.
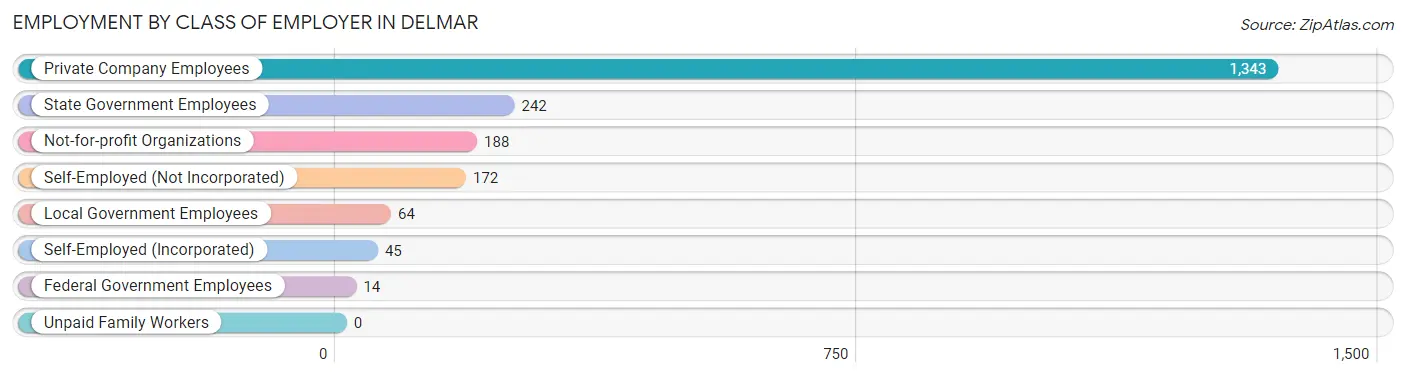
| Employer Class | # Employees | % Employees |
| Private Company Employees | 1,343 | 64.9% |
| Self-Employed (Incorporated) | 45 | 2.2% |
| Self-Employed (Not Incorporated) | 172 | 8.3% |
| Not-for-profit Organizations | 188 | 9.1% |
| Local Government Employees | 64 | 3.1% |
| State Government Employees | 242 | 11.7% |
| Federal Government Employees | 14 | 0.7% |
| Unpaid Family Workers | 0 | 0.0% |
| Total | 2,068 | 100.0% |
Employment Status by Age in Delmar
According to the labor force statistics for Delmar, out of the total population over 16 years of age (3,140), 72.5% or 2,276 individuals are in the labor force, with 8.7% or 198 of them unemployed. The age group with the highest labor force participation rate is 30 to 34 years, with 100.0% or 247 individuals in the labor force. Within the labor force, the 16 to 19 years age range has the highest percentage of unemployed individuals, with 43.5% or 30 of them being unemployed.
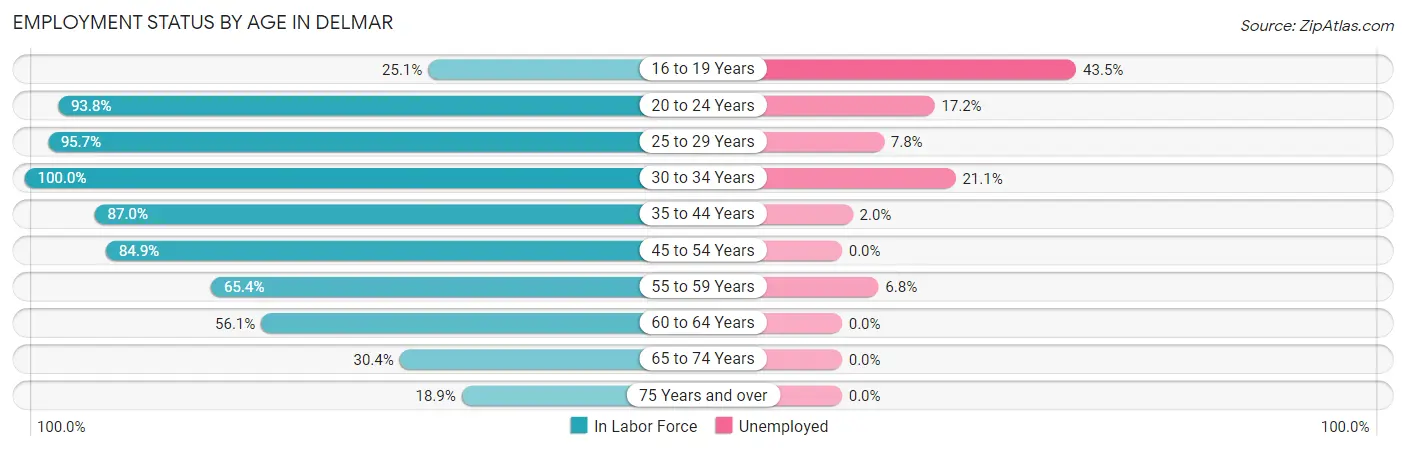
| Age Bracket | In Labor Force | Unemployed |
| 16 to 19 Years | 69 (25.1%) | 30 (43.5%) |
| 20 to 24 Years | 425 (93.8%) | 73 (17.2%) |
| 25 to 29 Years | 268 (95.7%) | 21 (7.8%) |
| 30 to 34 Years | 247 (100.0%) | 52 (21.1%) |
| 35 to 44 Years | 355 (87.0%) | 7 (2.0%) |
| 45 to 54 Years | 482 (84.9%) | 0 (0.0%) |
| 55 to 59 Years | 206 (65.4%) | 14 (6.8%) |
| 60 to 64 Years | 129 (56.1%) | 0 (0.0%) |
| 65 to 74 Years | 72 (30.4%) | 0 (0.0%) |
| 75 Years and over | 24 (18.9%) | 0 (0.0%) |
| Total | 2,276 (72.5%) | 198 (8.7%) |
Employment Status by Educational Attainment in Delmar
According to labor force statistics for Delmar, 82.4% of individuals (1,688) out of the total population between 25 and 64 years of age (2,048) are in the labor force, with 5.6% or 95 of them being unemployed. The group with the highest labor force participation rate are those with the educational attainment of bachelor's degree or higher, with 90.9% or 478 individuals in the labor force. Within the labor force, individuals with less than high school education have the highest percentage of unemployment, with 19.8% or 52 of them being unemployed.
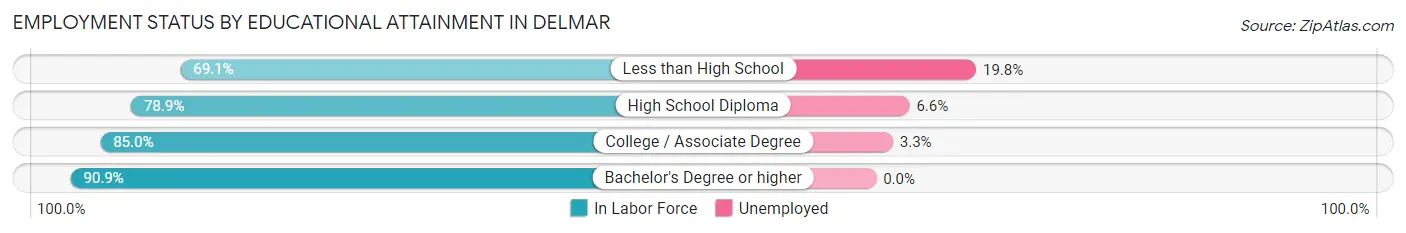
| Educational Attainment | In Labor Force | Unemployed |
| Less than High School | 262 (69.1%) | 75 (19.8%) |
| High School Diploma | 317 (78.9%) | 27 (6.6%) |
| College / Associate Degree | 630 (85.0%) | 24 (3.3%) |
| Bachelor's Degree or higher | 478 (90.9%) | 0 (0.0%) |
| Total | 1,688 (82.4%) | 115 (5.6%) |
Employment Occupations by Sex in Delmar
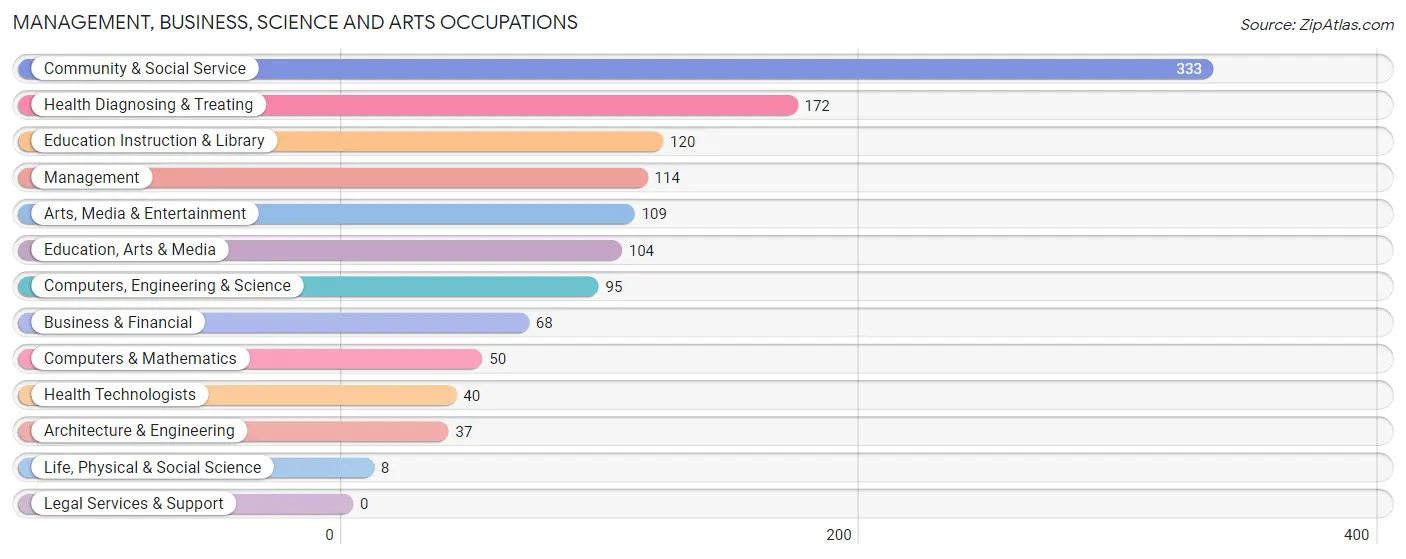
Management, Business, Science and Arts Occupations
The most common Management, Business, Science and Arts occupations in Delmar are Community & Social Service (333 | 16.0%), Health Diagnosing & Treating (172 | 8.3%), Education Instruction & Library (120 | 5.8%), Management (114 | 5.5%), and Arts, Media & Entertainment (109 | 5.2%).
Management, Business, Science and Arts Occupations by Sex
Within the Management, Business, Science and Arts occupations in Delmar, the most male-oriented occupations are Life, Physical & Social Science (100.0%), Education Instruction & Library (100.0%), and Arts, Media & Entertainment (82.6%), while the most female-oriented occupations are Business & Financial (100.0%), Health Technologists (100.0%), and Health Diagnosing & Treating (82.6%).
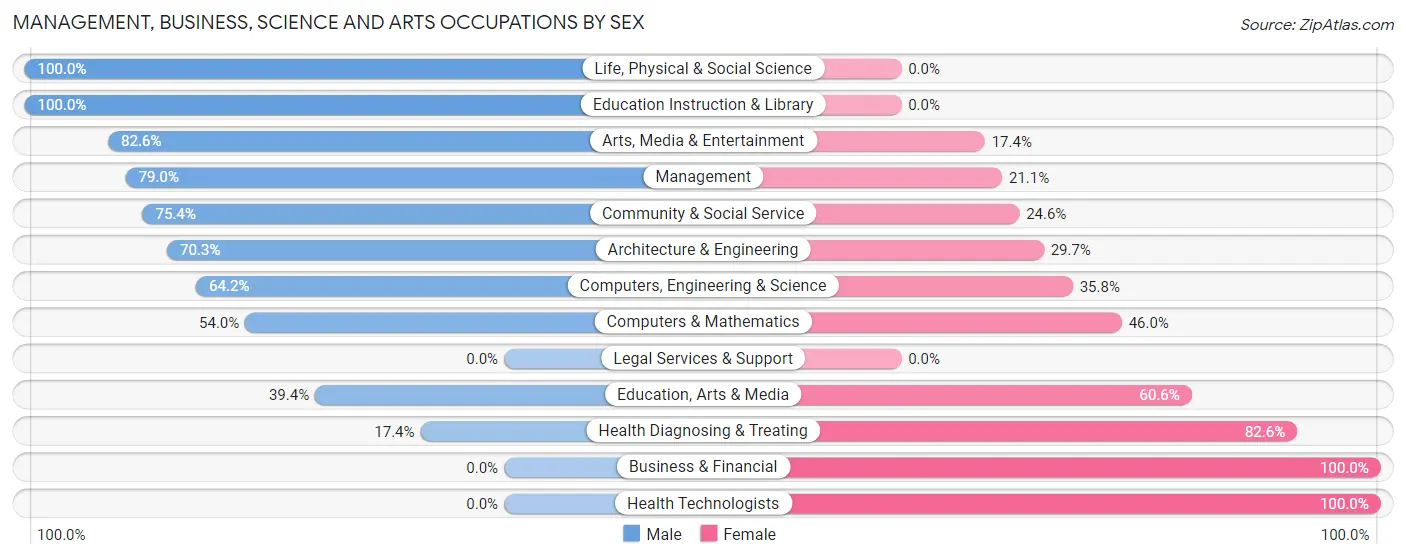
| Occupation | Male | Female |
| Management | 90 (78.9%) | 24 (21.0%) |
| Business & Financial | 0 (0.0%) | 68 (100.0%) |
| Computers, Engineering & Science | 61 (64.2%) | 34 (35.8%) |
| Computers & Mathematics | 27 (54.0%) | 23 (46.0%) |
| Architecture & Engineering | 26 (70.3%) | 11 (29.7%) |
| Life, Physical & Social Science | 8 (100.0%) | 0 (0.0%) |
| Community & Social Service | 251 (75.4%) | 82 (24.6%) |
| Education, Arts & Media | 41 (39.4%) | 63 (60.6%) |
| Legal Services & Support | 0 (0.0%) | 0 (0.0%) |
| Education Instruction & Library | 120 (100.0%) | 0 (0.0%) |
| Arts, Media & Entertainment | 90 (82.6%) | 19 (17.4%) |
| Health Diagnosing & Treating | 30 (17.4%) | 142 (82.6%) |
| Health Technologists | 0 (0.0%) | 40 (100.0%) |
| Total (Category) | 432 (55.2%) | 350 (44.8%) |
| Total (Overall) | 870 (41.8%) | 1,210 (58.2%) |
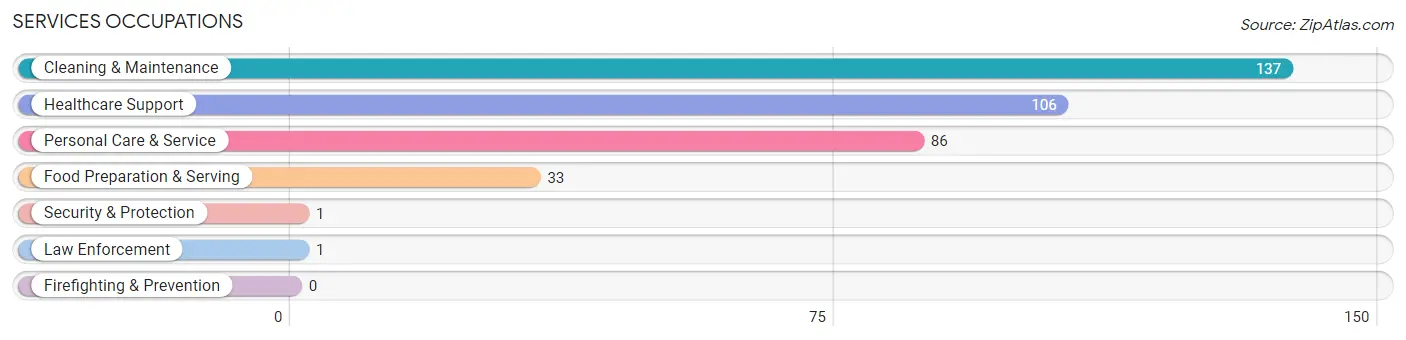
Services Occupations
The most common Services occupations in Delmar are Cleaning & Maintenance (137 | 6.6%), Healthcare Support (106 | 5.1%), Personal Care & Service (86 | 4.1%), Food Preparation & Serving (33 | 1.6%), and Security & Protection (1 | 0.1%).
Services Occupations by Sex
Within the Services occupations in Delmar, the most male-oriented occupations are Security & Protection (100.0%), Law Enforcement (100.0%), and Cleaning & Maintenance (94.9%), while the most female-oriented occupations are Healthcare Support (100.0%), Food Preparation & Serving (100.0%), and Personal Care & Service (100.0%).
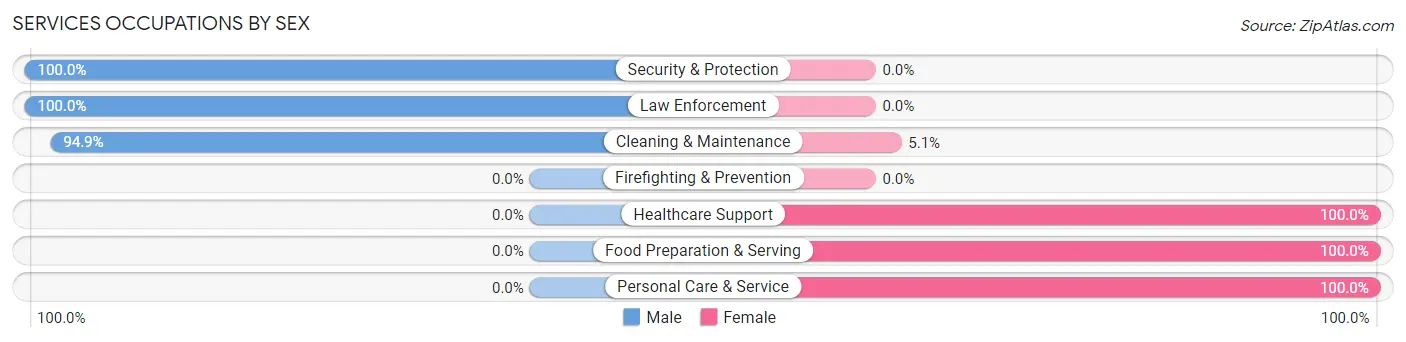
| Occupation | Male | Female |
| Healthcare Support | 0 (0.0%) | 106 (100.0%) |
| Security & Protection | 1 (100.0%) | 0 (0.0%) |
| Firefighting & Prevention | 0 (0.0%) | 0 (0.0%) |
| Law Enforcement | 1 (100.0%) | 0 (0.0%) |
| Food Preparation & Serving | 0 (0.0%) | 33 (100.0%) |
| Cleaning & Maintenance | 130 (94.9%) | 7 (5.1%) |
| Personal Care & Service | 0 (0.0%) | 86 (100.0%) |
| Total (Category) | 131 (36.1%) | 232 (63.9%) |
| Total (Overall) | 870 (41.8%) | 1,210 (58.2%) |
Sales and Office Occupations
The most common Sales and Office occupations in Delmar are Office & Administration (328 | 15.8%), and Sales & Related (248 | 11.9%).

Sales and Office Occupations by Sex

| Occupation | Male | Female |
| Sales & Related | 48 (19.4%) | 200 (80.6%) |
| Office & Administration | 39 (11.9%) | 289 (88.1%) |
| Total (Category) | 87 (15.1%) | 489 (84.9%) |
| Total (Overall) | 870 (41.8%) | 1,210 (58.2%) |
Natural Resources, Construction and Maintenance Occupations
The most common Natural Resources, Construction and Maintenance occupations in Delmar are Installation, Maintenance & Repair (52 | 2.5%), and Construction & Extraction (18 | 0.9%).
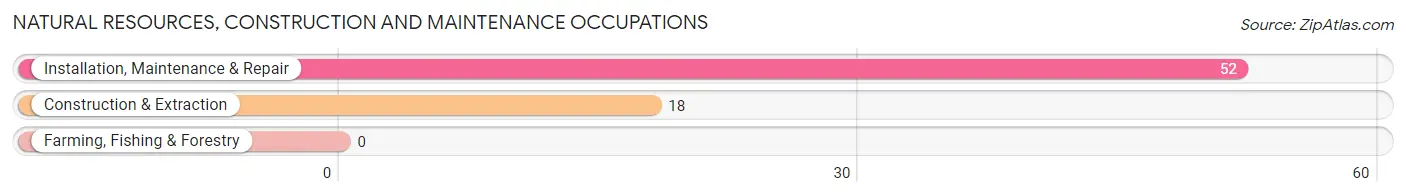
Natural Resources, Construction and Maintenance Occupations by Sex
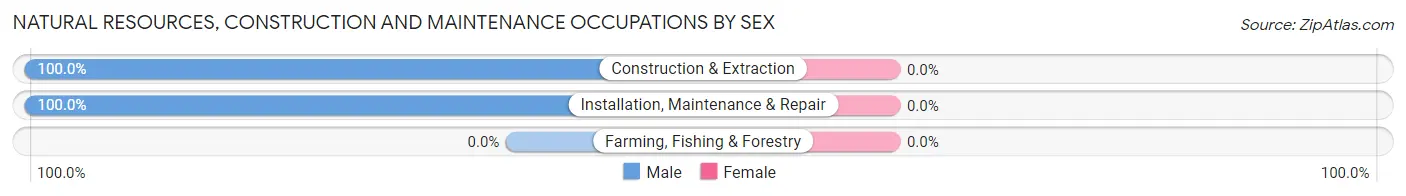
| Occupation | Male | Female |
| Farming, Fishing & Forestry | 0 (0.0%) | 0 (0.0%) |
| Construction & Extraction | 18 (100.0%) | 0 (0.0%) |
| Installation, Maintenance & Repair | 52 (100.0%) | 0 (0.0%) |
| Total (Category) | 70 (100.0%) | 0 (0.0%) |
| Total (Overall) | 870 (41.8%) | 1,210 (58.2%) |
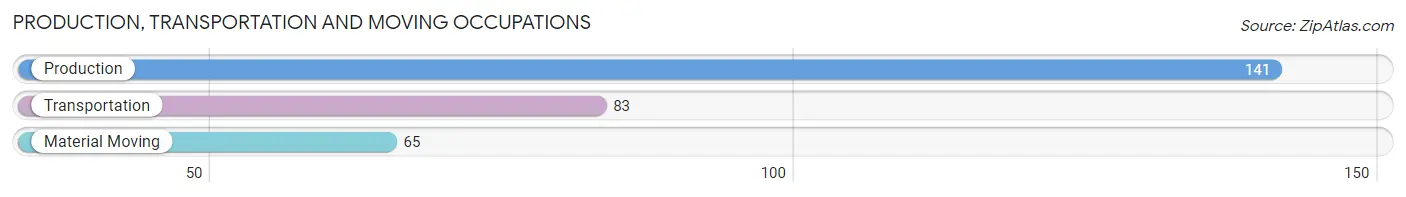
Production, Transportation and Moving Occupations
The most common Production, Transportation and Moving occupations in Delmar are Production (141 | 6.8%), Transportation (83 | 4.0%), and Material Moving (65 | 3.1%).
Production, Transportation and Moving Occupations by Sex
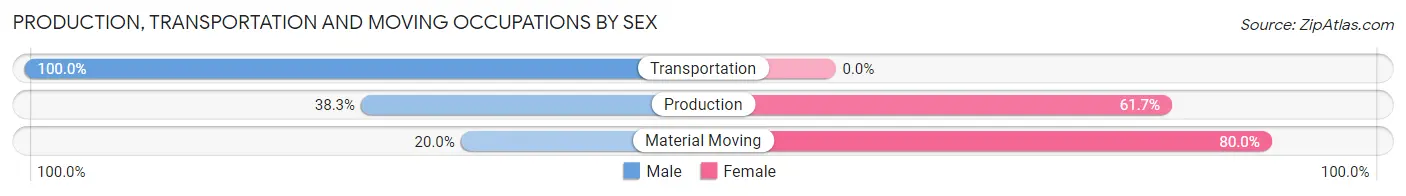
| Occupation | Male | Female |
| Production | 54 (38.3%) | 87 (61.7%) |
| Transportation | 83 (100.0%) | 0 (0.0%) |
| Material Moving | 13 (20.0%) | 52 (80.0%) |
| Total (Category) | 150 (51.9%) | 139 (48.1%) |
| Total (Overall) | 870 (41.8%) | 1,210 (58.2%) |
Employment Industries by Sex in Delmar
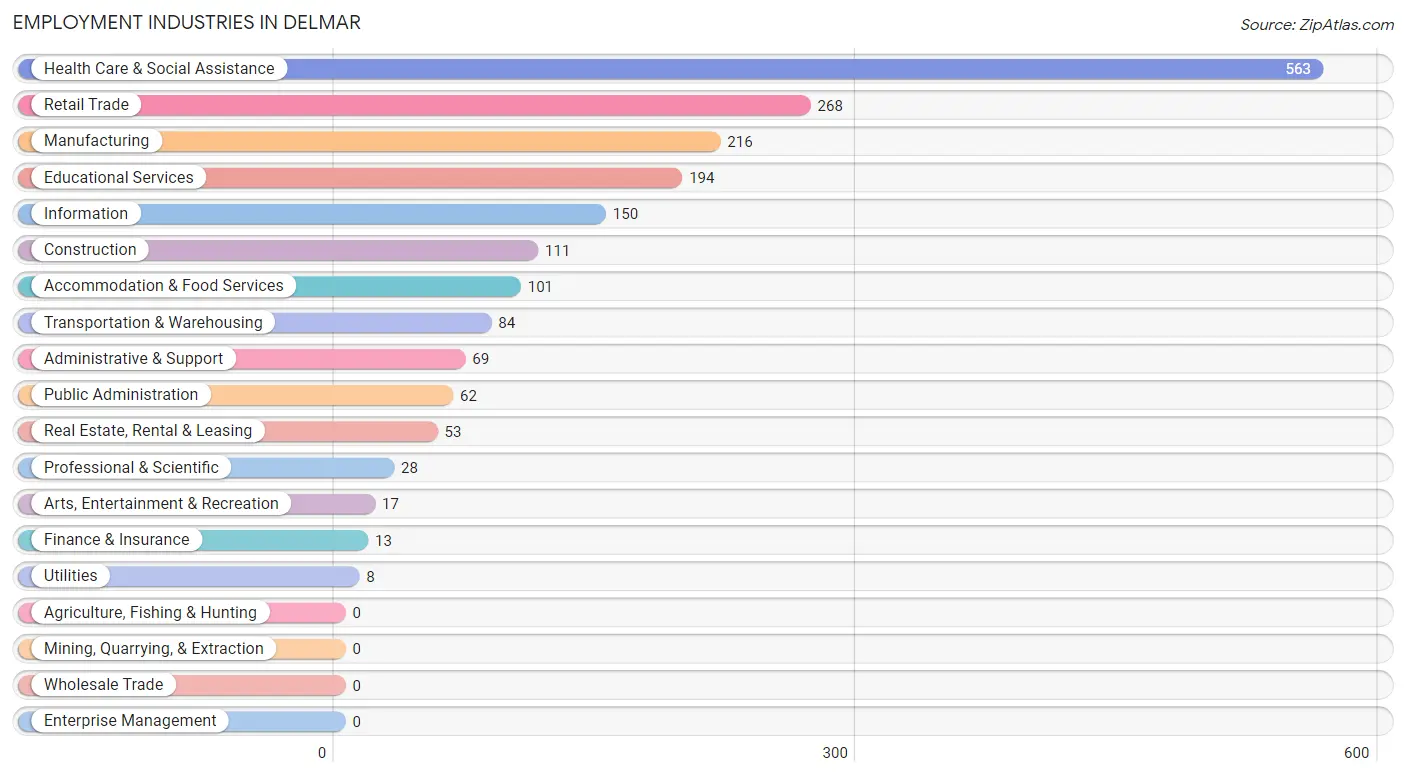
Employment Industries in Delmar
The major employment industries in Delmar include Health Care & Social Assistance (563 | 27.1%), Retail Trade (268 | 12.9%), Manufacturing (216 | 10.4%), Educational Services (194 | 9.3%), and Information (150 | 7.2%).
Employment Industries by Sex in Delmar
The Delmar industries that see more men than women are Utilities (100.0%), Information (100.0%), and Finance & Insurance (100.0%), whereas the industries that tend to have a higher number of women are Administrative & Support (100.0%), Health Care & Social Assistance (94.7%), and Retail Trade (75.4%).
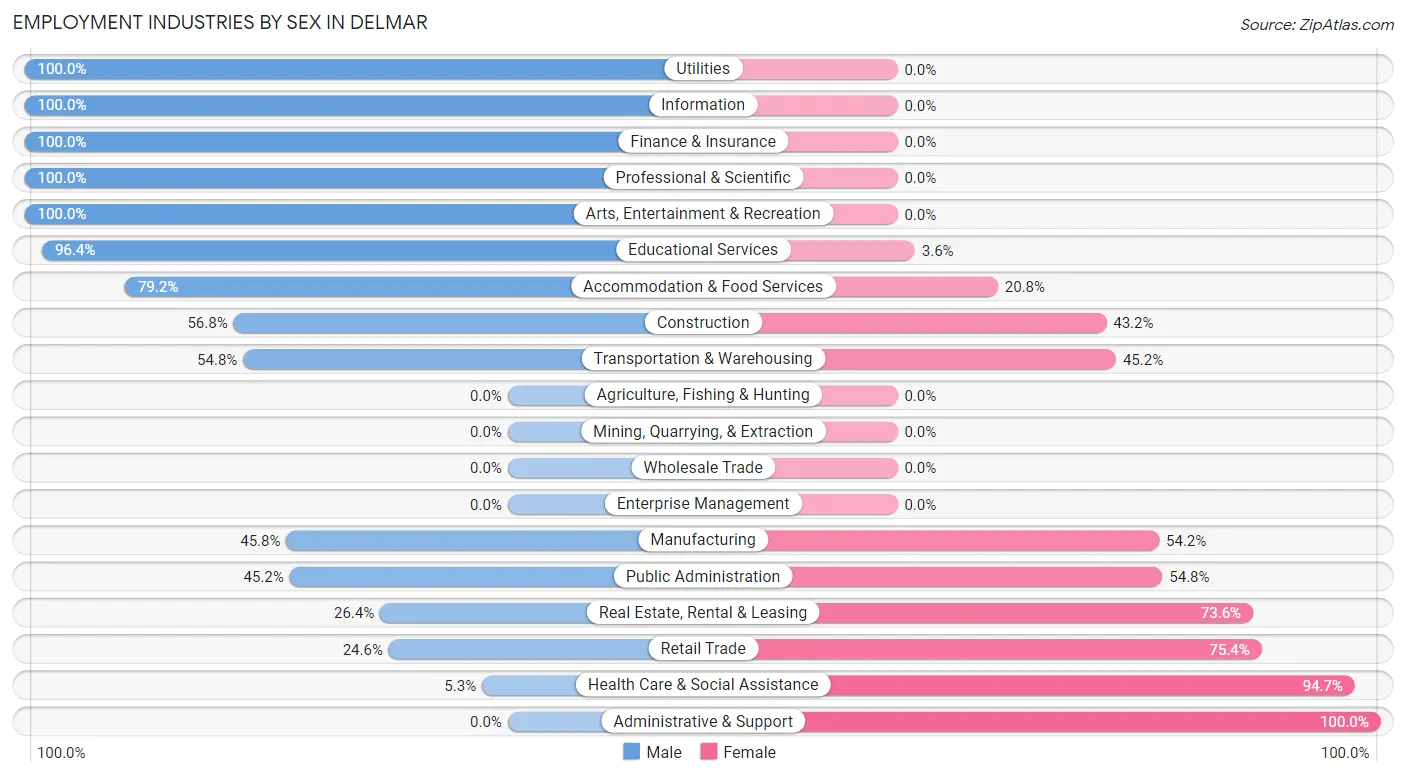
| Industry | Male | Female |
| Agriculture, Fishing & Hunting | 0 (0.0%) | 0 (0.0%) |
| Mining, Quarrying, & Extraction | 0 (0.0%) | 0 (0.0%) |
| Construction | 63 (56.8%) | 48 (43.2%) |
| Manufacturing | 99 (45.8%) | 117 (54.2%) |
| Wholesale Trade | 0 (0.0%) | 0 (0.0%) |
| Retail Trade | 66 (24.6%) | 202 (75.4%) |
| Transportation & Warehousing | 46 (54.8%) | 38 (45.2%) |
| Utilities | 8 (100.0%) | 0 (0.0%) |
| Information | 150 (100.0%) | 0 (0.0%) |
| Finance & Insurance | 13 (100.0%) | 0 (0.0%) |
| Real Estate, Rental & Leasing | 14 (26.4%) | 39 (73.6%) |
| Professional & Scientific | 28 (100.0%) | 0 (0.0%) |
| Enterprise Management | 0 (0.0%) | 0 (0.0%) |
| Administrative & Support | 0 (0.0%) | 69 (100.0%) |
| Educational Services | 187 (96.4%) | 7 (3.6%) |
| Health Care & Social Assistance | 30 (5.3%) | 533 (94.7%) |
| Arts, Entertainment & Recreation | 17 (100.0%) | 0 (0.0%) |
| Accommodation & Food Services | 80 (79.2%) | 21 (20.8%) |
| Public Administration | 28 (45.2%) | 34 (54.8%) |
| Total | 870 (41.8%) | 1,210 (58.2%) |
Education in Delmar
School Enrollment in Delmar
The most common levels of schooling among the 1,287 students in Delmar are high school (350 | 27.2%), college / undergraduate (334 | 26.0%), and middle school (231 | 17.9%).
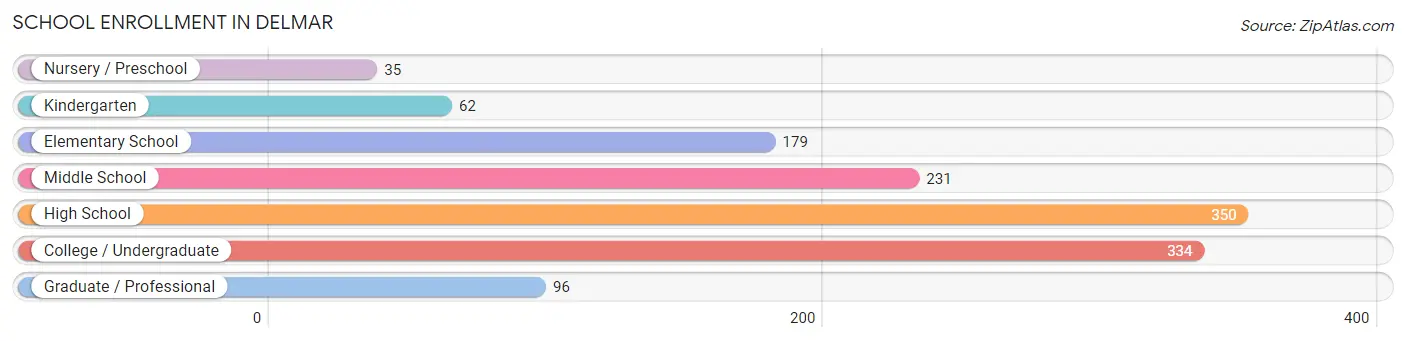
| School Level | # Students | % Students |
| Nursery / Preschool | 35 | 2.7% |
| Kindergarten | 62 | 4.8% |
| Elementary School | 179 | 13.9% |
| Middle School | 231 | 17.9% |
| High School | 350 | 27.2% |
| College / Undergraduate | 334 | 26.0% |
| Graduate / Professional | 96 | 7.5% |
| Total | 1,287 | 100.0% |
School Enrollment by Age by Funding Source in Delmar
Out of a total of 1,287 students who are enrolled in schools in Delmar, 76 (5.9%) attend a private institution, while the remaining 1,211 (94.1%) are enrolled in public schools. The age group of 3 to 4 year olds has the highest likelihood of being enrolled in private schools, with 35 (100.0% in the age bracket) enrolled. Conversely, the age group of 5 to 9 year old has the lowest likelihood of being enrolled in a private school, with 226 (100.0% in the age bracket) attending a public institution.
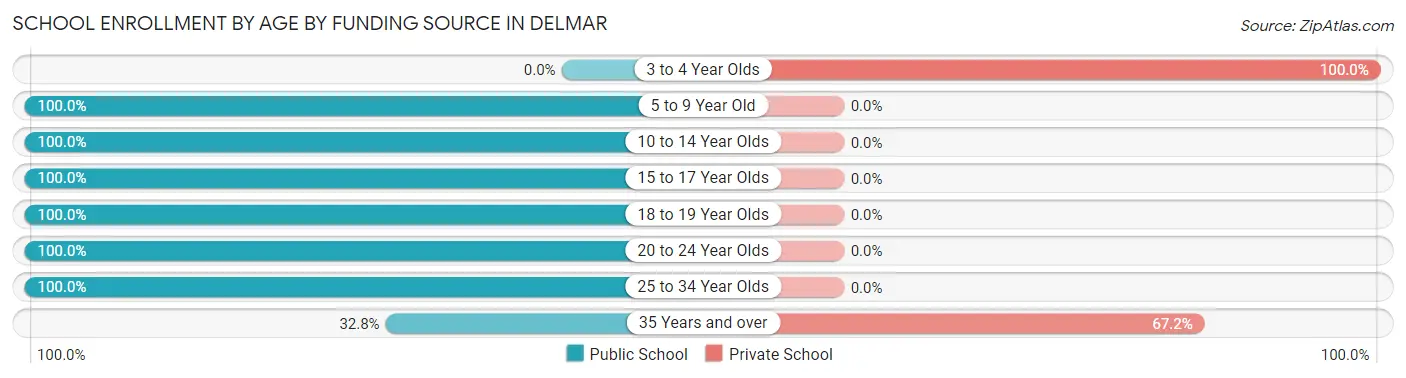
| Age Bracket | Public School | Private School |
| 3 to 4 Year Olds | 0 (0.0%) | 35 (100.0%) |
| 5 to 9 Year Old | 226 (100.0%) | 0 (0.0%) |
| 10 to 14 Year Olds | 246 (100.0%) | 0 (0.0%) |
| 15 to 17 Year Olds | 306 (100.0%) | 0 (0.0%) |
| 18 to 19 Year Olds | 54 (100.0%) | 0 (0.0%) |
| 20 to 24 Year Olds | 125 (100.0%) | 0 (0.0%) |
| 25 to 34 Year Olds | 234 (100.0%) | 0 (0.0%) |
| 35 Years and over | 20 (32.8%) | 41 (67.2%) |
| Total | 1,211 (94.1%) | 76 (5.9%) |
Educational Attainment by Field of Study in Delmar
Science & technology (169 | 24.9%), business (117 | 17.3%), education (99 | 14.6%), psychology (86 | 12.7%), and liberal arts & history (82 | 12.1%) are the most common fields of study among 678 individuals in Delmar who have obtained a bachelor's degree or higher.
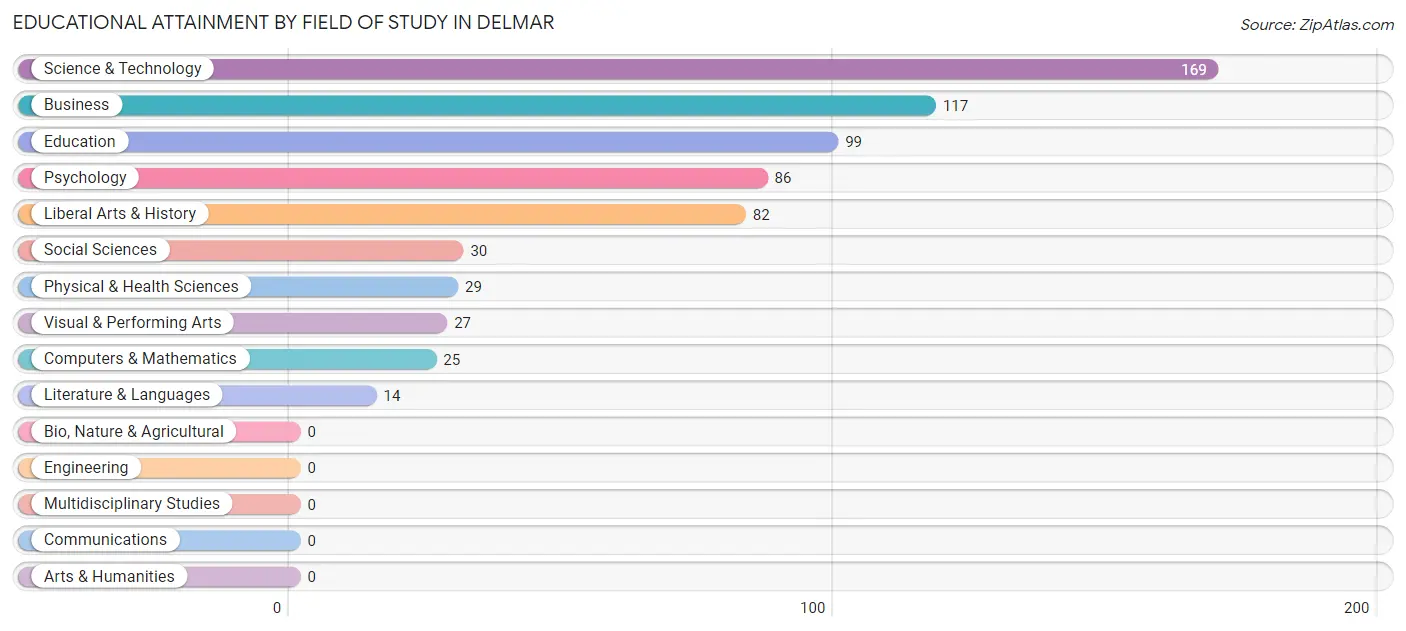
| Field of Study | # Graduates | % Graduates |
| Computers & Mathematics | 25 | 3.7% |
| Bio, Nature & Agricultural | 0 | 0.0% |
| Physical & Health Sciences | 29 | 4.3% |
| Psychology | 86 | 12.7% |
| Social Sciences | 30 | 4.4% |
| Engineering | 0 | 0.0% |
| Multidisciplinary Studies | 0 | 0.0% |
| Science & Technology | 169 | 24.9% |
| Business | 117 | 17.3% |
| Education | 99 | 14.6% |
| Literature & Languages | 14 | 2.1% |
| Liberal Arts & History | 82 | 12.1% |
| Visual & Performing Arts | 27 | 4.0% |
| Communications | 0 | 0.0% |
| Arts & Humanities | 0 | 0.0% |
| Total | 678 | 100.0% |
Transportation & Commute in Delmar
Vehicle Availability by Sex in Delmar
The most prevalent vehicle ownership categories in Delmar are males with 2 vehicles (360, accounting for 41.4%) and females with 2 vehicles (455, making up 30.0%).
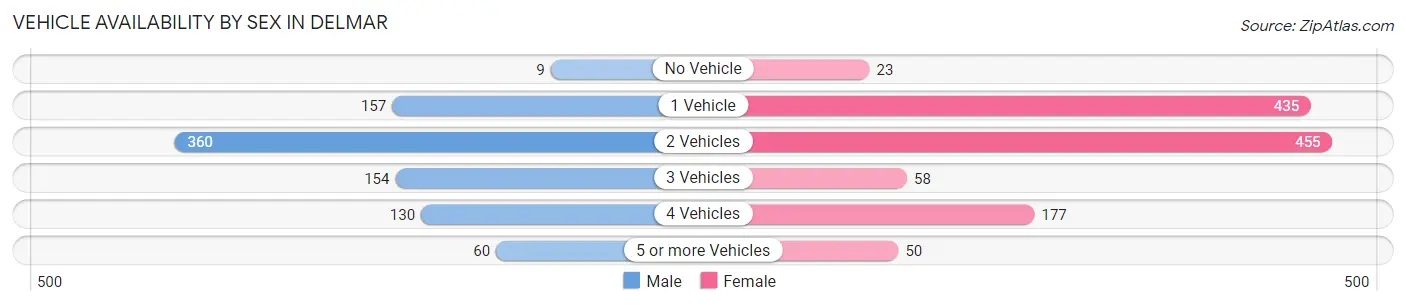
| Vehicles Available | Male | Female |
| No Vehicle | 9 (1.0%) | 23 (1.9%) |
| 1 Vehicle | 157 (18.0%) | 435 (36.3%) |
| 2 Vehicles | 360 (41.4%) | 455 (38.0%) |
| 3 Vehicles | 154 (17.7%) | 58 (4.8%) |
| 4 Vehicles | 130 (14.9%) | 177 (14.8%) |
| 5 or more Vehicles | 60 (6.9%) | 50 (4.2%) |
| Total | 870 (100.0%) | 1,198 (100.0%) |
Commute Time in Delmar
The most frequently occuring commute durations in Delmar are 45 to 59 minutes (412 commuters, 21.5%), 10 to 14 minutes (382 commuters, 20.0%), and 15 to 19 minutes (286 commuters, 14.9%).
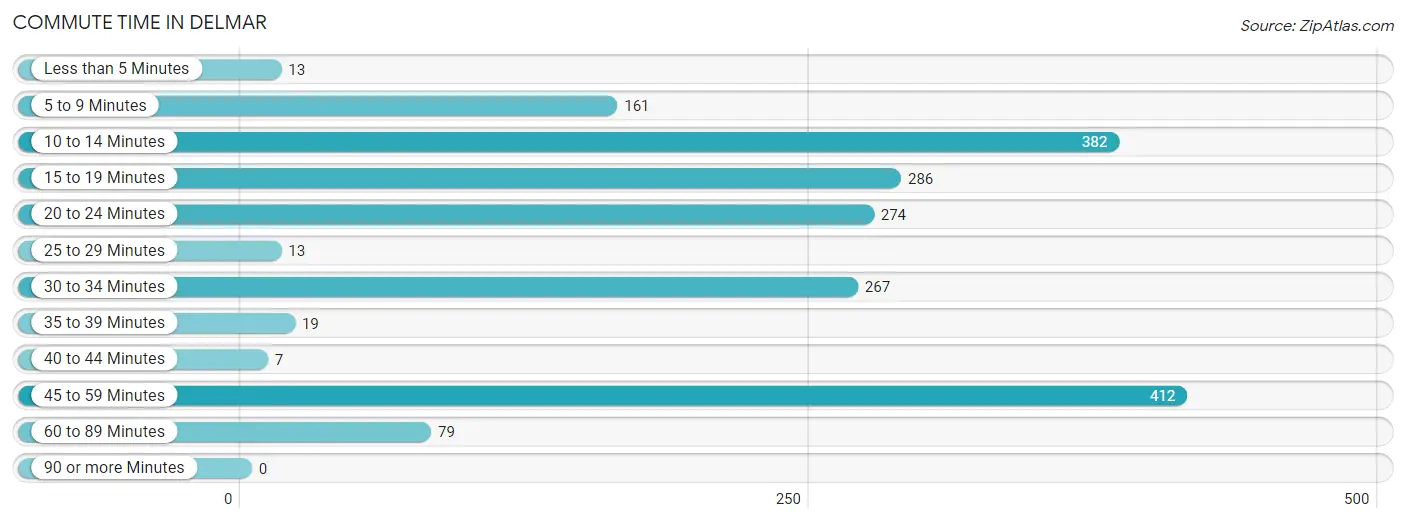
| Commute Time | # Commuters | % Commuters |
| Less than 5 Minutes | 13 | 0.7% |
| 5 to 9 Minutes | 161 | 8.4% |
| 10 to 14 Minutes | 382 | 20.0% |
| 15 to 19 Minutes | 286 | 14.9% |
| 20 to 24 Minutes | 274 | 14.3% |
| 25 to 29 Minutes | 13 | 0.7% |
| 30 to 34 Minutes | 267 | 14.0% |
| 35 to 39 Minutes | 19 | 1.0% |
| 40 to 44 Minutes | 7 | 0.4% |
| 45 to 59 Minutes | 412 | 21.5% |
| 60 to 89 Minutes | 79 | 4.1% |
| 90 or more Minutes | 0 | 0.0% |
Commute Time by Sex in Delmar
The most common commute times in Delmar are 10 to 14 minutes (239 commuters, 31.4%) for males and 45 to 59 minutes (247 commuters, 21.4%) for females.
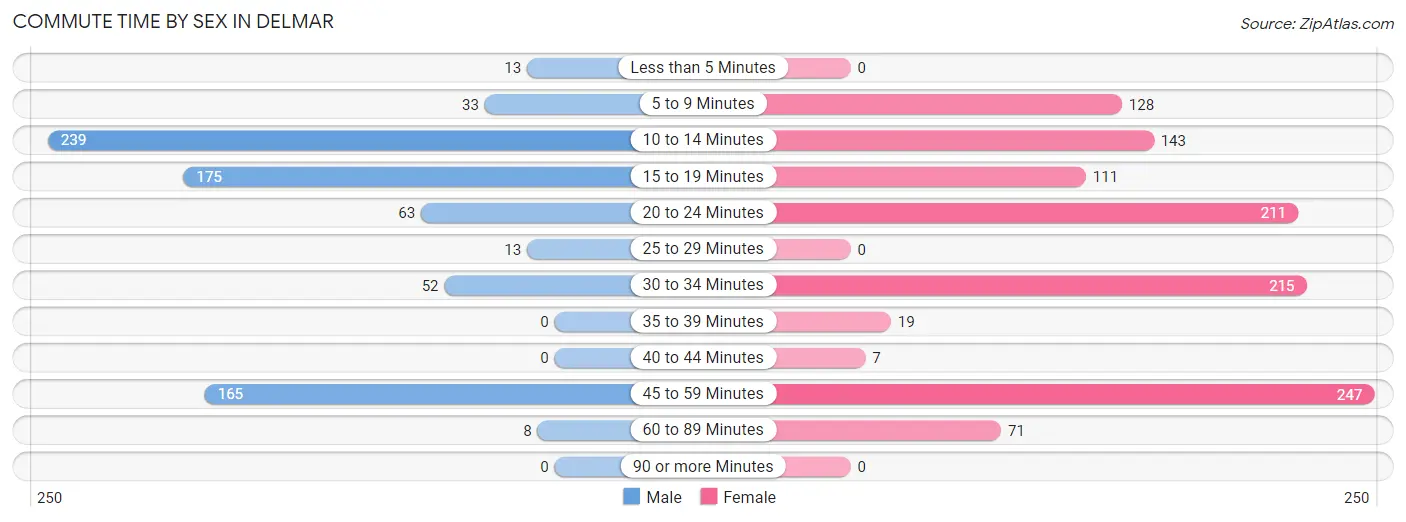
| Commute Time | Male | Female |
| Less than 5 Minutes | 13 (1.7%) | 0 (0.0%) |
| 5 to 9 Minutes | 33 (4.3%) | 128 (11.1%) |
| 10 to 14 Minutes | 239 (31.4%) | 143 (12.4%) |
| 15 to 19 Minutes | 175 (23.0%) | 111 (9.6%) |
| 20 to 24 Minutes | 63 (8.3%) | 211 (18.3%) |
| 25 to 29 Minutes | 13 (1.7%) | 0 (0.0%) |
| 30 to 34 Minutes | 52 (6.8%) | 215 (18.7%) |
| 35 to 39 Minutes | 0 (0.0%) | 19 (1.7%) |
| 40 to 44 Minutes | 0 (0.0%) | 7 (0.6%) |
| 45 to 59 Minutes | 165 (21.7%) | 247 (21.4%) |
| 60 to 89 Minutes | 8 (1.1%) | 71 (6.2%) |
| 90 or more Minutes | 0 (0.0%) | 0 (0.0%) |
Time of Departure to Work by Sex in Delmar
The most frequent times of departure to work in Delmar are 7:00 AM to 7:29 AM (149, 19.6%) for males and 8:00 AM to 8:29 AM (319, 27.7%) for females.
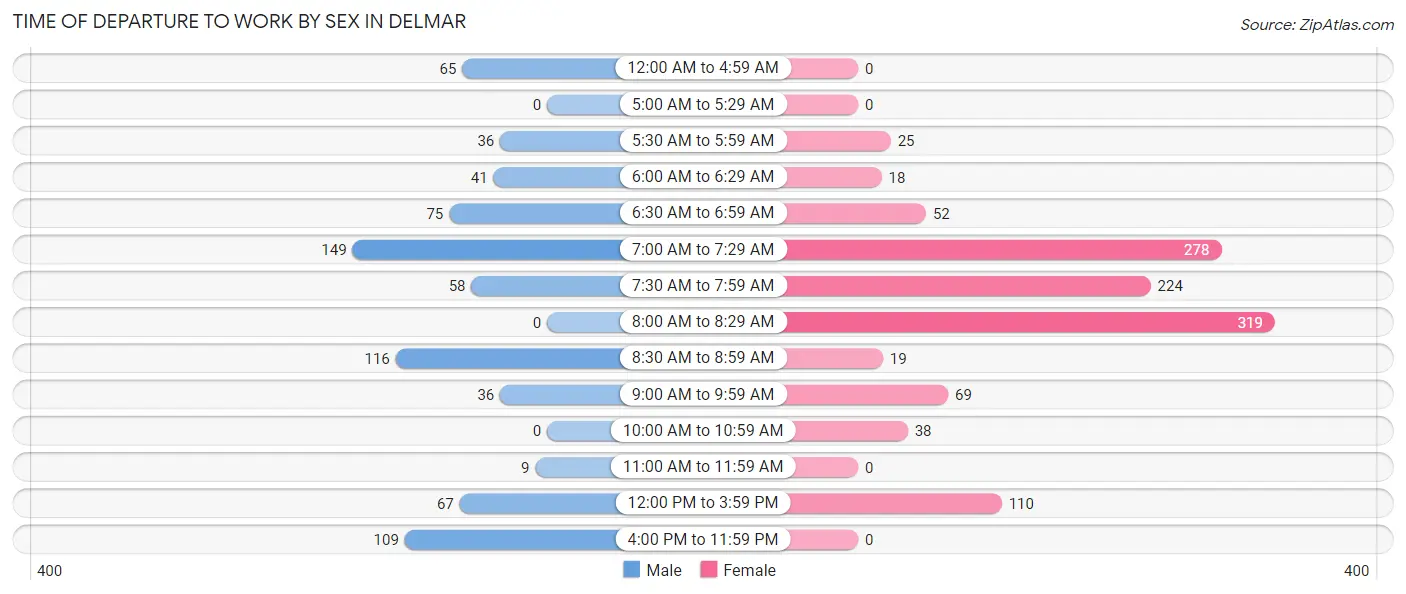
| Time of Departure | Male | Female |
| 12:00 AM to 4:59 AM | 65 (8.5%) | 0 (0.0%) |
| 5:00 AM to 5:29 AM | 0 (0.0%) | 0 (0.0%) |
| 5:30 AM to 5:59 AM | 36 (4.7%) | 25 (2.2%) |
| 6:00 AM to 6:29 AM | 41 (5.4%) | 18 (1.6%) |
| 6:30 AM to 6:59 AM | 75 (9.9%) | 52 (4.5%) |
| 7:00 AM to 7:29 AM | 149 (19.6%) | 278 (24.1%) |
| 7:30 AM to 7:59 AM | 58 (7.6%) | 224 (19.4%) |
| 8:00 AM to 8:29 AM | 0 (0.0%) | 319 (27.7%) |
| 8:30 AM to 8:59 AM | 116 (15.2%) | 19 (1.7%) |
| 9:00 AM to 9:59 AM | 36 (4.7%) | 69 (6.0%) |
| 10:00 AM to 10:59 AM | 0 (0.0%) | 38 (3.3%) |
| 11:00 AM to 11:59 AM | 9 (1.2%) | 0 (0.0%) |
| 12:00 PM to 3:59 PM | 67 (8.8%) | 110 (9.6%) |
| 4:00 PM to 11:59 PM | 109 (14.3%) | 0 (0.0%) |
| Total | 761 (100.0%) | 1,152 (100.0%) |
Housing Occupancy in Delmar
Occupancy by Ownership in Delmar
Of the total 1,628 dwellings in Delmar, owner-occupied units account for 862 (52.9%), while renter-occupied units make up 766 (47.0%).
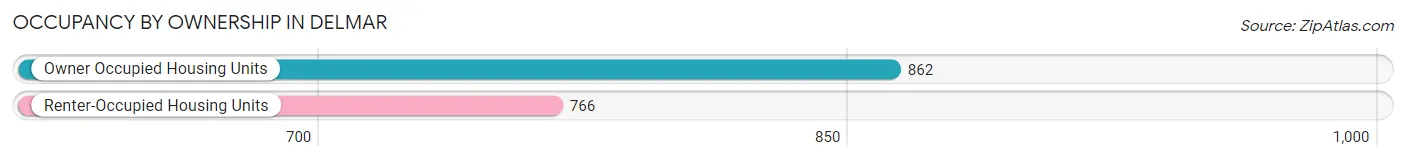
| Occupancy | # Housing Units | % Housing Units |
| Owner Occupied Housing Units | 862 | 52.9% |
| Renter-Occupied Housing Units | 766 | 47.0% |
| Total Occupied Housing Units | 1,628 | 100.0% |
Occupancy by Household Size in Delmar
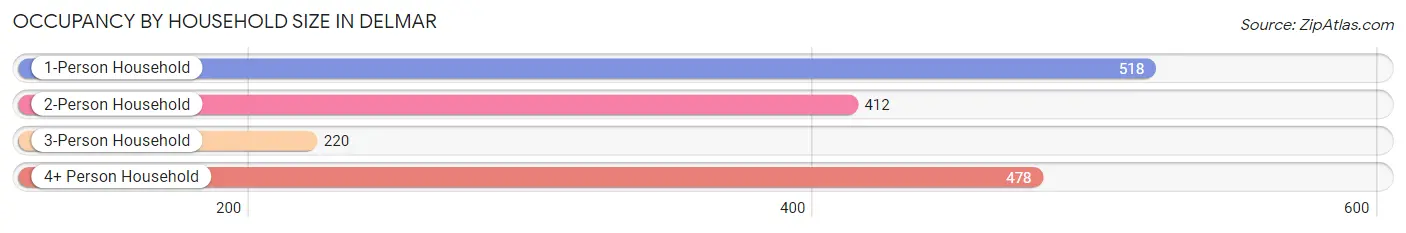
| Household Size | # Housing Units | % Housing Units |
| 1-Person Household | 518 | 31.8% |
| 2-Person Household | 412 | 25.3% |
| 3-Person Household | 220 | 13.5% |
| 4+ Person Household | 478 | 29.4% |
| Total Housing Units | 1,628 | 100.0% |
Occupancy by Ownership by Household Size in Delmar
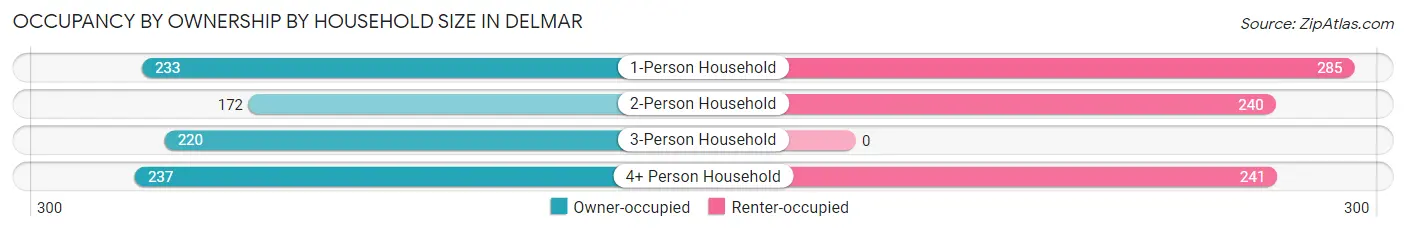
| Household Size | Owner-occupied | Renter-occupied |
| 1-Person Household | 233 (45.0%) | 285 (55.0%) |
| 2-Person Household | 172 (41.7%) | 240 (58.3%) |
| 3-Person Household | 220 (100.0%) | 0 (0.0%) |
| 4+ Person Household | 237 (49.6%) | 241 (50.4%) |
| Total Housing Units | 862 (52.9%) | 766 (47.0%) |
Occupancy by Educational Attainment in Delmar
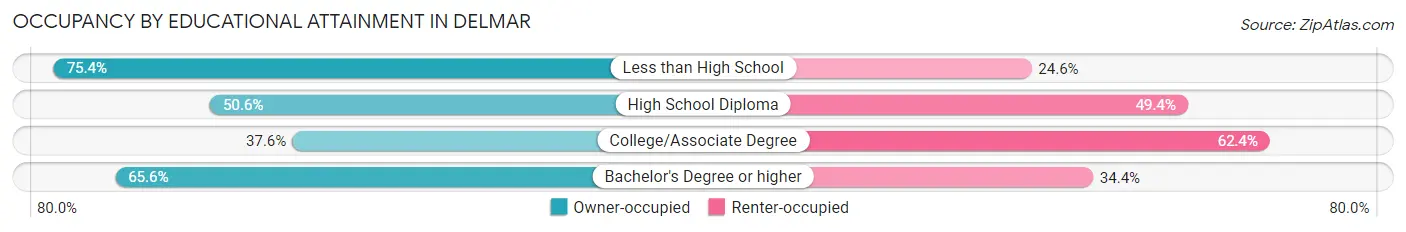
| Household Size | Owner-occupied | Renter-occupied |
| Less than High School | 147 (75.4%) | 48 (24.6%) |
| High School Diploma | 128 (50.6%) | 125 (49.4%) |
| College/Associate Degree | 251 (37.6%) | 417 (62.4%) |
| Bachelor's Degree or higher | 336 (65.6%) | 176 (34.4%) |
Occupancy by Age of Householder in Delmar
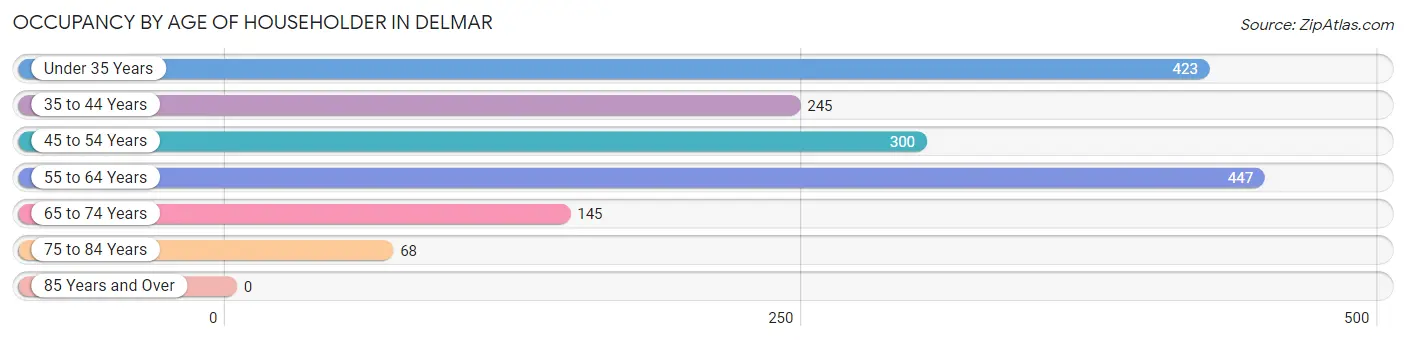
| Age Bracket | # Households | % Households |
| Under 35 Years | 423 | 26.0% |
| 35 to 44 Years | 245 | 15.0% |
| 45 to 54 Years | 300 | 18.4% |
| 55 to 64 Years | 447 | 27.5% |
| 65 to 74 Years | 145 | 8.9% |
| 75 to 84 Years | 68 | 4.2% |
| 85 Years and Over | 0 | 0.0% |
| Total | 1,628 | 100.0% |
Housing Finances in Delmar
Median Income by Occupancy in Delmar
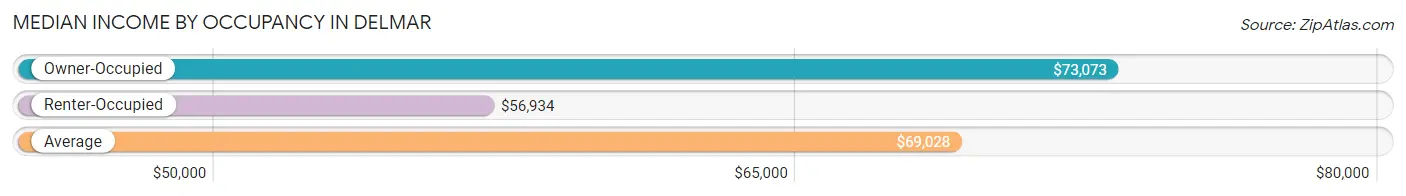
| Occupancy Type | # Households | Median Income |
| Owner-Occupied | 862 (52.9%) | $73,073 |
| Renter-Occupied | 766 (47.0%) | $56,934 |
| Average | 1,628 (100.0%) | $69,028 |
Occupancy by Householder Income Bracket in Delmar
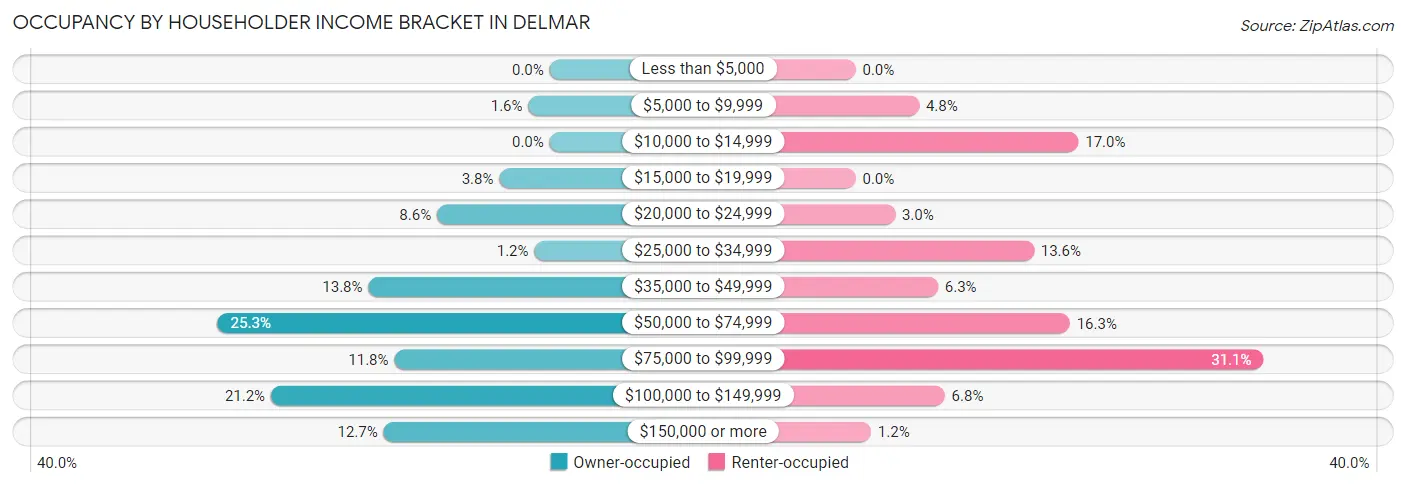
| Income Bracket | Owner-occupied | Renter-occupied |
| Less than $5,000 | 0 (0.0%) | 0 (0.0%) |
| $5,000 to $9,999 | 14 (1.6%) | 37 (4.8%) |
| $10,000 to $14,999 | 0 (0.0%) | 130 (17.0%) |
| $15,000 to $19,999 | 33 (3.8%) | 0 (0.0%) |
| $20,000 to $24,999 | 74 (8.6%) | 23 (3.0%) |
| $25,000 to $34,999 | 10 (1.2%) | 104 (13.6%) |
| $35,000 to $49,999 | 119 (13.8%) | 48 (6.3%) |
| $50,000 to $74,999 | 218 (25.3%) | 125 (16.3%) |
| $75,000 to $99,999 | 102 (11.8%) | 238 (31.1%) |
| $100,000 to $149,999 | 183 (21.2%) | 52 (6.8%) |
| $150,000 or more | 109 (12.7%) | 9 (1.2%) |
| Total | 862 (100.0%) | 766 (100.0%) |
Monthly Housing Cost Tiers in Delmar
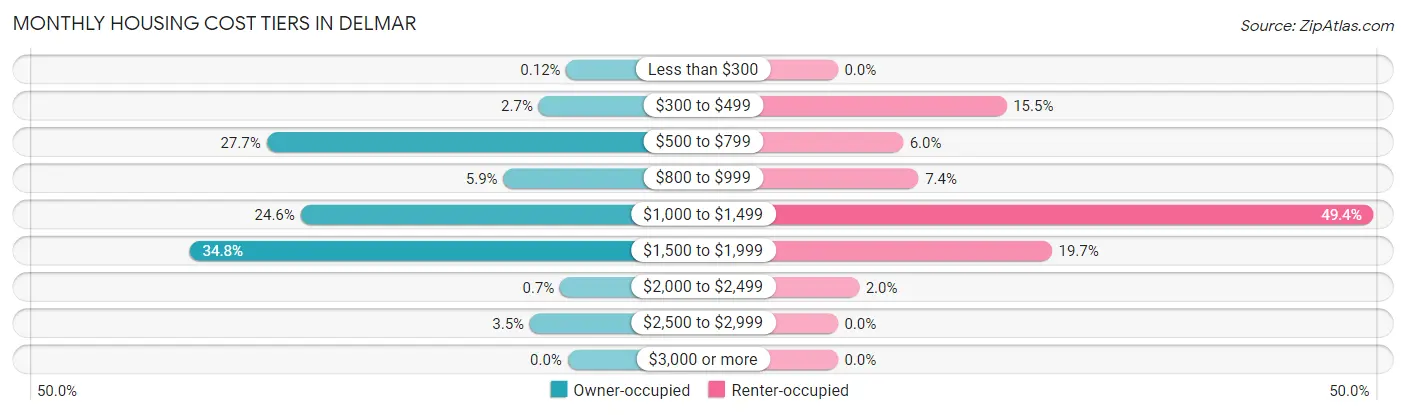
| Monthly Cost | Owner-occupied | Renter-occupied |
| Less than $300 | 1 (0.1%) | 0 (0.0%) |
| $300 to $499 | 23 (2.7%) | 119 (15.5%) |
| $500 to $799 | 239 (27.7%) | 46 (6.0%) |
| $800 to $999 | 51 (5.9%) | 57 (7.4%) |
| $1,000 to $1,499 | 212 (24.6%) | 378 (49.3%) |
| $1,500 to $1,999 | 300 (34.8%) | 151 (19.7%) |
| $2,000 to $2,499 | 6 (0.7%) | 15 (2.0%) |
| $2,500 to $2,999 | 30 (3.5%) | 0 (0.0%) |
| $3,000 or more | 0 (0.0%) | 0 (0.0%) |
| Total | 862 (100.0%) | 766 (100.0%) |
Physical Housing Characteristics in Delmar
Housing Structures in Delmar
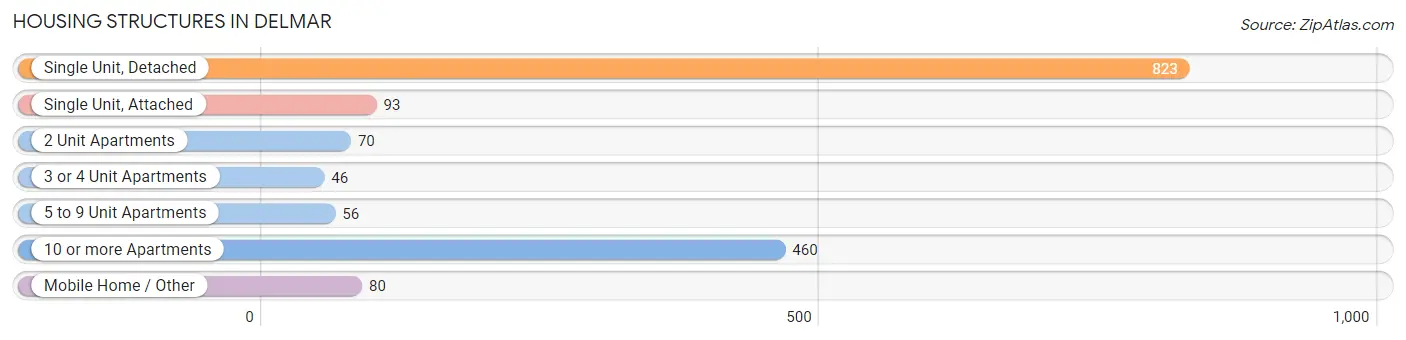
| Structure Type | # Housing Units | % Housing Units |
| Single Unit, Detached | 823 | 50.5% |
| Single Unit, Attached | 93 | 5.7% |
| 2 Unit Apartments | 70 | 4.3% |
| 3 or 4 Unit Apartments | 46 | 2.8% |
| 5 to 9 Unit Apartments | 56 | 3.4% |
| 10 or more Apartments | 460 | 28.3% |
| Mobile Home / Other | 80 | 4.9% |
| Total | 1,628 | 100.0% |
Housing Structures by Occupancy in Delmar
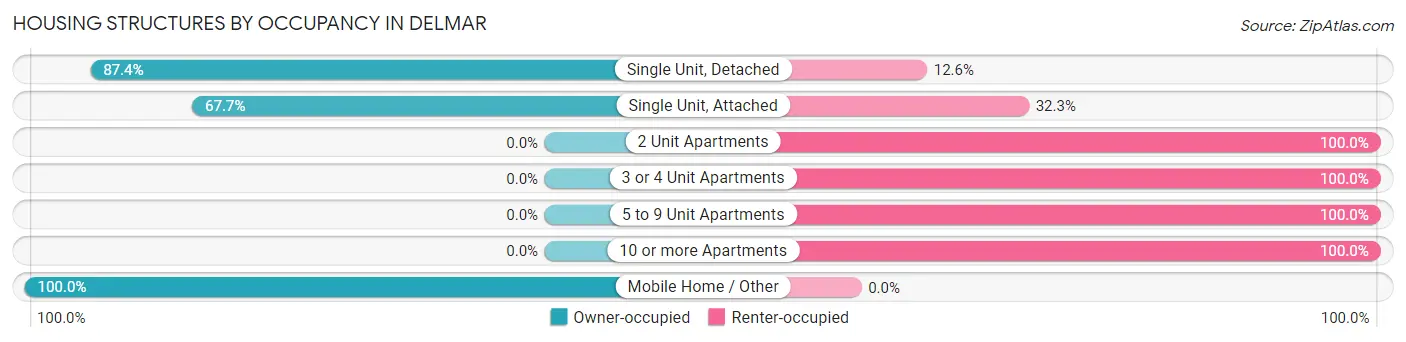
| Structure Type | Owner-occupied | Renter-occupied |
| Single Unit, Detached | 719 (87.4%) | 104 (12.6%) |
| Single Unit, Attached | 63 (67.7%) | 30 (32.3%) |
| 2 Unit Apartments | 0 (0.0%) | 70 (100.0%) |
| 3 or 4 Unit Apartments | 0 (0.0%) | 46 (100.0%) |
| 5 to 9 Unit Apartments | 0 (0.0%) | 56 (100.0%) |
| 10 or more Apartments | 0 (0.0%) | 460 (100.0%) |
| Mobile Home / Other | 80 (100.0%) | 0 (0.0%) |
| Total | 862 (52.9%) | 766 (47.0%) |
Housing Structures by Number of Rooms in Delmar
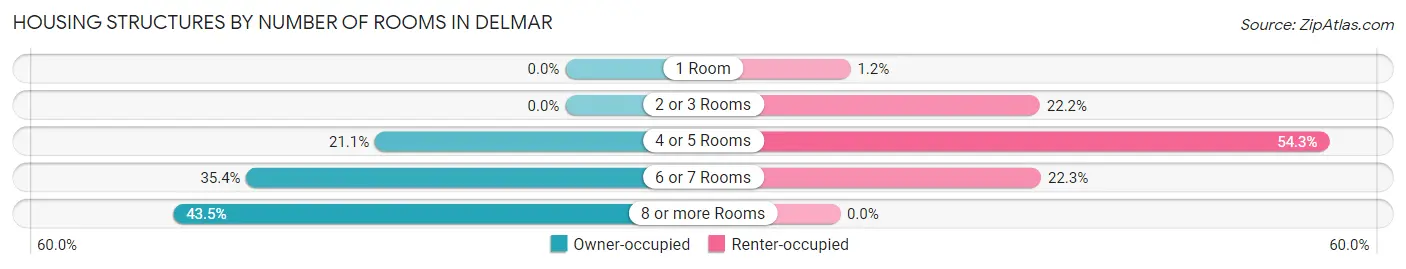
| Number of Rooms | Owner-occupied | Renter-occupied |
| 1 Room | 0 (0.0%) | 9 (1.2%) |
| 2 or 3 Rooms | 0 (0.0%) | 170 (22.2%) |
| 4 or 5 Rooms | 182 (21.1%) | 416 (54.3%) |
| 6 or 7 Rooms | 305 (35.4%) | 171 (22.3%) |
| 8 or more Rooms | 375 (43.5%) | 0 (0.0%) |
| Total | 862 (100.0%) | 766 (100.0%) |
Housing Structure by Heating Type in Delmar
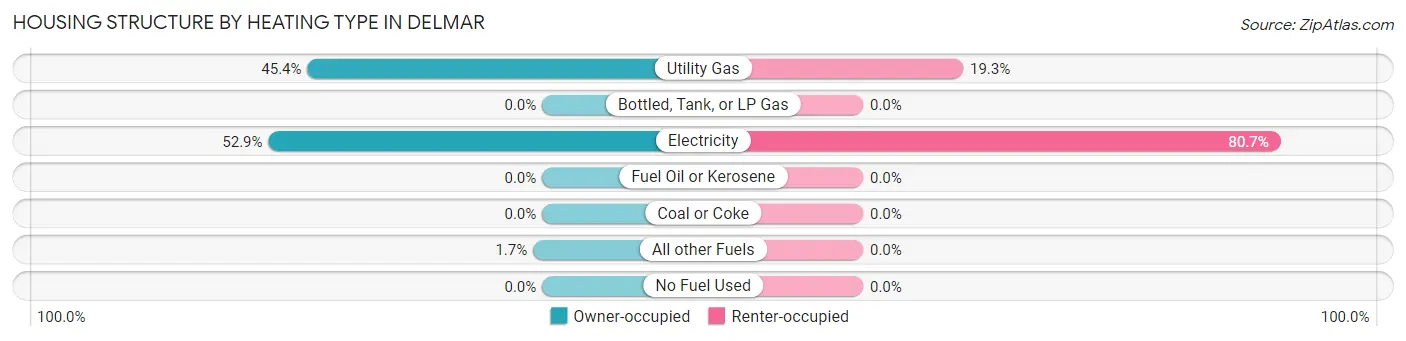
| Heating Type | Owner-occupied | Renter-occupied |
| Utility Gas | 391 (45.4%) | 148 (19.3%) |
| Bottled, Tank, or LP Gas | 0 (0.0%) | 0 (0.0%) |
| Electricity | 456 (52.9%) | 618 (80.7%) |
| Fuel Oil or Kerosene | 0 (0.0%) | 0 (0.0%) |
| Coal or Coke | 0 (0.0%) | 0 (0.0%) |
| All other Fuels | 15 (1.7%) | 0 (0.0%) |
| No Fuel Used | 0 (0.0%) | 0 (0.0%) |
| Total | 862 (100.0%) | 766 (100.0%) |
Household Vehicle Usage in Delmar
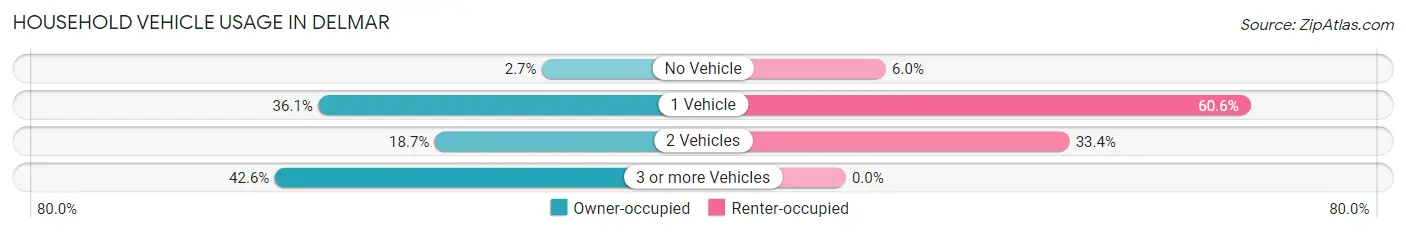
| Vehicles per Household | Owner-occupied | Renter-occupied |
| No Vehicle | 23 (2.7%) | 46 (6.0%) |
| 1 Vehicle | 311 (36.1%) | 464 (60.6%) |
| 2 Vehicles | 161 (18.7%) | 256 (33.4%) |
| 3 or more Vehicles | 367 (42.6%) | 0 (0.0%) |
| Total | 862 (100.0%) | 766 (100.0%) |
Real Estate & Mortgages in Delmar
Real Estate and Mortgage Overview in Delmar
| Characteristic | Without Mortgage | With Mortgage |
| Housing Units | 240 | 622 |
| Median Property Value | $205,900 | $184,900 |
| Median Household Income | $74,323 | $70 |
| Monthly Housing Costs | $585 | $0 |
| Real Estate Taxes | $1,767 | $25 |
Property Value by Mortgage Status in Delmar
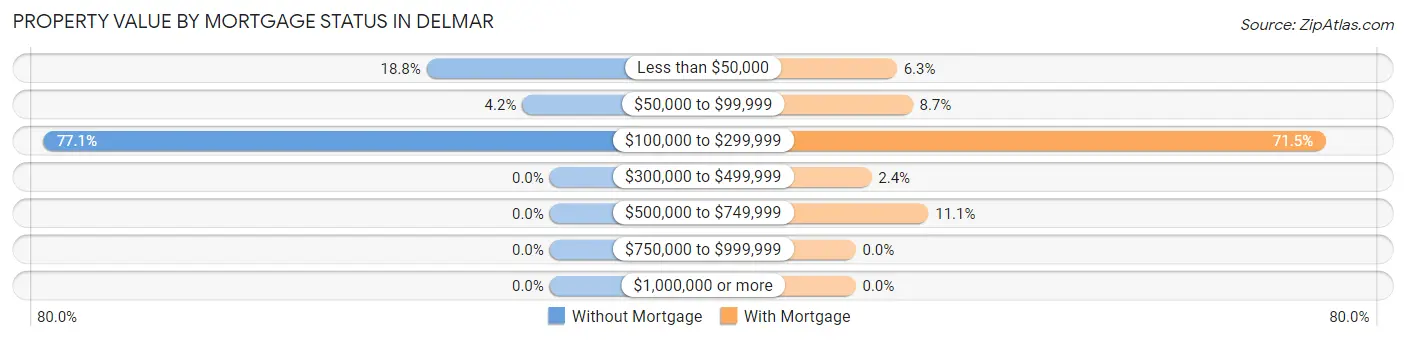
| Property Value | Without Mortgage | With Mortgage |
| Less than $50,000 | 45 (18.8%) | 39 (6.3%) |
| $50,000 to $99,999 | 10 (4.2%) | 54 (8.7%) |
| $100,000 to $299,999 | 185 (77.1%) | 445 (71.5%) |
| $300,000 to $499,999 | 0 (0.0%) | 15 (2.4%) |
| $500,000 to $749,999 | 0 (0.0%) | 69 (11.1%) |
| $750,000 to $999,999 | 0 (0.0%) | 0 (0.0%) |
| $1,000,000 or more | 0 (0.0%) | 0 (0.0%) |
| Total | 240 (100.0%) | 622 (100.0%) |
Household Income by Mortgage Status in Delmar
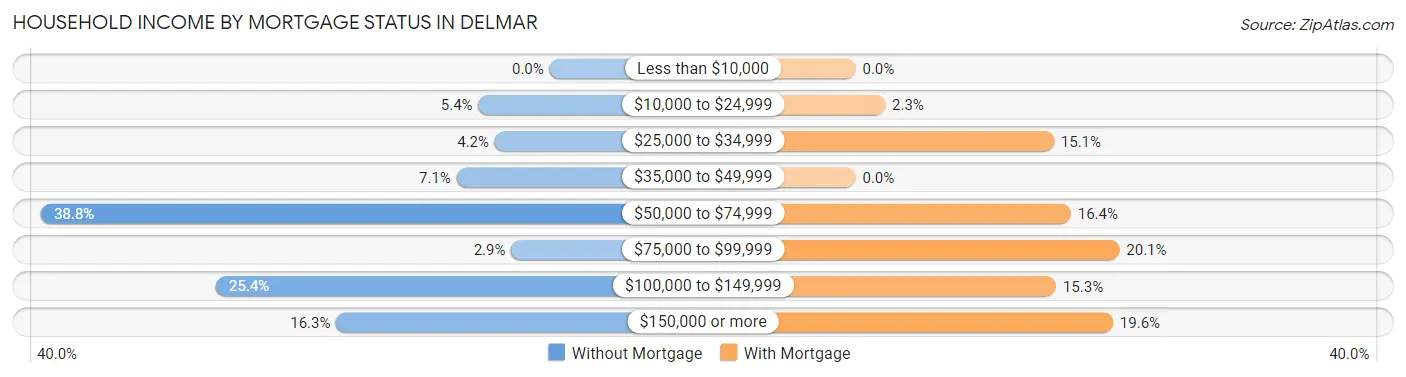
| Household Income | Without Mortgage | With Mortgage |
| Less than $10,000 | 0 (0.0%) | 0 (0.0%) |
| $10,000 to $24,999 | 13 (5.4%) | 14 (2.2%) |
| $25,000 to $34,999 | 10 (4.2%) | 94 (15.1%) |
| $35,000 to $49,999 | 17 (7.1%) | 0 (0.0%) |
| $50,000 to $74,999 | 93 (38.8%) | 102 (16.4%) |
| $75,000 to $99,999 | 7 (2.9%) | 125 (20.1%) |
| $100,000 to $149,999 | 61 (25.4%) | 95 (15.3%) |
| $150,000 or more | 39 (16.3%) | 122 (19.6%) |
| Total | 240 (100.0%) | 622 (100.0%) |
Property Value to Household Income Ratio in Delmar
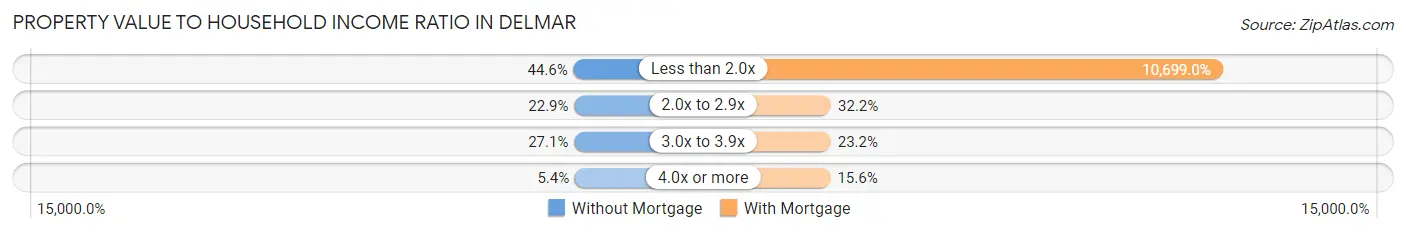
| Value-to-Income Ratio | Without Mortgage | With Mortgage |
| Less than 2.0x | 107 (44.6%) | 66,548 (10,699.0%) |
| 2.0x to 2.9x | 55 (22.9%) | 200 (32.2%) |
| 3.0x to 3.9x | 65 (27.1%) | 144 (23.2%) |
| 4.0x or more | 13 (5.4%) | 97 (15.6%) |
| Total | 240 (100.0%) | 622 (100.0%) |
Real Estate Taxes by Mortgage Status in Delmar
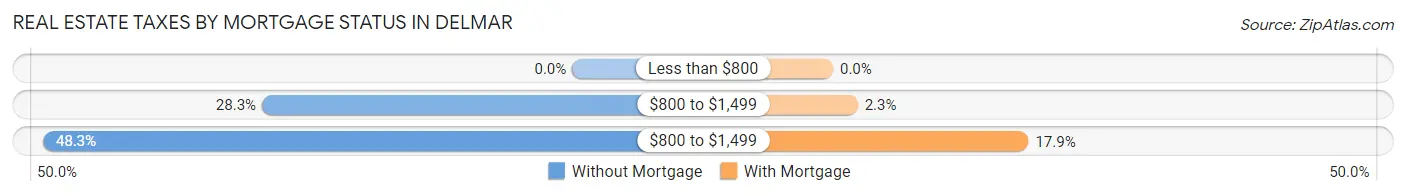
| Property Taxes | Without Mortgage | With Mortgage |
| Less than $800 | 0 (0.0%) | 0 (0.0%) |
| $800 to $1,499 | 68 (28.3%) | 14 (2.2%) |
| $800 to $1,499 | 116 (48.3%) | 111 (17.8%) |
| Total | 240 (100.0%) | 622 (100.0%) |
Health & Disability in Delmar
Health Insurance Coverage by Age in Delmar
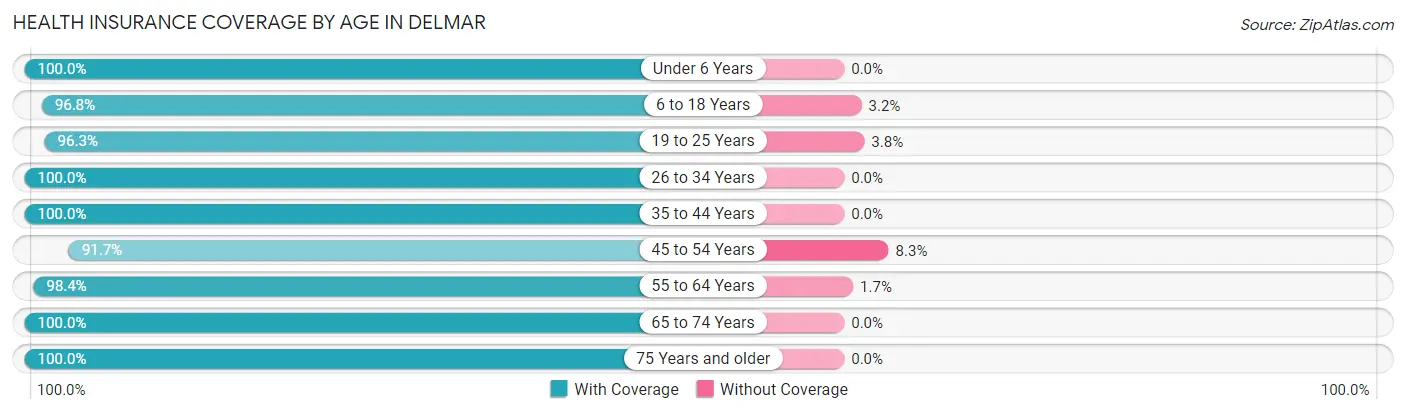
| Age Bracket | With Coverage | Without Coverage |
| Under 6 Years | 224 (100.0%) | 0 (0.0%) |
| 6 to 18 Years | 782 (96.8%) | 26 (3.2%) |
| 19 to 25 Years | 436 (96.3%) | 17 (3.7%) |
| 26 to 34 Years | 527 (100.0%) | 0 (0.0%) |
| 35 to 44 Years | 408 (100.0%) | 0 (0.0%) |
| 45 to 54 Years | 521 (91.7%) | 47 (8.3%) |
| 55 to 64 Years | 536 (98.4%) | 9 (1.7%) |
| 65 to 74 Years | 237 (100.0%) | 0 (0.0%) |
| 75 Years and older | 127 (100.0%) | 0 (0.0%) |
| Total | 3,798 (97.5%) | 99 (2.5%) |
Health Insurance Coverage by Citizenship Status in Delmar
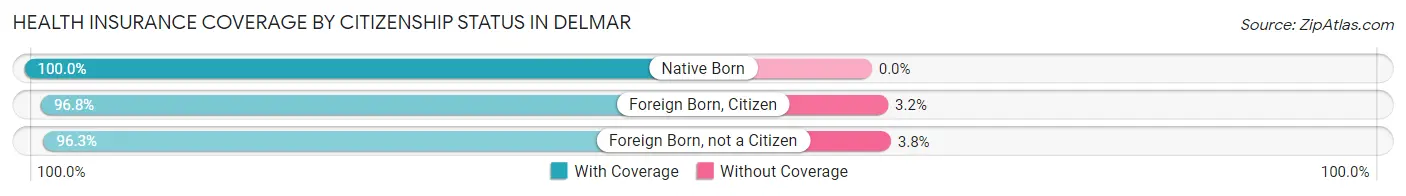
| Citizenship Status | With Coverage | Without Coverage |
| Native Born | 224 (100.0%) | 0 (0.0%) |
| Foreign Born, Citizen | 782 (96.8%) | 26 (3.2%) |
| Foreign Born, not a Citizen | 436 (96.3%) | 17 (3.7%) |
Health Insurance Coverage by Household Income in Delmar
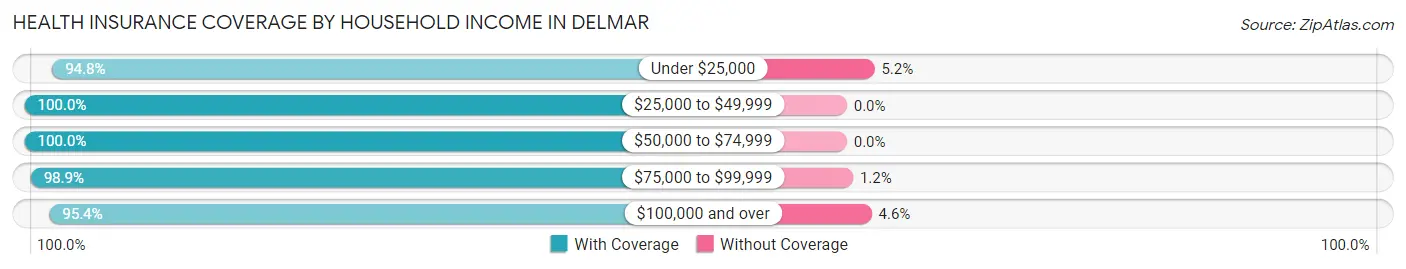
| Household Income | With Coverage | Without Coverage |
| Under $25,000 | 659 (94.8%) | 36 (5.2%) |
| $25,000 to $49,999 | 449 (100.0%) | 0 (0.0%) |
| $50,000 to $74,999 | 677 (100.0%) | 0 (0.0%) |
| $75,000 to $99,999 | 944 (98.9%) | 11 (1.1%) |
| $100,000 and over | 1,069 (95.4%) | 52 (4.6%) |
Public vs Private Health Insurance Coverage by Age in Delmar
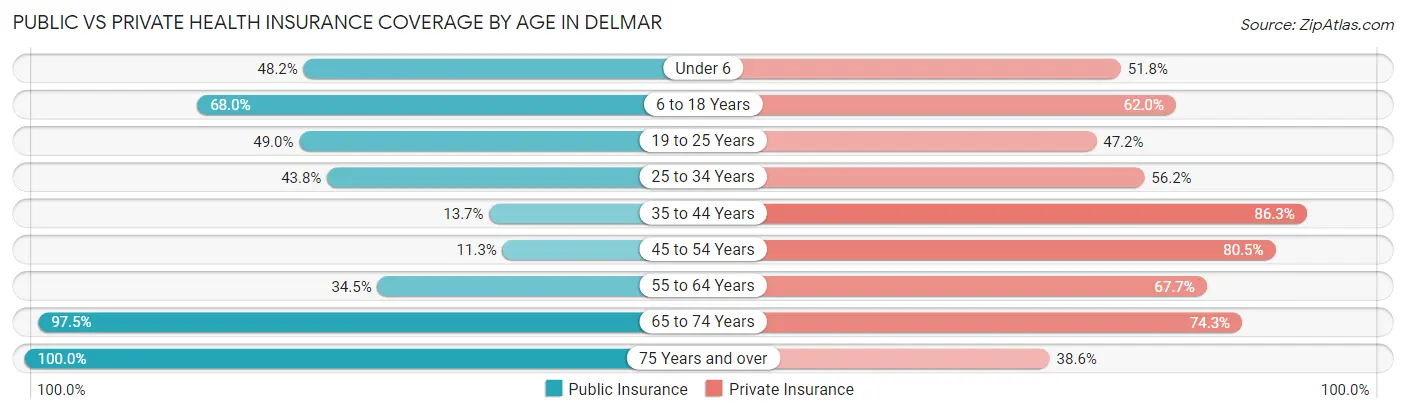
| Age Bracket | Public Insurance | Private Insurance |
| Under 6 | 108 (48.2%) | 116 (51.8%) |
| 6 to 18 Years | 549 (67.9%) | 501 (62.0%) |
| 19 to 25 Years | 222 (49.0%) | 214 (47.2%) |
| 25 to 34 Years | 231 (43.8%) | 296 (56.2%) |
| 35 to 44 Years | 56 (13.7%) | 352 (86.3%) |
| 45 to 54 Years | 64 (11.3%) | 457 (80.5%) |
| 55 to 64 Years | 188 (34.5%) | 369 (67.7%) |
| 65 to 74 Years | 231 (97.5%) | 176 (74.3%) |
| 75 Years and over | 127 (100.0%) | 49 (38.6%) |
| Total | 1,776 (45.6%) | 2,530 (64.9%) |
Disability Status by Sex by Age in Delmar
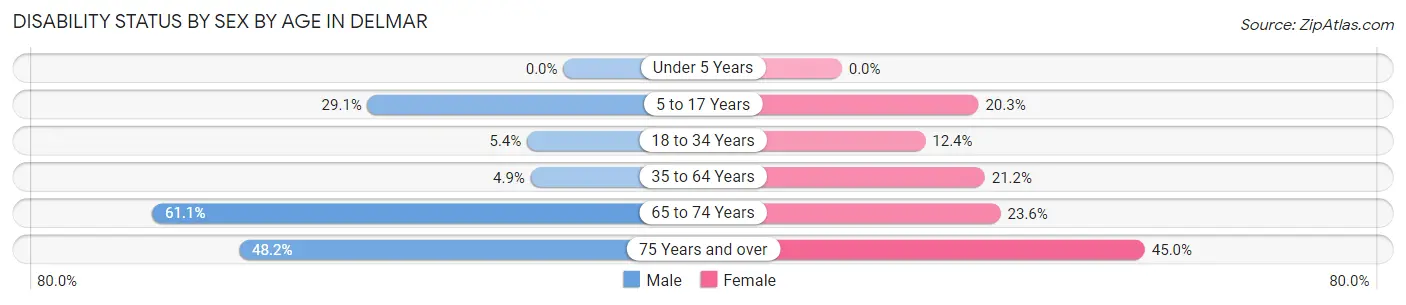
| Age Bracket | Male | Female |
| Under 5 Years | 0 (0.0%) | 0 (0.0%) |
| 5 to 17 Years | 152 (29.1%) | 54 (20.3%) |
| 18 to 34 Years | 24 (5.4%) | 73 (12.4%) |
| 35 to 64 Years | 29 (4.9%) | 196 (21.2%) |
| 65 to 74 Years | 80 (61.1%) | 25 (23.6%) |
| 75 Years and over | 13 (48.1%) | 45 (45.0%) |
Disability Class by Sex by Age in Delmar
Disability Class: Hearing Difficulty
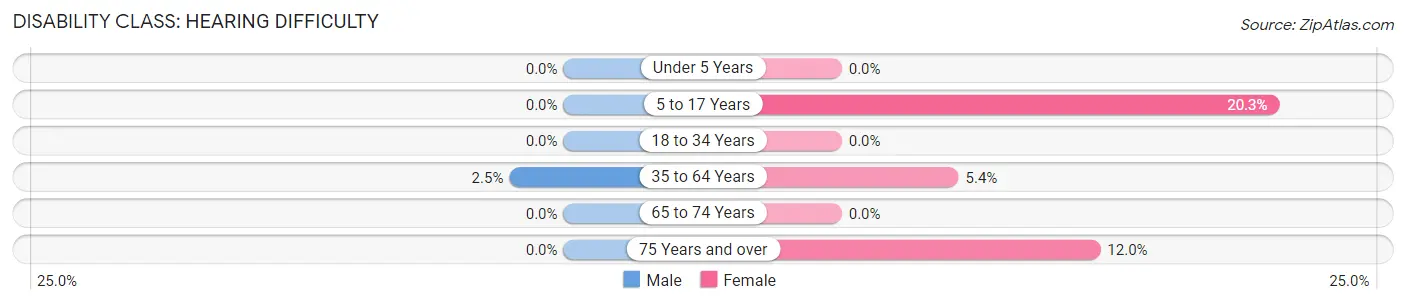
| Age Bracket | Male | Female |
| Under 5 Years | 0 (0.0%) | 0 (0.0%) |
| 5 to 17 Years | 0 (0.0%) | 54 (20.3%) |
| 18 to 34 Years | 0 (0.0%) | 0 (0.0%) |
| 35 to 64 Years | 15 (2.5%) | 50 (5.4%) |
| 65 to 74 Years | 0 (0.0%) | 0 (0.0%) |
| 75 Years and over | 0 (0.0%) | 12 (12.0%) |
Disability Class: Vision Difficulty
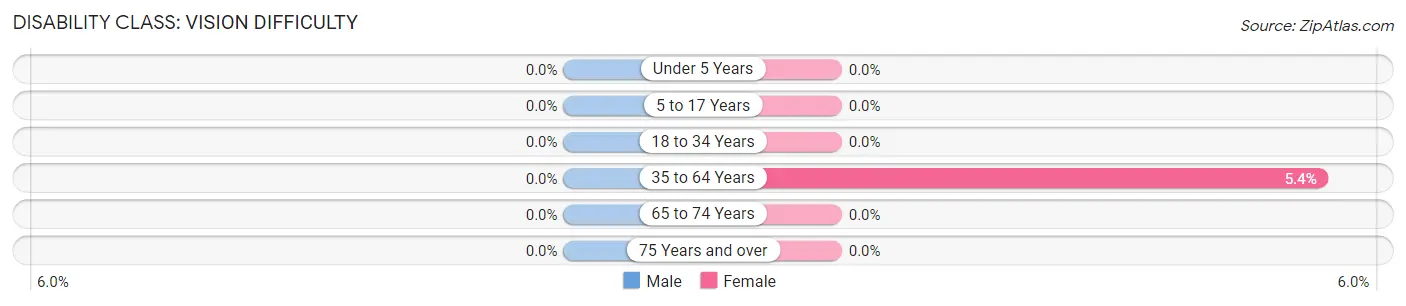
| Age Bracket | Male | Female |
| Under 5 Years | 0 (0.0%) | 0 (0.0%) |
| 5 to 17 Years | 0 (0.0%) | 0 (0.0%) |
| 18 to 34 Years | 0 (0.0%) | 0 (0.0%) |
| 35 to 64 Years | 0 (0.0%) | 50 (5.4%) |
| 65 to 74 Years | 0 (0.0%) | 0 (0.0%) |
| 75 Years and over | 0 (0.0%) | 0 (0.0%) |
Disability Class: Cognitive Difficulty
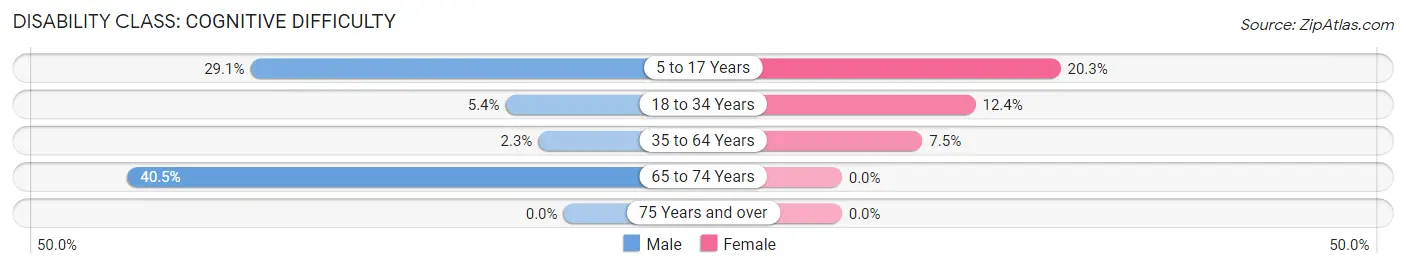
| Age Bracket | Male | Female |
| 5 to 17 Years | 152 (29.1%) | 54 (20.3%) |
| 18 to 34 Years | 24 (5.4%) | 73 (12.4%) |
| 35 to 64 Years | 14 (2.3%) | 69 (7.5%) |
| 65 to 74 Years | 53 (40.5%) | 0 (0.0%) |
| 75 Years and over | 0 (0.0%) | 0 (0.0%) |
Disability Class: Ambulatory Difficulty
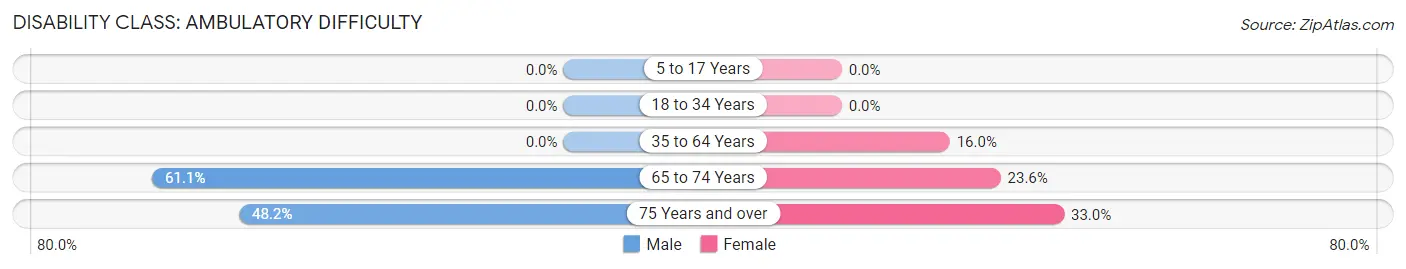
| Age Bracket | Male | Female |
| 5 to 17 Years | 0 (0.0%) | 0 (0.0%) |
| 18 to 34 Years | 0 (0.0%) | 0 (0.0%) |
| 35 to 64 Years | 0 (0.0%) | 148 (16.0%) |
| 65 to 74 Years | 80 (61.1%) | 25 (23.6%) |
| 75 Years and over | 13 (48.1%) | 33 (33.0%) |
Disability Class: Self-Care Difficulty
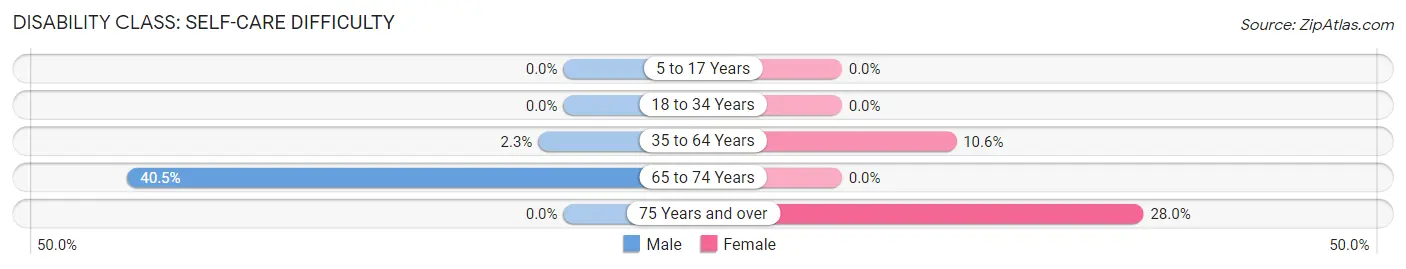
| Age Bracket | Male | Female |
| 5 to 17 Years | 0 (0.0%) | 0 (0.0%) |
| 18 to 34 Years | 0 (0.0%) | 0 (0.0%) |
| 35 to 64 Years | 14 (2.3%) | 98 (10.6%) |
| 65 to 74 Years | 53 (40.5%) | 0 (0.0%) |
| 75 Years and over | 0 (0.0%) | 28 (28.0%) |
Technology Access in Delmar
Computing Device Access in Delmar
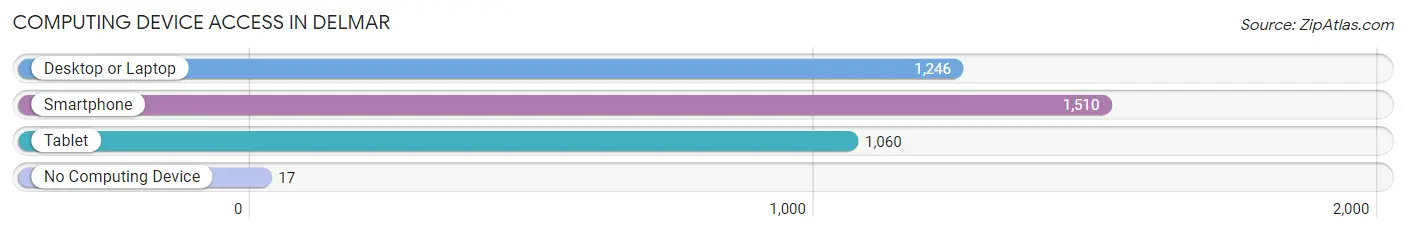
| Device Type | # Households | % Households |
| Desktop or Laptop | 1,246 | 76.5% |
| Smartphone | 1,510 | 92.7% |
| Tablet | 1,060 | 65.1% |
| No Computing Device | 17 | 1.0% |
| Total | 1,628 | 100.0% |
Internet Access in Delmar
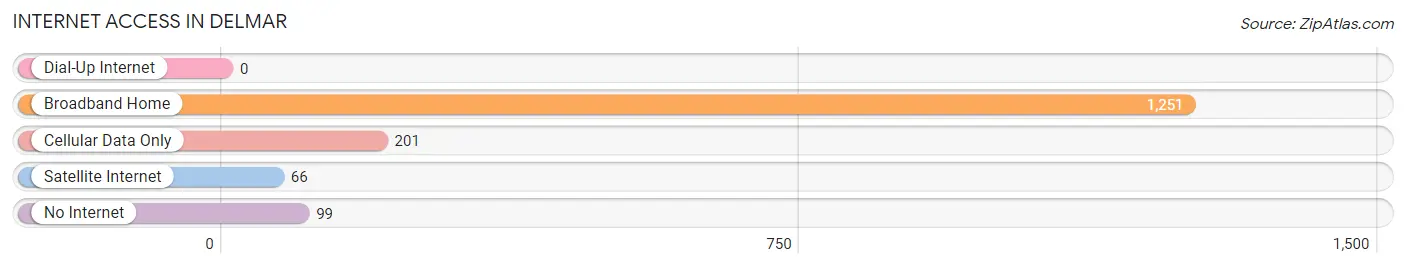
| Internet Type | # Households | % Households |
| Dial-Up Internet | 0 | 0.0% |
| Broadband Home | 1,251 | 76.8% |
| Cellular Data Only | 201 | 12.3% |
| Satellite Internet | 66 | 4.1% |
| No Internet | 99 | 6.1% |
| Total | 1,628 | 100.0% |
Delmar Summary
Delmar, Maryland is a small town located in the eastern part of the state, near the Delaware border. It is part of Wicomico County and is situated between Salisbury and Laurel. The town has a population of approximately 4,000 people and is known for its small-town charm and rural atmosphere.
History
Delmar was founded in 1859 by a group of settlers from Delaware. The town was named after the Delaware-Maryland border, which is known as the “Delmar Line.” The town was originally a farming community, but it soon developed into a small commercial center. In the late 19th century, Delmar was a popular stop for travelers on the Eastern Shore Railroad.
In the early 20th century, Delmar experienced a period of growth and development. The town was incorporated in 1906 and the first mayor was elected in 1908. During this time, the town saw the construction of several new buildings, including a post office, a bank, and a hotel.
Geography
Delmar is located in the eastern part of Maryland, near the Delaware border. It is situated between Salisbury and Laurel, and is part of Wicomico County. The town is located on the Delmarva Peninsula, which is bordered by the Chesapeake Bay to the west and the Atlantic Ocean to the east. The town is situated on the Delmarva Plain, which is a flat, low-lying area.
The climate in Delmar is humid subtropical, with hot, humid summers and mild winters. The average annual temperature is around 60 degrees Fahrenheit. The town receives an average of 45 inches of precipitation per year, with most of it falling in the summer months.
Economy
The economy of Delmar is largely based on agriculture and tourism. The town is home to several farms, which produce a variety of crops, including corn, soybeans, and wheat. The town is also home to several wineries, which produce a variety of wines.
Tourism is an important part of the local economy. The town is home to several attractions, including the Delmarva Discovery Center, the Delmarva Shorebirds baseball team, and the Delmarva Speedway. The town also hosts several festivals throughout the year, including the Delmarva Chicken Festival and the Delmarva Folk Festival.
Demographics
As of the 2010 census, the population of Delmar was 4,039. The racial makeup of the town was 87.3% White, 8.2% African American, 0.7% Native American, 0.7% Asian, 0.1% Pacific Islander, and 2.1% from other races. The median household income was $41,944, and the median family income was $50,944. The per capita income was $20,944.
Delmar is a small town with a rural atmosphere and a strong sense of community. The town is home to several churches, a library, and a variety of small businesses. The town is also home to several parks and recreational areas, including the Delmarva Discovery Center and the Delmarva Speedway.
Common Questions
What is Per Capita Income in Delmar?
Per Capita income in Delmar is $36,360.
What is the Median Family Income in Delmar?
Median Family Income in Delmar is $78,348.
What is the Median Household income in Delmar?
Median Household Income in Delmar is $69,028.
What is Inequality or Gini Index in Delmar?
Inequality or Gini Index in Delmar is 0.44.
What is the Total Population of Delmar?
Total Population of Delmar is 3,897.
What is the Total Male Population of Delmar?
Total Male Population of Delmar is 1,820.
What is the Total Female Population of Delmar?
Total Female Population of Delmar is 2,077.
What is the Ratio of Males per 100 Females in Delmar?
There are 87.63 Males per 100 Females in Delmar.
What is the Ratio of Females per 100 Males in Delmar?
There are 114.12 Females per 100 Males in Delmar.
What is the Median Population Age in Delmar?
Median Population Age in Delmar is 32.1 Years.
What is the Average Family Size in Delmar
Average Family Size in Delmar is 3.0 People.
What is the Average Household Size in Delmar
Average Household Size in Delmar is 2.4 People.
How Large is the Labor Force in Delmar?
There are 2,276 People in the Labor Forcein in Delmar.
What is the Percentage of People in the Labor Force in Delmar?
72.5% of People are in the Labor Force in Delmar.
What is the Unemployment Rate in Delmar?
Unemployment Rate in Delmar is 8.7%.