Jarrettsville, MD Map & Demographics
Jarrettsville Map
Jarrettsville Overview
$59,031
PER CAPITA INCOME
$155,938
AVG FAMILY INCOME
$157,422
AVG HOUSEHOLD INCOME
24.9%
WAGE / INCOME GAP [ % ]
75.1¢/ $1
WAGE / INCOME GAP [ $ ]
0.37
INEQUALITY / GINI INDEX
2,677
TOTAL POPULATION
1,336
MALE POPULATION
1,341
FEMALE POPULATION
99.63
MALES / 100 FEMALES
100.37
FEMALES / 100 MALES
46.6
MEDIAN AGE
3.2
AVG FAMILY SIZE
2.8
AVG HOUSEHOLD SIZE
1,508
LABOR FORCE [ PEOPLE ]
69.1%
PERCENT IN LABOR FORCE
7.6%
UNEMPLOYMENT RATE
Jarrettsville Zip Codes
Income in Jarrettsville
Income Overview in Jarrettsville
Per Capita Income in Jarrettsville is $59,031, while median incomes of families and households are $155,938 and $157,422 respectively.
| Characteristic | Number | Measure |
| Per Capita Income | 2,677 | $59,031 |
| Median Family Income | 750 | $155,938 |
| Mean Family Income | 750 | $169,088 |
| Median Household Income | 973 | $157,422 |
| Mean Household Income | 973 | $160,132 |
| Income Deficit | 750 | $0 |
| Wage / Income Gap (%) | 2,677 | 24.91% |
| Wage / Income Gap ($) | 2,677 | 75.09¢ per $1 |
| Gini / Inequality Index | 2,677 | 0.37 |
Earnings by Sex in Jarrettsville
Average Earnings in Jarrettsville are $75,205, $91,558 for men and $68,750 for women, a difference of 24.9%.
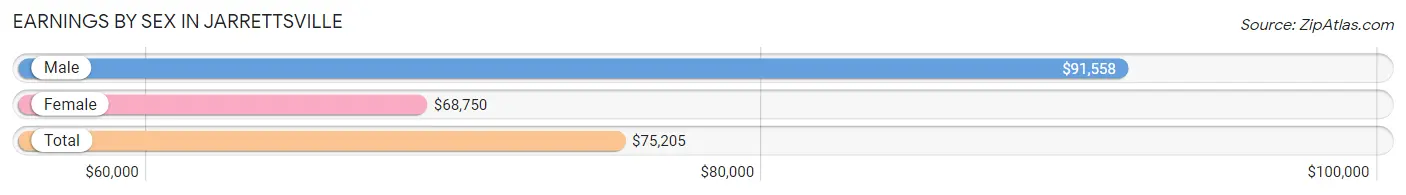
| Sex | Number | Average Earnings |
| Male | 791 (51.6%) | $91,558 |
| Female | 743 (48.4%) | $68,750 |
| Total | 1,534 (100.0%) | $75,205 |
Earnings by Sex by Income Bracket in Jarrettsville
The most common earnings brackets in Jarrettsville are $100,000+ for men (350 | 44.3%) and $75,000 to $99,999 for women (160 | 21.5%).
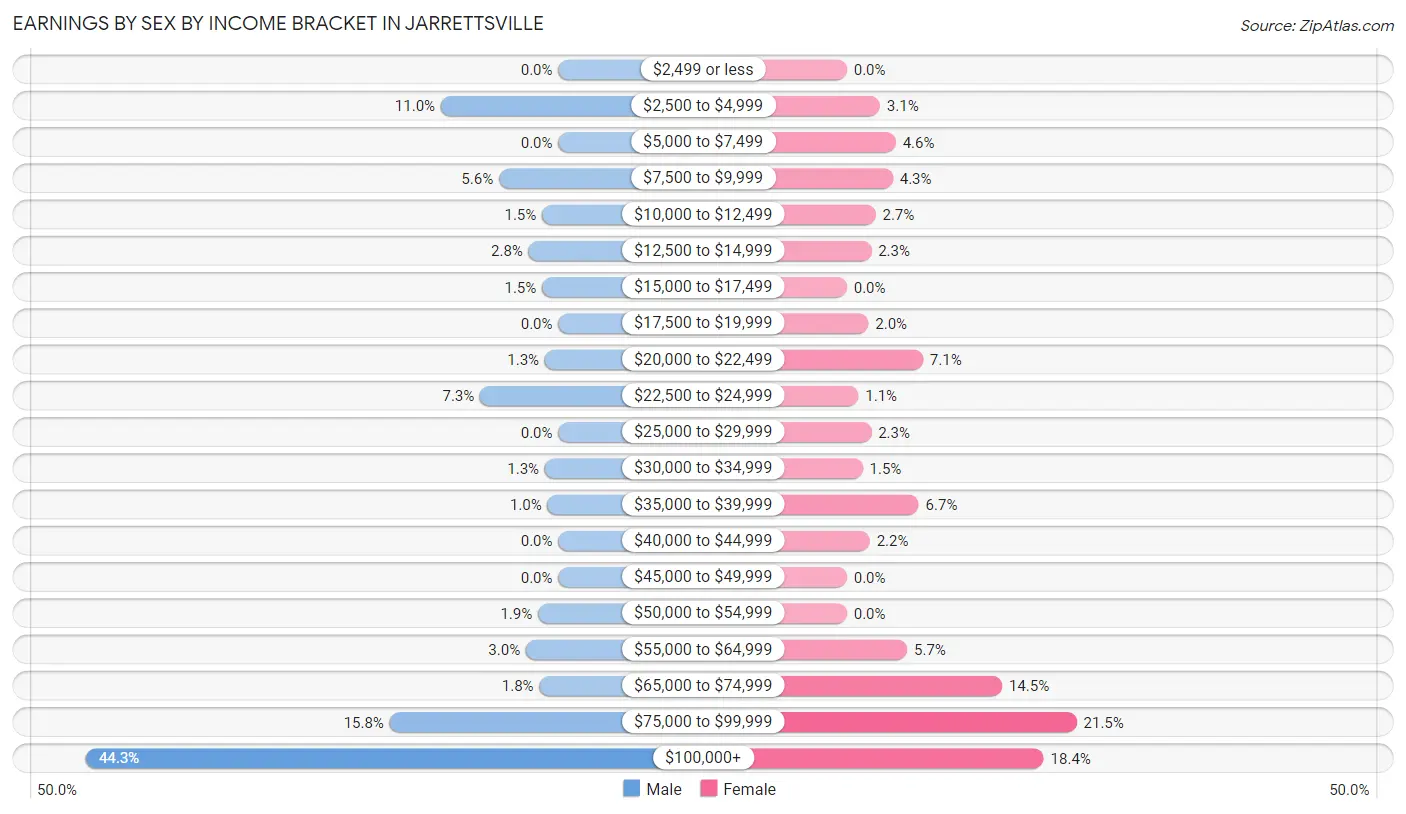
| Income | Male | Female |
| $2,499 or less | 0 (0.0%) | 0 (0.0%) |
| $2,500 to $4,999 | 87 (11.0%) | 23 (3.1%) |
| $5,000 to $7,499 | 0 (0.0%) | 34 (4.6%) |
| $7,500 to $9,999 | 44 (5.6%) | 32 (4.3%) |
| $10,000 to $12,499 | 12 (1.5%) | 20 (2.7%) |
| $12,500 to $14,999 | 22 (2.8%) | 17 (2.3%) |
| $15,000 to $17,499 | 12 (1.5%) | 0 (0.0%) |
| $17,500 to $19,999 | 0 (0.0%) | 15 (2.0%) |
| $20,000 to $22,499 | 10 (1.3%) | 53 (7.1%) |
| $22,500 to $24,999 | 58 (7.3%) | 8 (1.1%) |
| $25,000 to $29,999 | 0 (0.0%) | 17 (2.3%) |
| $30,000 to $34,999 | 10 (1.3%) | 11 (1.5%) |
| $35,000 to $39,999 | 8 (1.0%) | 50 (6.7%) |
| $40,000 to $44,999 | 0 (0.0%) | 16 (2.1%) |
| $45,000 to $49,999 | 0 (0.0%) | 0 (0.0%) |
| $50,000 to $54,999 | 15 (1.9%) | 0 (0.0%) |
| $55,000 to $64,999 | 24 (3.0%) | 42 (5.7%) |
| $65,000 to $74,999 | 14 (1.8%) | 108 (14.5%) |
| $75,000 to $99,999 | 125 (15.8%) | 160 (21.5%) |
| $100,000+ | 350 (44.3%) | 137 (18.4%) |
| Total | 791 (100.0%) | 743 (100.0%) |
Earnings by Sex by Educational Attainment in Jarrettsville
Average earnings in Jarrettsville are $94,861 for men and $70,068 for women, a difference of 26.1%. Men with an educational attainment of graduate degree enjoy the highest average annual earnings of $134,813, while those with bachelor's degree education earn the least with $93,611. Women with an educational attainment of graduate degree earn the most with the average annual earnings of $83,162, while those with college or associate's degree education have the smallest earnings of $75,725.
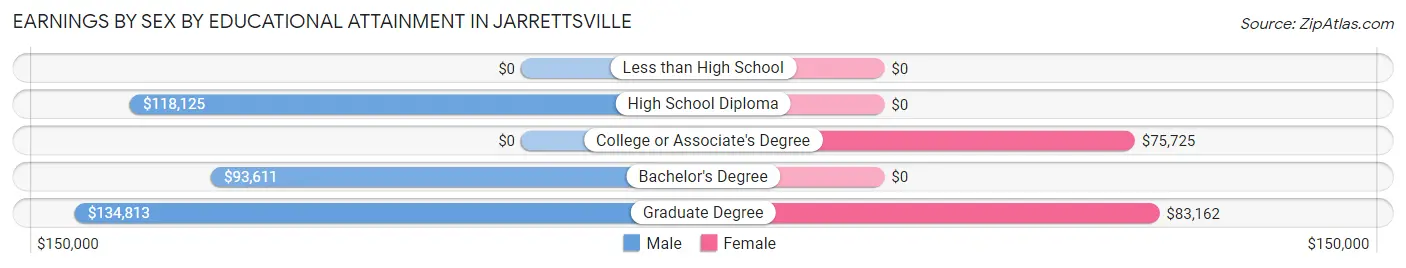
| Educational Attainment | Male Income | Female Income |
| Less than High School | - | - |
| High School Diploma | $118,125 | $0 |
| College or Associate's Degree | - | - |
| Bachelor's Degree | $93,611 | $0 |
| Graduate Degree | $134,813 | $83,162 |
| Total | $94,861 | $70,068 |
Family Income in Jarrettsville
Family Income Brackets in Jarrettsville
According to the Jarrettsville family income data, there are 231 families falling into the $200,000+ income range, which is the most common income bracket and makes up 30.8% of all families.
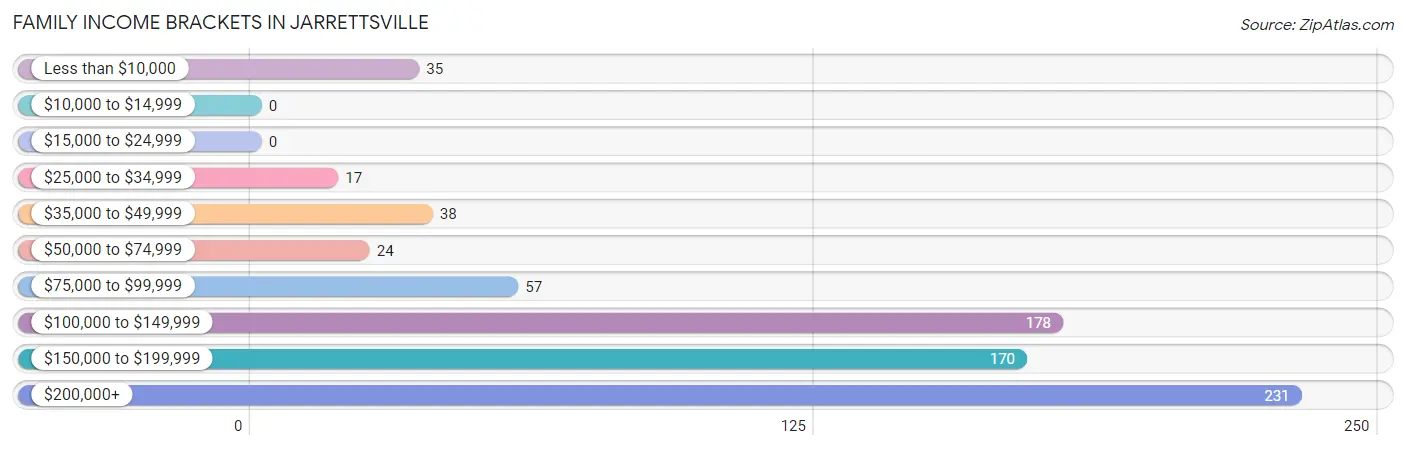
| Income Bracket | # Families | % Families |
| Less than $10,000 | 35 | 4.7% |
| $10,000 to $14,999 | 0 | 0.0% |
| $15,000 to $24,999 | 0 | 0.0% |
| $25,000 to $34,999 | 17 | 2.3% |
| $35,000 to $49,999 | 38 | 5.1% |
| $50,000 to $74,999 | 24 | 3.2% |
| $75,000 to $99,999 | 57 | 7.6% |
| $100,000 to $149,999 | 178 | 23.7% |
| $150,000 to $199,999 | 170 | 22.7% |
| $200,000+ | 231 | 30.8% |
Family Income by Famaliy Size in Jarrettsville
6-person families (44 | 5.9%) account for the highest median family income in Jarrettsville with $250,001 per family, while 3-person families (194 | 25.9%) have the highest median income of $61,569 per family member.
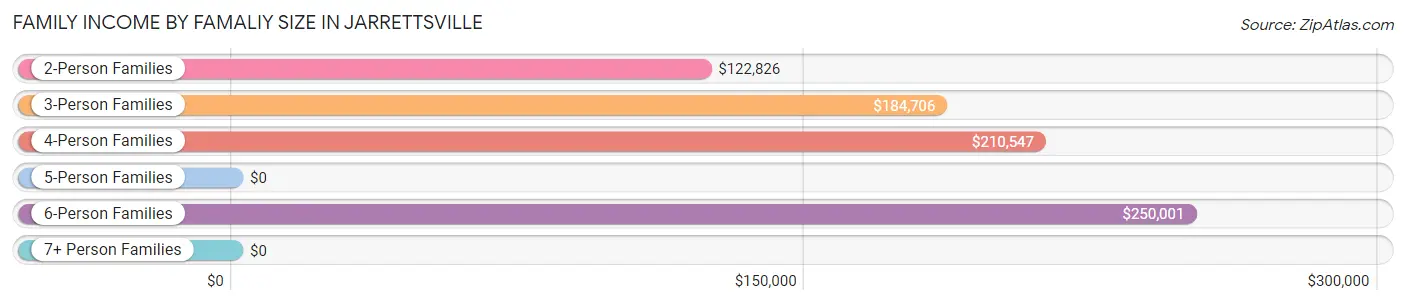
| Income Bracket | # Families | Median Income |
| 2-Person Families | 354 (47.2%) | $122,826 |
| 3-Person Families | 194 (25.9%) | $184,706 |
| 4-Person Families | 67 (8.9%) | $210,547 |
| 5-Person Families | 91 (12.1%) | $0 |
| 6-Person Families | 44 (5.9%) | $250,001 |
| 7+ Person Families | 0 (0.0%) | $0 |
| Total | 750 (100.0%) | $155,938 |
Family Income by Number of Earners in Jarrettsville
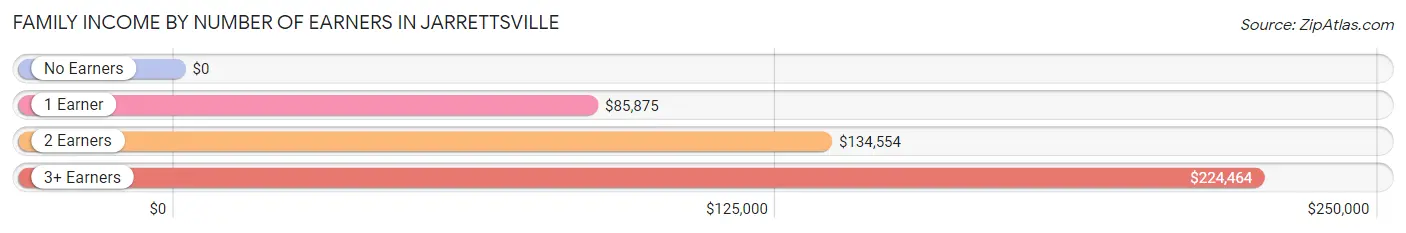
| Number of Earners | # Families | Median Income |
| No Earners | 107 (14.3%) | $0 |
| 1 Earner | 133 (17.7%) | $85,875 |
| 2 Earners | 397 (52.9%) | $134,554 |
| 3+ Earners | 113 (15.1%) | $224,464 |
| Total | 750 (100.0%) | $155,938 |
Household Income in Jarrettsville
Household Income Brackets in Jarrettsville
With 317 households falling in the category, the $200,000+ income range is the most frequent in Jarrettsville, accounting for 32.6% of all households.
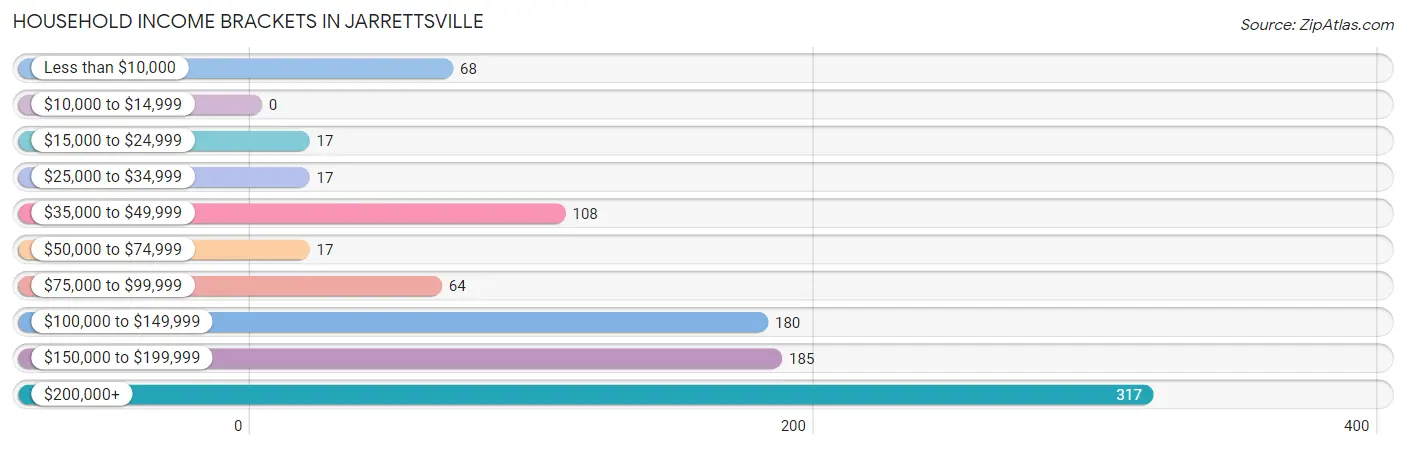
| Income Bracket | # Households | % Households |
| Less than $10,000 | 68 | 7.0% |
| $10,000 to $14,999 | 0 | 0.0% |
| $15,000 to $24,999 | 17 | 1.7% |
| $25,000 to $34,999 | 17 | 1.7% |
| $35,000 to $49,999 | 108 | 11.1% |
| $50,000 to $74,999 | 17 | 1.7% |
| $75,000 to $99,999 | 64 | 6.6% |
| $100,000 to $149,999 | 180 | 18.5% |
| $150,000 to $199,999 | 185 | 19.0% |
| $200,000+ | 317 | 32.6% |
Household Income by Householder Age in Jarrettsville
The median household income in Jarrettsville is $157,422, with the highest median household income of $184,893 found in the 45 to 64 years age bracket for the primary householder. A total of 465 households (47.8%) fall into this category. Meanwhile, the 15 to 24 years age bracket for the primary householder has the lowest median household income of $0, with 23 households (2.4%) in this group.
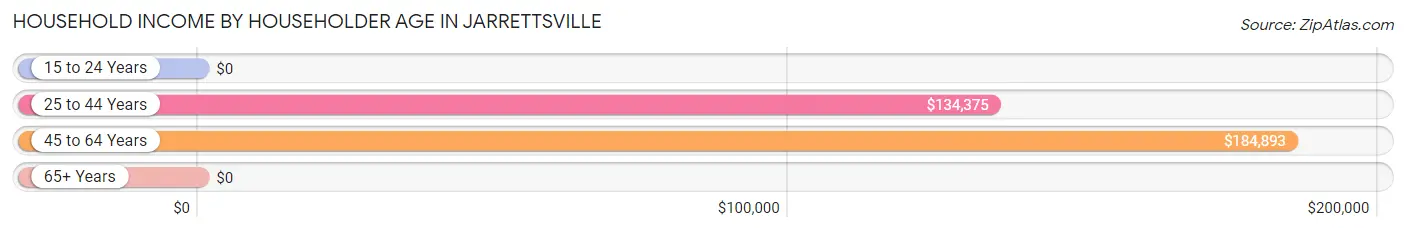
| Income Bracket | # Households | Median Income |
| 15 to 24 Years | 23 (2.4%) | $0 |
| 25 to 44 Years | 223 (22.9%) | $134,375 |
| 45 to 64 Years | 465 (47.8%) | $184,893 |
| 65+ Years | 262 (26.9%) | $0 |
| Total | 973 (100.0%) | $157,422 |
Poverty in Jarrettsville
Income Below Poverty by Sex and Age in Jarrettsville
With 6.3% poverty level for males and 5.1% for females among the residents of Jarrettsville, 35 to 44 year old males and 55 to 64 year old females are the most vulnerable to poverty, with 44 males (25.7%) and 68 females (27.0%) in their respective age groups living below the poverty level.
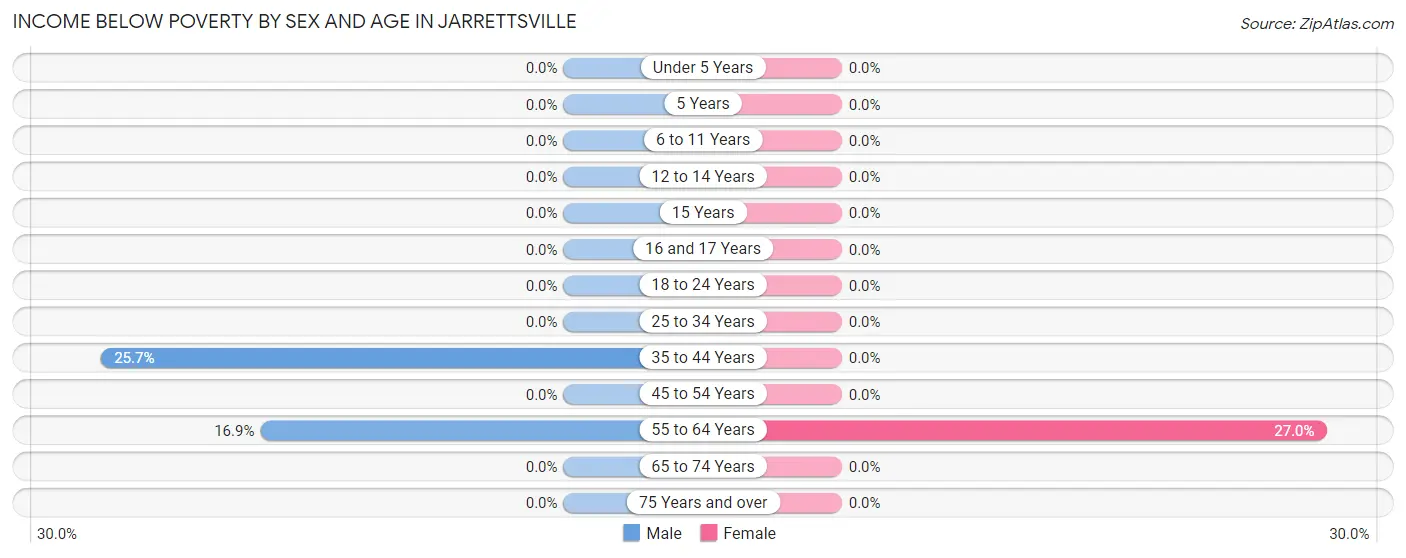
| Age Bracket | Male | Female |
| Under 5 Years | 0 (0.0%) | 0 (0.0%) |
| 5 Years | 0 (0.0%) | 0 (0.0%) |
| 6 to 11 Years | 0 (0.0%) | 0 (0.0%) |
| 12 to 14 Years | 0 (0.0%) | 0 (0.0%) |
| 15 Years | 0 (0.0%) | 0 (0.0%) |
| 16 and 17 Years | 0 (0.0%) | 0 (0.0%) |
| 18 to 24 Years | 0 (0.0%) | 0 (0.0%) |
| 25 to 34 Years | 0 (0.0%) | 0 (0.0%) |
| 35 to 44 Years | 44 (25.7%) | 0 (0.0%) |
| 45 to 54 Years | 0 (0.0%) | 0 (0.0%) |
| 55 to 64 Years | 40 (16.9%) | 68 (27.0%) |
| 65 to 74 Years | 0 (0.0%) | 0 (0.0%) |
| 75 Years and over | 0 (0.0%) | 0 (0.0%) |
| Total | 84 (6.3%) | 68 (5.1%) |
Income Above Poverty by Sex and Age in Jarrettsville
According to the poverty statistics in Jarrettsville, males aged under 5 years and females aged under 5 years are the age groups that are most secure financially, with 100.0% of males and 100.0% of females in these age groups living above the poverty line.
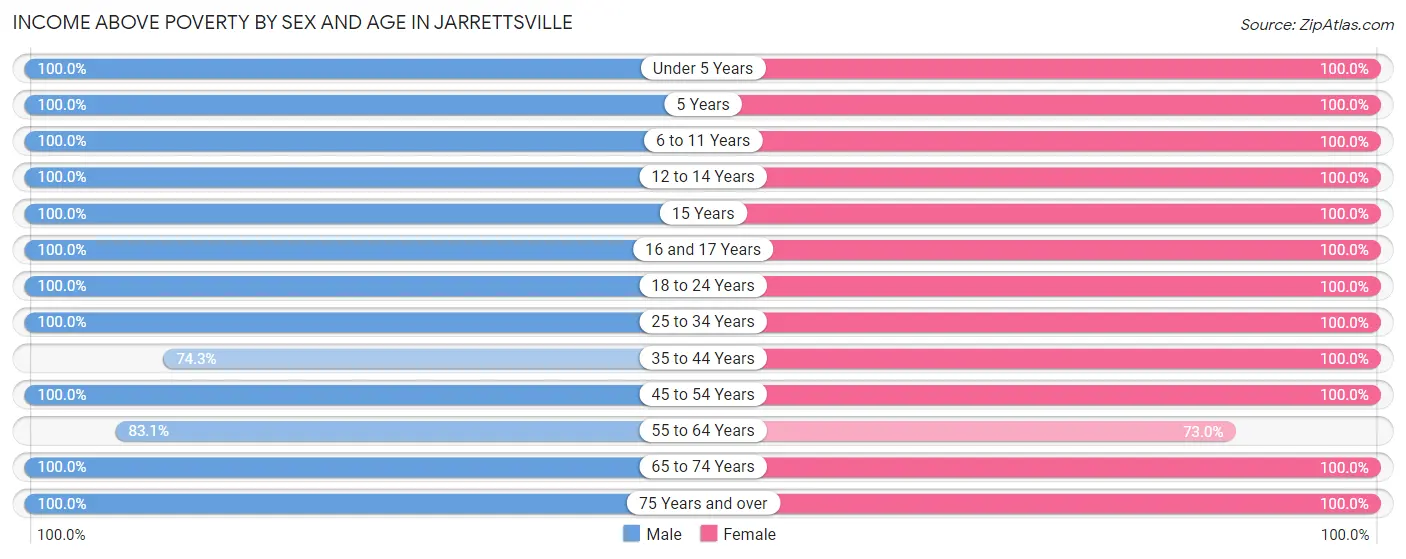
| Age Bracket | Male | Female |
| Under 5 Years | 56 (100.0%) | 33 (100.0%) |
| 5 Years | 15 (100.0%) | 56 (100.0%) |
| 6 to 11 Years | 116 (100.0%) | 65 (100.0%) |
| 12 to 14 Years | 9 (100.0%) | 59 (100.0%) |
| 15 Years | 61 (100.0%) | 24 (100.0%) |
| 16 and 17 Years | 23 (100.0%) | 12 (100.0%) |
| 18 to 24 Years | 109 (100.0%) | 112 (100.0%) |
| 25 to 34 Years | 148 (100.0%) | 87 (100.0%) |
| 35 to 44 Years | 127 (74.3%) | 164 (100.0%) |
| 45 to 54 Years | 205 (100.0%) | 194 (100.0%) |
| 55 to 64 Years | 197 (83.1%) | 184 (73.0%) |
| 65 to 74 Years | 122 (100.0%) | 113 (100.0%) |
| 75 Years and over | 64 (100.0%) | 165 (100.0%) |
| Total | 1,252 (93.7%) | 1,268 (94.9%) |
Income Below Poverty Among Married-Couple Families in Jarrettsville
The poverty statistics for married-couple families in Jarrettsville show that 5.0% or 35 of the total 696 families live below the poverty line. Families with no children have the highest poverty rate of 7.5%, comprising of 35 families. On the other hand, families with 1 or 2 children have the lowest poverty rate of 0.0%, which includes 0 families.
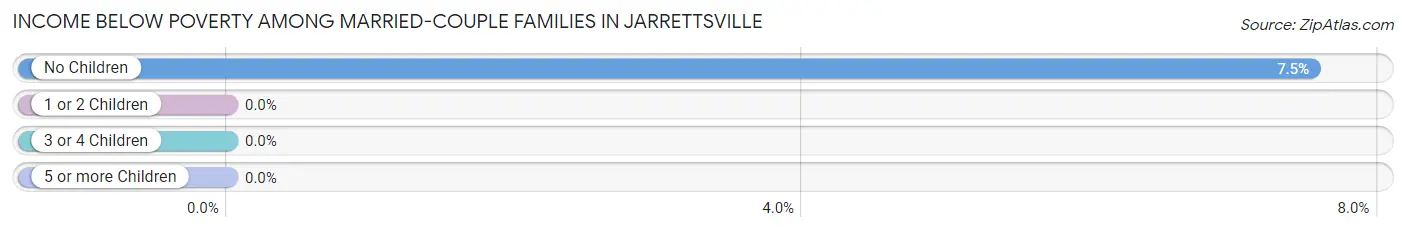
| Children | Above Poverty | Below Poverty |
| No Children | 429 (92.5%) | 35 (7.5%) |
| 1 or 2 Children | 137 (100.0%) | 0 (0.0%) |
| 3 or 4 Children | 95 (100.0%) | 0 (0.0%) |
| 5 or more Children | 0 (0.0%) | 0 (0.0%) |
| Total | 661 (95.0%) | 35 (5.0%) |
Income Below Poverty Among Single-Parent Households in Jarrettsville
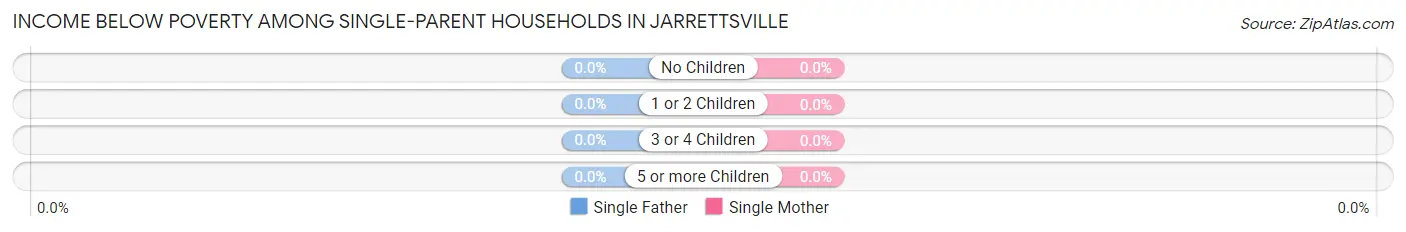
| Children | Single Father | Single Mother |
| No Children | 0 (0.0%) | 0 (0.0%) |
| 1 or 2 Children | 0 (0.0%) | 0 (0.0%) |
| 3 or 4 Children | 0 (0.0%) | 0 (0.0%) |
| 5 or more Children | 0 (0.0%) | 0 (0.0%) |
| Total | 0 (0.0%) | 0 (0.0%) |
Income Below Poverty Among Married-Couple vs Single-Parent Households in Jarrettsville
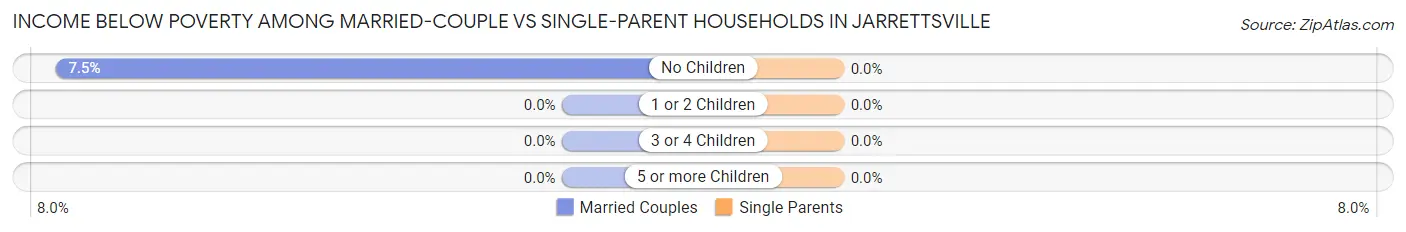
| Children | Married-Couple Families | Single-Parent Households |
| No Children | 35 (7.5%) | 0 (0.0%) |
| 1 or 2 Children | 0 (0.0%) | 0 (0.0%) |
| 3 or 4 Children | 0 (0.0%) | 0 (0.0%) |
| 5 or more Children | 0 (0.0%) | 0 (0.0%) |
| Total | 35 (5.0%) | 0 (0.0%) |
Race in Jarrettsville
The most populous races in Jarrettsville are White / Caucasian (2,485 | 92.8%), Two or more Races (98 | 3.7%), and Black / African American (53 | 2.0%).
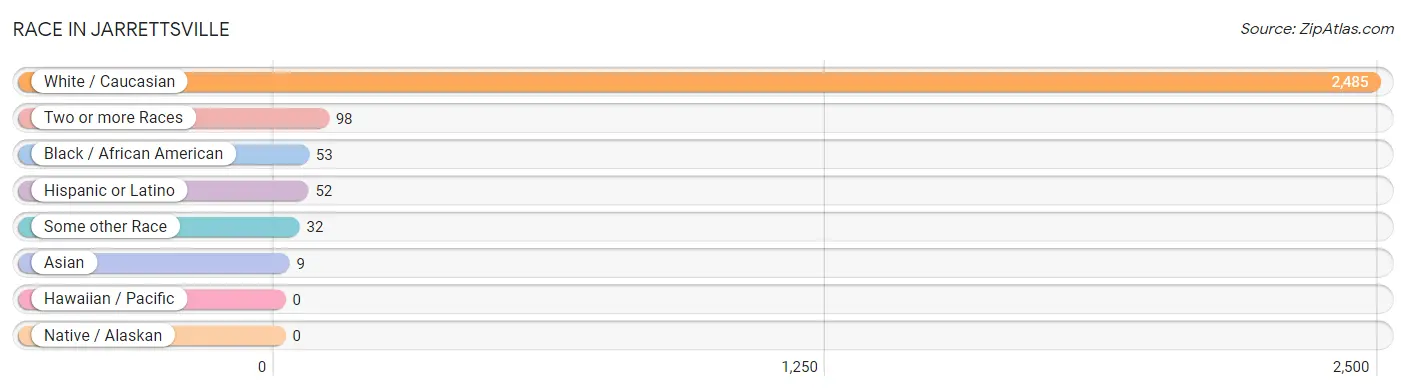
| Race | # Population | % Population |
| Asian | 9 | 0.3% |
| Black / African American | 53 | 2.0% |
| Hawaiian / Pacific | 0 | 0.0% |
| Hispanic or Latino | 52 | 1.9% |
| Native / Alaskan | 0 | 0.0% |
| White / Caucasian | 2,485 | 92.8% |
| Two or more Races | 98 | 3.7% |
| Some other Race | 32 | 1.2% |
| Total | 2,677 | 100.0% |
Ancestry in Jarrettsville
The most populous ancestries reported in Jarrettsville are German (809 | 30.2%), Polish (528 | 19.7%), English (396 | 14.8%), Italian (386 | 14.4%), and Irish (297 | 11.1%), together accounting for 90.2% of all Jarrettsville residents.
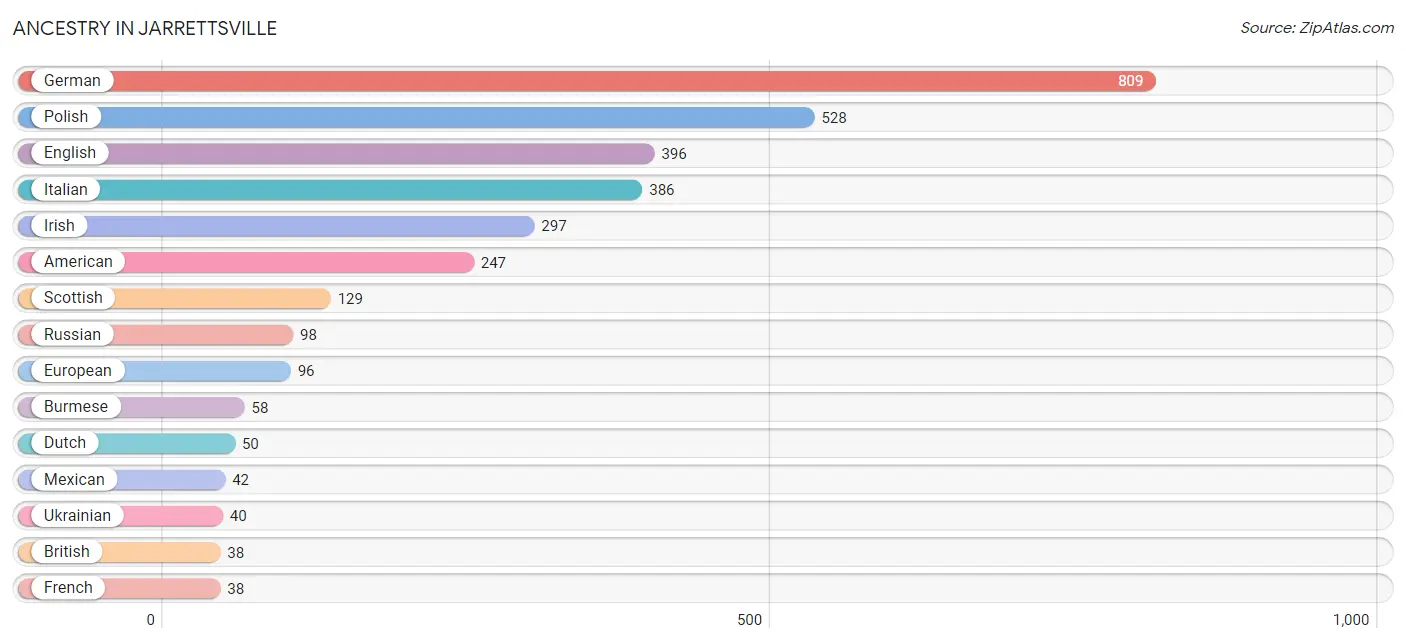
| Ancestry | # Population | % Population |
| American | 247 | 9.2% |
| British | 38 | 1.4% |
| Burmese | 58 | 2.2% |
| Czech | 33 | 1.2% |
| Dominican | 10 | 0.4% |
| Dutch | 50 | 1.9% |
| Eastern European | 11 | 0.4% |
| English | 396 | 14.8% |
| European | 96 | 3.6% |
| French | 38 | 1.4% |
| German | 809 | 30.2% |
| Greek | 15 | 0.6% |
| Hungarian | 19 | 0.7% |
| Indian (Asian) | 9 | 0.3% |
| Irish | 297 | 11.1% |
| Italian | 386 | 14.4% |
| Mexican | 42 | 1.6% |
| Norwegian | 28 | 1.1% |
| Polish | 528 | 19.7% |
| Russian | 98 | 3.7% |
| Scotch-Irish | 36 | 1.3% |
| Scottish | 129 | 4.8% |
| Swedish | 33 | 1.2% |
| Ukrainian | 40 | 1.5% |
| Welsh | 37 | 1.4% | View All 25 Rows |
Immigrants in Jarrettsville
The most numerous immigrant groups reported in Jarrettsville came from Europe (30 | 1.1%), Northern Europe (30 | 1.1%), Latin America (29 | 1.1%), Central America (20 | 0.7%), and Mexico (20 | 0.7%), together accounting for 4.8% of all Jarrettsville residents.
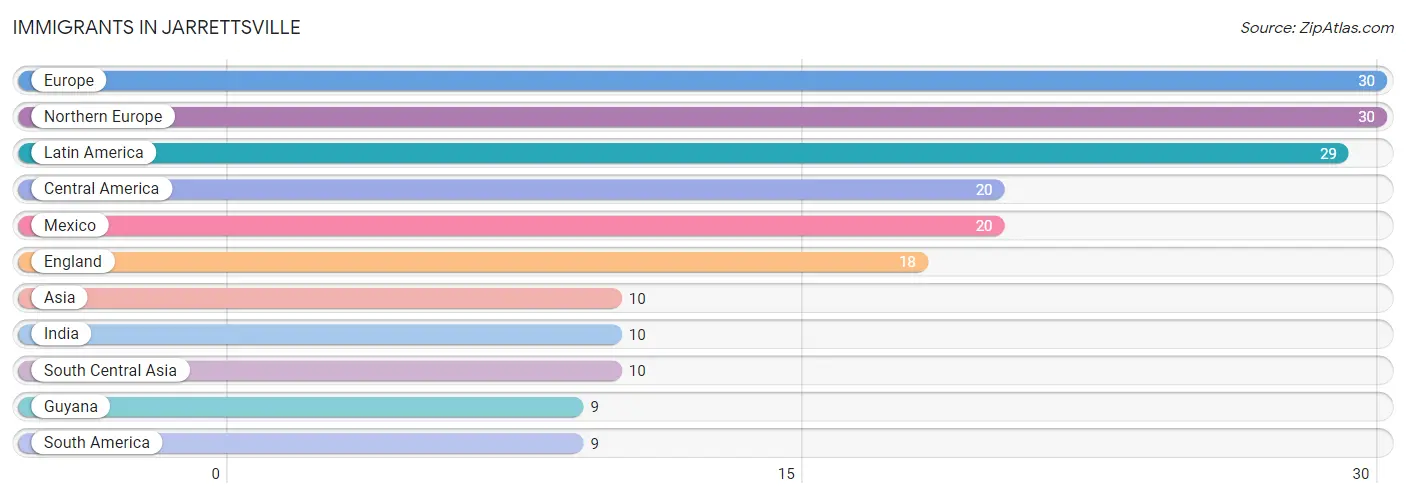
| Immigration Origin | # Population | % Population |
| Asia | 10 | 0.4% |
| Central America | 20 | 0.7% |
| England | 18 | 0.7% |
| Europe | 30 | 1.1% |
| Guyana | 9 | 0.3% |
| India | 10 | 0.4% |
| Latin America | 29 | 1.1% |
| Mexico | 20 | 0.7% |
| Northern Europe | 30 | 1.1% |
| South America | 9 | 0.3% |
| South Central Asia | 10 | 0.4% | View All 11 Rows |
Sex and Age in Jarrettsville
Sex and Age in Jarrettsville
The most populous age groups in Jarrettsville are 55 to 59 Years (159 | 11.9%) for men and 50 to 54 Years (178 | 13.3%) for women.
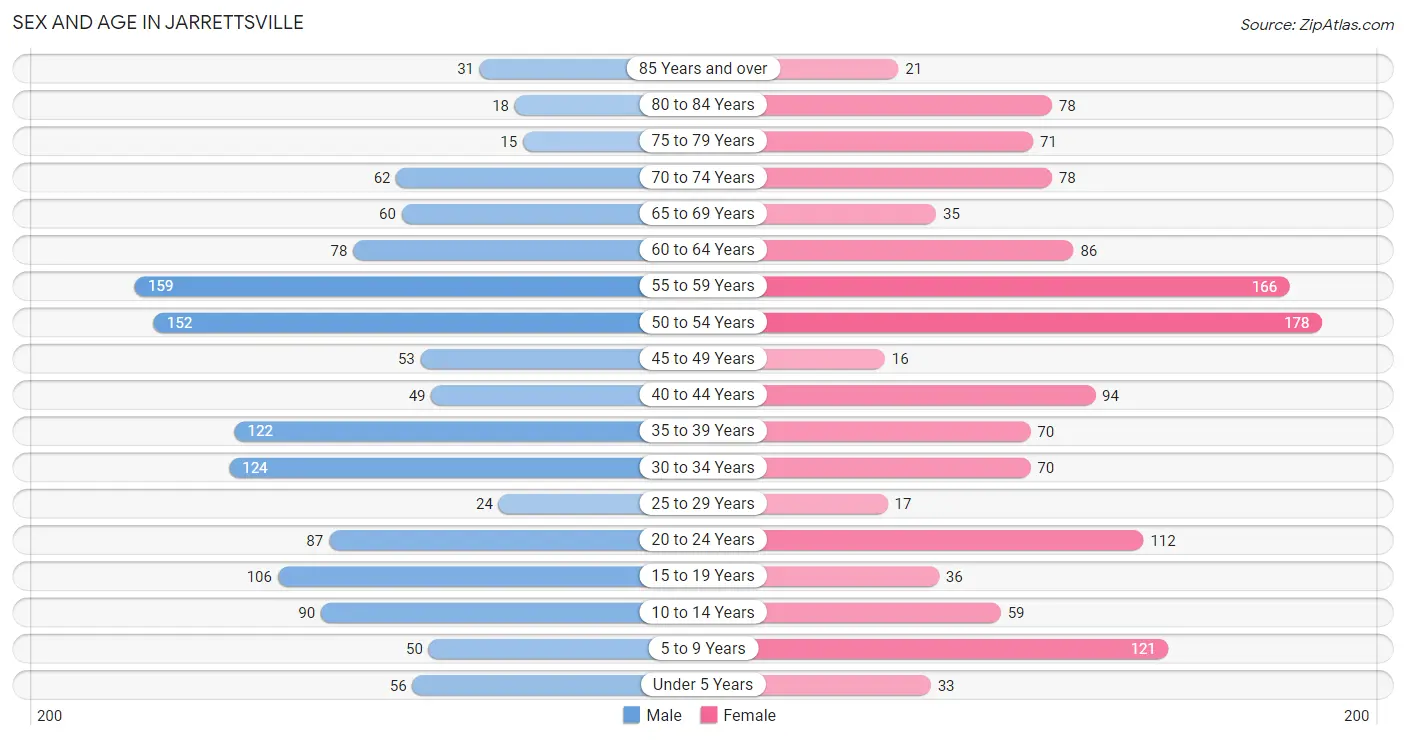
| Age Bracket | Male | Female |
| Under 5 Years | 56 (4.2%) | 33 (2.5%) |
| 5 to 9 Years | 50 (3.7%) | 121 (9.0%) |
| 10 to 14 Years | 90 (6.7%) | 59 (4.4%) |
| 15 to 19 Years | 106 (7.9%) | 36 (2.7%) |
| 20 to 24 Years | 87 (6.5%) | 112 (8.4%) |
| 25 to 29 Years | 24 (1.8%) | 17 (1.3%) |
| 30 to 34 Years | 124 (9.3%) | 70 (5.2%) |
| 35 to 39 Years | 122 (9.1%) | 70 (5.2%) |
| 40 to 44 Years | 49 (3.7%) | 94 (7.0%) |
| 45 to 49 Years | 53 (4.0%) | 16 (1.2%) |
| 50 to 54 Years | 152 (11.4%) | 178 (13.3%) |
| 55 to 59 Years | 159 (11.9%) | 166 (12.4%) |
| 60 to 64 Years | 78 (5.8%) | 86 (6.4%) |
| 65 to 69 Years | 60 (4.5%) | 35 (2.6%) |
| 70 to 74 Years | 62 (4.6%) | 78 (5.8%) |
| 75 to 79 Years | 15 (1.1%) | 71 (5.3%) |
| 80 to 84 Years | 18 (1.3%) | 78 (5.8%) |
| 85 Years and over | 31 (2.3%) | 21 (1.6%) |
| Total | 1,336 (100.0%) | 1,341 (100.0%) |
Families and Households in Jarrettsville
Median Family Size in Jarrettsville
The median family size in Jarrettsville is 3.19 persons per family, with married-couple families (696 | 92.8%) accounting for the largest median family size of 3.27 persons per family. On the other hand, single female/mother families (16 | 2.1%) represent the smallest median family size with 2.00 persons per family.
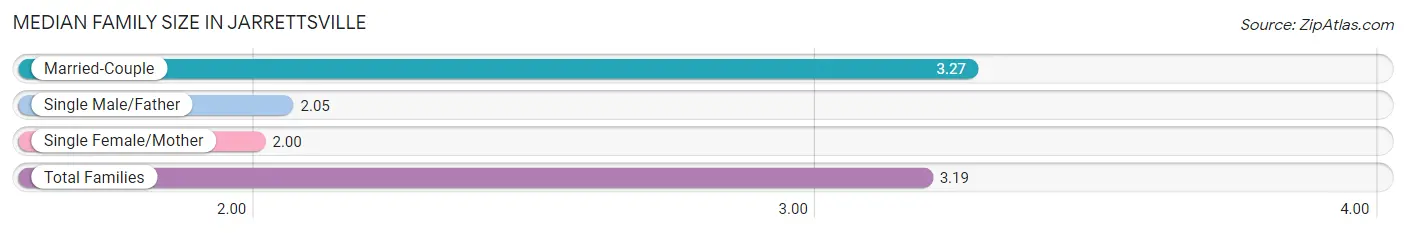
| Family Type | # Families | Family Size |
| Married-Couple | 696 (92.8%) | 3.27 |
| Single Male/Father | 38 (5.1%) | 2.05 |
| Single Female/Mother | 16 (2.1%) | 2.00 |
| Total Families | 750 (100.0%) | 3.19 |
Median Household Size in Jarrettsville
The median household size in Jarrettsville is 2.75 persons per household, with married-couple households (696 | 71.5%) accounting for the largest median household size of 3.29 persons per household. non-family households (223 | 22.9%) represent the smallest median household size with 1.07 persons per household.
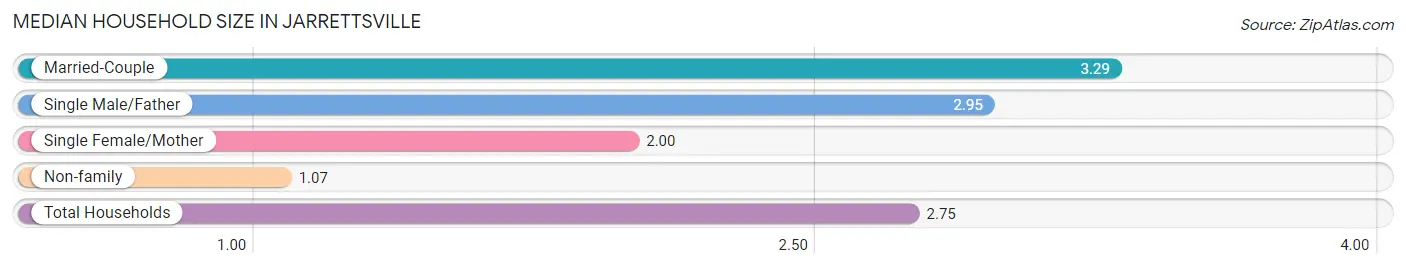
| Household Type | # Households | Household Size |
| Married-Couple | 696 (71.5%) | 3.29 |
| Single Male/Father | 38 (3.9%) | 2.95 |
| Single Female/Mother | 16 (1.6%) | 2.00 |
| Non-family | 223 (22.9%) | 1.07 |
| Total Households | 973 (100.0%) | 2.75 |
Household Size by Marriage Status in Jarrettsville
Out of a total of 973 households in Jarrettsville, 750 (77.1%) are family households, while 223 (22.9%) are nonfamily households. The most numerous type of family households are 2-person households, comprising 316, and the most common type of nonfamily households are 1-person households, comprising 206.
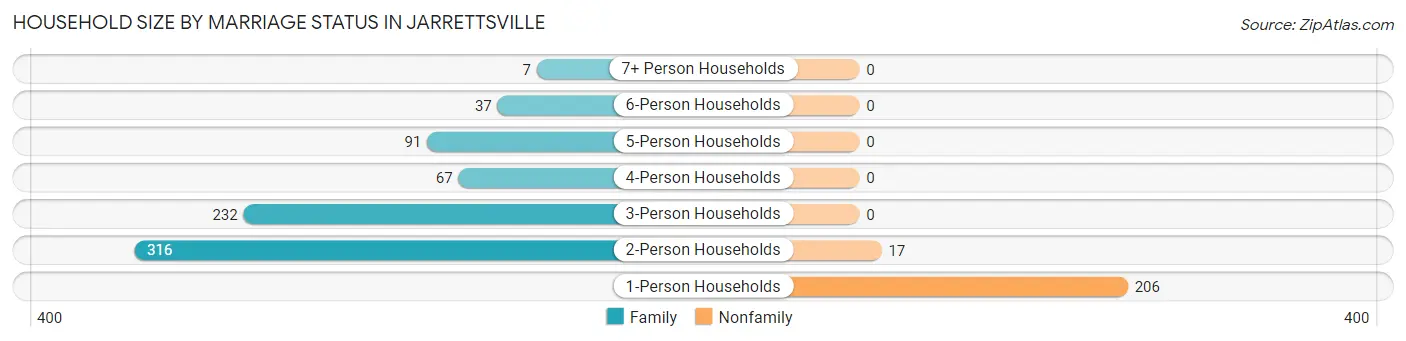
| Household Size | Family Households | Nonfamily Households |
| 1-Person Households | - | 206 (21.2%) |
| 2-Person Households | 316 (32.5%) | 17 (1.8%) |
| 3-Person Households | 232 (23.8%) | 0 (0.0%) |
| 4-Person Households | 67 (6.9%) | 0 (0.0%) |
| 5-Person Households | 91 (9.3%) | 0 (0.0%) |
| 6-Person Households | 37 (3.8%) | 0 (0.0%) |
| 7+ Person Households | 7 (0.7%) | 0 (0.0%) |
| Total | 750 (77.1%) | 223 (22.9%) |
Female Fertility in Jarrettsville
Fertility by Age in Jarrettsville
Average fertility rate in Jarrettsville is 70.0 births per 1,000 women. Women in the age bracket of 20 to 34 years have the highest fertility rate with 80.0 births per 1,000 women. Women in the age bracket of 20 to 34 years acount for 51.6% of all women with births.
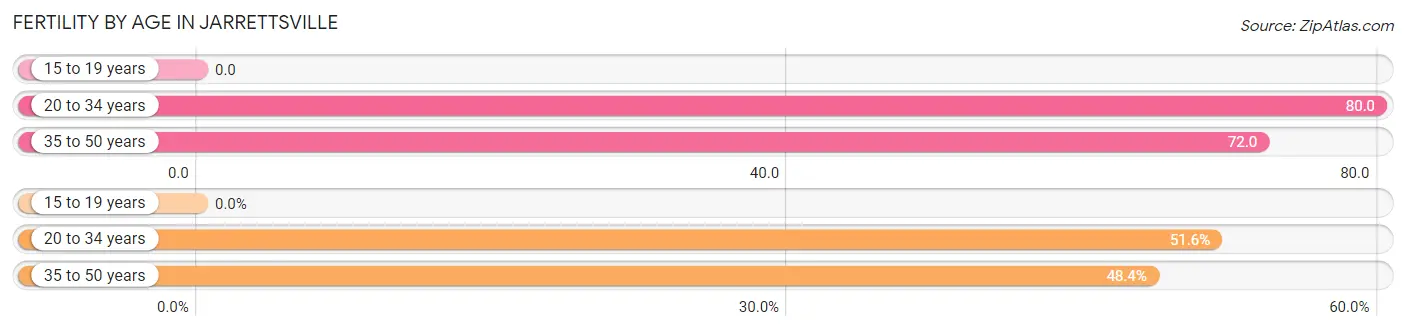
| Age Bracket | Women with Births | Births / 1,000 Women |
| 15 to 19 years | 0 (0.0%) | 0.0 |
| 20 to 34 years | 16 (51.6%) | 80.0 |
| 35 to 50 years | 15 (48.4%) | 72.0 |
| Total | 31 (100.0%) | 70.0 |
Fertility by Age by Marriage Status in Jarrettsville
74.2% of women with births (31) in Jarrettsville are married. The highest percentage of unmarried women with births falls into 35 to 50 years age bracket with 53.3% of them unmarried at the time of birth, while the lowest percentage of unmarried women with births belong to 20 to 34 years age bracket with 0.0% of them unmarried.
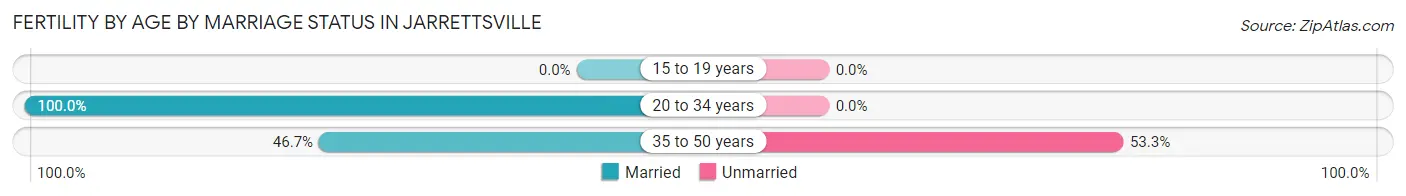
| Age Bracket | Married | Unmarried |
| 15 to 19 years | 0 (0.0%) | 0 (0.0%) |
| 20 to 34 years | 16 (100.0%) | 0 (0.0%) |
| 35 to 50 years | 7 (46.7%) | 8 (53.3%) |
| Total | 23 (74.2%) | 8 (25.8%) |
Fertility by Education in Jarrettsville
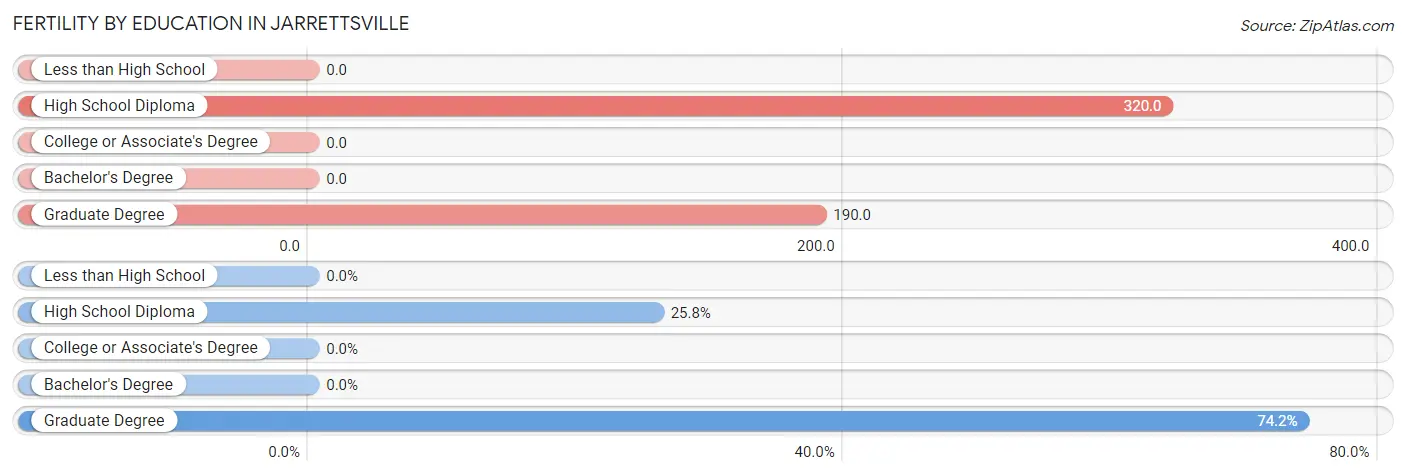
| Educational Attainment | Women with Births | Births / 1,000 Women |
| Less than High School | 0 (0.0%) | 0.0 |
| High School Diploma | 8 (25.8%) | 320.0 |
| College or Associate's Degree | 0 (0.0%) | 0.0 |
| Bachelor's Degree | 0 (0.0%) | 0.0 |
| Graduate Degree | 23 (74.2%) | 190.0 |
| Total | 31 (100.0%) | 70.0 |
Fertility by Education by Marriage Status in Jarrettsville
25.8% of women with births in Jarrettsville are unmarried. Women with the educational attainment of graduate degree are most likely to be married with 100.0% of them married at childbirth, while women with the educational attainment of high school diploma are least likely to be married with 100.0% of them unmarried at childbirth.
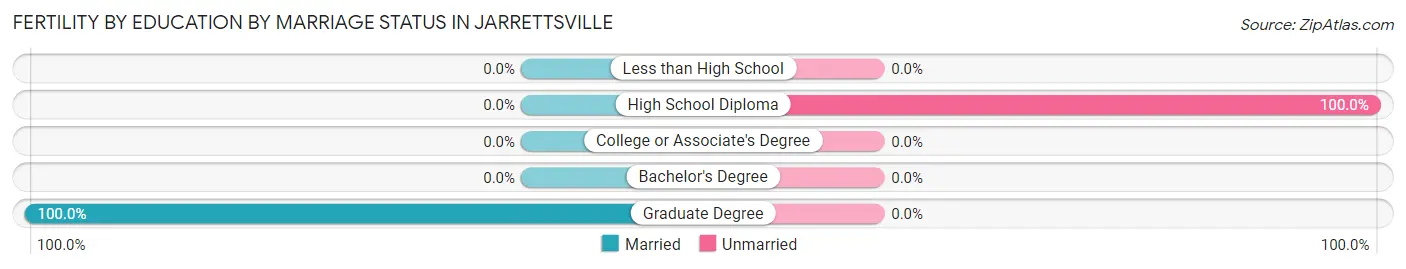
| Educational Attainment | Married | Unmarried |
| Less than High School | 0 (0.0%) | 0 (0.0%) |
| High School Diploma | 0 (0.0%) | 8 (100.0%) |
| College or Associate's Degree | 0 (0.0%) | 0 (0.0%) |
| Bachelor's Degree | 0 (0.0%) | 0 (0.0%) |
| Graduate Degree | 23 (100.0%) | 0 (0.0%) |
| Total | 23 (74.2%) | 8 (25.8%) |
Employment Characteristics in Jarrettsville
Employment by Class of Employer in Jarrettsville
Among the 1,387 employed individuals in Jarrettsville, private company employees (923 | 66.5%), state government employees (125 | 9.0%), and local government employees (108 | 7.8%) make up the most common classes of employment.
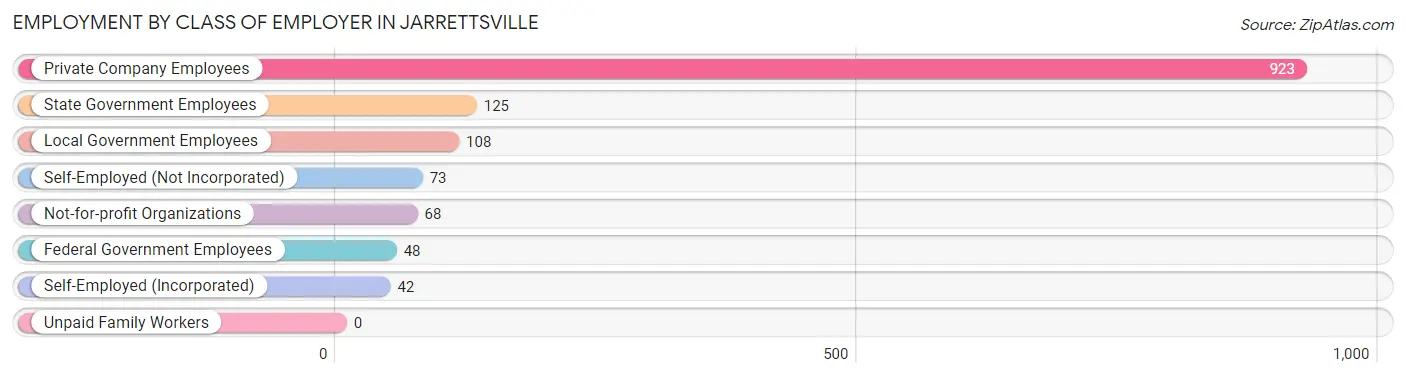
| Employer Class | # Employees | % Employees |
| Private Company Employees | 923 | 66.5% |
| Self-Employed (Incorporated) | 42 | 3.0% |
| Self-Employed (Not Incorporated) | 73 | 5.3% |
| Not-for-profit Organizations | 68 | 4.9% |
| Local Government Employees | 108 | 7.8% |
| State Government Employees | 125 | 9.0% |
| Federal Government Employees | 48 | 3.5% |
| Unpaid Family Workers | 0 | 0.0% |
| Total | 1,387 | 100.0% |
Employment Status by Age in Jarrettsville
According to the labor force statistics for Jarrettsville, out of the total population over 16 years of age (2,183), 69.1% or 1,508 individuals are in the labor force, with 7.6% or 115 of them unemployed. The age group with the highest labor force participation rate is 25 to 29 years, with 100.0% or 41 individuals in the labor force. Within the labor force, the 16 to 19 years age range has the highest percentage of unemployed individuals, with 35.3% or 12 of them being unemployed.
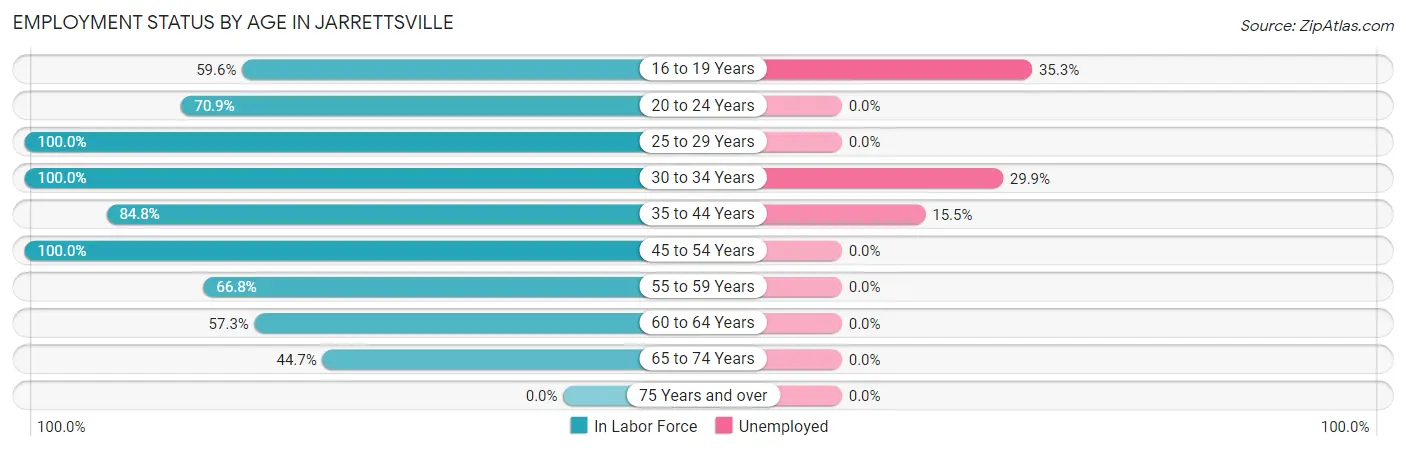
| Age Bracket | In Labor Force | Unemployed |
| 16 to 19 Years | 34 (59.6%) | 12 (35.3%) |
| 20 to 24 Years | 141 (70.9%) | 0 (0.0%) |
| 25 to 29 Years | 41 (100.0%) | 0 (0.0%) |
| 30 to 34 Years | 194 (100.0%) | 58 (29.9%) |
| 35 to 44 Years | 284 (84.8%) | 44 (15.5%) |
| 45 to 54 Years | 399 (100.0%) | 0 (0.0%) |
| 55 to 59 Years | 217 (66.8%) | 0 (0.0%) |
| 60 to 64 Years | 94 (57.3%) | 0 (0.0%) |
| 65 to 74 Years | 105 (44.7%) | 0 (0.0%) |
| 75 Years and over | 0 (0.0%) | 0 (0.0%) |
| Total | 1,508 (69.1%) | 115 (7.6%) |
Employment Status by Educational Attainment in Jarrettsville
According to labor force statistics for Jarrettsville, 84.3% of individuals (1,229) out of the total population between 25 and 64 years of age (1,458) are in the labor force, with 8.3% or 102 of them being unemployed. The group with the highest labor force participation rate are those with the educational attainment of college / associate degree, with 98.5% or 450 individuals in the labor force. Within the labor force, individuals with college / associate degree education have the highest percentage of unemployment, with 22.7% or 102 of them being unemployed.
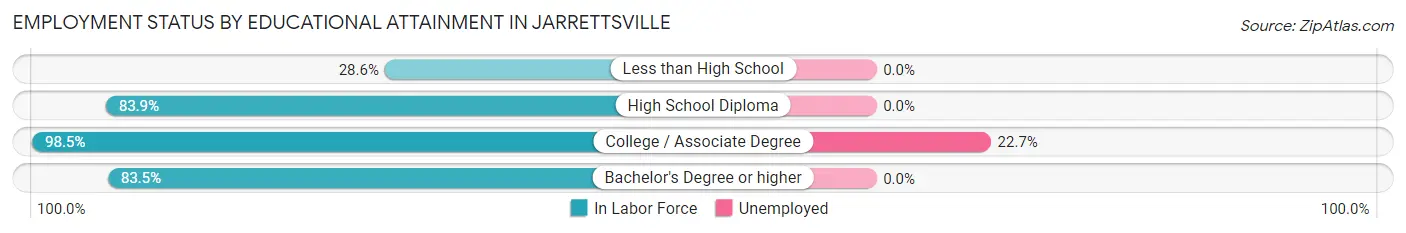
| Educational Attainment | In Labor Force | Unemployed |
| Less than High School | 30 (28.6%) | 0 (0.0%) |
| High School Diploma | 172 (83.9%) | 0 (0.0%) |
| College / Associate Degree | 450 (98.5%) | 104 (22.7%) |
| Bachelor's Degree or higher | 577 (83.5%) | 0 (0.0%) |
| Total | 1,229 (84.3%) | 121 (8.3%) |
Employment Occupations by Sex in Jarrettsville
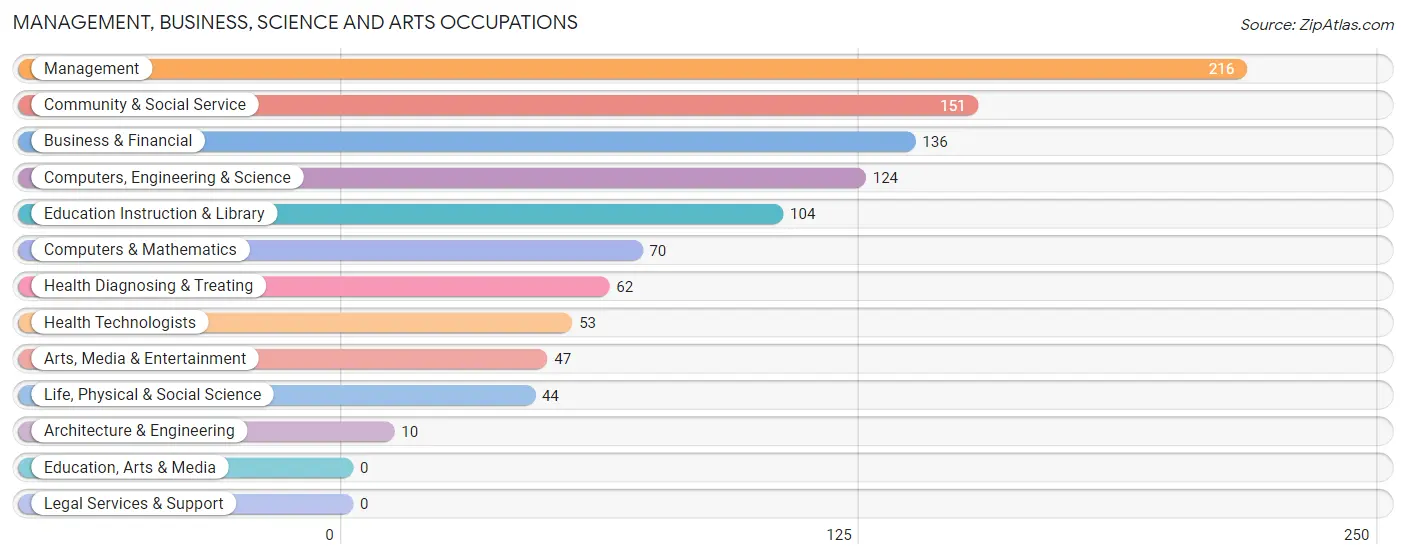
Management, Business, Science and Arts Occupations
The most common Management, Business, Science and Arts occupations in Jarrettsville are Management (216 | 15.5%), Community & Social Service (151 | 10.8%), Business & Financial (136 | 9.8%), Computers, Engineering & Science (124 | 8.9%), and Education Instruction & Library (104 | 7.5%).
Management, Business, Science and Arts Occupations by Sex
Within the Management, Business, Science and Arts occupations in Jarrettsville, the most male-oriented occupations are Computers & Mathematics (75.7%), Management (73.2%), and Computers, Engineering & Science (66.1%), while the most female-oriented occupations are Architecture & Engineering (100.0%), Health Diagnosing & Treating (100.0%), and Health Technologists (100.0%).
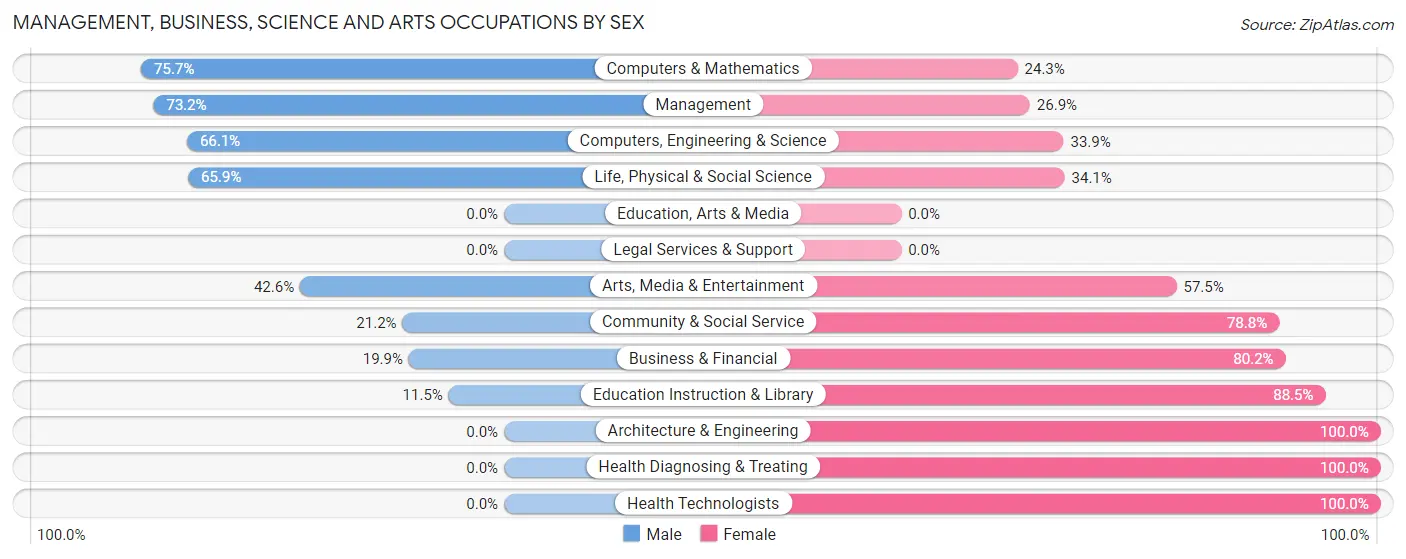
| Occupation | Male | Female |
| Management | 158 (73.2%) | 58 (26.9%) |
| Business & Financial | 27 (19.9%) | 109 (80.1%) |
| Computers, Engineering & Science | 82 (66.1%) | 42 (33.9%) |
| Computers & Mathematics | 53 (75.7%) | 17 (24.3%) |
| Architecture & Engineering | 0 (0.0%) | 10 (100.0%) |
| Life, Physical & Social Science | 29 (65.9%) | 15 (34.1%) |
| Community & Social Service | 32 (21.2%) | 119 (78.8%) |
| Education, Arts & Media | 0 (0.0%) | 0 (0.0%) |
| Legal Services & Support | 0 (0.0%) | 0 (0.0%) |
| Education Instruction & Library | 12 (11.5%) | 92 (88.5%) |
| Arts, Media & Entertainment | 20 (42.5%) | 27 (57.5%) |
| Health Diagnosing & Treating | 0 (0.0%) | 62 (100.0%) |
| Health Technologists | 0 (0.0%) | 53 (100.0%) |
| Total (Category) | 299 (43.4%) | 390 (56.6%) |
| Total (Overall) | 671 (48.1%) | 724 (51.9%) |
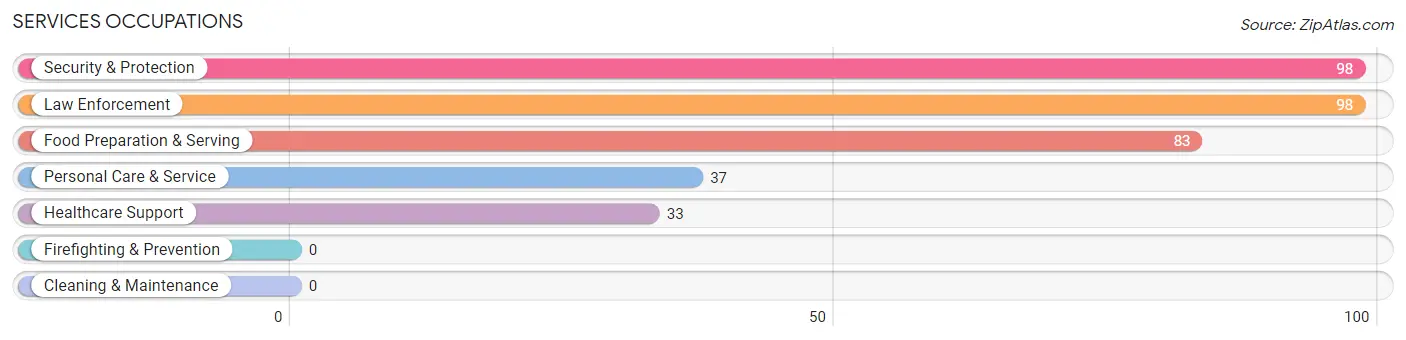
Services Occupations
The most common Services occupations in Jarrettsville are Security & Protection (98 | 7.0%), Law Enforcement (98 | 7.0%), Food Preparation & Serving (83 | 5.9%), Personal Care & Service (37 | 2.6%), and Healthcare Support (33 | 2.4%).
Services Occupations by Sex
Within the Services occupations in Jarrettsville, the most male-oriented occupations are Security & Protection (100.0%), Law Enforcement (100.0%), and Food Preparation & Serving (26.5%), while the most female-oriented occupations are Healthcare Support (100.0%), Personal Care & Service (100.0%), and Food Preparation & Serving (73.5%).
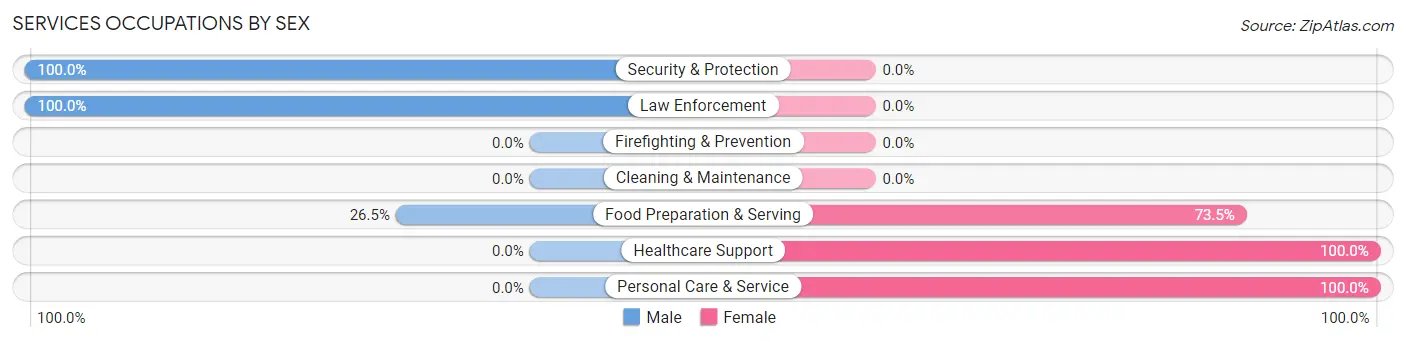
| Occupation | Male | Female |
| Healthcare Support | 0 (0.0%) | 33 (100.0%) |
| Security & Protection | 98 (100.0%) | 0 (0.0%) |
| Firefighting & Prevention | 0 (0.0%) | 0 (0.0%) |
| Law Enforcement | 98 (100.0%) | 0 (0.0%) |
| Food Preparation & Serving | 22 (26.5%) | 61 (73.5%) |
| Cleaning & Maintenance | 0 (0.0%) | 0 (0.0%) |
| Personal Care & Service | 0 (0.0%) | 37 (100.0%) |
| Total (Category) | 120 (47.8%) | 131 (52.2%) |
| Total (Overall) | 671 (48.1%) | 724 (51.9%) |
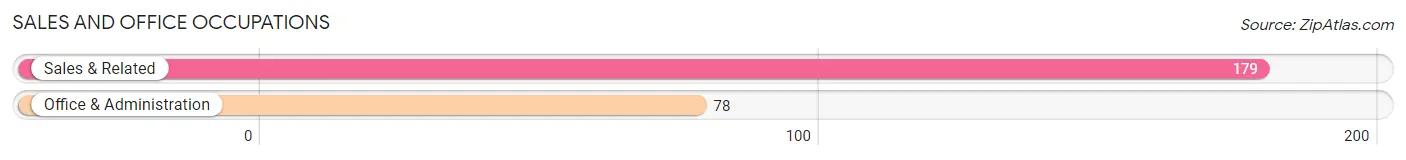
Sales and Office Occupations
The most common Sales and Office occupations in Jarrettsville are Sales & Related (179 | 12.8%), and Office & Administration (78 | 5.6%).
Sales and Office Occupations by Sex
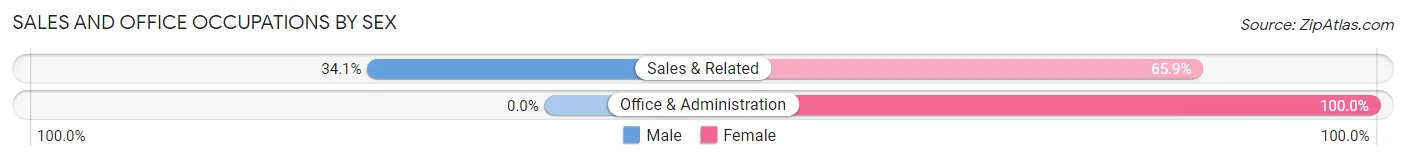
| Occupation | Male | Female |
| Sales & Related | 61 (34.1%) | 118 (65.9%) |
| Office & Administration | 0 (0.0%) | 78 (100.0%) |
| Total (Category) | 61 (23.7%) | 196 (76.3%) |
| Total (Overall) | 671 (48.1%) | 724 (51.9%) |
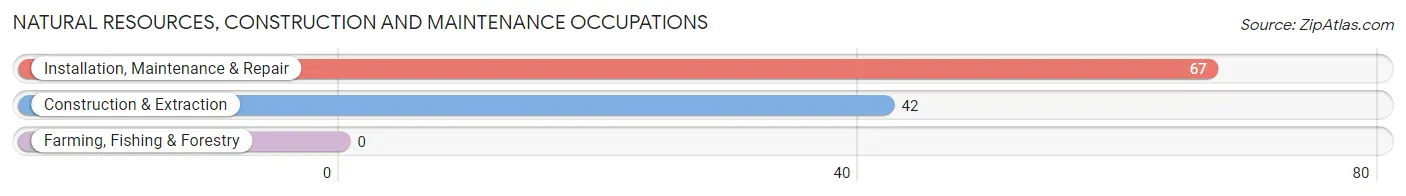
Natural Resources, Construction and Maintenance Occupations
The most common Natural Resources, Construction and Maintenance occupations in Jarrettsville are Installation, Maintenance & Repair (67 | 4.8%), and Construction & Extraction (42 | 3.0%).
Natural Resources, Construction and Maintenance Occupations by Sex
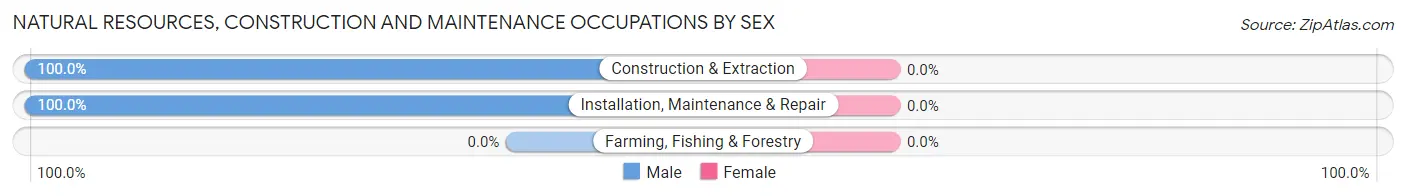
| Occupation | Male | Female |
| Farming, Fishing & Forestry | 0 (0.0%) | 0 (0.0%) |
| Construction & Extraction | 42 (100.0%) | 0 (0.0%) |
| Installation, Maintenance & Repair | 67 (100.0%) | 0 (0.0%) |
| Total (Category) | 109 (100.0%) | 0 (0.0%) |
| Total (Overall) | 671 (48.1%) | 724 (51.9%) |
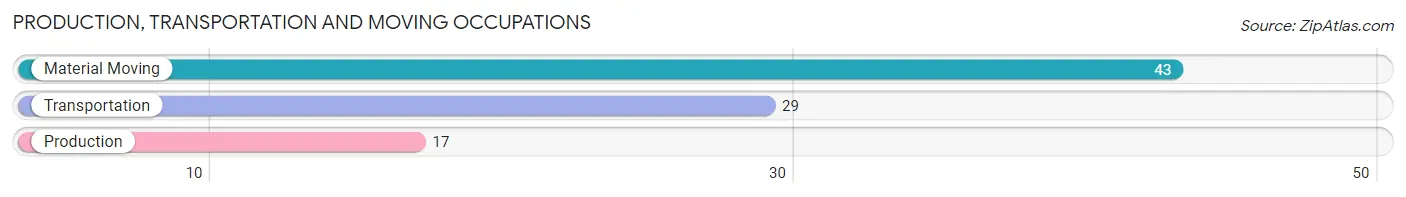
Production, Transportation and Moving Occupations
The most common Production, Transportation and Moving occupations in Jarrettsville are Material Moving (43 | 3.1%), Transportation (29 | 2.1%), and Production (17 | 1.2%).
Production, Transportation and Moving Occupations by Sex
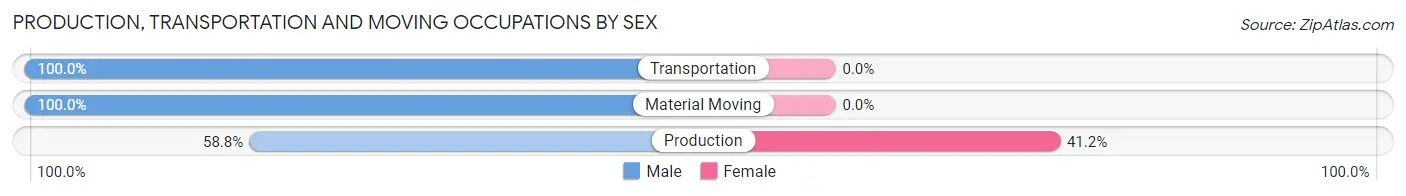
| Occupation | Male | Female |
| Production | 10 (58.8%) | 7 (41.2%) |
| Transportation | 29 (100.0%) | 0 (0.0%) |
| Material Moving | 43 (100.0%) | 0 (0.0%) |
| Total (Category) | 82 (92.1%) | 7 (7.9%) |
| Total (Overall) | 671 (48.1%) | 724 (51.9%) |
Employment Industries by Sex in Jarrettsville
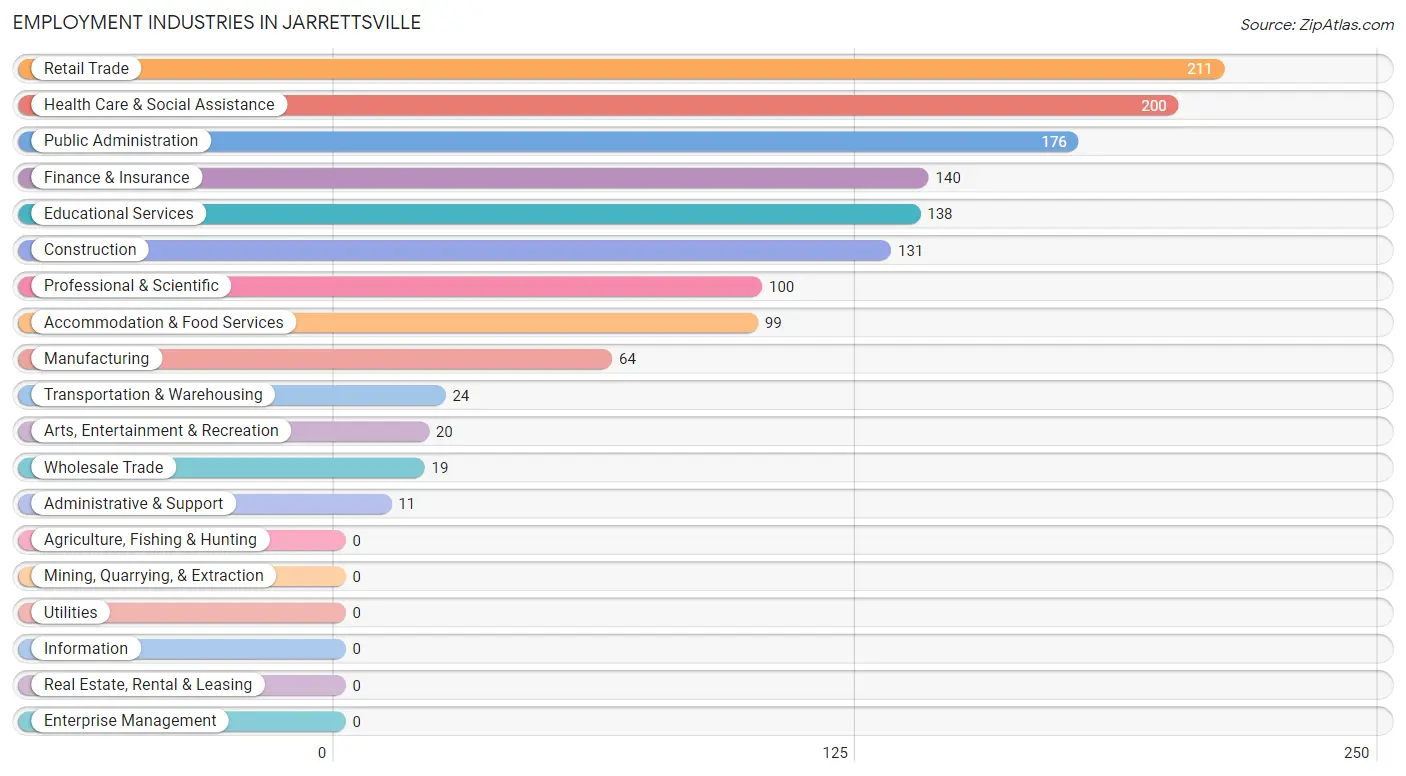
Employment Industries in Jarrettsville
The major employment industries in Jarrettsville include Retail Trade (211 | 15.1%), Health Care & Social Assistance (200 | 14.3%), Public Administration (176 | 12.6%), Finance & Insurance (140 | 10.0%), and Educational Services (138 | 9.9%).
Employment Industries by Sex in Jarrettsville
The Jarrettsville industries that see more men than women are Wholesale Trade (100.0%), Transportation & Warehousing (100.0%), and Administrative & Support (100.0%), whereas the industries that tend to have a higher number of women are Arts, Entertainment & Recreation (100.0%), Educational Services (79.0%), and Accommodation & Food Services (77.8%).
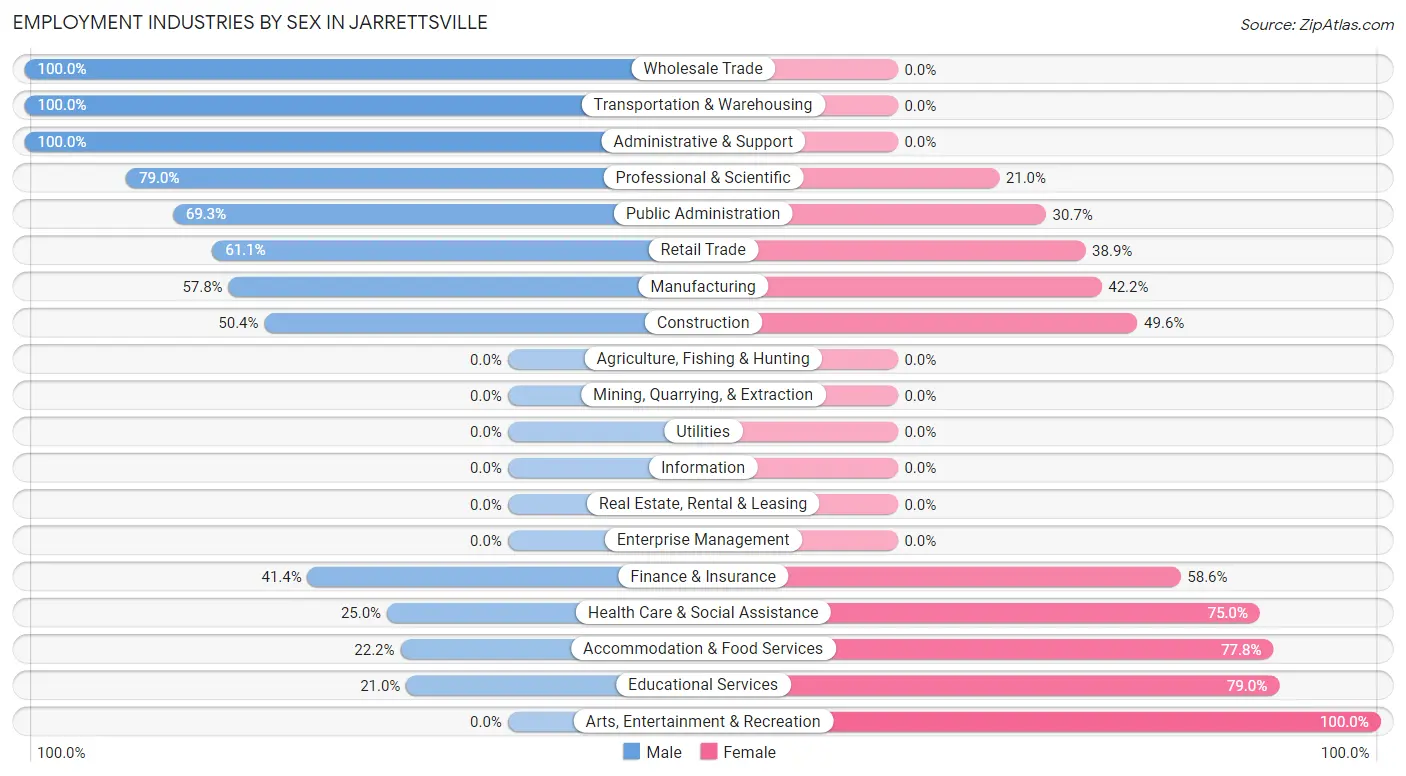
| Industry | Male | Female |
| Agriculture, Fishing & Hunting | 0 (0.0%) | 0 (0.0%) |
| Mining, Quarrying, & Extraction | 0 (0.0%) | 0 (0.0%) |
| Construction | 66 (50.4%) | 65 (49.6%) |
| Manufacturing | 37 (57.8%) | 27 (42.2%) |
| Wholesale Trade | 19 (100.0%) | 0 (0.0%) |
| Retail Trade | 129 (61.1%) | 82 (38.9%) |
| Transportation & Warehousing | 24 (100.0%) | 0 (0.0%) |
| Utilities | 0 (0.0%) | 0 (0.0%) |
| Information | 0 (0.0%) | 0 (0.0%) |
| Finance & Insurance | 58 (41.4%) | 82 (58.6%) |
| Real Estate, Rental & Leasing | 0 (0.0%) | 0 (0.0%) |
| Professional & Scientific | 79 (79.0%) | 21 (21.0%) |
| Enterprise Management | 0 (0.0%) | 0 (0.0%) |
| Administrative & Support | 11 (100.0%) | 0 (0.0%) |
| Educational Services | 29 (21.0%) | 109 (79.0%) |
| Health Care & Social Assistance | 50 (25.0%) | 150 (75.0%) |
| Arts, Entertainment & Recreation | 0 (0.0%) | 20 (100.0%) |
| Accommodation & Food Services | 22 (22.2%) | 77 (77.8%) |
| Public Administration | 122 (69.3%) | 54 (30.7%) |
| Total | 671 (48.1%) | 724 (51.9%) |
Education in Jarrettsville
School Enrollment in Jarrettsville
The most common levels of schooling among the 541 students in Jarrettsville are middle school (149 | 27.5%), high school (120 | 22.2%), and college / undergraduate (120 | 22.2%).
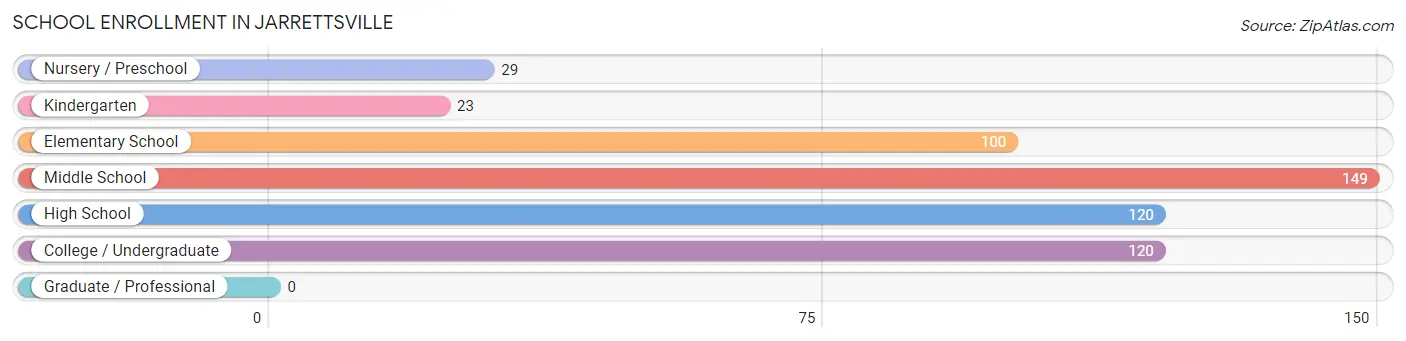
| School Level | # Students | % Students |
| Nursery / Preschool | 29 | 5.4% |
| Kindergarten | 23 | 4.3% |
| Elementary School | 100 | 18.5% |
| Middle School | 149 | 27.5% |
| High School | 120 | 22.2% |
| College / Undergraduate | 120 | 22.2% |
| Graduate / Professional | 0 | 0.0% |
| Total | 541 | 100.0% |
School Enrollment by Age by Funding Source in Jarrettsville
Out of a total of 541 students who are enrolled in schools in Jarrettsville, 64 (11.8%) attend a private institution, while the remaining 477 (88.2%) are enrolled in public schools. The age group of 3 to 4 year olds has the highest likelihood of being enrolled in private schools, with 14 (100.0% in the age bracket) enrolled. Conversely, the age group of 15 to 17 year olds has the lowest likelihood of being enrolled in a private school, with 120 (100.0% in the age bracket) attending a public institution.
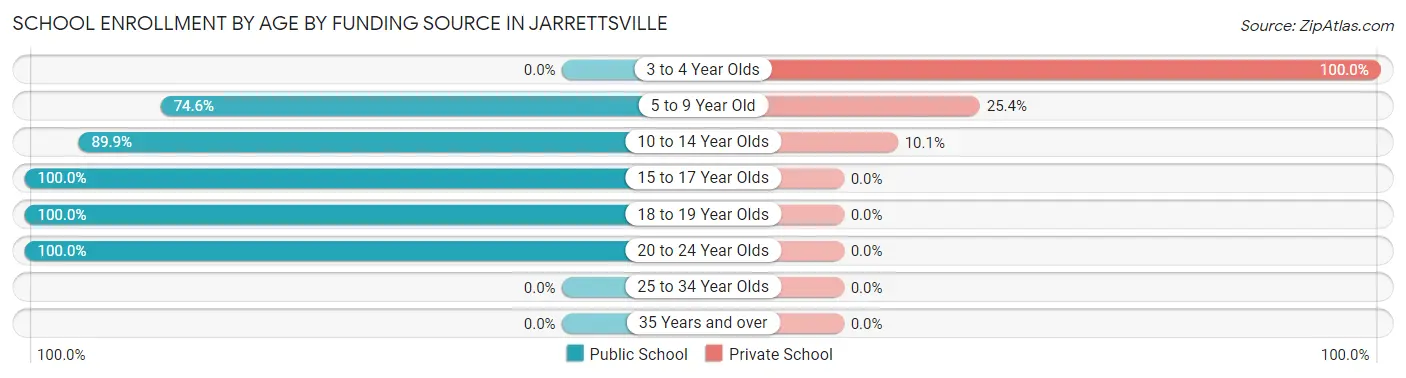
| Age Bracket | Public School | Private School |
| 3 to 4 Year Olds | 0 (0.0%) | 14 (100.0%) |
| 5 to 9 Year Old | 103 (74.6%) | 35 (25.4%) |
| 10 to 14 Year Olds | 134 (89.9%) | 15 (10.1%) |
| 15 to 17 Year Olds | 120 (100.0%) | 0 (0.0%) |
| 18 to 19 Year Olds | 22 (100.0%) | 0 (0.0%) |
| 20 to 24 Year Olds | 98 (100.0%) | 0 (0.0%) |
| 25 to 34 Year Olds | 0 (0.0%) | 0 (0.0%) |
| 35 Years and over | 0 (0.0%) | 0 (0.0%) |
| Total | 477 (88.2%) | 64 (11.8%) |
Educational Attainment by Field of Study in Jarrettsville
Physical & health sciences (109 | 10.9%), computers & mathematics (107 | 10.7%), social sciences (103 | 10.3%), education (97 | 9.7%), and arts & humanities (93 | 9.3%) are the most common fields of study among 1,002 individuals in Jarrettsville who have obtained a bachelor's degree or higher.
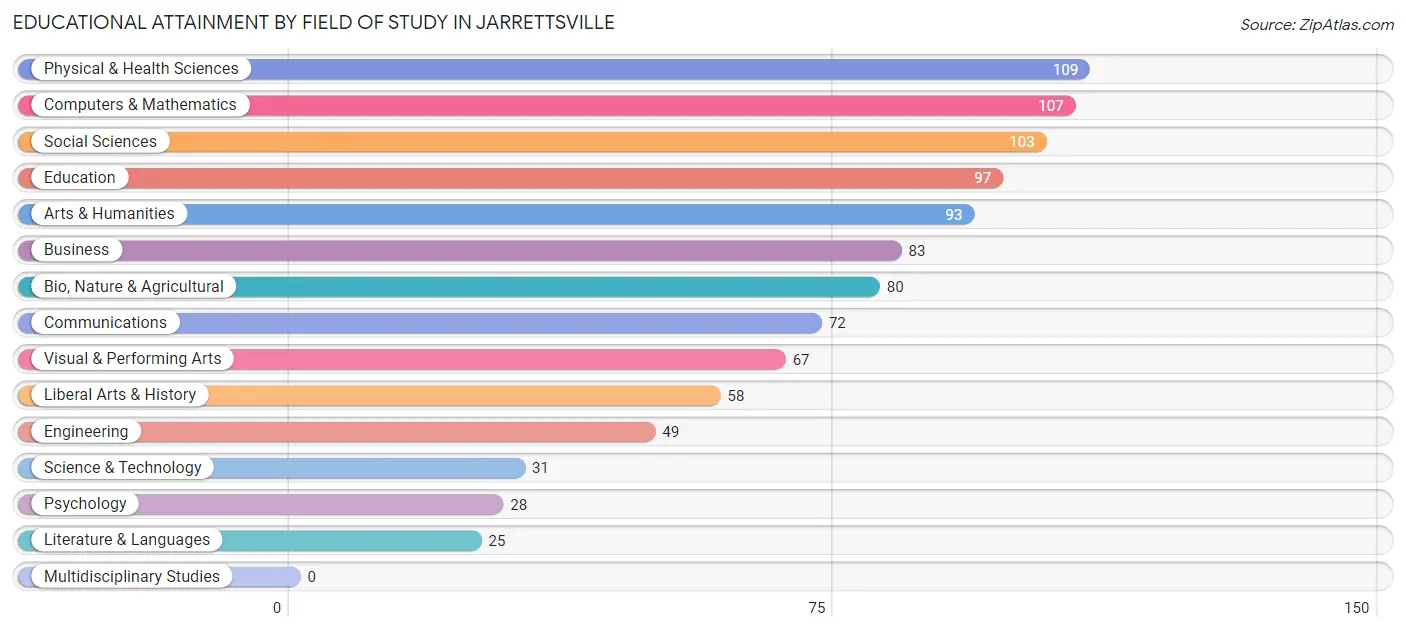
| Field of Study | # Graduates | % Graduates |
| Computers & Mathematics | 107 | 10.7% |
| Bio, Nature & Agricultural | 80 | 8.0% |
| Physical & Health Sciences | 109 | 10.9% |
| Psychology | 28 | 2.8% |
| Social Sciences | 103 | 10.3% |
| Engineering | 49 | 4.9% |
| Multidisciplinary Studies | 0 | 0.0% |
| Science & Technology | 31 | 3.1% |
| Business | 83 | 8.3% |
| Education | 97 | 9.7% |
| Literature & Languages | 25 | 2.5% |
| Liberal Arts & History | 58 | 5.8% |
| Visual & Performing Arts | 67 | 6.7% |
| Communications | 72 | 7.2% |
| Arts & Humanities | 93 | 9.3% |
| Total | 1,002 | 100.0% |
Transportation & Commute in Jarrettsville
Vehicle Availability by Sex in Jarrettsville
The most prevalent vehicle ownership categories in Jarrettsville are males with 3 vehicles (269, accounting for 40.1%) and females with 3 vehicles (272, making up 37.6%).
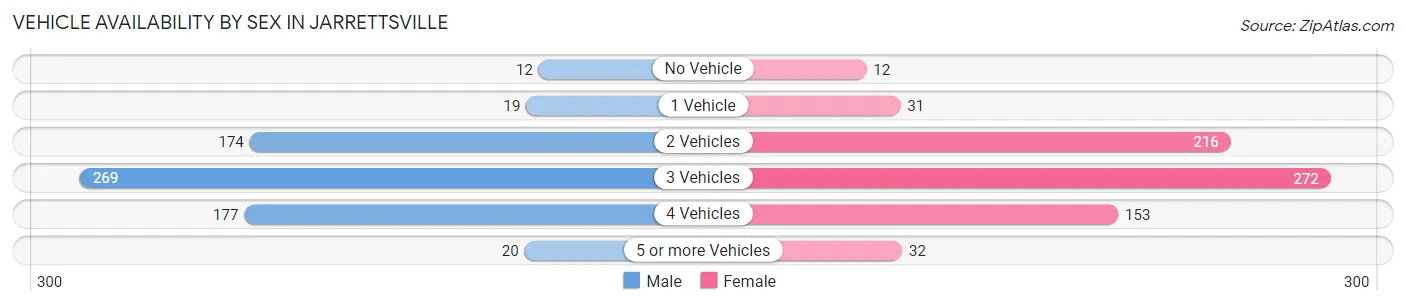
| Vehicles Available | Male | Female |
| No Vehicle | 12 (1.8%) | 12 (1.7%) |
| 1 Vehicle | 19 (2.8%) | 31 (4.3%) |
| 2 Vehicles | 174 (25.9%) | 216 (30.2%) |
| 3 Vehicles | 269 (40.1%) | 272 (38.0%) |
| 4 Vehicles | 177 (26.4%) | 153 (21.4%) |
| 5 or more Vehicles | 20 (3.0%) | 32 (4.5%) |
| Total | 671 (100.0%) | 716 (100.0%) |
Commute Time in Jarrettsville
The most frequently occuring commute durations in Jarrettsville are 45 to 59 minutes (161 commuters, 14.7%), 30 to 34 minutes (156 commuters, 14.2%), and 90 or more minutes (111 commuters, 10.1%).
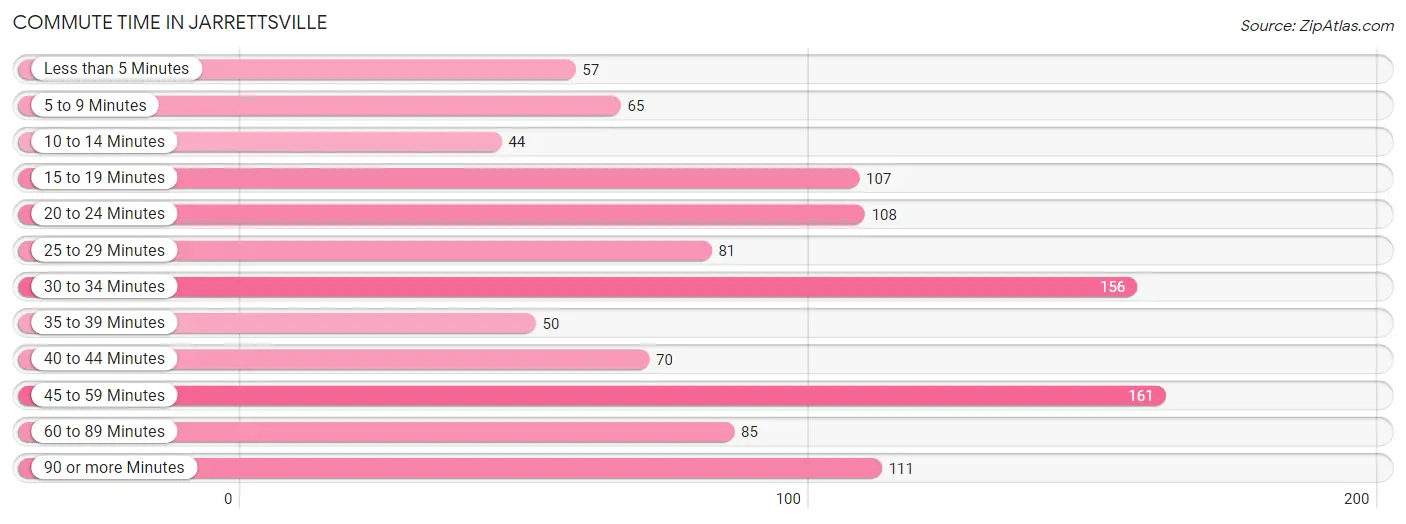
| Commute Time | # Commuters | % Commuters |
| Less than 5 Minutes | 57 | 5.2% |
| 5 to 9 Minutes | 65 | 5.9% |
| 10 to 14 Minutes | 44 | 4.0% |
| 15 to 19 Minutes | 107 | 9.8% |
| 20 to 24 Minutes | 108 | 9.9% |
| 25 to 29 Minutes | 81 | 7.4% |
| 30 to 34 Minutes | 156 | 14.2% |
| 35 to 39 Minutes | 50 | 4.6% |
| 40 to 44 Minutes | 70 | 6.4% |
| 45 to 59 Minutes | 161 | 14.7% |
| 60 to 89 Minutes | 85 | 7.8% |
| 90 or more Minutes | 111 | 10.1% |
Commute Time by Sex in Jarrettsville
The most common commute times in Jarrettsville are 30 to 34 minutes (134 commuters, 24.6%) for males and 90 or more minutes (91 commuters, 16.5%) for females.
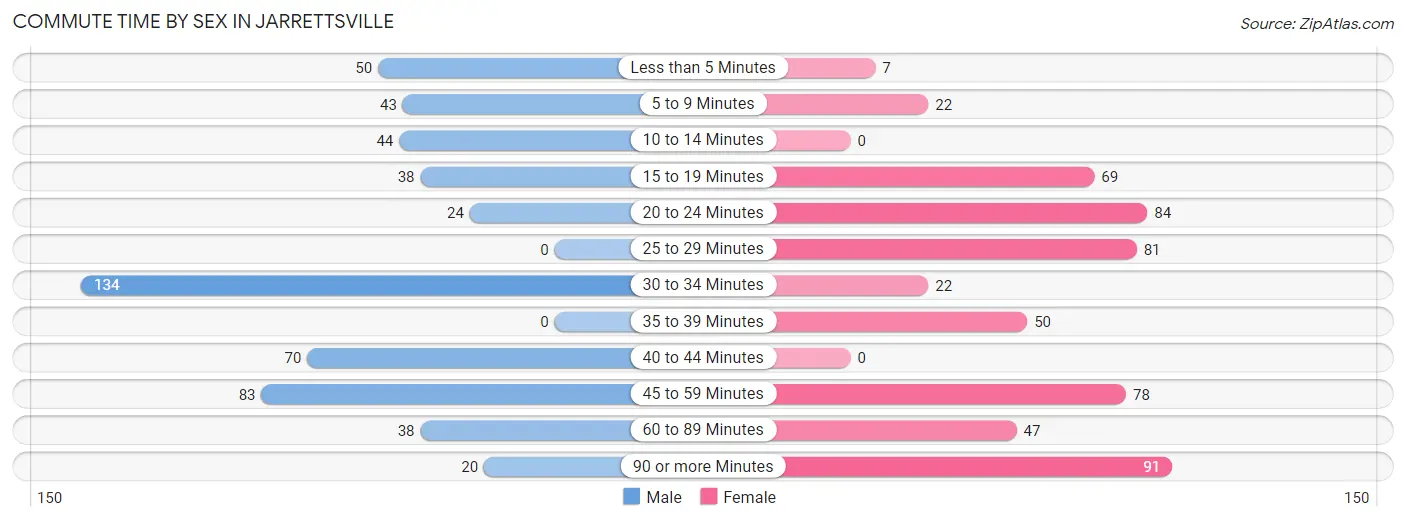
| Commute Time | Male | Female |
| Less than 5 Minutes | 50 (9.2%) | 7 (1.3%) |
| 5 to 9 Minutes | 43 (7.9%) | 22 (4.0%) |
| 10 to 14 Minutes | 44 (8.1%) | 0 (0.0%) |
| 15 to 19 Minutes | 38 (7.0%) | 69 (12.5%) |
| 20 to 24 Minutes | 24 (4.4%) | 84 (15.2%) |
| 25 to 29 Minutes | 0 (0.0%) | 81 (14.7%) |
| 30 to 34 Minutes | 134 (24.6%) | 22 (4.0%) |
| 35 to 39 Minutes | 0 (0.0%) | 50 (9.1%) |
| 40 to 44 Minutes | 70 (12.9%) | 0 (0.0%) |
| 45 to 59 Minutes | 83 (15.3%) | 78 (14.2%) |
| 60 to 89 Minutes | 38 (7.0%) | 47 (8.5%) |
| 90 or more Minutes | 20 (3.7%) | 91 (16.5%) |
Time of Departure to Work by Sex in Jarrettsville
The most frequent times of departure to work in Jarrettsville are 7:00 AM to 7:29 AM (180, 33.1%) for males and 7:00 AM to 7:29 AM (179, 32.5%) for females.
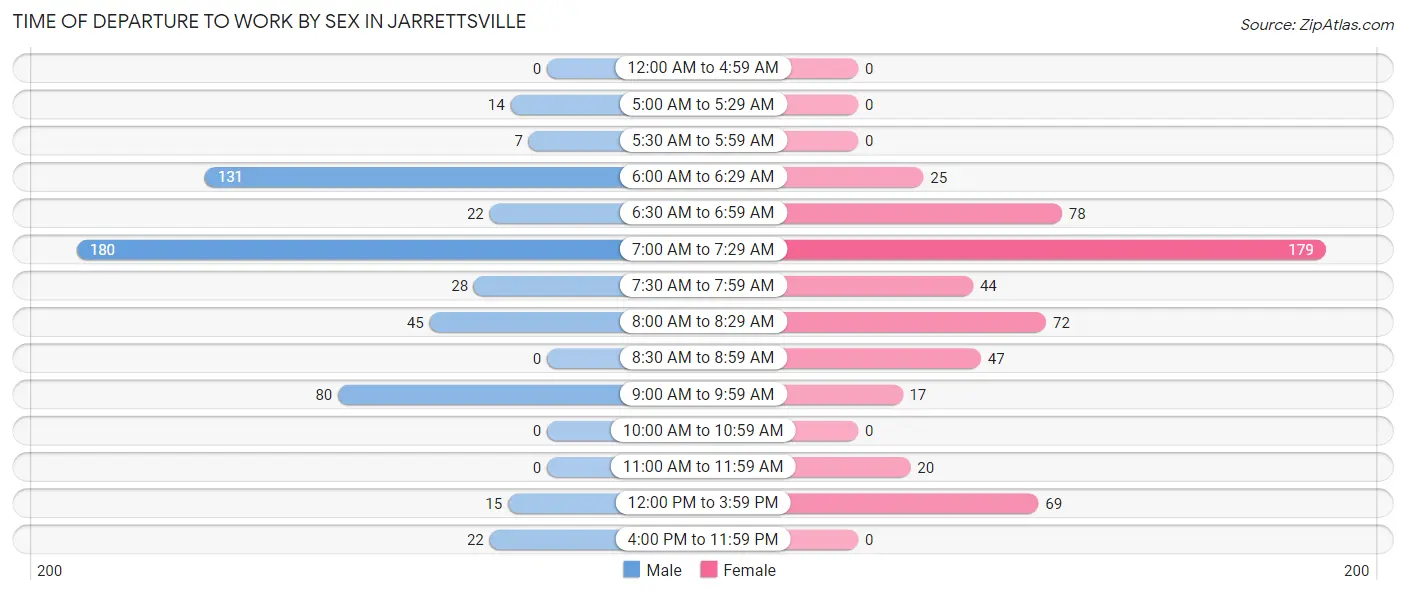
| Time of Departure | Male | Female |
| 12:00 AM to 4:59 AM | 0 (0.0%) | 0 (0.0%) |
| 5:00 AM to 5:29 AM | 14 (2.6%) | 0 (0.0%) |
| 5:30 AM to 5:59 AM | 7 (1.3%) | 0 (0.0%) |
| 6:00 AM to 6:29 AM | 131 (24.1%) | 25 (4.5%) |
| 6:30 AM to 6:59 AM | 22 (4.0%) | 78 (14.2%) |
| 7:00 AM to 7:29 AM | 180 (33.1%) | 179 (32.5%) |
| 7:30 AM to 7:59 AM | 28 (5.1%) | 44 (8.0%) |
| 8:00 AM to 8:29 AM | 45 (8.3%) | 72 (13.1%) |
| 8:30 AM to 8:59 AM | 0 (0.0%) | 47 (8.5%) |
| 9:00 AM to 9:59 AM | 80 (14.7%) | 17 (3.1%) |
| 10:00 AM to 10:59 AM | 0 (0.0%) | 0 (0.0%) |
| 11:00 AM to 11:59 AM | 0 (0.0%) | 20 (3.6%) |
| 12:00 PM to 3:59 PM | 15 (2.8%) | 69 (12.5%) |
| 4:00 PM to 11:59 PM | 22 (4.0%) | 0 (0.0%) |
| Total | 544 (100.0%) | 551 (100.0%) |
Housing Occupancy in Jarrettsville
Occupancy by Ownership in Jarrettsville
Of the total 973 dwellings in Jarrettsville, owner-occupied units account for 852 (87.6%), while renter-occupied units make up 121 (12.4%).
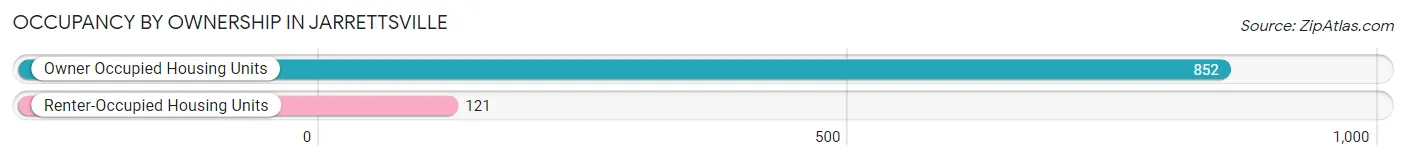
| Occupancy | # Housing Units | % Housing Units |
| Owner Occupied Housing Units | 852 | 87.6% |
| Renter-Occupied Housing Units | 121 | 12.4% |
| Total Occupied Housing Units | 973 | 100.0% |
Occupancy by Household Size in Jarrettsville
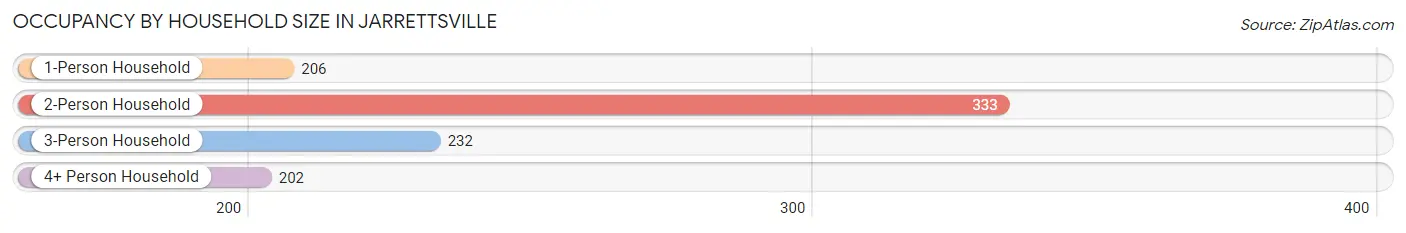
| Household Size | # Housing Units | % Housing Units |
| 1-Person Household | 206 | 21.2% |
| 2-Person Household | 333 | 34.2% |
| 3-Person Household | 232 | 23.8% |
| 4+ Person Household | 202 | 20.8% |
| Total Housing Units | 973 | 100.0% |
Occupancy by Ownership by Household Size in Jarrettsville
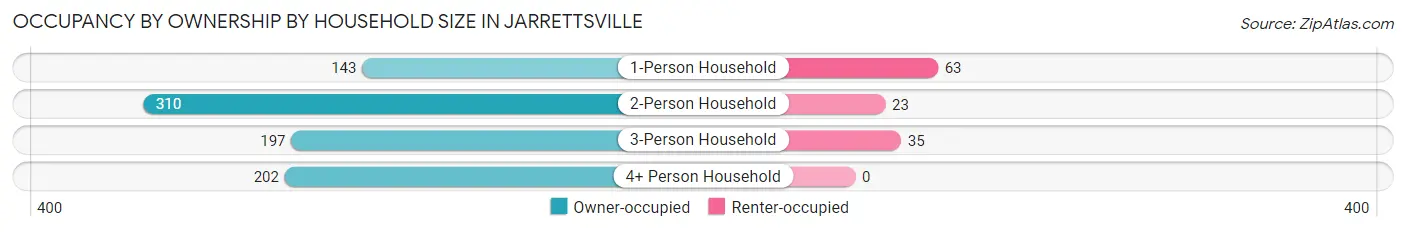
| Household Size | Owner-occupied | Renter-occupied |
| 1-Person Household | 143 (69.4%) | 63 (30.6%) |
| 2-Person Household | 310 (93.1%) | 23 (6.9%) |
| 3-Person Household | 197 (84.9%) | 35 (15.1%) |
| 4+ Person Household | 202 (100.0%) | 0 (0.0%) |
| Total Housing Units | 852 (87.6%) | 121 (12.4%) |
Occupancy by Educational Attainment in Jarrettsville
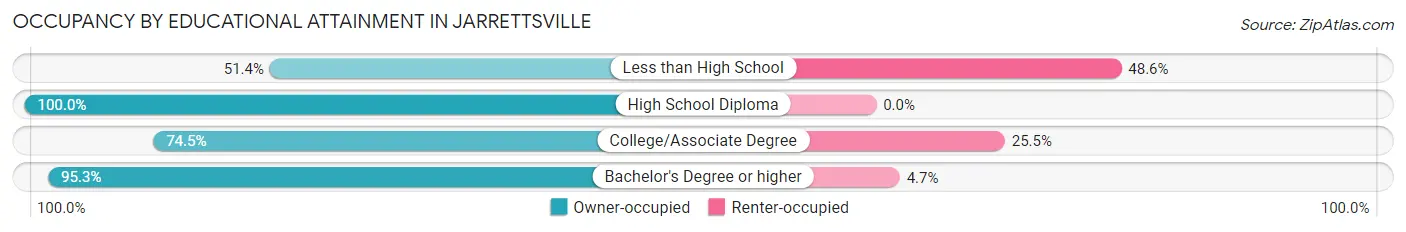
| Household Size | Owner-occupied | Renter-occupied |
| Less than High School | 37 (51.4%) | 35 (48.6%) |
| High School Diploma | 161 (100.0%) | 0 (0.0%) |
| College/Associate Degree | 184 (74.5%) | 63 (25.5%) |
| Bachelor's Degree or higher | 470 (95.3%) | 23 (4.7%) |
Occupancy by Age of Householder in Jarrettsville
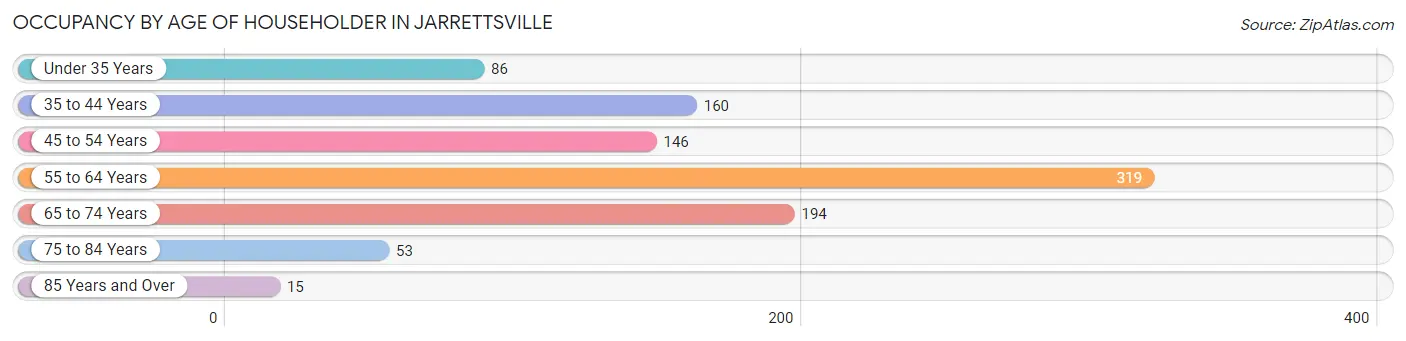
| Age Bracket | # Households | % Households |
| Under 35 Years | 86 | 8.8% |
| 35 to 44 Years | 160 | 16.4% |
| 45 to 54 Years | 146 | 15.0% |
| 55 to 64 Years | 319 | 32.8% |
| 65 to 74 Years | 194 | 19.9% |
| 75 to 84 Years | 53 | 5.4% |
| 85 Years and Over | 15 | 1.5% |
| Total | 973 | 100.0% |
Housing Finances in Jarrettsville
Median Income by Occupancy in Jarrettsville
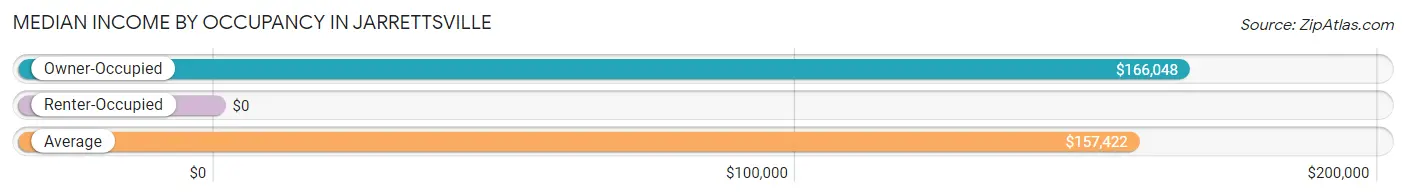
| Occupancy Type | # Households | Median Income |
| Owner-Occupied | 852 (87.6%) | $166,048 |
| Renter-Occupied | 121 (12.4%) | $0 |
| Average | 973 (100.0%) | $157,422 |
Occupancy by Householder Income Bracket in Jarrettsville
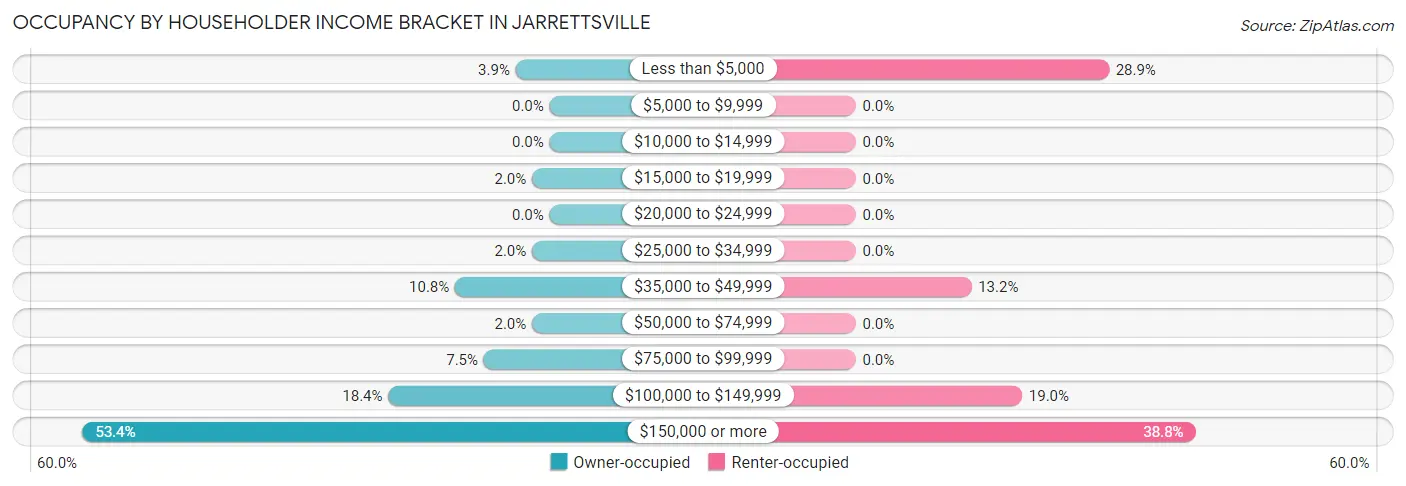
| Income Bracket | Owner-occupied | Renter-occupied |
| Less than $5,000 | 33 (3.9%) | 35 (28.9%) |
| $5,000 to $9,999 | 0 (0.0%) | 0 (0.0%) |
| $10,000 to $14,999 | 0 (0.0%) | 0 (0.0%) |
| $15,000 to $19,999 | 17 (2.0%) | 0 (0.0%) |
| $20,000 to $24,999 | 0 (0.0%) | 0 (0.0%) |
| $25,000 to $34,999 | 17 (2.0%) | 0 (0.0%) |
| $35,000 to $49,999 | 92 (10.8%) | 16 (13.2%) |
| $50,000 to $74,999 | 17 (2.0%) | 0 (0.0%) |
| $75,000 to $99,999 | 64 (7.5%) | 0 (0.0%) |
| $100,000 to $149,999 | 157 (18.4%) | 23 (19.0%) |
| $150,000 or more | 455 (53.4%) | 47 (38.8%) |
| Total | 852 (100.0%) | 121 (100.0%) |
Monthly Housing Cost Tiers in Jarrettsville
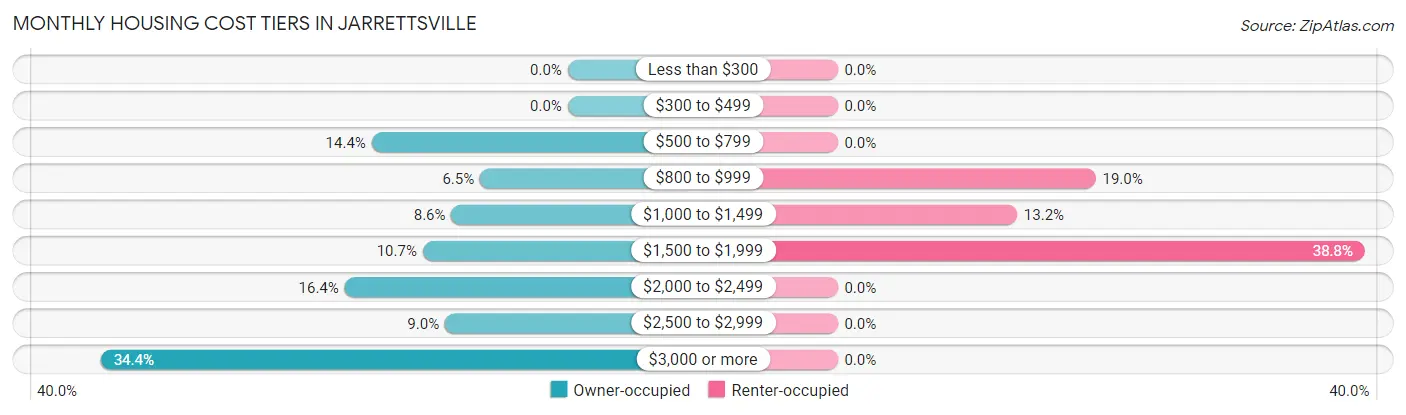
| Monthly Cost | Owner-occupied | Renter-occupied |
| Less than $300 | 0 (0.0%) | 0 (0.0%) |
| $300 to $499 | 0 (0.0%) | 0 (0.0%) |
| $500 to $799 | 123 (14.4%) | 0 (0.0%) |
| $800 to $999 | 55 (6.5%) | 23 (19.0%) |
| $1,000 to $1,499 | 73 (8.6%) | 16 (13.2%) |
| $1,500 to $1,999 | 91 (10.7%) | 47 (38.8%) |
| $2,000 to $2,499 | 140 (16.4%) | 0 (0.0%) |
| $2,500 to $2,999 | 77 (9.0%) | 0 (0.0%) |
| $3,000 or more | 293 (34.4%) | 0 (0.0%) |
| Total | 852 (100.0%) | 121 (100.0%) |
Physical Housing Characteristics in Jarrettsville
Housing Structures in Jarrettsville
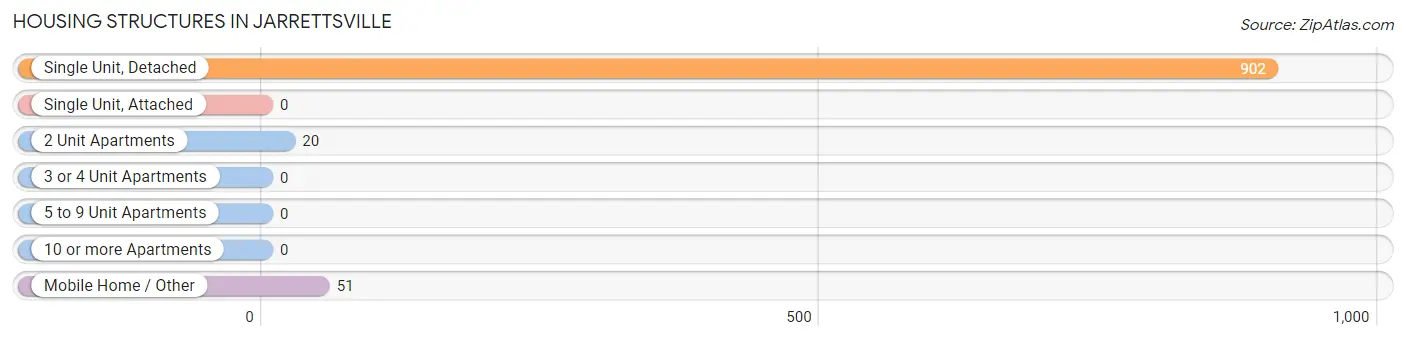
| Structure Type | # Housing Units | % Housing Units |
| Single Unit, Detached | 902 | 92.7% |
| Single Unit, Attached | 0 | 0.0% |
| 2 Unit Apartments | 20 | 2.1% |
| 3 or 4 Unit Apartments | 0 | 0.0% |
| 5 to 9 Unit Apartments | 0 | 0.0% |
| 10 or more Apartments | 0 | 0.0% |
| Mobile Home / Other | 51 | 5.2% |
| Total | 973 | 100.0% |
Housing Structures by Occupancy in Jarrettsville
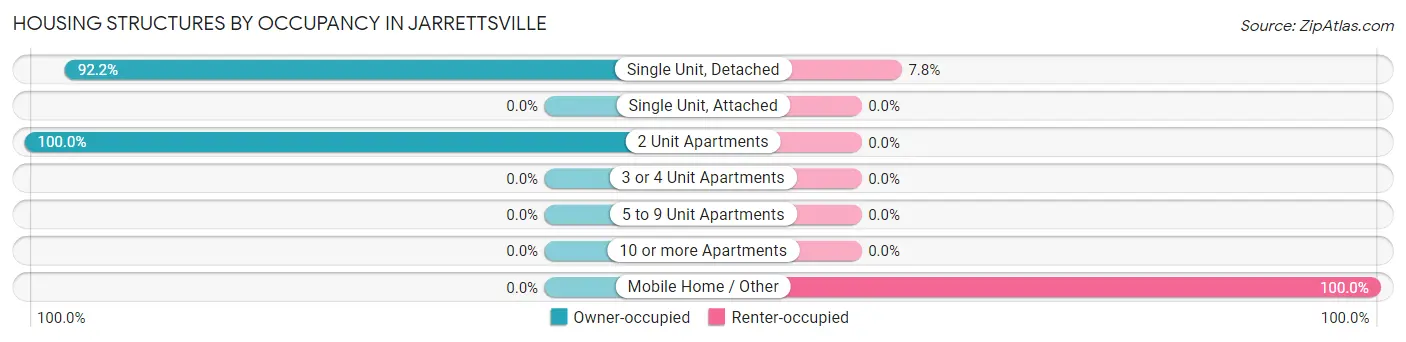
| Structure Type | Owner-occupied | Renter-occupied |
| Single Unit, Detached | 832 (92.2%) | 70 (7.8%) |
| Single Unit, Attached | 0 (0.0%) | 0 (0.0%) |
| 2 Unit Apartments | 20 (100.0%) | 0 (0.0%) |
| 3 or 4 Unit Apartments | 0 (0.0%) | 0 (0.0%) |
| 5 to 9 Unit Apartments | 0 (0.0%) | 0 (0.0%) |
| 10 or more Apartments | 0 (0.0%) | 0 (0.0%) |
| Mobile Home / Other | 0 (0.0%) | 51 (100.0%) |
| Total | 852 (87.6%) | 121 (12.4%) |
Housing Structures by Number of Rooms in Jarrettsville
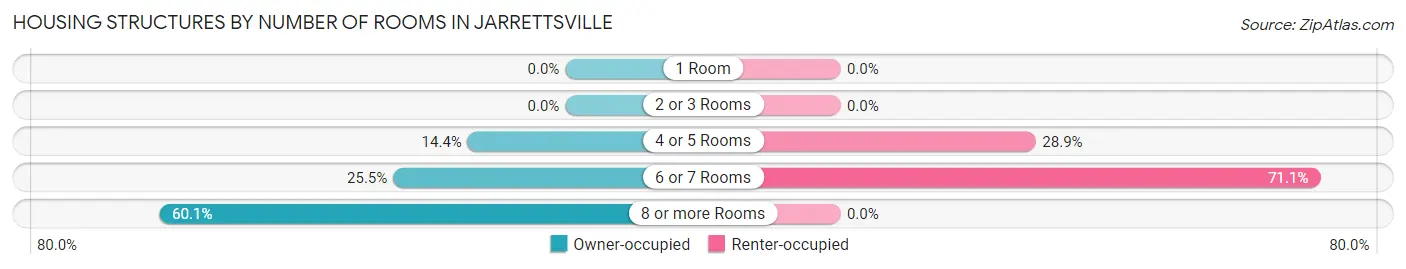
| Number of Rooms | Owner-occupied | Renter-occupied |
| 1 Room | 0 (0.0%) | 0 (0.0%) |
| 2 or 3 Rooms | 0 (0.0%) | 0 (0.0%) |
| 4 or 5 Rooms | 123 (14.4%) | 35 (28.9%) |
| 6 or 7 Rooms | 217 (25.5%) | 86 (71.1%) |
| 8 or more Rooms | 512 (60.1%) | 0 (0.0%) |
| Total | 852 (100.0%) | 121 (100.0%) |
Housing Structure by Heating Type in Jarrettsville
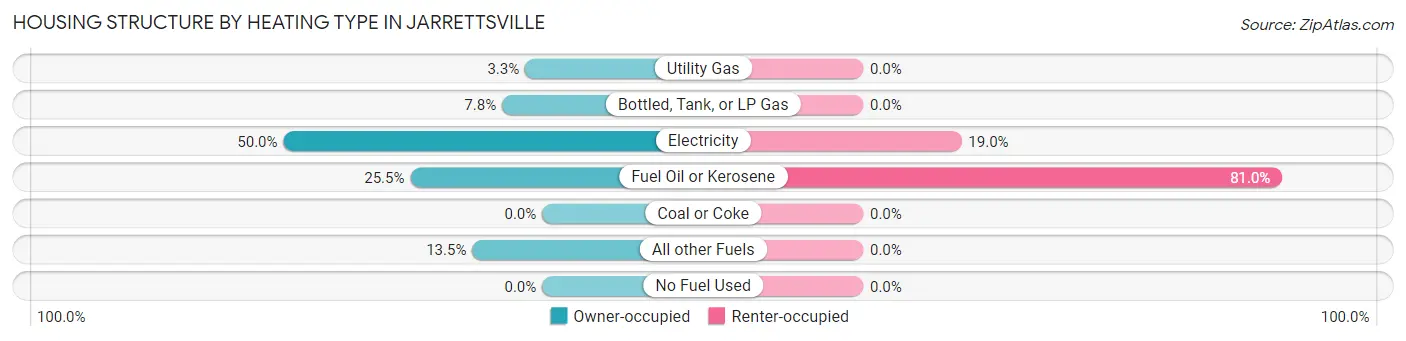
| Heating Type | Owner-occupied | Renter-occupied |
| Utility Gas | 28 (3.3%) | 0 (0.0%) |
| Bottled, Tank, or LP Gas | 66 (7.7%) | 0 (0.0%) |
| Electricity | 426 (50.0%) | 23 (19.0%) |
| Fuel Oil or Kerosene | 217 (25.5%) | 98 (81.0%) |
| Coal or Coke | 0 (0.0%) | 0 (0.0%) |
| All other Fuels | 115 (13.5%) | 0 (0.0%) |
| No Fuel Used | 0 (0.0%) | 0 (0.0%) |
| Total | 852 (100.0%) | 121 (100.0%) |
Household Vehicle Usage in Jarrettsville
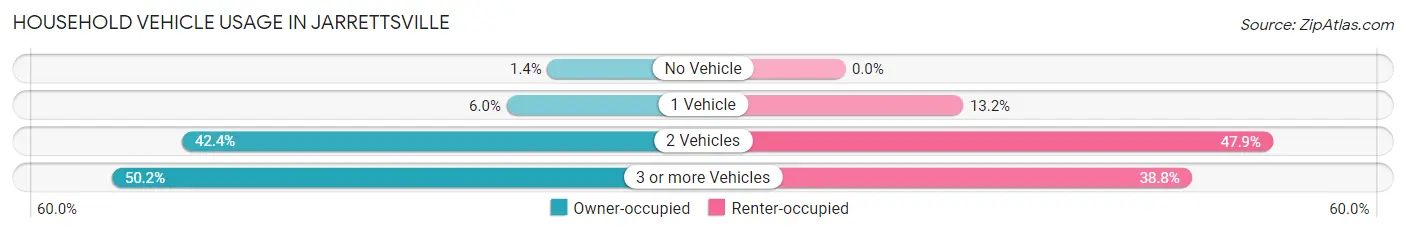
| Vehicles per Household | Owner-occupied | Renter-occupied |
| No Vehicle | 12 (1.4%) | 0 (0.0%) |
| 1 Vehicle | 51 (6.0%) | 16 (13.2%) |
| 2 Vehicles | 361 (42.4%) | 58 (47.9%) |
| 3 or more Vehicles | 428 (50.2%) | 47 (38.8%) |
| Total | 852 (100.0%) | 121 (100.0%) |
Real Estate & Mortgages in Jarrettsville
Real Estate and Mortgage Overview in Jarrettsville
| Characteristic | Without Mortgage | With Mortgage |
| Housing Units | 179 | 673 |
| Median Property Value | $465,800 | $492,200 |
| Median Household Income | $72,868 | $433 |
| Monthly Housing Costs | $741 | $293 |
| Real Estate Taxes | $4,242 | $0 |
Property Value by Mortgage Status in Jarrettsville
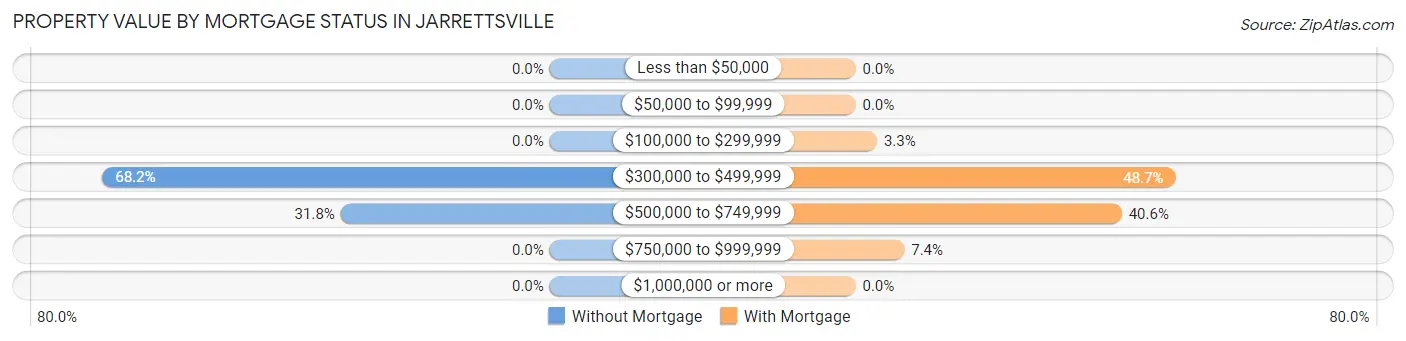
| Property Value | Without Mortgage | With Mortgage |
| Less than $50,000 | 0 (0.0%) | 0 (0.0%) |
| $50,000 to $99,999 | 0 (0.0%) | 0 (0.0%) |
| $100,000 to $299,999 | 0 (0.0%) | 22 (3.3%) |
| $300,000 to $499,999 | 122 (68.2%) | 328 (48.7%) |
| $500,000 to $749,999 | 57 (31.8%) | 273 (40.6%) |
| $750,000 to $999,999 | 0 (0.0%) | 50 (7.4%) |
| $1,000,000 or more | 0 (0.0%) | 0 (0.0%) |
| Total | 179 (100.0%) | 673 (100.0%) |
Household Income by Mortgage Status in Jarrettsville
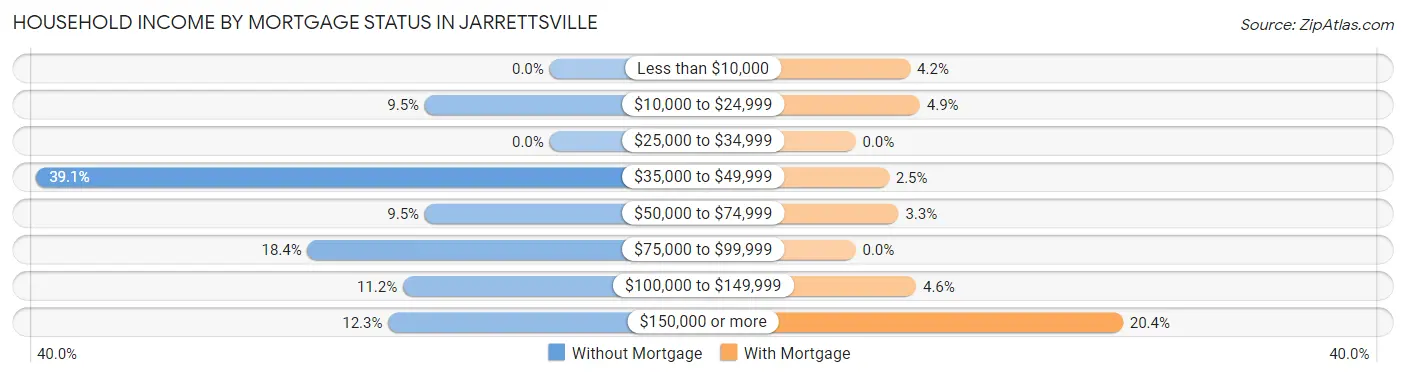
| Household Income | Without Mortgage | With Mortgage |
| Less than $10,000 | 0 (0.0%) | 28 (4.2%) |
| $10,000 to $24,999 | 17 (9.5%) | 33 (4.9%) |
| $25,000 to $34,999 | 0 (0.0%) | 0 (0.0%) |
| $35,000 to $49,999 | 70 (39.1%) | 17 (2.5%) |
| $50,000 to $74,999 | 17 (9.5%) | 22 (3.3%) |
| $75,000 to $99,999 | 33 (18.4%) | 0 (0.0%) |
| $100,000 to $149,999 | 20 (11.2%) | 31 (4.6%) |
| $150,000 or more | 22 (12.3%) | 137 (20.4%) |
| Total | 179 (100.0%) | 673 (100.0%) |
Property Value to Household Income Ratio in Jarrettsville
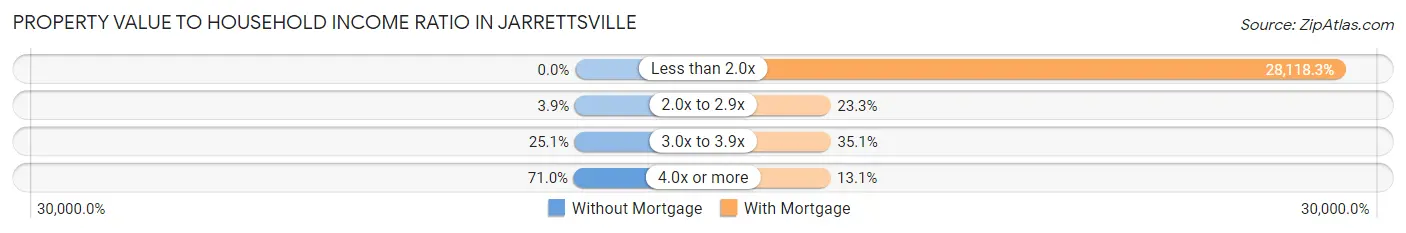
| Value-to-Income Ratio | Without Mortgage | With Mortgage |
| Less than 2.0x | 0 (0.0%) | 189,236 (28,118.3%) |
| 2.0x to 2.9x | 7 (3.9%) | 157 (23.3%) |
| 3.0x to 3.9x | 45 (25.1%) | 236 (35.1%) |
| 4.0x or more | 127 (71.0%) | 88 (13.1%) |
| Total | 179 (100.0%) | 673 (100.0%) |
Real Estate Taxes by Mortgage Status in Jarrettsville
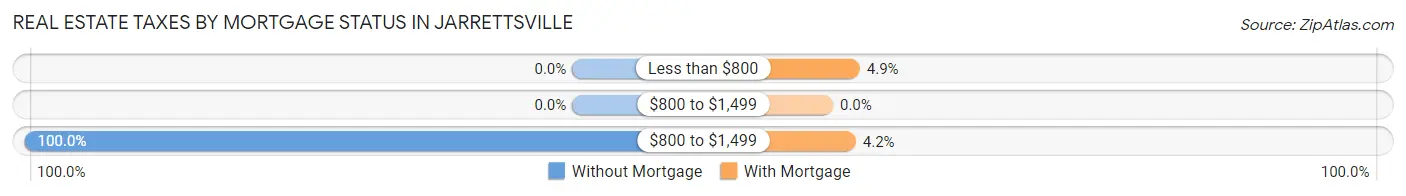
| Property Taxes | Without Mortgage | With Mortgage |
| Less than $800 | 0 (0.0%) | 33 (4.9%) |
| $800 to $1,499 | 0 (0.0%) | 0 (0.0%) |
| $800 to $1,499 | 179 (100.0%) | 28 (4.2%) |
| Total | 179 (100.0%) | 673 (100.0%) |
Health & Disability in Jarrettsville
Health Insurance Coverage by Age in Jarrettsville
| Age Bracket | With Coverage | Without Coverage |
| Under 6 Years | 160 (100.0%) | 0 (0.0%) |
| 6 to 18 Years | 369 (100.0%) | 0 (0.0%) |
| 19 to 25 Years | 221 (100.0%) | 0 (0.0%) |
| 26 to 34 Years | 177 (75.3%) | 58 (24.7%) |
| 35 to 44 Years | 335 (100.0%) | 0 (0.0%) |
| 45 to 54 Years | 399 (100.0%) | 0 (0.0%) |
| 55 to 64 Years | 489 (100.0%) | 0 (0.0%) |
| 65 to 74 Years | 235 (100.0%) | 0 (0.0%) |
| 75 Years and older | 229 (100.0%) | 0 (0.0%) |
| Total | 2,614 (97.8%) | 58 (2.2%) |
Health Insurance Coverage by Citizenship Status in Jarrettsville
| Citizenship Status | With Coverage | Without Coverage |
| Native Born | 160 (100.0%) | 0 (0.0%) |
| Foreign Born, Citizen | 369 (100.0%) | 0 (0.0%) |
| Foreign Born, not a Citizen | 221 (100.0%) | 0 (0.0%) |
Health Insurance Coverage by Household Income in Jarrettsville
| Household Income | With Coverage | Without Coverage |
| Under $25,000 | 169 (100.0%) | 0 (0.0%) |
| $25,000 to $49,999 | 159 (73.3%) | 58 (26.7%) |
| $50,000 to $74,999 | 50 (100.0%) | 0 (0.0%) |
| $75,000 to $99,999 | 166 (100.0%) | 0 (0.0%) |
| $100,000 and over | 2,070 (100.0%) | 0 (0.0%) |
Public vs Private Health Insurance Coverage by Age in Jarrettsville
| Age Bracket | Public Insurance | Private Insurance |
| Under 6 | 6 (3.7%) | 154 (96.3%) |
| 6 to 18 Years | 16 (4.3%) | 353 (95.7%) |
| 19 to 25 Years | 0 (0.0%) | 221 (100.0%) |
| 25 to 34 Years | 10 (4.3%) | 177 (75.3%) |
| 35 to 44 Years | 52 (15.5%) | 283 (84.5%) |
| 45 to 54 Years | 50 (12.5%) | 399 (100.0%) |
| 55 to 64 Years | 92 (18.8%) | 414 (84.7%) |
| 65 to 74 Years | 225 (95.7%) | 220 (93.6%) |
| 75 Years and over | 229 (100.0%) | 212 (92.6%) |
| Total | 680 (25.5%) | 2,433 (91.1%) |
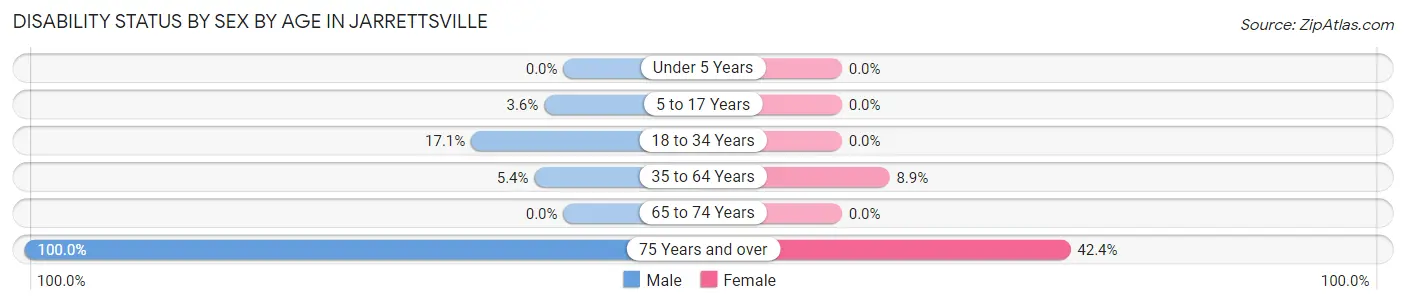
Disability Status by Sex by Age in Jarrettsville
| Age Bracket | Male | Female |
| Under 5 Years | 0 (0.0%) | 0 (0.0%) |
| 5 to 17 Years | 8 (3.6%) | 0 (0.0%) |
| 18 to 34 Years | 44 (17.1%) | 0 (0.0%) |
| 35 to 64 Years | 33 (5.4%) | 54 (8.8%) |
| 65 to 74 Years | 0 (0.0%) | 0 (0.0%) |
| 75 Years and over | 64 (100.0%) | 70 (42.4%) |
Disability Class by Sex by Age in Jarrettsville
Disability Class: Hearing Difficulty
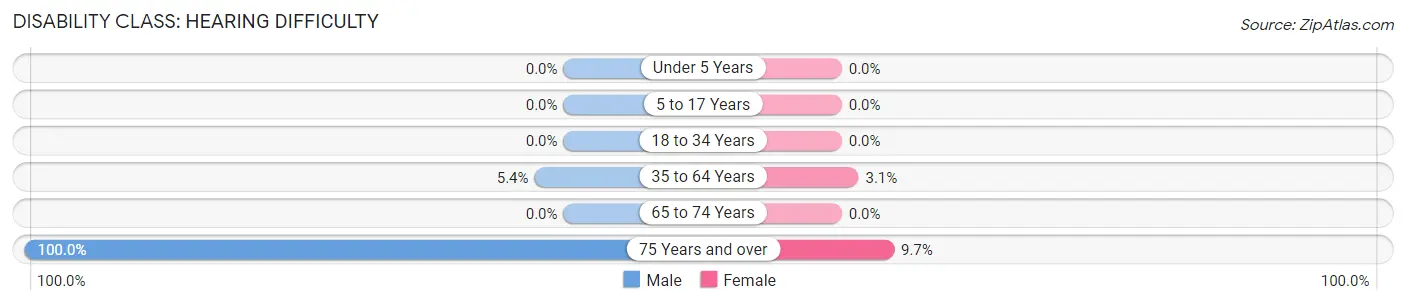
| Age Bracket | Male | Female |
| Under 5 Years | 0 (0.0%) | 0 (0.0%) |
| 5 to 17 Years | 0 (0.0%) | 0 (0.0%) |
| 18 to 34 Years | 0 (0.0%) | 0 (0.0%) |
| 35 to 64 Years | 33 (5.4%) | 19 (3.1%) |
| 65 to 74 Years | 0 (0.0%) | 0 (0.0%) |
| 75 Years and over | 64 (100.0%) | 16 (9.7%) |
Disability Class: Vision Difficulty
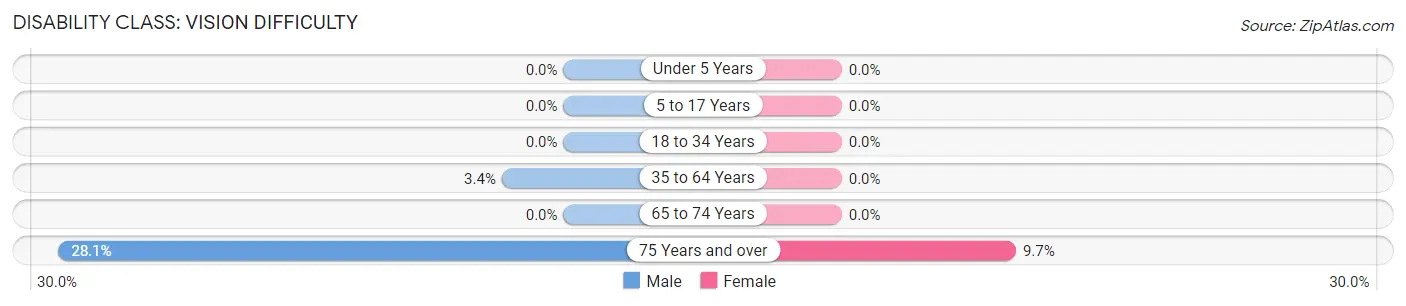
| Age Bracket | Male | Female |
| Under 5 Years | 0 (0.0%) | 0 (0.0%) |
| 5 to 17 Years | 0 (0.0%) | 0 (0.0%) |
| 18 to 34 Years | 0 (0.0%) | 0 (0.0%) |
| 35 to 64 Years | 21 (3.4%) | 0 (0.0%) |
| 65 to 74 Years | 0 (0.0%) | 0 (0.0%) |
| 75 Years and over | 18 (28.1%) | 16 (9.7%) |
Disability Class: Cognitive Difficulty
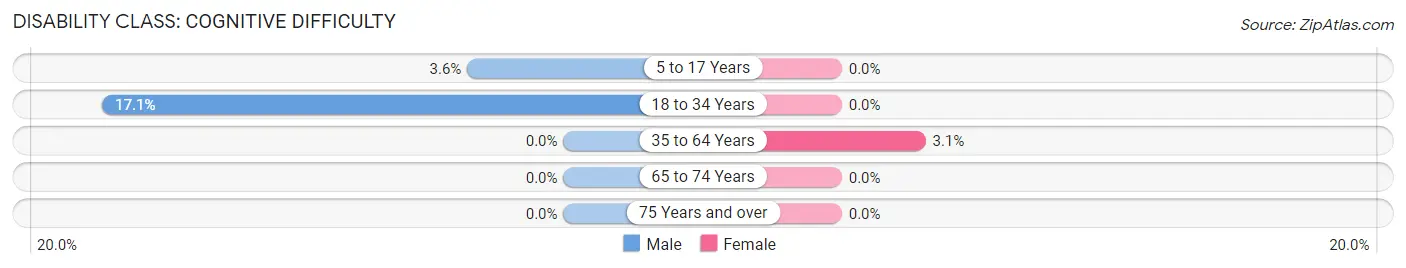
| Age Bracket | Male | Female |
| 5 to 17 Years | 8 (3.6%) | 0 (0.0%) |
| 18 to 34 Years | 44 (17.1%) | 0 (0.0%) |
| 35 to 64 Years | 0 (0.0%) | 19 (3.1%) |
| 65 to 74 Years | 0 (0.0%) | 0 (0.0%) |
| 75 Years and over | 0 (0.0%) | 0 (0.0%) |
Disability Class: Ambulatory Difficulty
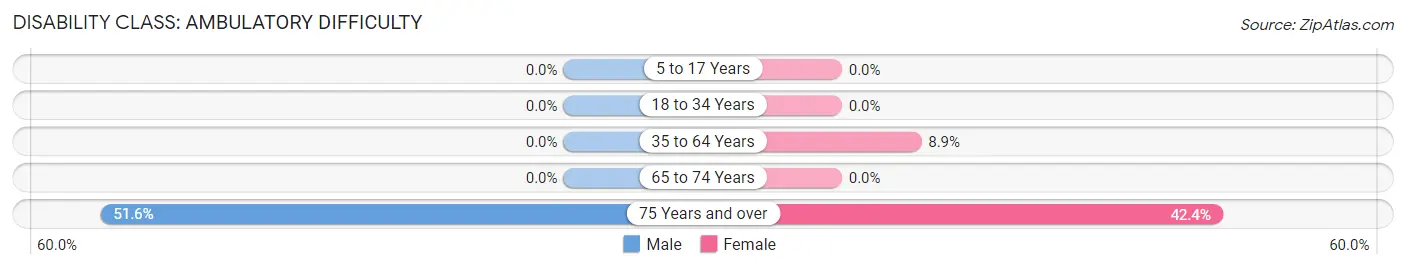
| Age Bracket | Male | Female |
| 5 to 17 Years | 0 (0.0%) | 0 (0.0%) |
| 18 to 34 Years | 0 (0.0%) | 0 (0.0%) |
| 35 to 64 Years | 0 (0.0%) | 54 (8.8%) |
| 65 to 74 Years | 0 (0.0%) | 0 (0.0%) |
| 75 Years and over | 33 (51.6%) | 70 (42.4%) |
Disability Class: Self-Care Difficulty
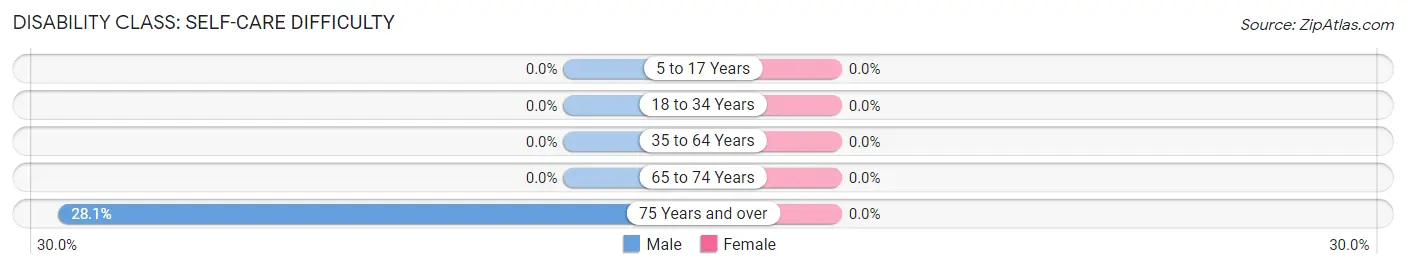
| Age Bracket | Male | Female |
| 5 to 17 Years | 0 (0.0%) | 0 (0.0%) |
| 18 to 34 Years | 0 (0.0%) | 0 (0.0%) |
| 35 to 64 Years | 0 (0.0%) | 0 (0.0%) |
| 65 to 74 Years | 0 (0.0%) | 0 (0.0%) |
| 75 Years and over | 18 (28.1%) | 0 (0.0%) |
Technology Access in Jarrettsville
Computing Device Access in Jarrettsville
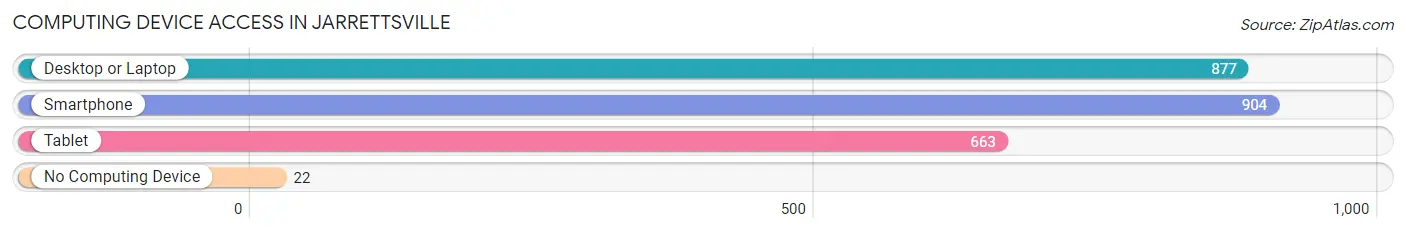
| Device Type | # Households | % Households |
| Desktop or Laptop | 877 | 90.1% |
| Smartphone | 904 | 92.9% |
| Tablet | 663 | 68.1% |
| No Computing Device | 22 | 2.3% |
| Total | 973 | 100.0% |
Internet Access in Jarrettsville
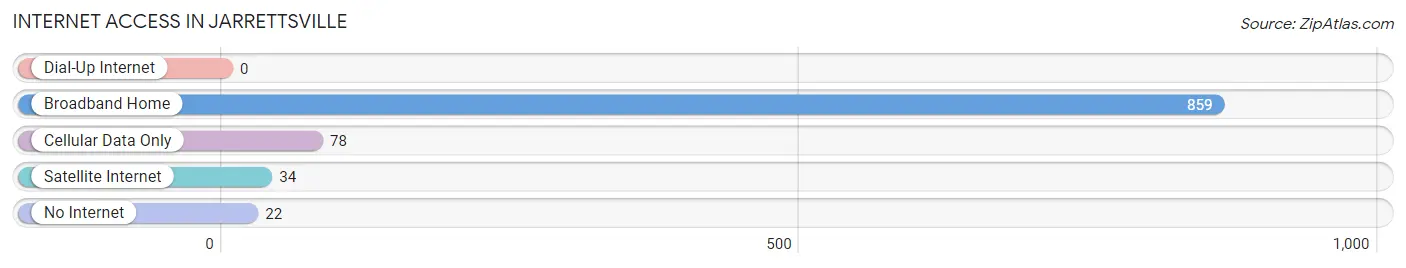
| Internet Type | # Households | % Households |
| Dial-Up Internet | 0 | 0.0% |
| Broadband Home | 859 | 88.3% |
| Cellular Data Only | 78 | 8.0% |
| Satellite Internet | 34 | 3.5% |
| No Internet | 22 | 2.3% |
| Total | 973 | 100.0% |
Jarrettsville Summary
Jarrettsville, Maryland is a small unincorporated community located in Harford County, Maryland. It is situated in the northern part of the county, approximately 25 miles northeast of Baltimore. The community is named after the Jarrett family, who were among the first settlers in the area.
History
The area that is now Jarrettsville was first settled in the late 1700s by the Jarrett family. The family had emigrated from England and settled in the area, which was then part of Baltimore County. The family established a farm and a mill, which became the center of the community. The mill was used to grind grain and produce flour, which was then sold in the local area.
In 1837, the area was officially incorporated as the town of Jarrettsville. The town was named after the Jarrett family, who had been the first settlers in the area. The town grew slowly over the years, and by the early 1900s, it had become a thriving community.
Geography
Jarrettsville is located in northern Harford County, Maryland. It is situated in the northern part of the county, approximately 25 miles northeast of Baltimore. The community is located in the Deer Creek Valley, which is part of the Piedmont Plateau. The area is characterized by rolling hills and valleys, with the highest point in the area being the summit of Jarrettsville Mountain, which is located just south of the town.
The climate in Jarrettsville is typical of the Mid-Atlantic region, with hot, humid summers and cold, wet winters. The average annual temperature is around 54 degrees Fahrenheit, with the average high temperature in the summer months reaching around 85 degrees Fahrenheit.
Economy
The economy of Jarrettsville is largely based on agriculture and tourism. The area is home to several farms, which produce a variety of crops, including corn, soybeans, wheat, and hay. The area is also home to several wineries, which produce a variety of wines.
Tourism is also an important part of the local economy. The area is home to several historic sites, including the Jarrettsville Historic District, which is listed on the National Register of Historic Places. The area is also home to several parks and recreational areas, including Rocks State Park and Susquehanna State Park.
Demographics
As of the 2010 census, the population of Jarrettsville was 2,845. The racial makeup of the town was 94.3% White, 2.3% African American, 0.3% Native American, 0.7% Asian, 0.1% Pacific Islander, and 1.3% from other races. The median household income was $76,250, and the median family income was $86,250.
Jarrettsville is a small, close-knit community. The town is home to several churches, including the Jarrettsville United Methodist Church, the Jarrettsville Baptist Church, and the Jarrettsville Presbyterian Church. The town also has several schools, including Jarrettsville Elementary School, Jarrettsville Middle School, and Jarrettsville High School.
Common Questions
What is Per Capita Income in Jarrettsville?
Per Capita income in Jarrettsville is $59,031.
What is the Median Family Income in Jarrettsville?
Median Family Income in Jarrettsville is $155,938.
What is the Median Household income in Jarrettsville?
Median Household Income in Jarrettsville is $157,422.
What is Income or Wage Gap in Jarrettsville?
Income or Wage Gap in Jarrettsville is 24.9%.
Women in Jarrettsville earn 75.1 cents for every dollar earned by a man.
What is Inequality or Gini Index in Jarrettsville?
Inequality or Gini Index in Jarrettsville is 0.37.
What is the Total Population of Jarrettsville?
Total Population of Jarrettsville is 2,677.
What is the Total Male Population of Jarrettsville?
Total Male Population of Jarrettsville is 1,336.
What is the Total Female Population of Jarrettsville?
Total Female Population of Jarrettsville is 1,341.
What is the Ratio of Males per 100 Females in Jarrettsville?
There are 99.63 Males per 100 Females in Jarrettsville.
What is the Ratio of Females per 100 Males in Jarrettsville?
There are 100.37 Females per 100 Males in Jarrettsville.
What is the Median Population Age in Jarrettsville?
Median Population Age in Jarrettsville is 46.6 Years.
What is the Average Family Size in Jarrettsville
Average Family Size in Jarrettsville is 3.2 People.
What is the Average Household Size in Jarrettsville
Average Household Size in Jarrettsville is 2.8 People.
How Large is the Labor Force in Jarrettsville?
There are 1,508 People in the Labor Forcein in Jarrettsville.
What is the Percentage of People in the Labor Force in Jarrettsville?
69.1% of People are in the Labor Force in Jarrettsville.
What is the Unemployment Rate in Jarrettsville?
Unemployment Rate in Jarrettsville is 7.6%.