Grasonville, MD Map & Demographics
Grasonville Map
Grasonville Overview
$45,736
PER CAPITA INCOME
$132,656
AVG FAMILY INCOME
$109,375
AVG HOUSEHOLD INCOME
33.8%
WAGE / INCOME GAP [ % ]
66.2¢/ $1
WAGE / INCOME GAP [ $ ]
0.41
INEQUALITY / GINI INDEX
3,332
TOTAL POPULATION
1,661
MALE POPULATION
1,671
FEMALE POPULATION
99.40
MALES / 100 FEMALES
100.60
FEMALES / 100 MALES
41.7
MEDIAN AGE
3.1
AVG FAMILY SIZE
2.7
AVG HOUSEHOLD SIZE
1,833
LABOR FORCE [ PEOPLE ]
72.5%
PERCENT IN LABOR FORCE
3.0%
UNEMPLOYMENT RATE
Grasonville Zip Codes
Grasonville Area Codes
Income in Grasonville
Income Overview in Grasonville
Per Capita Income in Grasonville is $45,736, while median incomes of families and households are $132,656 and $109,375 respectively.
| Characteristic | Number | Measure |
| Per Capita Income | 3,332 | $45,736 |
| Median Family Income | 889 | $132,656 |
| Mean Family Income | 889 | $143,723 |
| Median Household Income | 1,239 | $109,375 |
| Mean Household Income | 1,239 | $121,397 |
| Income Deficit | 889 | $0 |
| Wage / Income Gap (%) | 3,332 | 33.79% |
| Wage / Income Gap ($) | 3,332 | 66.21¢ per $1 |
| Gini / Inequality Index | 3,332 | 0.41 |
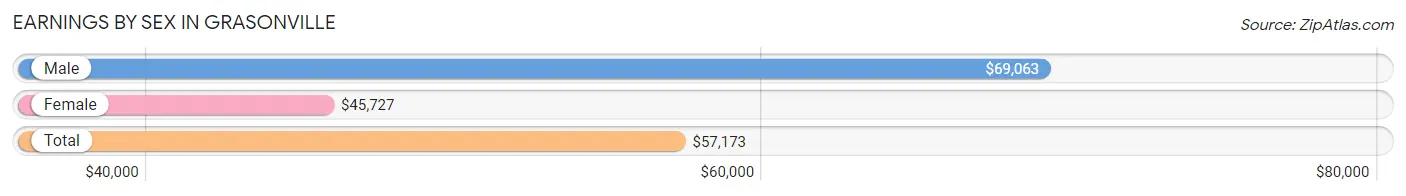
Earnings by Sex in Grasonville
Average Earnings in Grasonville are $57,173, $69,063 for men and $45,727 for women, a difference of 33.8%.
| Sex | Number | Average Earnings |
| Male | 1,025 (52.9%) | $69,063 |
| Female | 914 (47.1%) | $45,727 |
| Total | 1,939 (100.0%) | $57,173 |
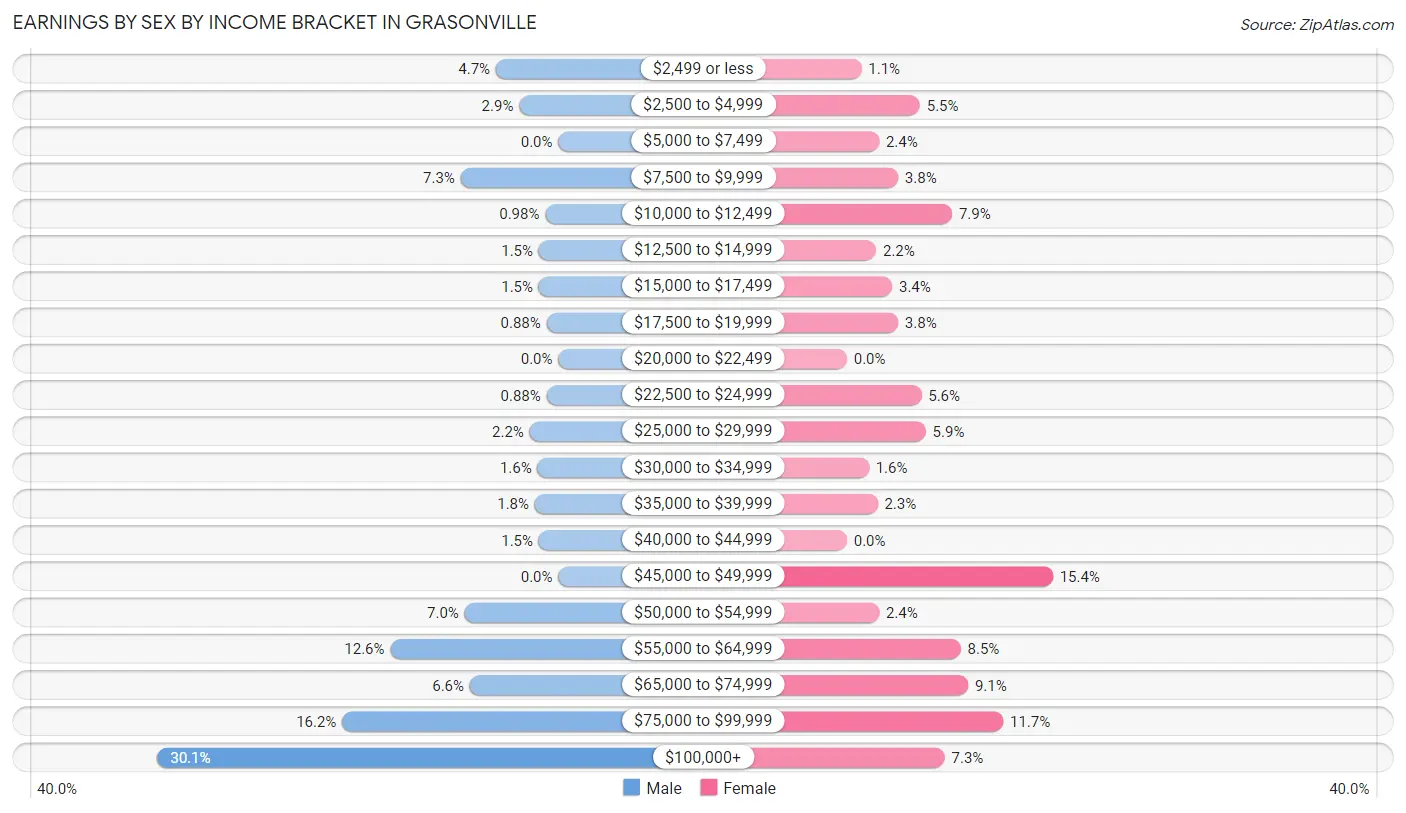
Earnings by Sex by Income Bracket in Grasonville
The most common earnings brackets in Grasonville are $100,000+ for men (308 | 30.0%) and $45,000 to $49,999 for women (141 | 15.4%).
| Income | Male | Female |
| $2,499 or less | 48 (4.7%) | 10 (1.1%) |
| $2,500 to $4,999 | 30 (2.9%) | 50 (5.5%) |
| $5,000 to $7,499 | 0 (0.0%) | 22 (2.4%) |
| $7,500 to $9,999 | 75 (7.3%) | 35 (3.8%) |
| $10,000 to $12,499 | 10 (1.0%) | 72 (7.9%) |
| $12,500 to $14,999 | 15 (1.5%) | 20 (2.2%) |
| $15,000 to $17,499 | 15 (1.5%) | 31 (3.4%) |
| $17,500 to $19,999 | 9 (0.9%) | 35 (3.8%) |
| $20,000 to $22,499 | 0 (0.0%) | 0 (0.0%) |
| $22,500 to $24,999 | 9 (0.9%) | 51 (5.6%) |
| $25,000 to $29,999 | 22 (2.1%) | 54 (5.9%) |
| $30,000 to $34,999 | 16 (1.6%) | 15 (1.6%) |
| $35,000 to $39,999 | 18 (1.8%) | 21 (2.3%) |
| $40,000 to $44,999 | 15 (1.5%) | 0 (0.0%) |
| $45,000 to $49,999 | 0 (0.0%) | 141 (15.4%) |
| $50,000 to $54,999 | 72 (7.0%) | 22 (2.4%) |
| $55,000 to $64,999 | 129 (12.6%) | 78 (8.5%) |
| $65,000 to $74,999 | 68 (6.6%) | 83 (9.1%) |
| $75,000 to $99,999 | 166 (16.2%) | 107 (11.7%) |
| $100,000+ | 308 (30.0%) | 67 (7.3%) |
| Total | 1,025 (100.0%) | 914 (100.0%) |
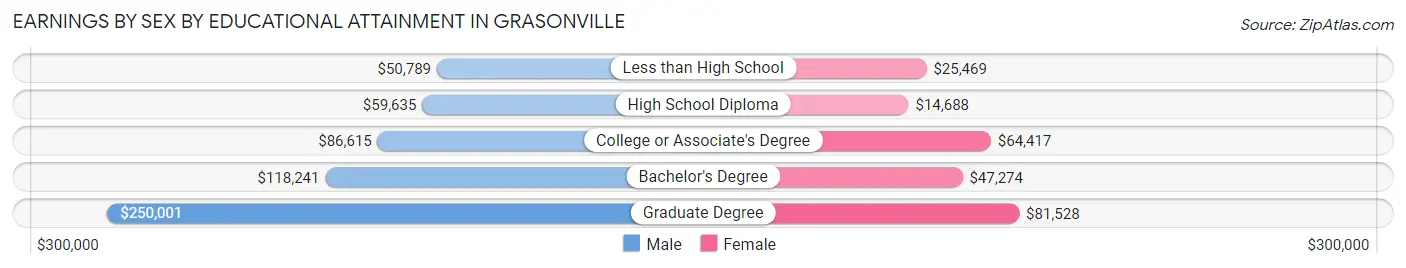
Earnings by Sex by Educational Attainment in Grasonville
Average earnings in Grasonville are $82,014 for men and $46,241 for women, a difference of 43.6%. Men with an educational attainment of graduate degree enjoy the highest average annual earnings of $250,001, while those with less than high school education earn the least with $50,789. Women with an educational attainment of graduate degree earn the most with the average annual earnings of $81,528, while those with high school diploma education have the smallest earnings of $14,688.
| Educational Attainment | Male Income | Female Income |
| Less than High School | $50,789 | $25,469 |
| High School Diploma | $59,635 | $14,688 |
| College or Associate's Degree | $86,615 | $64,417 |
| Bachelor's Degree | $118,241 | $47,274 |
| Graduate Degree | $250,001 | $81,528 |
| Total | $82,014 | $46,241 |
Family Income in Grasonville
Family Income Brackets in Grasonville
According to the Grasonville family income data, there are 263 families falling into the $100,000 to $149,999 income range, which is the most common income bracket and makes up 29.6% of all families.
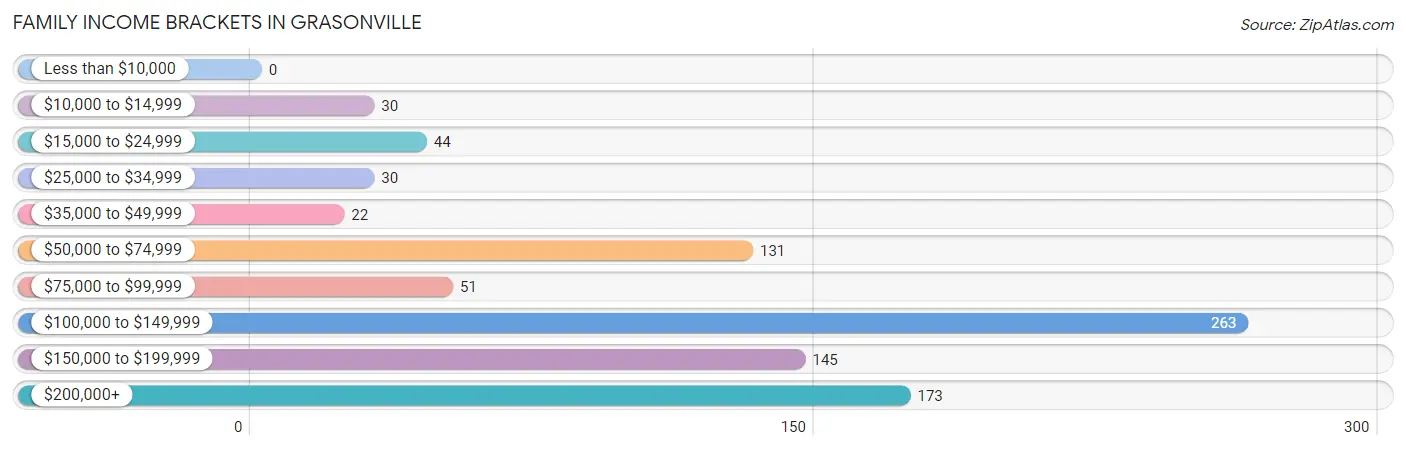
| Income Bracket | # Families | % Families |
| Less than $10,000 | 0 | 0.0% |
| $10,000 to $14,999 | 30 | 3.4% |
| $15,000 to $24,999 | 44 | 4.9% |
| $25,000 to $34,999 | 30 | 3.4% |
| $35,000 to $49,999 | 22 | 2.5% |
| $50,000 to $74,999 | 131 | 14.7% |
| $75,000 to $99,999 | 51 | 5.7% |
| $100,000 to $149,999 | 263 | 29.6% |
| $150,000 to $199,999 | 145 | 16.3% |
| $200,000+ | 173 | 19.5% |
Family Income by Famaliy Size in Grasonville
5-person families (48 | 5.4%) account for the highest median family income in Grasonville with $183,981 per family, while 3-person families (208 | 23.4%) have the highest median income of $55,933 per family member.
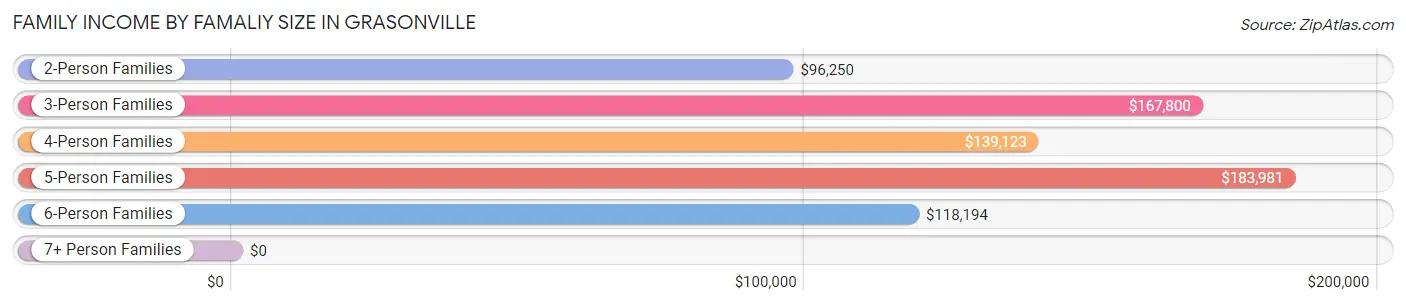
| Income Bracket | # Families | Median Income |
| 2-Person Families | 395 (44.4%) | $96,250 |
| 3-Person Families | 208 (23.4%) | $167,800 |
| 4-Person Families | 191 (21.5%) | $139,123 |
| 5-Person Families | 48 (5.4%) | $183,981 |
| 6-Person Families | 35 (3.9%) | $118,194 |
| 7+ Person Families | 12 (1.3%) | $0 |
| Total | 889 (100.0%) | $132,656 |
Family Income by Number of Earners in Grasonville
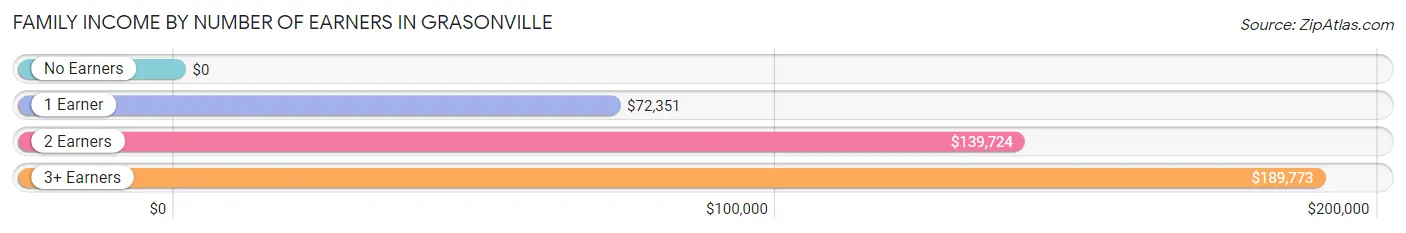
| Number of Earners | # Families | Median Income |
| No Earners | 42 (4.7%) | $0 |
| 1 Earner | 360 (40.5%) | $72,351 |
| 2 Earners | 385 (43.3%) | $139,724 |
| 3+ Earners | 102 (11.5%) | $189,773 |
| Total | 889 (100.0%) | $132,656 |
Household Income in Grasonville
Household Income Brackets in Grasonville
With 325 households falling in the category, the $100,000 to $149,999 income range is the most frequent in Grasonville, accounting for 26.2% of all households. In contrast, only 24 households (1.9%) fall into the $35,000 to $49,999 income bracket, making it the least populous group.
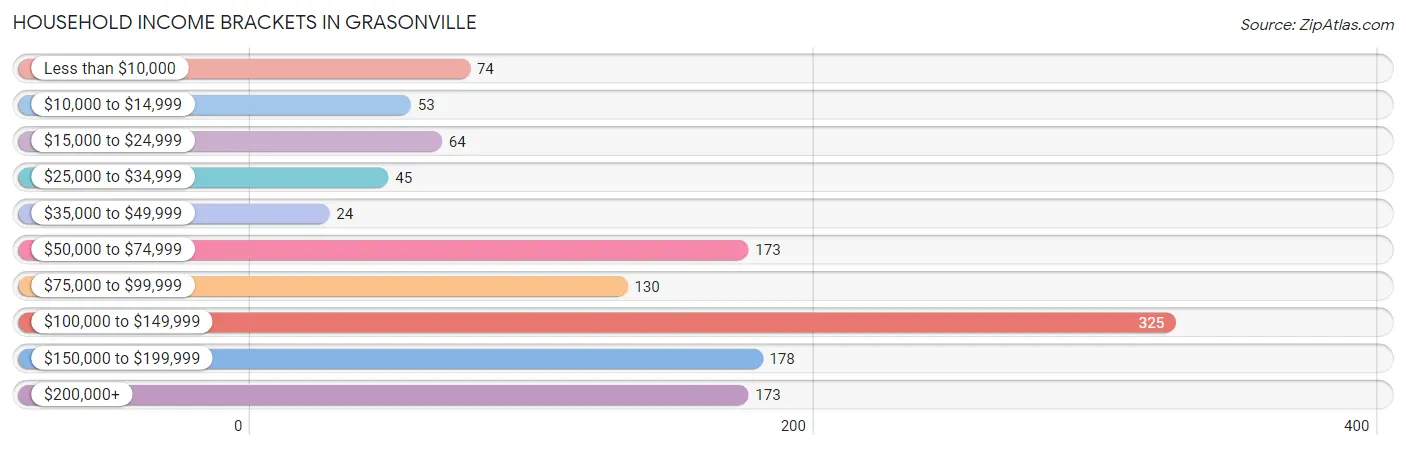
| Income Bracket | # Households | % Households |
| Less than $10,000 | 74 | 6.0% |
| $10,000 to $14,999 | 53 | 4.3% |
| $15,000 to $24,999 | 64 | 5.2% |
| $25,000 to $34,999 | 45 | 3.6% |
| $35,000 to $49,999 | 24 | 1.9% |
| $50,000 to $74,999 | 173 | 14.0% |
| $75,000 to $99,999 | 130 | 10.5% |
| $100,000 to $149,999 | 325 | 26.2% |
| $150,000 to $199,999 | 178 | 14.4% |
| $200,000+ | 173 | 14.0% |
Household Income by Householder Age in Grasonville
The median household income in Grasonville is $109,375, with the highest median household income of $125,875 found in the 45 to 64 years age bracket for the primary householder. A total of 717 households (57.9%) fall into this category. Meanwhile, the 15 to 24 years age bracket for the primary householder has the lowest median household income of $0, with 13 households (1.1%) in this group.
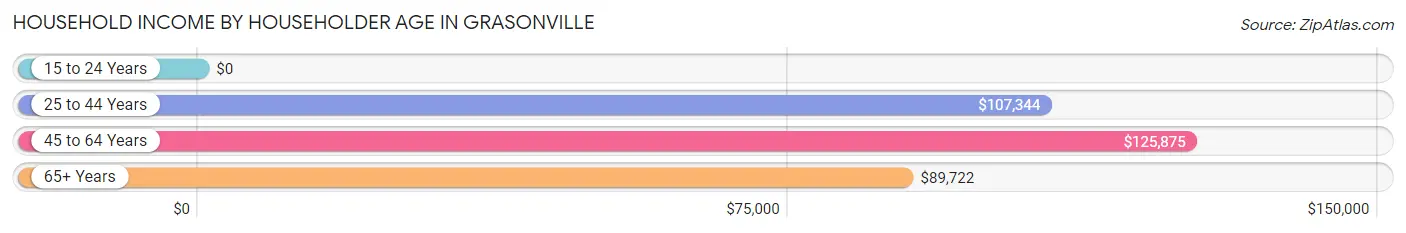
| Income Bracket | # Households | Median Income |
| 15 to 24 Years | 13 (1.1%) | $0 |
| 25 to 44 Years | 351 (28.3%) | $107,344 |
| 45 to 64 Years | 717 (57.9%) | $125,875 |
| 65+ Years | 158 (12.8%) | $89,722 |
| Total | 1,239 (100.0%) | $109,375 |
Poverty in Grasonville
Income Below Poverty by Sex and Age in Grasonville
With 16.1% poverty level for males and 13.9% for females among the residents of Grasonville, 5 year old males and 55 to 64 year old females are the most vulnerable to poverty, with 28 males (100.0%) and 103 females (38.4%) in their respective age groups living below the poverty level.
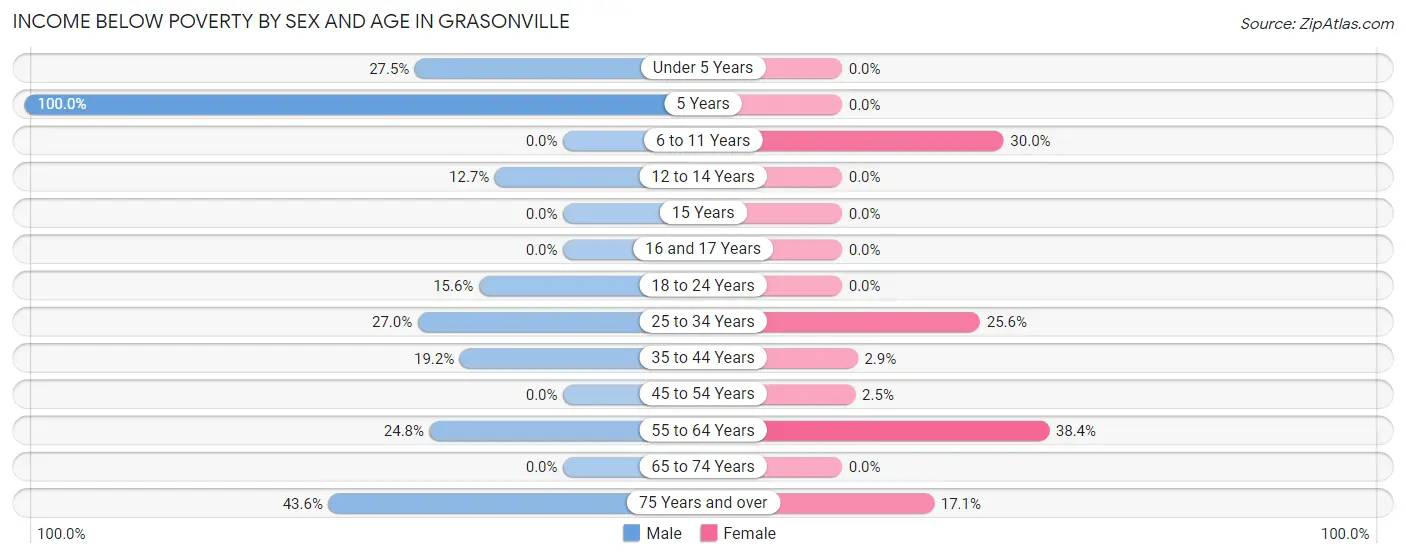
| Age Bracket | Male | Female |
| Under 5 Years | 11 (27.5%) | 0 (0.0%) |
| 5 Years | 28 (100.0%) | 0 (0.0%) |
| 6 to 11 Years | 0 (0.0%) | 60 (30.0%) |
| 12 to 14 Years | 28 (12.7%) | 0 (0.0%) |
| 15 Years | 0 (0.0%) | 0 (0.0%) |
| 16 and 17 Years | 0 (0.0%) | 0 (0.0%) |
| 18 to 24 Years | 15 (15.6%) | 0 (0.0%) |
| 25 to 34 Years | 65 (27.0%) | 41 (25.6%) |
| 35 to 44 Years | 37 (19.2%) | 6 (2.9%) |
| 45 to 54 Years | 0 (0.0%) | 8 (2.5%) |
| 55 to 64 Years | 56 (24.8%) | 103 (38.4%) |
| 65 to 74 Years | 0 (0.0%) | 0 (0.0%) |
| 75 Years and over | 27 (43.5%) | 14 (17.1%) |
| Total | 267 (16.1%) | 232 (13.9%) |
Income Above Poverty by Sex and Age in Grasonville
According to the poverty statistics in Grasonville, males aged 6 to 11 years and females aged under 5 years are the age groups that are most secure financially, with 100.0% of males and 100.0% of females in these age groups living above the poverty line.
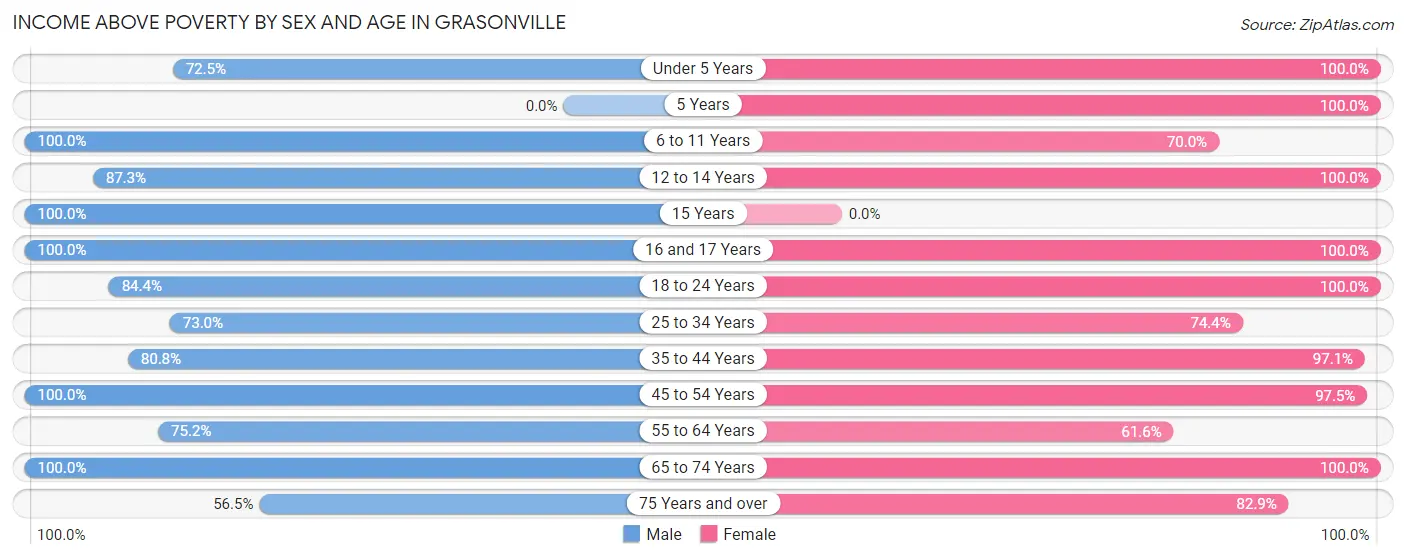
| Age Bracket | Male | Female |
| Under 5 Years | 29 (72.5%) | 102 (100.0%) |
| 5 Years | 0 (0.0%) | 10 (100.0%) |
| 6 to 11 Years | 59 (100.0%) | 140 (70.0%) |
| 12 to 14 Years | 193 (87.3%) | 108 (100.0%) |
| 15 Years | 36 (100.0%) | 0 (0.0%) |
| 16 and 17 Years | 10 (100.0%) | 24 (100.0%) |
| 18 to 24 Years | 81 (84.4%) | 78 (100.0%) |
| 25 to 34 Years | 176 (73.0%) | 119 (74.4%) |
| 35 to 44 Years | 156 (80.8%) | 200 (97.1%) |
| 45 to 54 Years | 327 (100.0%) | 314 (97.5%) |
| 55 to 64 Years | 170 (75.2%) | 165 (61.6%) |
| 65 to 74 Years | 122 (100.0%) | 108 (100.0%) |
| 75 Years and over | 35 (56.5%) | 68 (82.9%) |
| Total | 1,394 (83.9%) | 1,436 (86.1%) |
Income Below Poverty Among Married-Couple Families in Grasonville
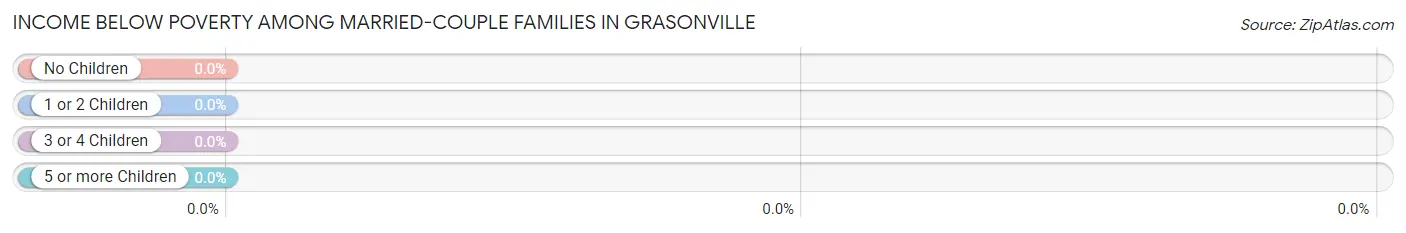
| Children | Above Poverty | Below Poverty |
| No Children | 259 (100.0%) | 0 (0.0%) |
| 1 or 2 Children | 239 (100.0%) | 0 (0.0%) |
| 3 or 4 Children | 91 (100.0%) | 0 (0.0%) |
| 5 or more Children | 0 (0.0%) | 0 (0.0%) |
| Total | 589 (100.0%) | 0 (0.0%) |
Income Below Poverty Among Single-Parent Households in Grasonville
According to the poverty data in Grasonville, 13.9% or 15 single-father households and 30.7% or 59 single-mother households are living below the poverty line. Among single-father households, those with 1 or 2 children have the highest poverty rate, with 15 households (39.5%) experiencing poverty. Likewise, among single-mother households, those with 1 or 2 children have the highest poverty rate, with 59 households (60.8%) falling below the poverty line.
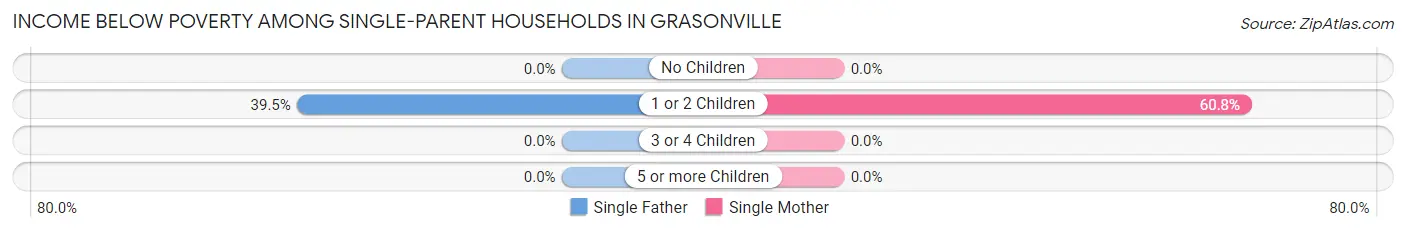
| Children | Single Father | Single Mother |
| No Children | 0 (0.0%) | 0 (0.0%) |
| 1 or 2 Children | 15 (39.5%) | 59 (60.8%) |
| 3 or 4 Children | 0 (0.0%) | 0 (0.0%) |
| 5 or more Children | 0 (0.0%) | 0 (0.0%) |
| Total | 15 (13.9%) | 59 (30.7%) |
Income Below Poverty Among Married-Couple vs Single-Parent Households in Grasonville
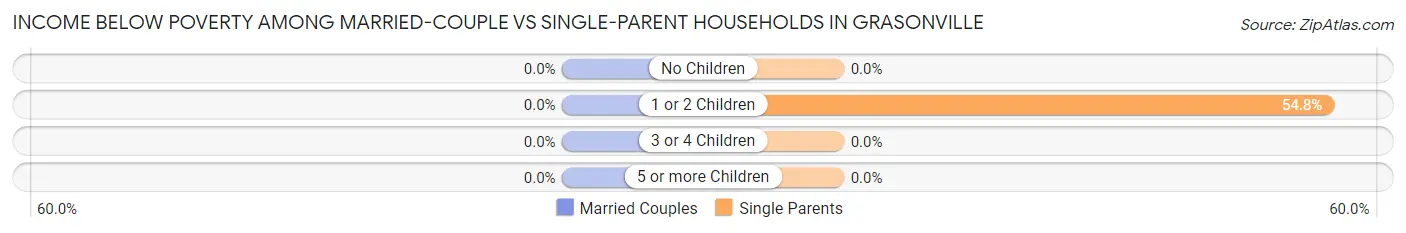
| Children | Married-Couple Families | Single-Parent Households |
| No Children | 0 (0.0%) | 0 (0.0%) |
| 1 or 2 Children | 0 (0.0%) | 74 (54.8%) |
| 3 or 4 Children | 0 (0.0%) | 0 (0.0%) |
| 5 or more Children | 0 (0.0%) | 0 (0.0%) |
| Total | 0 (0.0%) | 74 (24.7%) |
Race in Grasonville
The most populous races in Grasonville are White / Caucasian (2,451 | 73.6%), Two or more Races (498 | 14.9%), and Black / African American (284 | 8.5%).
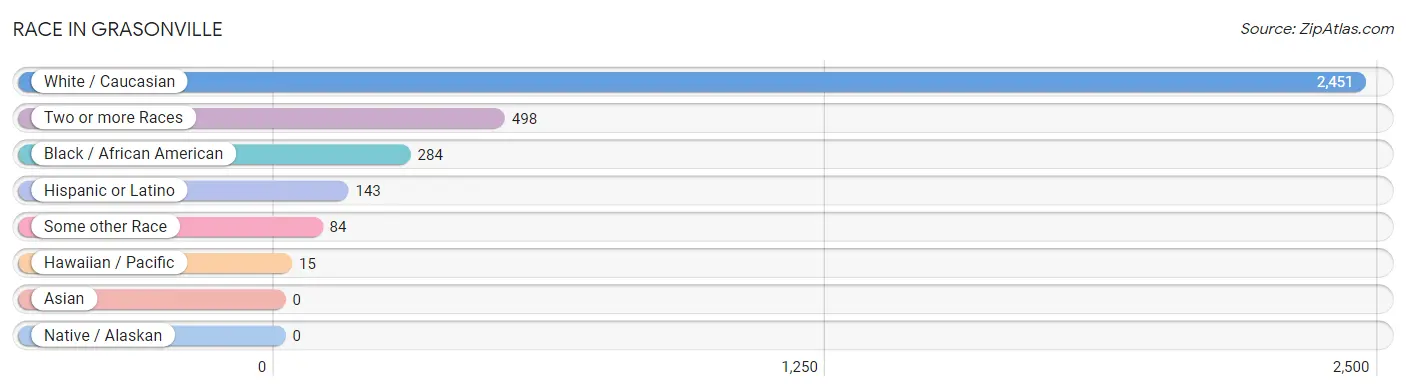
| Race | # Population | % Population |
| Asian | 0 | 0.0% |
| Black / African American | 284 | 8.5% |
| Hawaiian / Pacific | 15 | 0.4% |
| Hispanic or Latino | 143 | 4.3% |
| Native / Alaskan | 0 | 0.0% |
| White / Caucasian | 2,451 | 73.6% |
| Two or more Races | 498 | 14.9% |
| Some other Race | 84 | 2.5% |
| Total | 3,332 | 100.0% |
Ancestry in Grasonville
The most populous ancestries reported in Grasonville are English (914 | 27.4%), German (646 | 19.4%), Irish (421 | 12.6%), Italian (421 | 12.6%), and Swedish (141 | 4.2%), together accounting for 76.3% of all Grasonville residents.
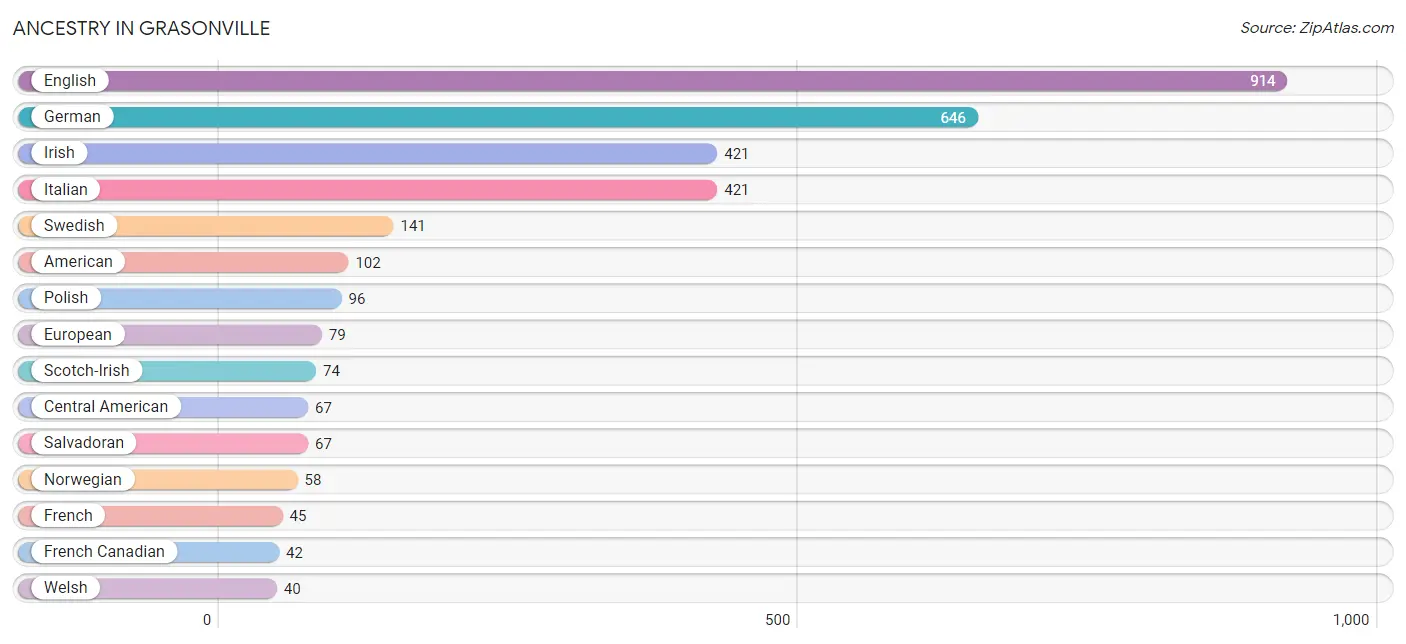
| Ancestry | # Population | % Population |
| American | 102 | 3.1% |
| Basque | 15 | 0.4% |
| Belgian | 7 | 0.2% |
| Blackfeet | 3 | 0.1% |
| British | 15 | 0.4% |
| Central American | 67 | 2.0% |
| Colombian | 15 | 0.4% |
| Czech | 13 | 0.4% |
| Dutch | 30 | 0.9% |
| Eastern European | 15 | 0.4% |
| Ecuadorian | 17 | 0.5% |
| English | 914 | 27.4% |
| European | 79 | 2.4% |
| French | 45 | 1.3% |
| French Canadian | 42 | 1.3% |
| German | 646 | 19.4% |
| Greek | 15 | 0.4% |
| Hungarian | 24 | 0.7% |
| Irish | 421 | 12.6% |
| Italian | 421 | 12.6% |
| Lithuanian | 26 | 0.8% |
| Mexican | 15 | 0.4% |
| Native Hawaiian | 15 | 0.4% |
| Northern European | 29 | 0.9% |
| Norwegian | 58 | 1.7% |
| Polish | 96 | 2.9% |
| Puerto Rican | 14 | 0.4% |
| Russian | 22 | 0.7% |
| Salvadoran | 67 | 2.0% |
| Scotch-Irish | 74 | 2.2% |
| Scottish | 33 | 1.0% |
| Sierra Leonean | 4 | 0.1% |
| South American | 32 | 1.0% |
| Spaniard | 15 | 0.4% |
| Subsaharan African | 4 | 0.1% |
| Swedish | 141 | 4.2% |
| Welsh | 40 | 1.2% | View All 37 Rows |
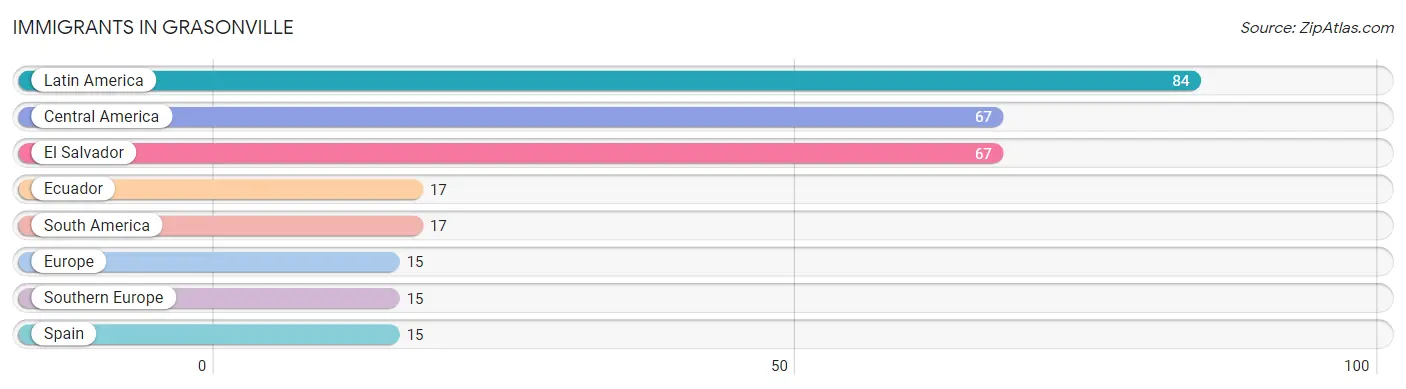
Immigrants in Grasonville
The most numerous immigrant groups reported in Grasonville came from Latin America (84 | 2.5%), Central America (67 | 2.0%), El Salvador (67 | 2.0%), Ecuador (17 | 0.5%), and South America (17 | 0.5%), together accounting for 7.6% of all Grasonville residents.
| Immigration Origin | # Population | % Population |
| Central America | 67 | 2.0% |
| Ecuador | 17 | 0.5% |
| El Salvador | 67 | 2.0% |
| Europe | 15 | 0.4% |
| Latin America | 84 | 2.5% |
| South America | 17 | 0.5% |
| Southern Europe | 15 | 0.4% |
| Spain | 15 | 0.4% | View All 8 Rows |
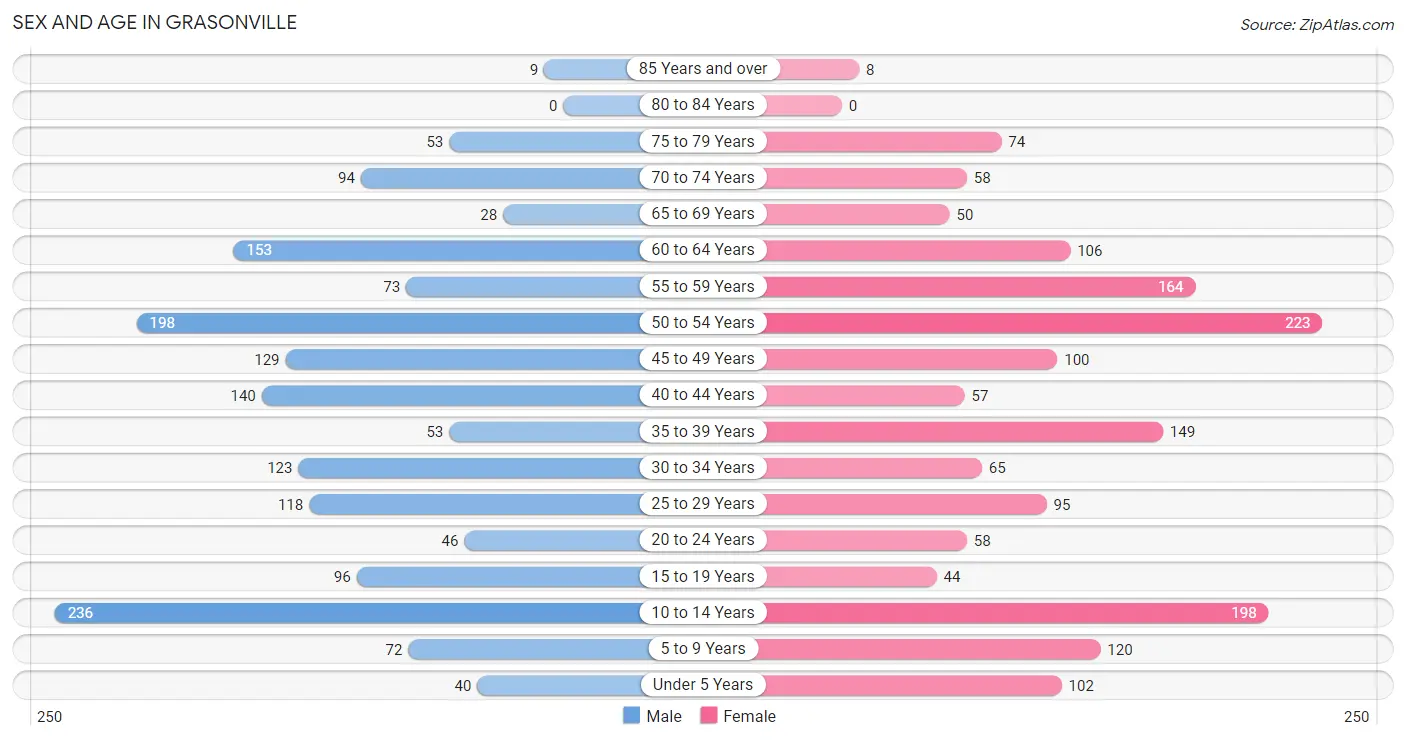
Sex and Age in Grasonville
Sex and Age in Grasonville
The most populous age groups in Grasonville are 10 to 14 Years (236 | 14.2%) for men and 50 to 54 Years (223 | 13.4%) for women.
| Age Bracket | Male | Female |
| Under 5 Years | 40 (2.4%) | 102 (6.1%) |
| 5 to 9 Years | 72 (4.3%) | 120 (7.2%) |
| 10 to 14 Years | 236 (14.2%) | 198 (11.8%) |
| 15 to 19 Years | 96 (5.8%) | 44 (2.6%) |
| 20 to 24 Years | 46 (2.8%) | 58 (3.5%) |
| 25 to 29 Years | 118 (7.1%) | 95 (5.7%) |
| 30 to 34 Years | 123 (7.4%) | 65 (3.9%) |
| 35 to 39 Years | 53 (3.2%) | 149 (8.9%) |
| 40 to 44 Years | 140 (8.4%) | 57 (3.4%) |
| 45 to 49 Years | 129 (7.8%) | 100 (6.0%) |
| 50 to 54 Years | 198 (11.9%) | 223 (13.4%) |
| 55 to 59 Years | 73 (4.4%) | 164 (9.8%) |
| 60 to 64 Years | 153 (9.2%) | 106 (6.3%) |
| 65 to 69 Years | 28 (1.7%) | 50 (3.0%) |
| 70 to 74 Years | 94 (5.7%) | 58 (3.5%) |
| 75 to 79 Years | 53 (3.2%) | 74 (4.4%) |
| 80 to 84 Years | 0 (0.0%) | 0 (0.0%) |
| 85 Years and over | 9 (0.5%) | 8 (0.5%) |
| Total | 1,661 (100.0%) | 1,671 (100.0%) |
Families and Households in Grasonville
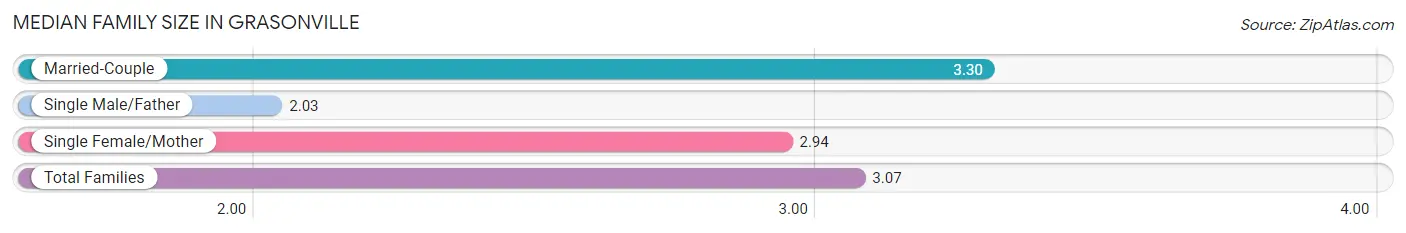
Median Family Size in Grasonville
The median family size in Grasonville is 3.07 persons per family, with married-couple families (589 | 66.2%) accounting for the largest median family size of 3.3 persons per family. On the other hand, single male/father families (108 | 12.1%) represent the smallest median family size with 2.03 persons per family.
| Family Type | # Families | Family Size |
| Married-Couple | 589 (66.2%) | 3.30 |
| Single Male/Father | 108 (12.1%) | 2.03 |
| Single Female/Mother | 192 (21.6%) | 2.94 |
| Total Families | 889 (100.0%) | 3.07 |
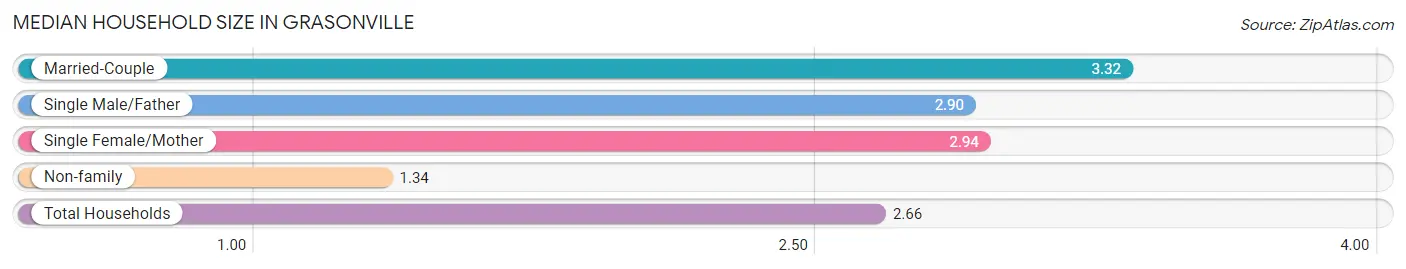
Median Household Size in Grasonville
The median household size in Grasonville is 2.66 persons per household, with married-couple households (589 | 47.5%) accounting for the largest median household size of 3.32 persons per household. non-family households (350 | 28.2%) represent the smallest median household size with 1.34 persons per household.
| Household Type | # Households | Household Size |
| Married-Couple | 589 (47.5%) | 3.32 |
| Single Male/Father | 108 (8.7%) | 2.90 |
| Single Female/Mother | 192 (15.5%) | 2.94 |
| Non-family | 350 (28.2%) | 1.34 |
| Total Households | 1,239 (100.0%) | 2.66 |
Household Size by Marriage Status in Grasonville
Out of a total of 1,239 households in Grasonville, 889 (71.8%) are family households, while 350 (28.2%) are nonfamily households. The most numerous type of family households are 2-person households, comprising 315, and the most common type of nonfamily households are 1-person households, comprising 253.
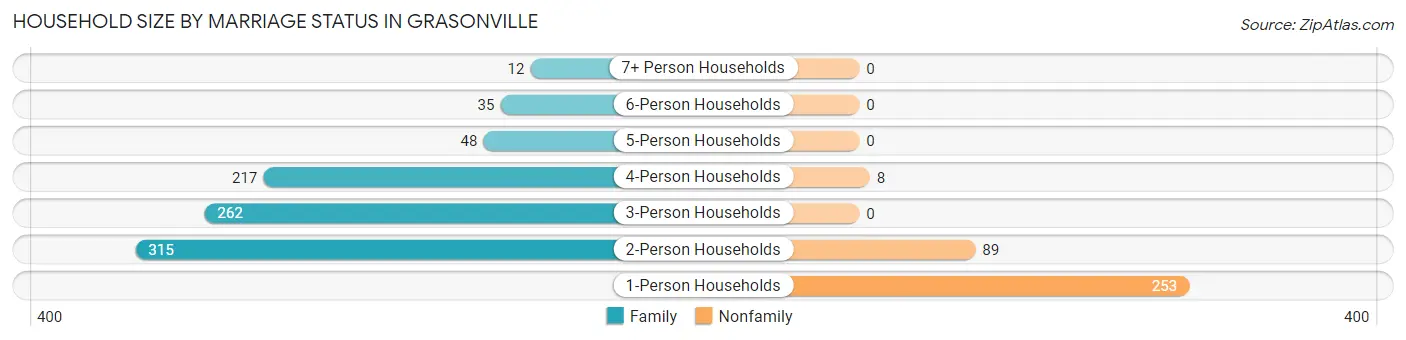
| Household Size | Family Households | Nonfamily Households |
| 1-Person Households | - | 253 (20.4%) |
| 2-Person Households | 315 (25.4%) | 89 (7.2%) |
| 3-Person Households | 262 (21.1%) | 0 (0.0%) |
| 4-Person Households | 217 (17.5%) | 8 (0.6%) |
| 5-Person Households | 48 (3.9%) | 0 (0.0%) |
| 6-Person Households | 35 (2.8%) | 0 (0.0%) |
| 7+ Person Households | 12 (1.0%) | 0 (0.0%) |
| Total | 889 (71.8%) | 350 (28.2%) |
Female Fertility in Grasonville
Fertility by Age in Grasonville
Average fertility rate in Grasonville is 14.0 births per 1,000 women. Women in the age bracket of 35 to 50 years have the highest fertility rate with 23.0 births per 1,000 women. Women in the age bracket of 35 to 50 years acount for 100.0% of all women with births.
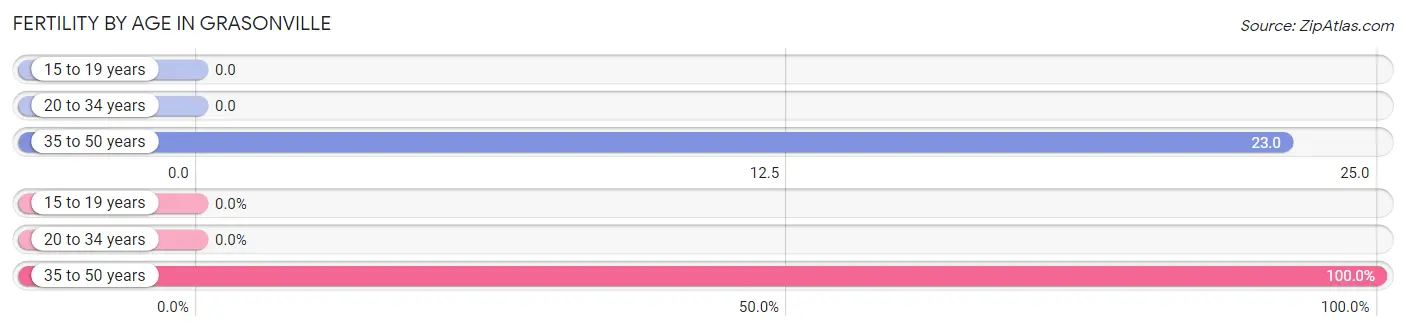
| Age Bracket | Women with Births | Births / 1,000 Women |
| 15 to 19 years | 0 (0.0%) | 0.0 |
| 20 to 34 years | 0 (0.0%) | 0.0 |
| 35 to 50 years | 10 (100.0%) | 23.0 |
| Total | 10 (100.0%) | 14.0 |
Fertility by Age by Marriage Status in Grasonville
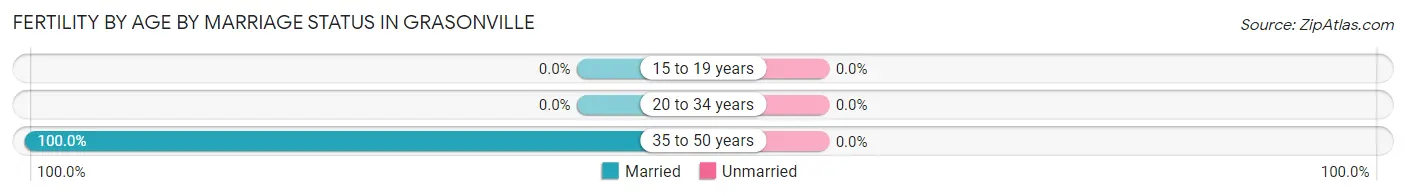
| Age Bracket | Married | Unmarried |
| 15 to 19 years | 0 (0.0%) | 0 (0.0%) |
| 20 to 34 years | 0 (0.0%) | 0 (0.0%) |
| 35 to 50 years | 10 (100.0%) | 0 (0.0%) |
| Total | 10 (100.0%) | 0 (0.0%) |
Fertility by Education in Grasonville
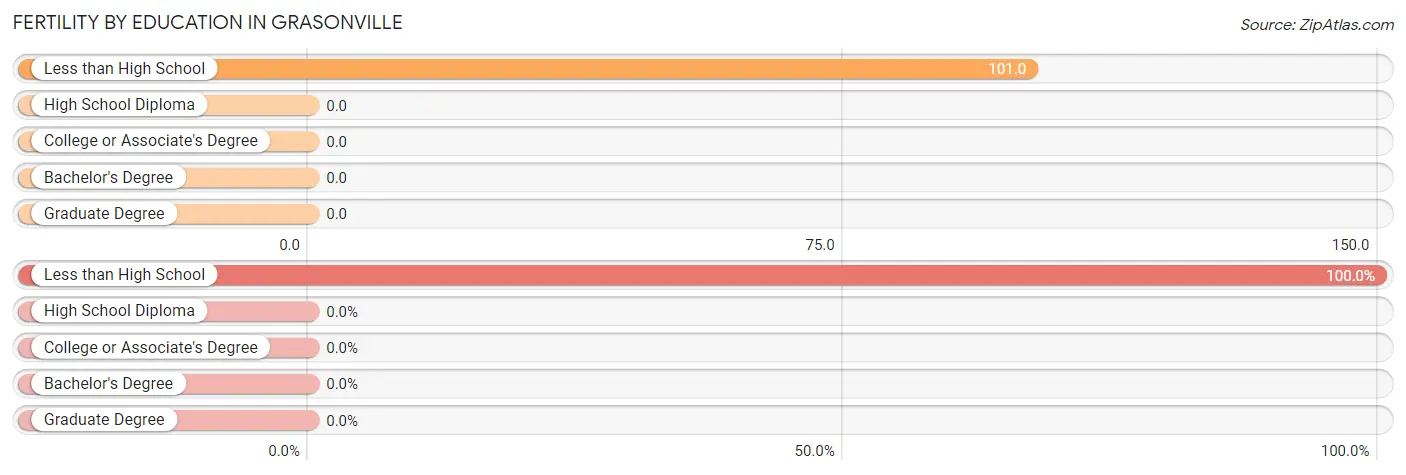
| Educational Attainment | Women with Births | Births / 1,000 Women |
| Less than High School | 10 (100.0%) | 101.0 |
| High School Diploma | 0 (0.0%) | 0.0 |
| College or Associate's Degree | 0 (0.0%) | 0.0 |
| Bachelor's Degree | 0 (0.0%) | 0.0 |
| Graduate Degree | 0 (0.0%) | 0.0 |
| Total | 10 (100.0%) | 14.0 |
Fertility by Education by Marriage Status in Grasonville
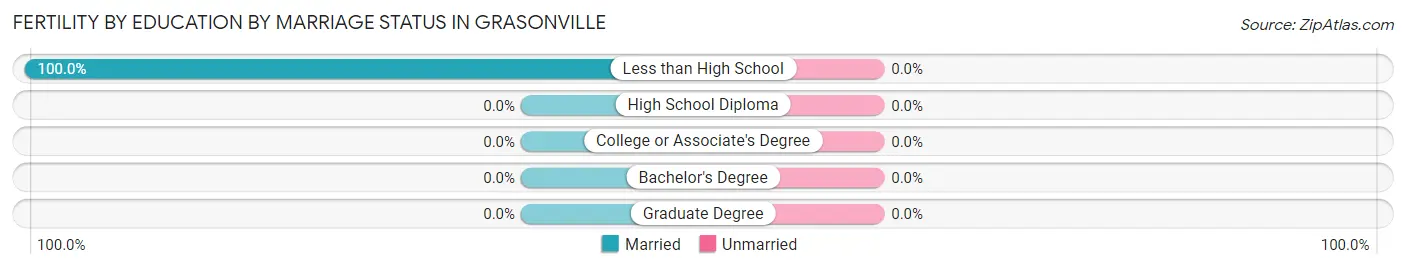
| Educational Attainment | Married | Unmarried |
| Less than High School | 10 (100.0%) | 0 (0.0%) |
| High School Diploma | 0 (0.0%) | 0 (0.0%) |
| College or Associate's Degree | 0 (0.0%) | 0 (0.0%) |
| Bachelor's Degree | 0 (0.0%) | 0 (0.0%) |
| Graduate Degree | 0 (0.0%) | 0 (0.0%) |
| Total | 10 (100.0%) | 0 (0.0%) |
Employment Characteristics in Grasonville
Employment by Class of Employer in Grasonville
Among the 1,686 employed individuals in Grasonville, private company employees (1,164 | 69.0%), self-employed (not incorporated) (142 | 8.4%), and local government employees (110 | 6.5%) make up the most common classes of employment.
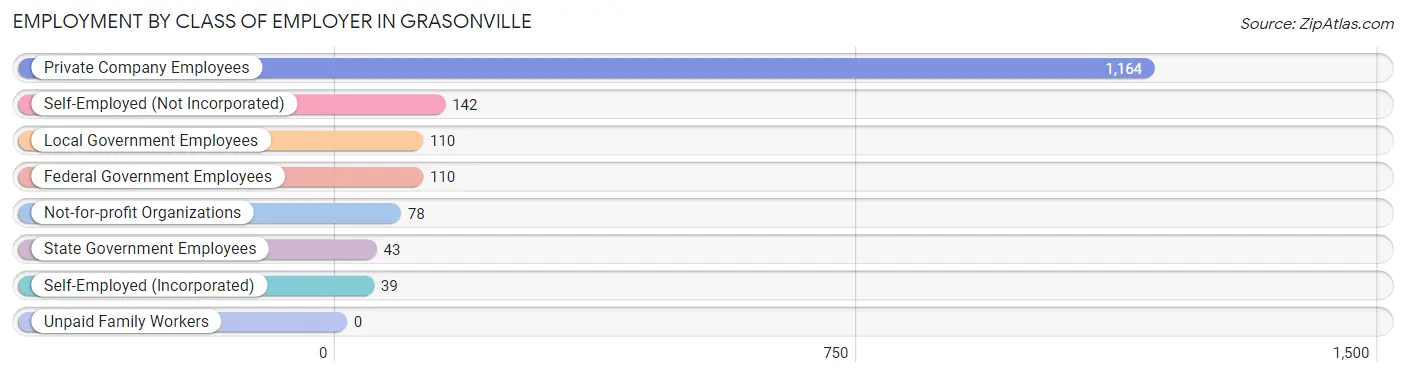
| Employer Class | # Employees | % Employees |
| Private Company Employees | 1,164 | 69.0% |
| Self-Employed (Incorporated) | 39 | 2.3% |
| Self-Employed (Not Incorporated) | 142 | 8.4% |
| Not-for-profit Organizations | 78 | 4.6% |
| Local Government Employees | 110 | 6.5% |
| State Government Employees | 43 | 2.5% |
| Federal Government Employees | 110 | 6.5% |
| Unpaid Family Workers | 0 | 0.0% |
| Total | 1,686 | 100.0% |
Employment Status by Age in Grasonville
According to the labor force statistics for Grasonville, out of the total population over 16 years of age (2,528), 72.5% or 1,833 individuals are in the labor force, with 3.0% or 55 of them unemployed. The age group with the highest labor force participation rate is 45 to 54 years, with 90.3% or 587 individuals in the labor force. Within the labor force, the 25 to 29 years age range has the highest percentage of unemployed individuals, with 14.3% or 27 of them being unemployed.
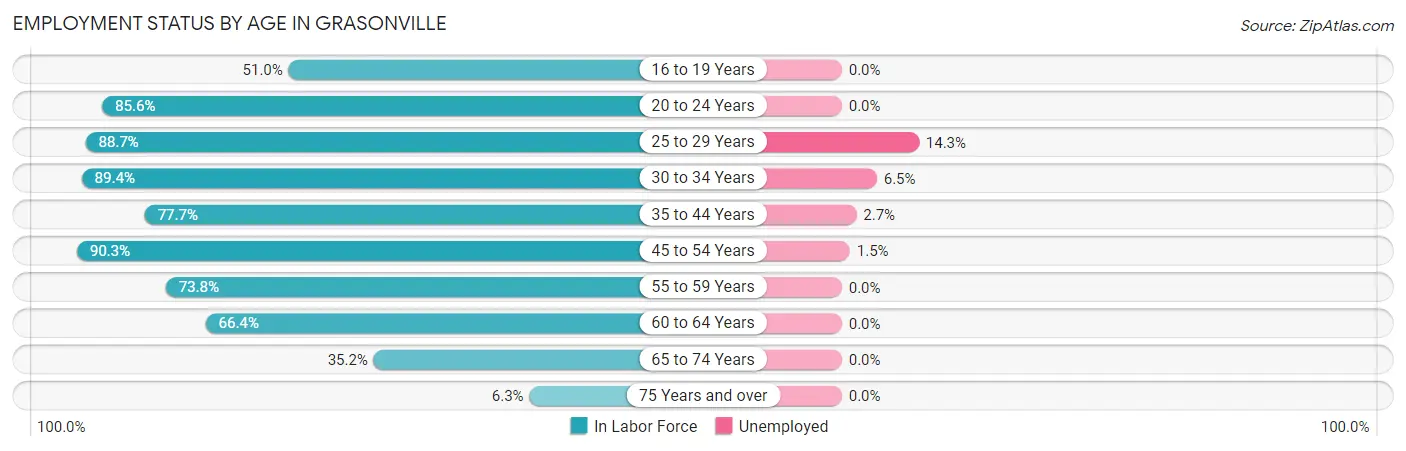
| Age Bracket | In Labor Force | Unemployed |
| 16 to 19 Years | 53 (51.0%) | 0 (0.0%) |
| 20 to 24 Years | 89 (85.6%) | 0 (0.0%) |
| 25 to 29 Years | 189 (88.7%) | 27 (14.3%) |
| 30 to 34 Years | 168 (89.4%) | 11 (6.5%) |
| 35 to 44 Years | 310 (77.7%) | 8 (2.7%) |
| 45 to 54 Years | 587 (90.3%) | 9 (1.5%) |
| 55 to 59 Years | 175 (73.8%) | 0 (0.0%) |
| 60 to 64 Years | 172 (66.4%) | 0 (0.0%) |
| 65 to 74 Years | 81 (35.2%) | 0 (0.0%) |
| 75 Years and over | 9 (6.3%) | 0 (0.0%) |
| Total | 1,833 (72.5%) | 55 (3.0%) |
Employment Status by Educational Attainment in Grasonville
According to labor force statistics for Grasonville, 82.3% of individuals (1,602) out of the total population between 25 and 64 years of age (1,946) are in the labor force, with 3.4% or 54 of them being unemployed. The group with the highest labor force participation rate are those with the educational attainment of less than high school, with 96.5% or 191 individuals in the labor force. Within the labor force, individuals with bachelor's degree or higher education have the highest percentage of unemployment, with 5.9% or 33 of them being unemployed.
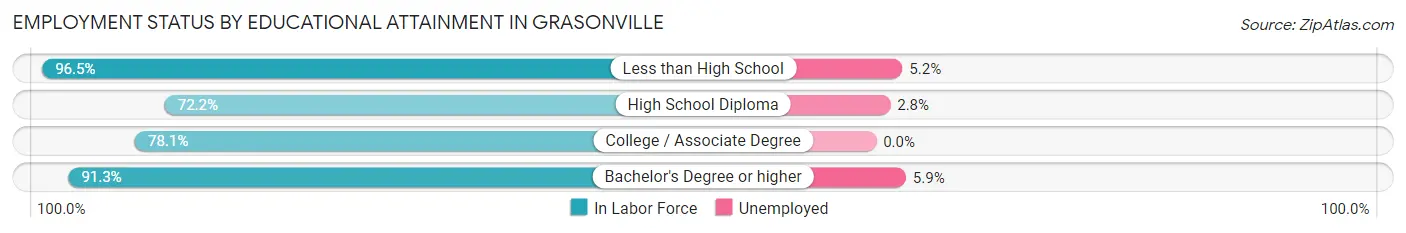
| Educational Attainment | In Labor Force | Unemployed |
| Less than High School | 191 (96.5%) | 10 (5.2%) |
| High School Diploma | 434 (72.2%) | 17 (2.8%) |
| College / Associate Degree | 422 (78.1%) | 0 (0.0%) |
| Bachelor's Degree or higher | 554 (91.3%) | 36 (5.9%) |
| Total | 1,602 (82.3%) | 66 (3.4%) |
Employment Occupations by Sex in Grasonville
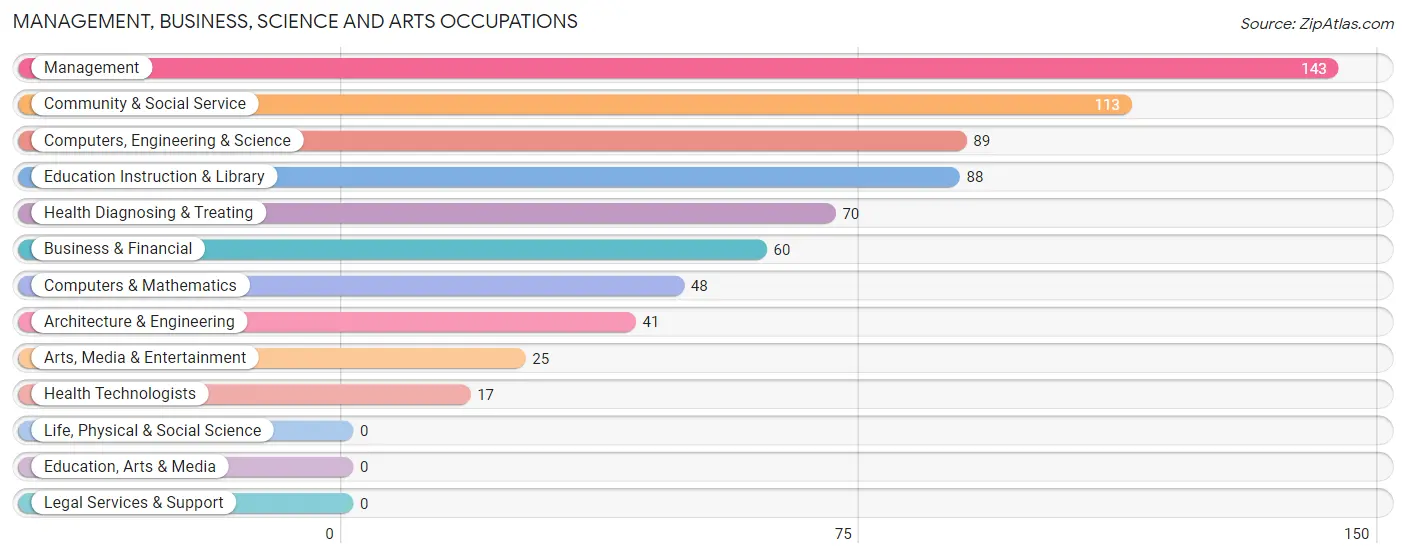
Management, Business, Science and Arts Occupations
The most common Management, Business, Science and Arts occupations in Grasonville are Management (143 | 8.1%), Community & Social Service (113 | 6.4%), Computers, Engineering & Science (89 | 5.1%), Education Instruction & Library (88 | 5.0%), and Health Diagnosing & Treating (70 | 4.0%).
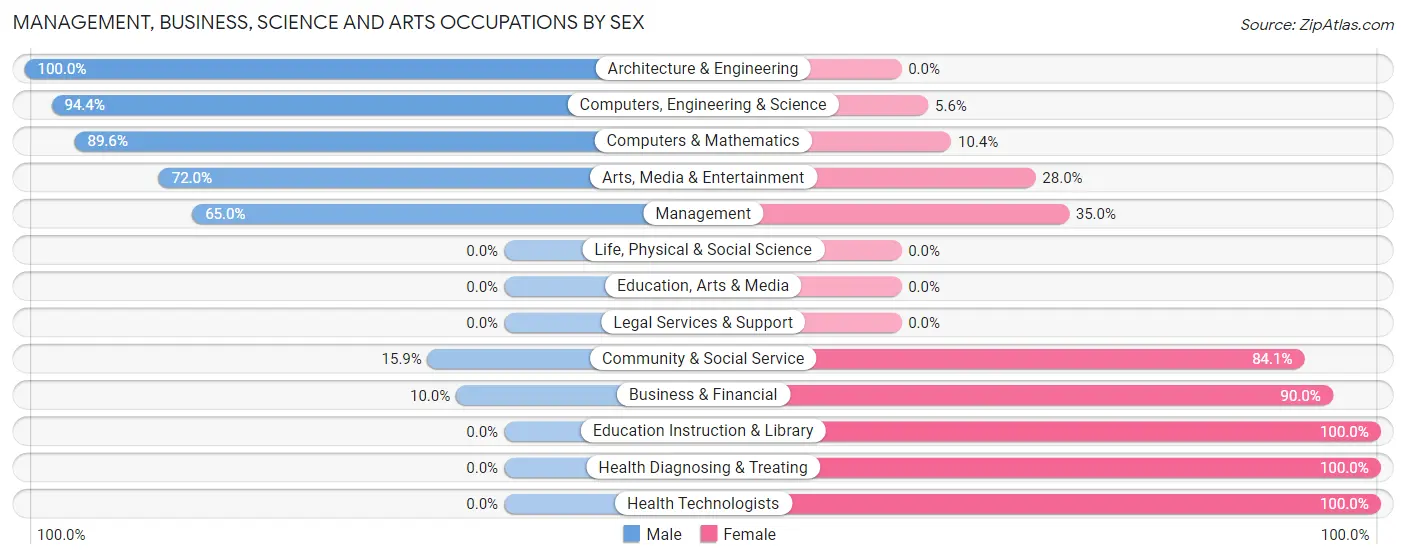
Management, Business, Science and Arts Occupations by Sex
Within the Management, Business, Science and Arts occupations in Grasonville, the most male-oriented occupations are Architecture & Engineering (100.0%), Computers, Engineering & Science (94.4%), and Computers & Mathematics (89.6%), while the most female-oriented occupations are Education Instruction & Library (100.0%), Health Diagnosing & Treating (100.0%), and Health Technologists (100.0%).
| Occupation | Male | Female |
| Management | 93 (65.0%) | 50 (35.0%) |
| Business & Financial | 6 (10.0%) | 54 (90.0%) |
| Computers, Engineering & Science | 84 (94.4%) | 5 (5.6%) |
| Computers & Mathematics | 43 (89.6%) | 5 (10.4%) |
| Architecture & Engineering | 41 (100.0%) | 0 (0.0%) |
| Life, Physical & Social Science | 0 (0.0%) | 0 (0.0%) |
| Community & Social Service | 18 (15.9%) | 95 (84.1%) |
| Education, Arts & Media | 0 (0.0%) | 0 (0.0%) |
| Legal Services & Support | 0 (0.0%) | 0 (0.0%) |
| Education Instruction & Library | 0 (0.0%) | 88 (100.0%) |
| Arts, Media & Entertainment | 18 (72.0%) | 7 (28.0%) |
| Health Diagnosing & Treating | 0 (0.0%) | 70 (100.0%) |
| Health Technologists | 0 (0.0%) | 17 (100.0%) |
| Total (Category) | 201 (42.3%) | 274 (57.7%) |
| Total (Overall) | 893 (50.8%) | 863 (49.1%) |
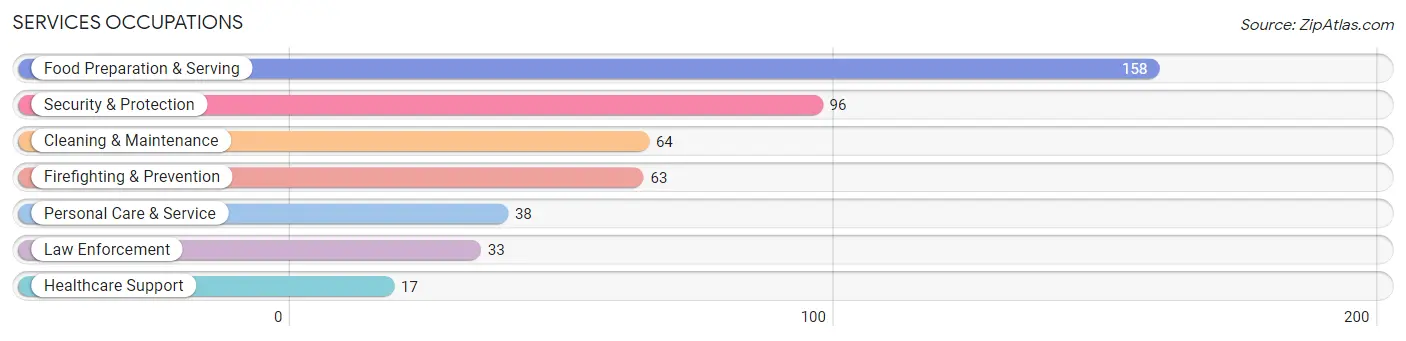
Services Occupations
The most common Services occupations in Grasonville are Food Preparation & Serving (158 | 9.0%), Security & Protection (96 | 5.5%), Cleaning & Maintenance (64 | 3.6%), Firefighting & Prevention (63 | 3.6%), and Personal Care & Service (38 | 2.2%).
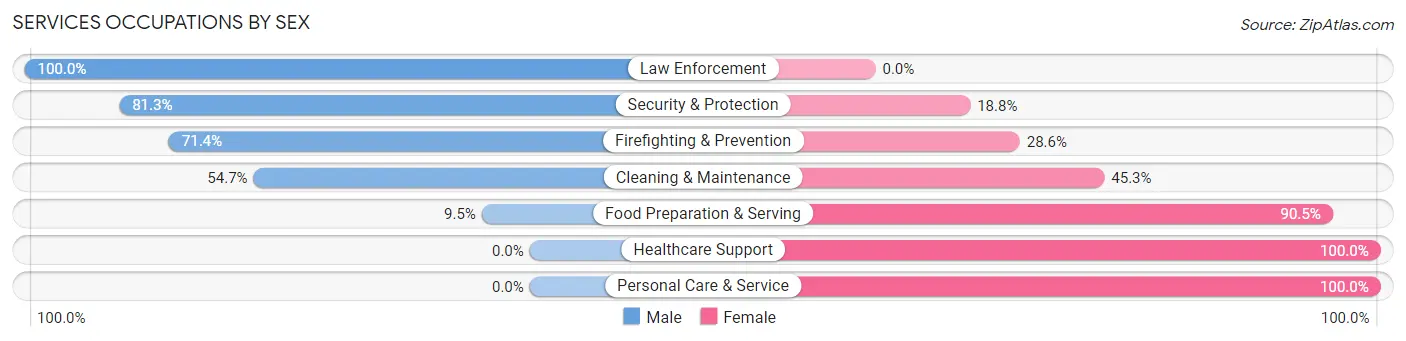
Services Occupations by Sex
Within the Services occupations in Grasonville, the most male-oriented occupations are Law Enforcement (100.0%), Security & Protection (81.2%), and Firefighting & Prevention (71.4%), while the most female-oriented occupations are Healthcare Support (100.0%), Personal Care & Service (100.0%), and Food Preparation & Serving (90.5%).
| Occupation | Male | Female |
| Healthcare Support | 0 (0.0%) | 17 (100.0%) |
| Security & Protection | 78 (81.2%) | 18 (18.8%) |
| Firefighting & Prevention | 45 (71.4%) | 18 (28.6%) |
| Law Enforcement | 33 (100.0%) | 0 (0.0%) |
| Food Preparation & Serving | 15 (9.5%) | 143 (90.5%) |
| Cleaning & Maintenance | 35 (54.7%) | 29 (45.3%) |
| Personal Care & Service | 0 (0.0%) | 38 (100.0%) |
| Total (Category) | 128 (34.3%) | 245 (65.7%) |
| Total (Overall) | 893 (50.8%) | 863 (49.1%) |
Sales and Office Occupations
The most common Sales and Office occupations in Grasonville are Sales & Related (347 | 19.8%), and Office & Administration (83 | 4.7%).
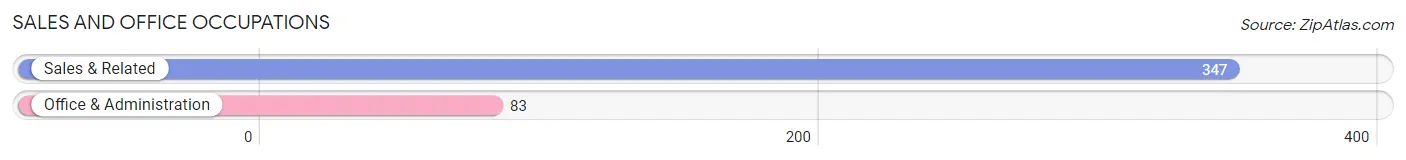
Sales and Office Occupations by Sex

| Occupation | Male | Female |
| Sales & Related | 77 (22.2%) | 270 (77.8%) |
| Office & Administration | 15 (18.1%) | 68 (81.9%) |
| Total (Category) | 92 (21.4%) | 338 (78.6%) |
| Total (Overall) | 893 (50.8%) | 863 (49.1%) |
Natural Resources, Construction and Maintenance Occupations
The most common Natural Resources, Construction and Maintenance occupations in Grasonville are Construction & Extraction (155 | 8.8%), Installation, Maintenance & Repair (106 | 6.0%), and Farming, Fishing & Forestry (8 | 0.5%).

Natural Resources, Construction and Maintenance Occupations by Sex

| Occupation | Male | Female |
| Farming, Fishing & Forestry | 8 (100.0%) | 0 (0.0%) |
| Construction & Extraction | 155 (100.0%) | 0 (0.0%) |
| Installation, Maintenance & Repair | 106 (100.0%) | 0 (0.0%) |
| Total (Category) | 269 (100.0%) | 0 (0.0%) |
| Total (Overall) | 893 (50.8%) | 863 (49.1%) |
Production, Transportation and Moving Occupations
The most common Production, Transportation and Moving occupations in Grasonville are Transportation (117 | 6.7%), Production (54 | 3.1%), and Material Moving (38 | 2.2%).

Production, Transportation and Moving Occupations by Sex
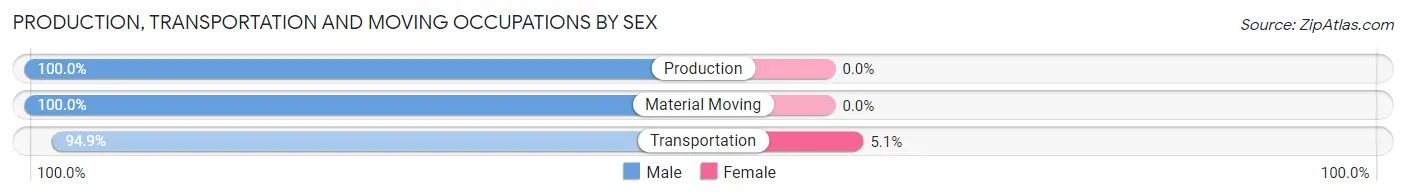
| Occupation | Male | Female |
| Production | 54 (100.0%) | 0 (0.0%) |
| Transportation | 111 (94.9%) | 6 (5.1%) |
| Material Moving | 38 (100.0%) | 0 (0.0%) |
| Total (Category) | 203 (97.1%) | 6 (2.9%) |
| Total (Overall) | 893 (50.8%) | 863 (49.1%) |
Employment Industries by Sex in Grasonville
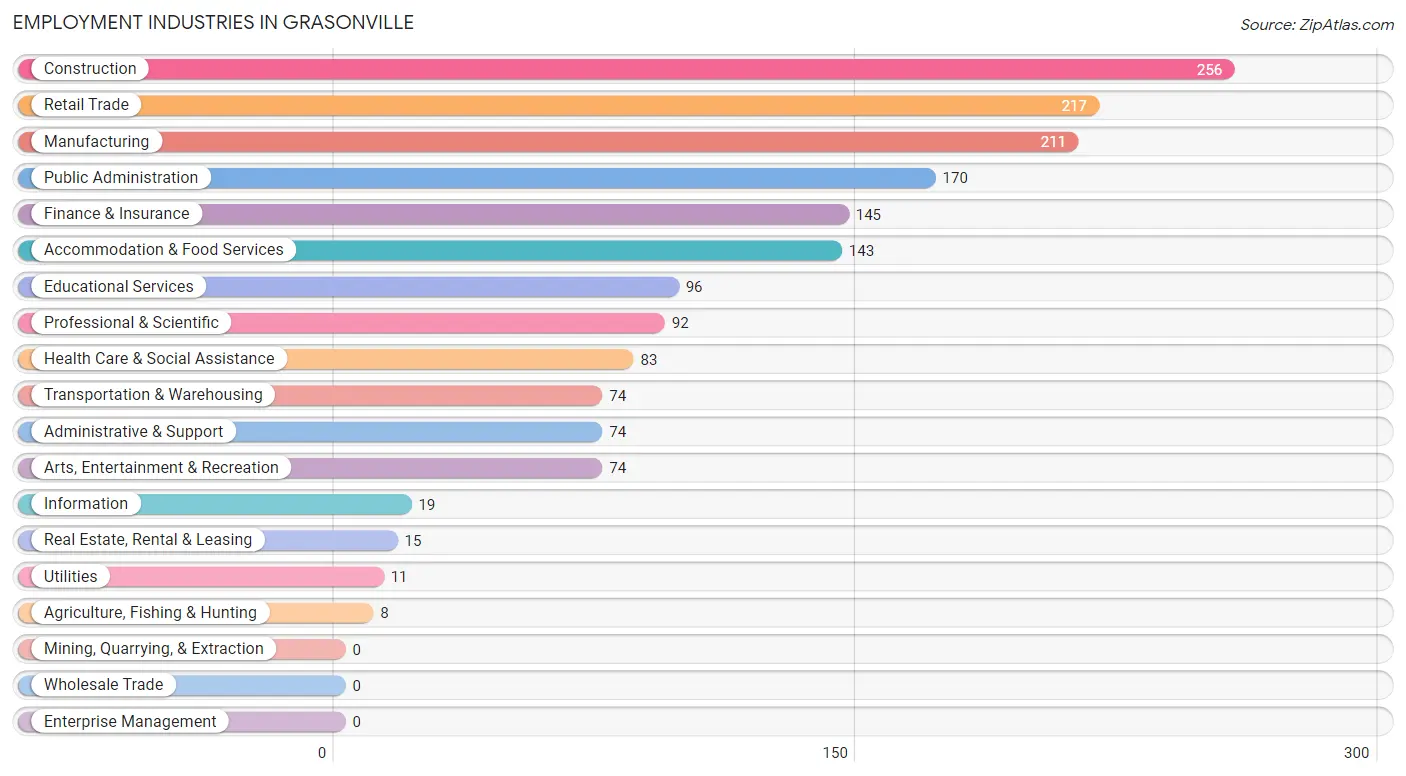
Employment Industries in Grasonville
The major employment industries in Grasonville include Construction (256 | 14.6%), Retail Trade (217 | 12.4%), Manufacturing (211 | 12.0%), Public Administration (170 | 9.7%), and Finance & Insurance (145 | 8.3%).
Employment Industries by Sex in Grasonville
The Grasonville industries that see more men than women are Agriculture, Fishing & Hunting (100.0%), Utilities (100.0%), and Construction (92.6%), whereas the industries that tend to have a higher number of women are Educational Services (100.0%), Accommodation & Food Services (100.0%), and Finance & Insurance (89.7%).
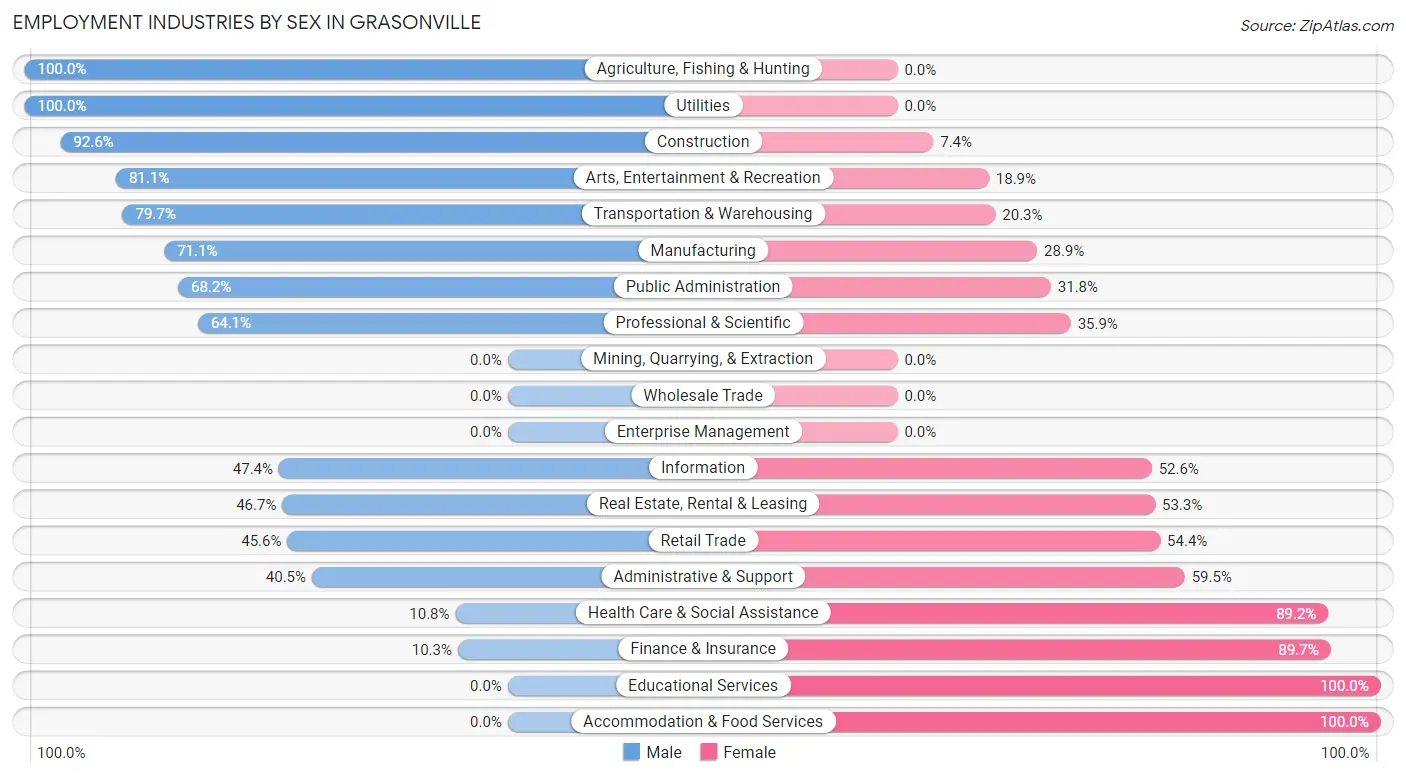
| Industry | Male | Female |
| Agriculture, Fishing & Hunting | 8 (100.0%) | 0 (0.0%) |
| Mining, Quarrying, & Extraction | 0 (0.0%) | 0 (0.0%) |
| Construction | 237 (92.6%) | 19 (7.4%) |
| Manufacturing | 150 (71.1%) | 61 (28.9%) |
| Wholesale Trade | 0 (0.0%) | 0 (0.0%) |
| Retail Trade | 99 (45.6%) | 118 (54.4%) |
| Transportation & Warehousing | 59 (79.7%) | 15 (20.3%) |
| Utilities | 11 (100.0%) | 0 (0.0%) |
| Information | 9 (47.4%) | 10 (52.6%) |
| Finance & Insurance | 15 (10.3%) | 130 (89.7%) |
| Real Estate, Rental & Leasing | 7 (46.7%) | 8 (53.3%) |
| Professional & Scientific | 59 (64.1%) | 33 (35.9%) |
| Enterprise Management | 0 (0.0%) | 0 (0.0%) |
| Administrative & Support | 30 (40.5%) | 44 (59.5%) |
| Educational Services | 0 (0.0%) | 96 (100.0%) |
| Health Care & Social Assistance | 9 (10.8%) | 74 (89.2%) |
| Arts, Entertainment & Recreation | 60 (81.1%) | 14 (18.9%) |
| Accommodation & Food Services | 0 (0.0%) | 143 (100.0%) |
| Public Administration | 116 (68.2%) | 54 (31.8%) |
| Total | 893 (50.8%) | 863 (49.1%) |
Education in Grasonville
School Enrollment in Grasonville
The most common levels of schooling among the 888 students in Grasonville are middle school (415 | 46.7%), elementary school (166 | 18.7%), and college / undergraduate (116 | 13.1%).
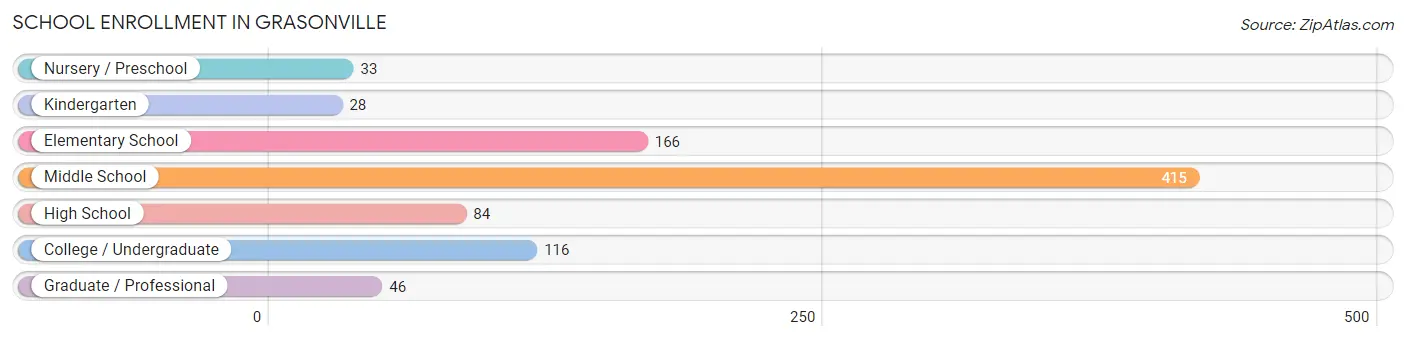
| School Level | # Students | % Students |
| Nursery / Preschool | 33 | 3.7% |
| Kindergarten | 28 | 3.2% |
| Elementary School | 166 | 18.7% |
| Middle School | 415 | 46.7% |
| High School | 84 | 9.5% |
| College / Undergraduate | 116 | 13.1% |
| Graduate / Professional | 46 | 5.2% |
| Total | 888 | 100.0% |
School Enrollment by Age by Funding Source in Grasonville
Out of a total of 888 students who are enrolled in schools in Grasonville, 87 (9.8%) attend a private institution, while the remaining 801 (90.2%) are enrolled in public schools. The age group of 25 to 34 year olds has the highest likelihood of being enrolled in private schools, with 27 (81.8% in the age bracket) enrolled. Conversely, the age group of 3 to 4 year olds has the lowest likelihood of being enrolled in a private school, with 23 (100.0% in the age bracket) attending a public institution.
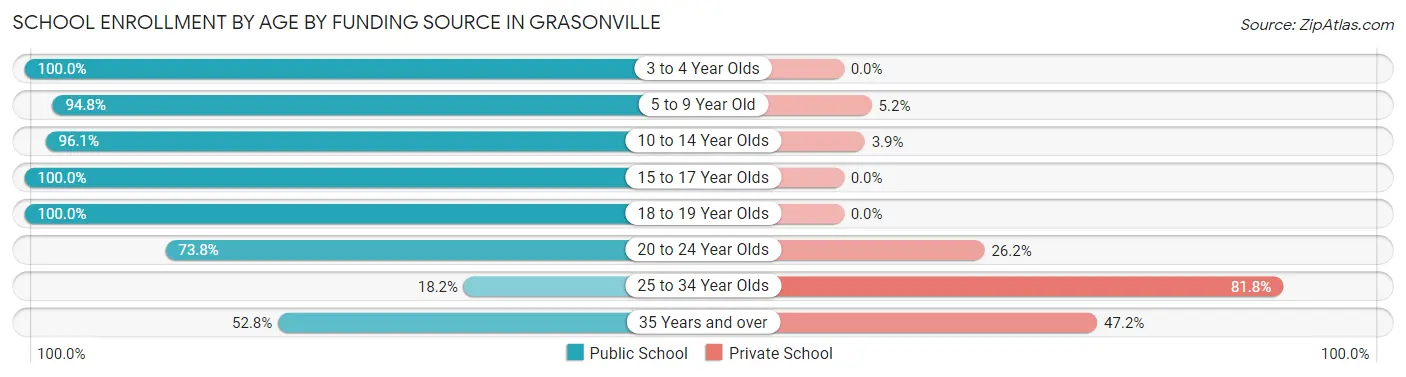
| Age Bracket | Public School | Private School |
| 3 to 4 Year Olds | 23 (100.0%) | 0 (0.0%) |
| 5 to 9 Year Old | 182 (94.8%) | 10 (5.2%) |
| 10 to 14 Year Olds | 417 (96.1%) | 17 (3.9%) |
| 15 to 17 Year Olds | 70 (100.0%) | 0 (0.0%) |
| 18 to 19 Year Olds | 39 (100.0%) | 0 (0.0%) |
| 20 to 24 Year Olds | 45 (73.8%) | 16 (26.2%) |
| 25 to 34 Year Olds | 6 (18.2%) | 27 (81.8%) |
| 35 Years and over | 19 (52.8%) | 17 (47.2%) |
| Total | 801 (90.2%) | 87 (9.8%) |
Educational Attainment by Field of Study in Grasonville
Arts & humanities (173 | 22.7%), business (88 | 11.5%), education (83 | 10.9%), liberal arts & history (74 | 9.7%), and social sciences (70 | 9.2%) are the most common fields of study among 763 individuals in Grasonville who have obtained a bachelor's degree or higher.
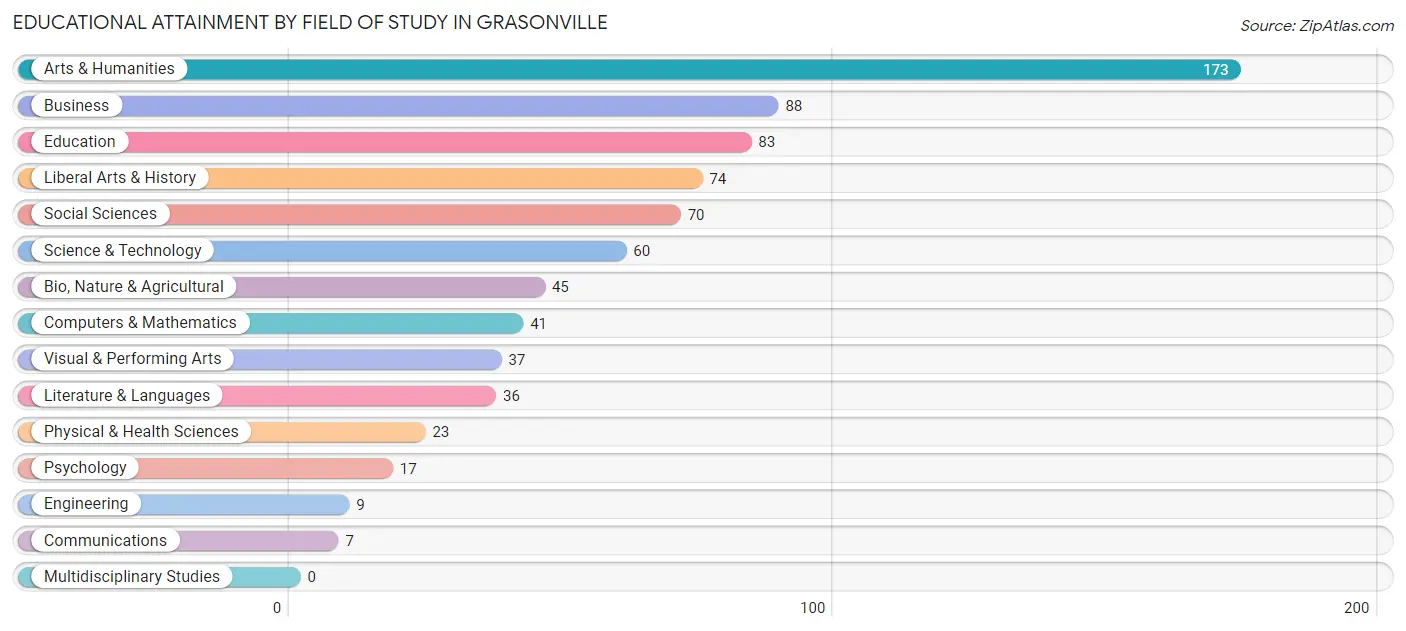
| Field of Study | # Graduates | % Graduates |
| Computers & Mathematics | 41 | 5.4% |
| Bio, Nature & Agricultural | 45 | 5.9% |
| Physical & Health Sciences | 23 | 3.0% |
| Psychology | 17 | 2.2% |
| Social Sciences | 70 | 9.2% |
| Engineering | 9 | 1.2% |
| Multidisciplinary Studies | 0 | 0.0% |
| Science & Technology | 60 | 7.9% |
| Business | 88 | 11.5% |
| Education | 83 | 10.9% |
| Literature & Languages | 36 | 4.7% |
| Liberal Arts & History | 74 | 9.7% |
| Visual & Performing Arts | 37 | 4.9% |
| Communications | 7 | 0.9% |
| Arts & Humanities | 173 | 22.7% |
| Total | 763 | 100.0% |
Transportation & Commute in Grasonville
Vehicle Availability by Sex in Grasonville
The most prevalent vehicle ownership categories in Grasonville are males with 2 vehicles (364, accounting for 40.4%) and females with 2 vehicles (426, making up 46.3%).
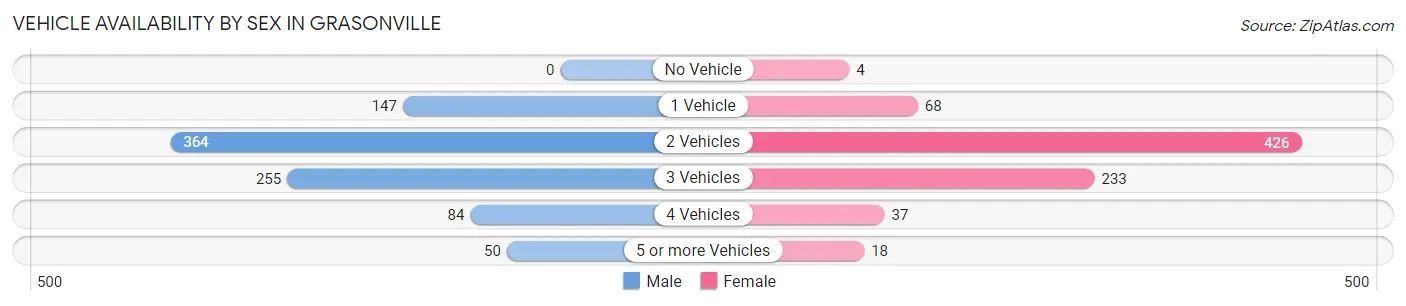
| Vehicles Available | Male | Female |
| No Vehicle | 0 (0.0%) | 4 (0.5%) |
| 1 Vehicle | 147 (16.3%) | 68 (8.6%) |
| 2 Vehicles | 364 (40.4%) | 426 (54.2%) |
| 3 Vehicles | 255 (28.3%) | 233 (29.6%) |
| 4 Vehicles | 84 (9.3%) | 37 (4.7%) |
| 5 or more Vehicles | 50 (5.6%) | 18 (2.3%) |
| Total | 900 (100.0%) | 786 (100.0%) |
Commute Time in Grasonville
The most frequently occuring commute durations in Grasonville are 10 to 14 minutes (293 commuters, 20.2%), 60 to 89 minutes (205 commuters, 14.1%), and 45 to 59 minutes (201 commuters, 13.8%).
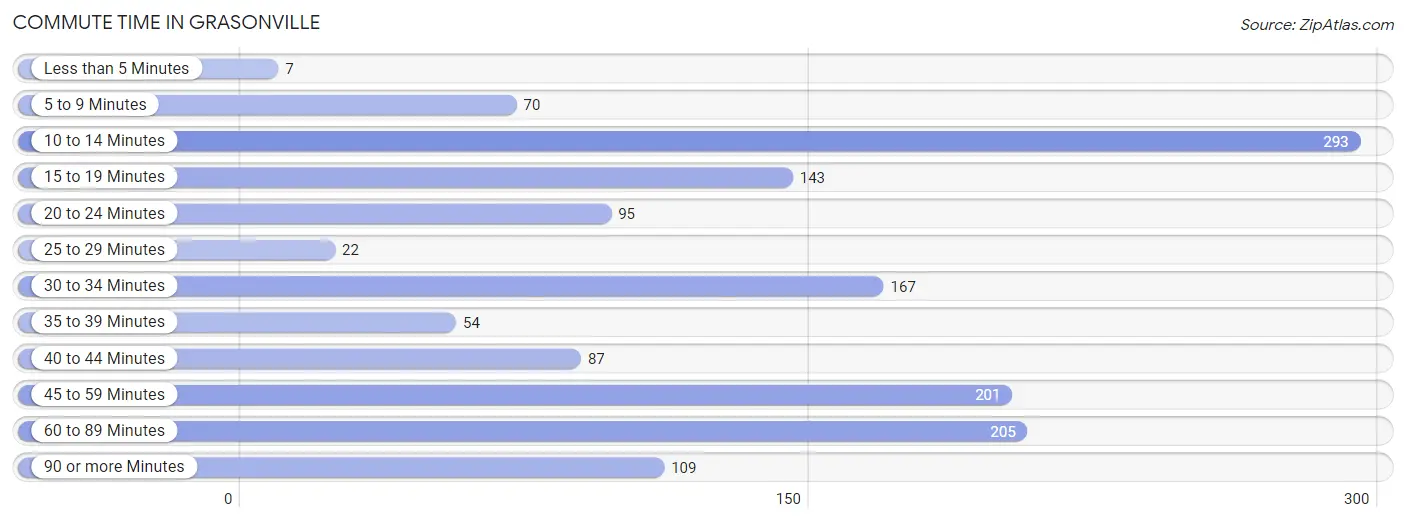
| Commute Time | # Commuters | % Commuters |
| Less than 5 Minutes | 7 | 0.5% |
| 5 to 9 Minutes | 70 | 4.8% |
| 10 to 14 Minutes | 293 | 20.2% |
| 15 to 19 Minutes | 143 | 9.8% |
| 20 to 24 Minutes | 95 | 6.5% |
| 25 to 29 Minutes | 22 | 1.5% |
| 30 to 34 Minutes | 167 | 11.5% |
| 35 to 39 Minutes | 54 | 3.7% |
| 40 to 44 Minutes | 87 | 6.0% |
| 45 to 59 Minutes | 201 | 13.8% |
| 60 to 89 Minutes | 205 | 14.1% |
| 90 or more Minutes | 109 | 7.5% |
Commute Time by Sex in Grasonville
The most common commute times in Grasonville are 60 to 89 minutes (168 commuters, 20.3%) for males and 10 to 14 minutes (159 commuters, 25.4%) for females.
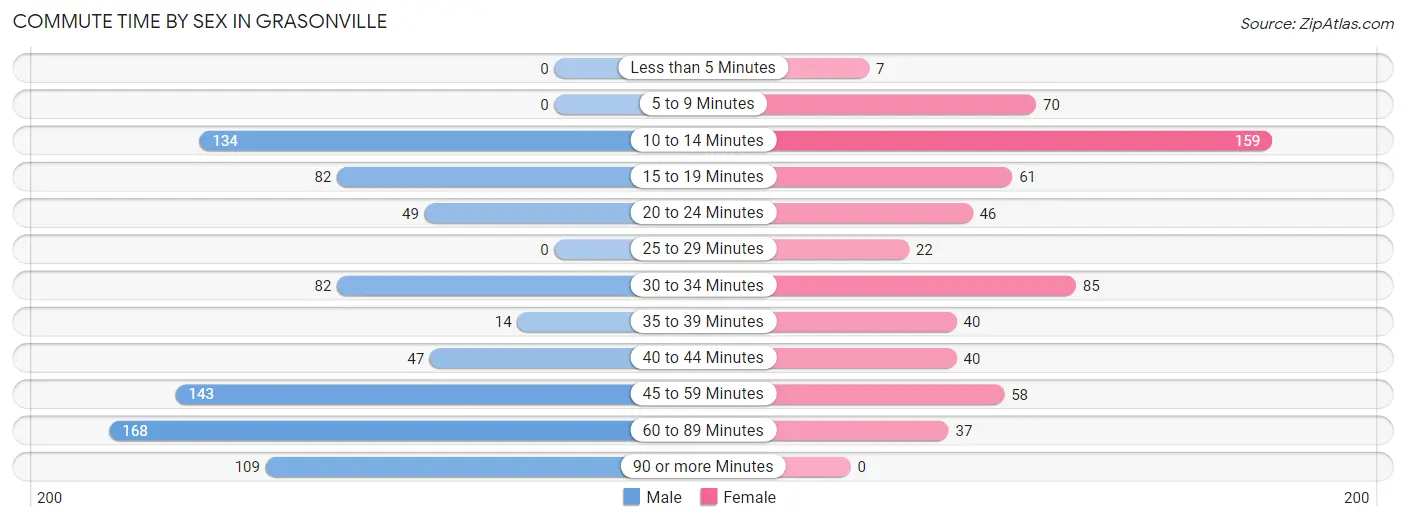
| Commute Time | Male | Female |
| Less than 5 Minutes | 0 (0.0%) | 7 (1.1%) |
| 5 to 9 Minutes | 0 (0.0%) | 70 (11.2%) |
| 10 to 14 Minutes | 134 (16.2%) | 159 (25.4%) |
| 15 to 19 Minutes | 82 (9.9%) | 61 (9.8%) |
| 20 to 24 Minutes | 49 (5.9%) | 46 (7.4%) |
| 25 to 29 Minutes | 0 (0.0%) | 22 (3.5%) |
| 30 to 34 Minutes | 82 (9.9%) | 85 (13.6%) |
| 35 to 39 Minutes | 14 (1.7%) | 40 (6.4%) |
| 40 to 44 Minutes | 47 (5.7%) | 40 (6.4%) |
| 45 to 59 Minutes | 143 (17.3%) | 58 (9.3%) |
| 60 to 89 Minutes | 168 (20.3%) | 37 (5.9%) |
| 90 or more Minutes | 109 (13.2%) | 0 (0.0%) |
Time of Departure to Work by Sex in Grasonville
The most frequent times of departure to work in Grasonville are 6:00 AM to 6:29 AM (169, 20.4%) for males and 7:30 AM to 7:59 AM (129, 20.6%) for females.
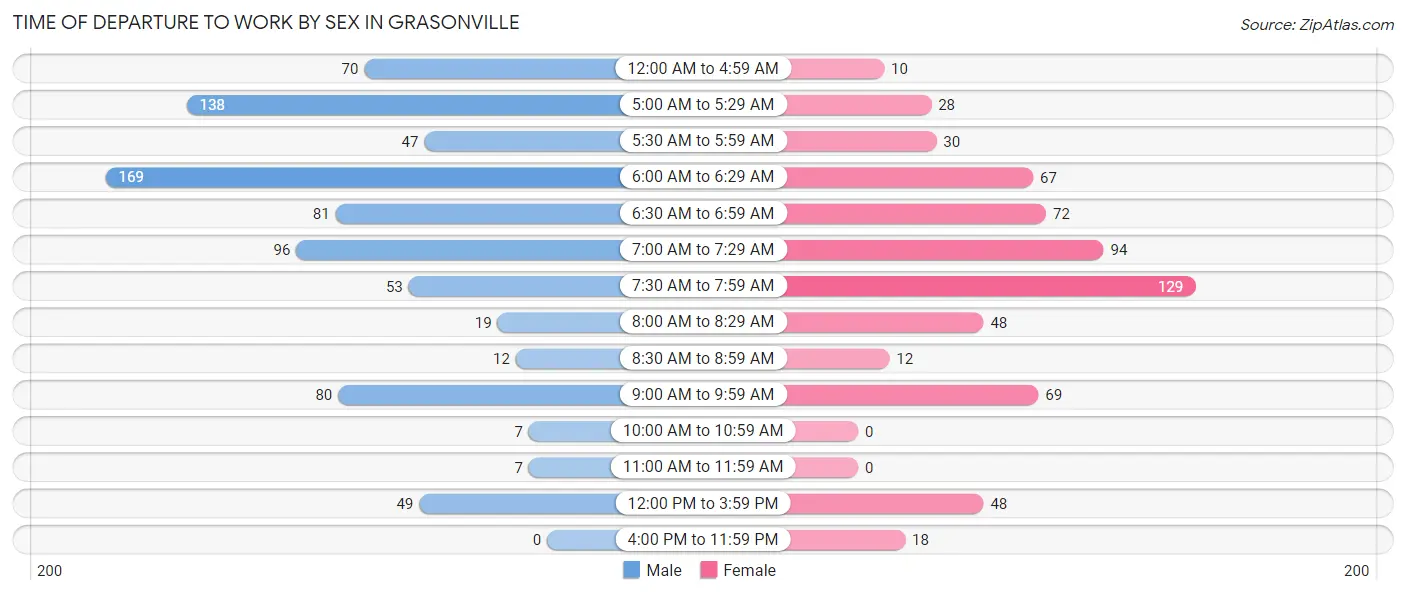
| Time of Departure | Male | Female |
| 12:00 AM to 4:59 AM | 70 (8.5%) | 10 (1.6%) |
| 5:00 AM to 5:29 AM | 138 (16.7%) | 28 (4.5%) |
| 5:30 AM to 5:59 AM | 47 (5.7%) | 30 (4.8%) |
| 6:00 AM to 6:29 AM | 169 (20.4%) | 67 (10.7%) |
| 6:30 AM to 6:59 AM | 81 (9.8%) | 72 (11.5%) |
| 7:00 AM to 7:29 AM | 96 (11.6%) | 94 (15.0%) |
| 7:30 AM to 7:59 AM | 53 (6.4%) | 129 (20.6%) |
| 8:00 AM to 8:29 AM | 19 (2.3%) | 48 (7.7%) |
| 8:30 AM to 8:59 AM | 12 (1.5%) | 12 (1.9%) |
| 9:00 AM to 9:59 AM | 80 (9.7%) | 69 (11.0%) |
| 10:00 AM to 10:59 AM | 7 (0.9%) | 0 (0.0%) |
| 11:00 AM to 11:59 AM | 7 (0.9%) | 0 (0.0%) |
| 12:00 PM to 3:59 PM | 49 (5.9%) | 48 (7.7%) |
| 4:00 PM to 11:59 PM | 0 (0.0%) | 18 (2.9%) |
| Total | 828 (100.0%) | 625 (100.0%) |
Housing Occupancy in Grasonville
Occupancy by Ownership in Grasonville
Of the total 1,239 dwellings in Grasonville, owner-occupied units account for 960 (77.5%), while renter-occupied units make up 279 (22.5%).
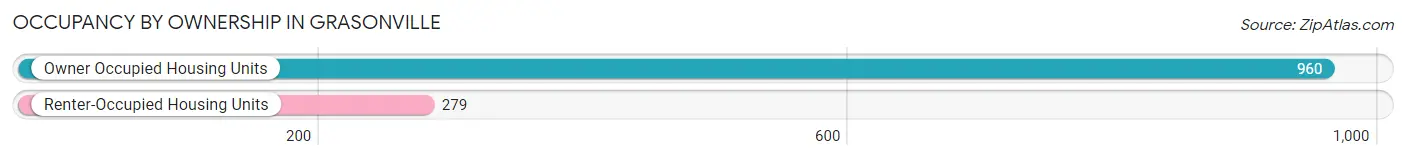
| Occupancy | # Housing Units | % Housing Units |
| Owner Occupied Housing Units | 960 | 77.5% |
| Renter-Occupied Housing Units | 279 | 22.5% |
| Total Occupied Housing Units | 1,239 | 100.0% |
Occupancy by Household Size in Grasonville
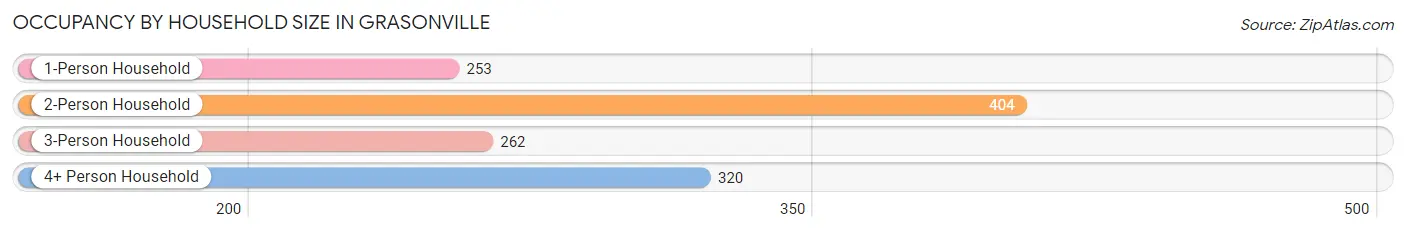
| Household Size | # Housing Units | % Housing Units |
| 1-Person Household | 253 | 20.4% |
| 2-Person Household | 404 | 32.6% |
| 3-Person Household | 262 | 21.1% |
| 4+ Person Household | 320 | 25.8% |
| Total Housing Units | 1,239 | 100.0% |
Occupancy by Ownership by Household Size in Grasonville
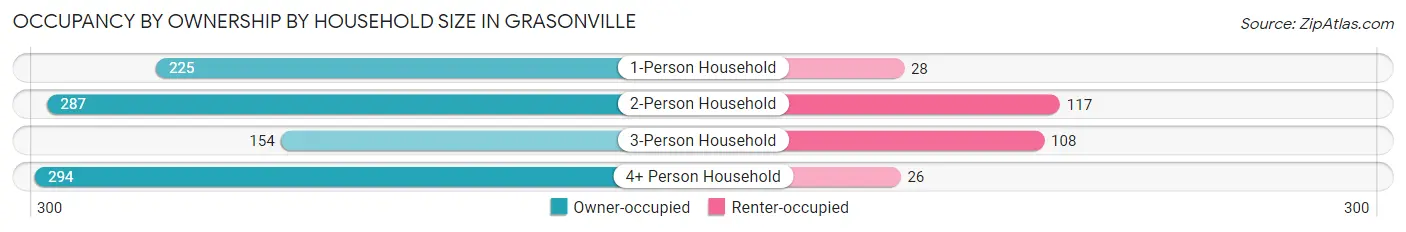
| Household Size | Owner-occupied | Renter-occupied |
| 1-Person Household | 225 (88.9%) | 28 (11.1%) |
| 2-Person Household | 287 (71.0%) | 117 (29.0%) |
| 3-Person Household | 154 (58.8%) | 108 (41.2%) |
| 4+ Person Household | 294 (91.9%) | 26 (8.1%) |
| Total Housing Units | 960 (77.5%) | 279 (22.5%) |
Occupancy by Educational Attainment in Grasonville
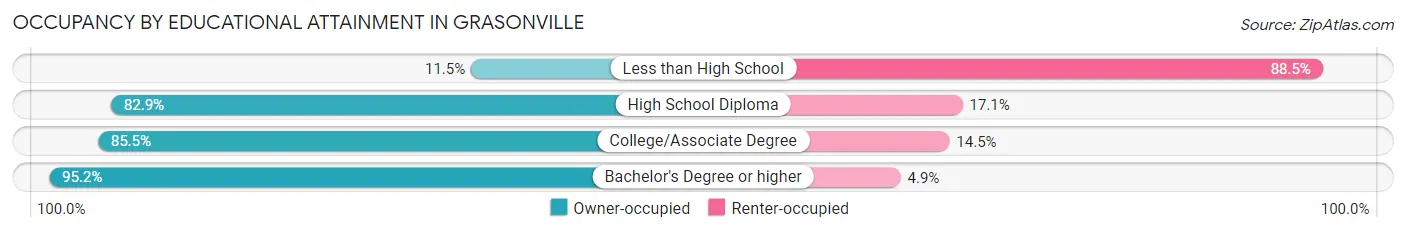
| Household Size | Owner-occupied | Renter-occupied |
| Less than High School | 21 (11.5%) | 162 (88.5%) |
| High School Diploma | 242 (82.9%) | 50 (17.1%) |
| College/Associate Degree | 265 (85.5%) | 45 (14.5%) |
| Bachelor's Degree or higher | 432 (95.2%) | 22 (4.9%) |
Occupancy by Age of Householder in Grasonville
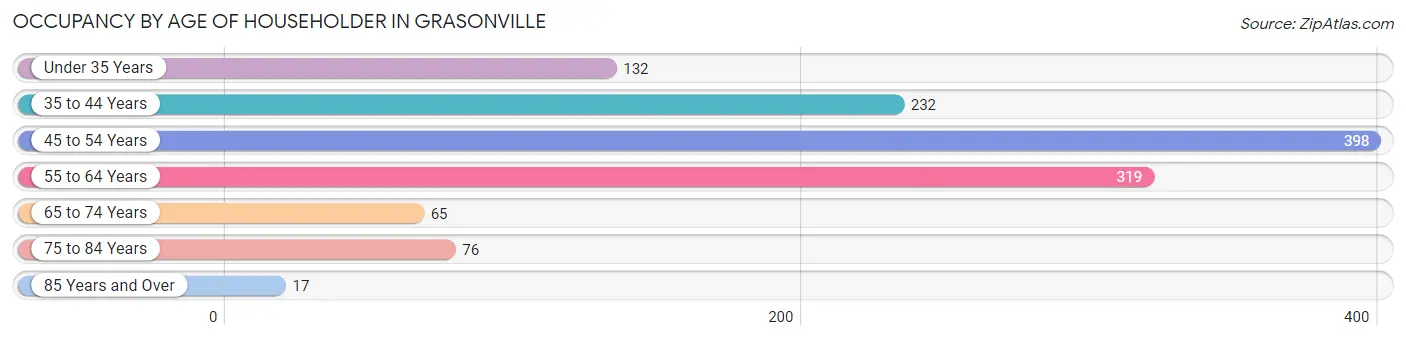
| Age Bracket | # Households | % Households |
| Under 35 Years | 132 | 10.6% |
| 35 to 44 Years | 232 | 18.7% |
| 45 to 54 Years | 398 | 32.1% |
| 55 to 64 Years | 319 | 25.8% |
| 65 to 74 Years | 65 | 5.2% |
| 75 to 84 Years | 76 | 6.1% |
| 85 Years and Over | 17 | 1.4% |
| Total | 1,239 | 100.0% |
Housing Finances in Grasonville
Median Income by Occupancy in Grasonville
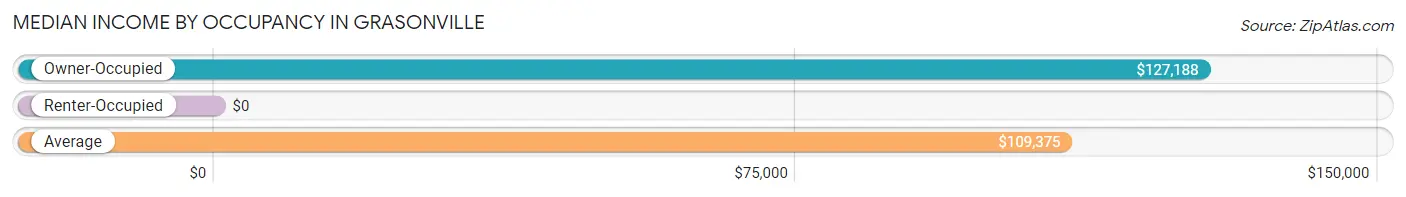
| Occupancy Type | # Households | Median Income |
| Owner-Occupied | 960 (77.5%) | $127,188 |
| Renter-Occupied | 279 (22.5%) | $0 |
| Average | 1,239 (100.0%) | $109,375 |
Occupancy by Householder Income Bracket in Grasonville
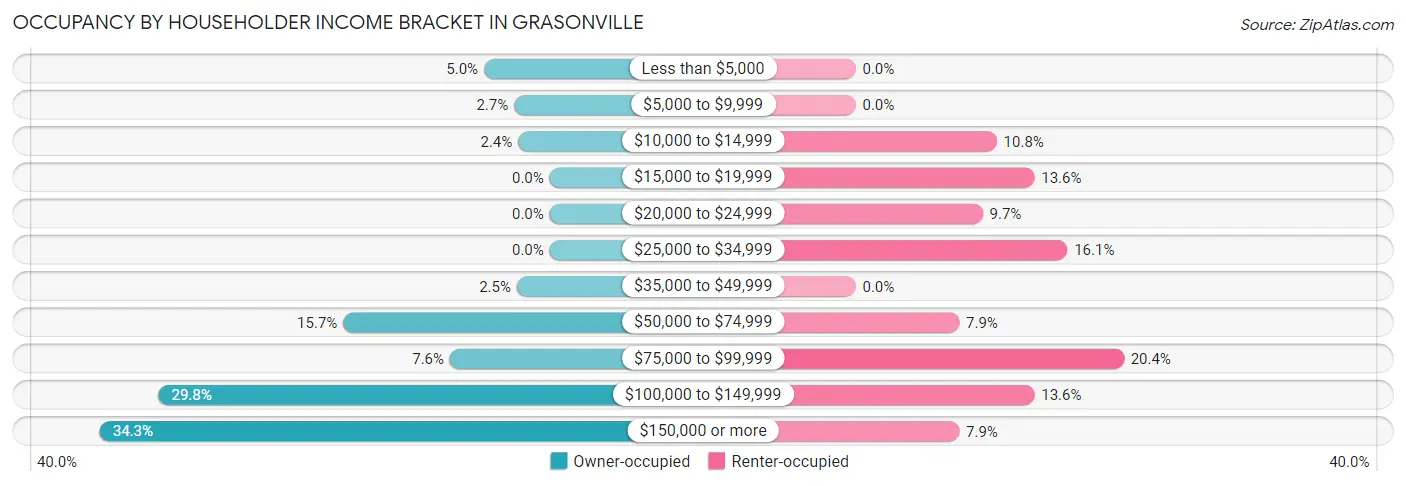
| Income Bracket | Owner-occupied | Renter-occupied |
| Less than $5,000 | 48 (5.0%) | 0 (0.0%) |
| $5,000 to $9,999 | 26 (2.7%) | 0 (0.0%) |
| $10,000 to $14,999 | 23 (2.4%) | 30 (10.7%) |
| $15,000 to $19,999 | 0 (0.0%) | 38 (13.6%) |
| $20,000 to $24,999 | 0 (0.0%) | 27 (9.7%) |
| $25,000 to $34,999 | 0 (0.0%) | 45 (16.1%) |
| $35,000 to $49,999 | 24 (2.5%) | 0 (0.0%) |
| $50,000 to $74,999 | 151 (15.7%) | 22 (7.9%) |
| $75,000 to $99,999 | 73 (7.6%) | 57 (20.4%) |
| $100,000 to $149,999 | 286 (29.8%) | 38 (13.6%) |
| $150,000 or more | 329 (34.3%) | 22 (7.9%) |
| Total | 960 (100.0%) | 279 (100.0%) |
Monthly Housing Cost Tiers in Grasonville
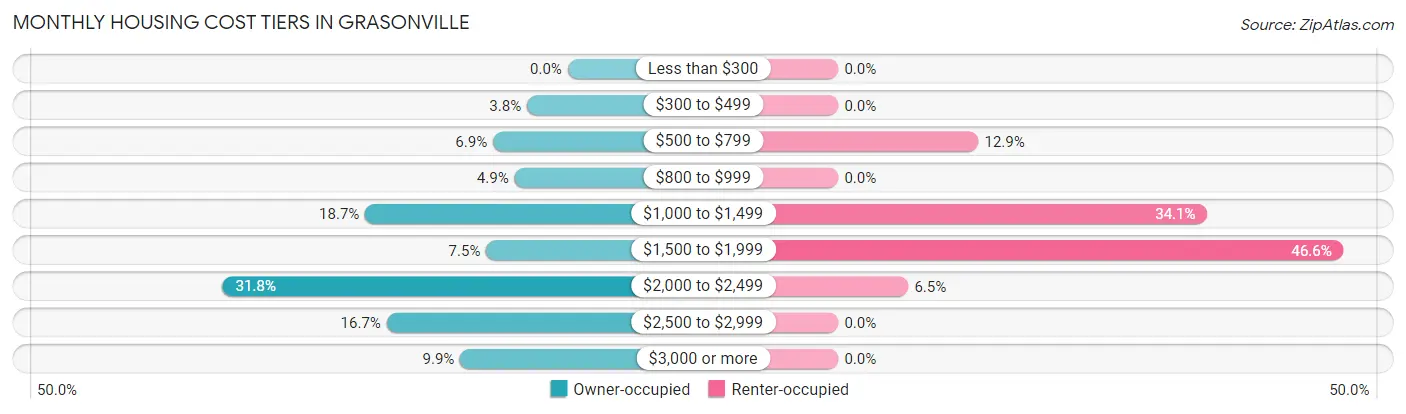
| Monthly Cost | Owner-occupied | Renter-occupied |
| Less than $300 | 0 (0.0%) | 0 (0.0%) |
| $300 to $499 | 36 (3.7%) | 0 (0.0%) |
| $500 to $799 | 66 (6.9%) | 36 (12.9%) |
| $800 to $999 | 47 (4.9%) | 0 (0.0%) |
| $1,000 to $1,499 | 179 (18.6%) | 95 (34.1%) |
| $1,500 to $1,999 | 72 (7.5%) | 130 (46.6%) |
| $2,000 to $2,499 | 305 (31.8%) | 18 (6.5%) |
| $2,500 to $2,999 | 160 (16.7%) | 0 (0.0%) |
| $3,000 or more | 95 (9.9%) | 0 (0.0%) |
| Total | 960 (100.0%) | 279 (100.0%) |
Physical Housing Characteristics in Grasonville
Housing Structures in Grasonville
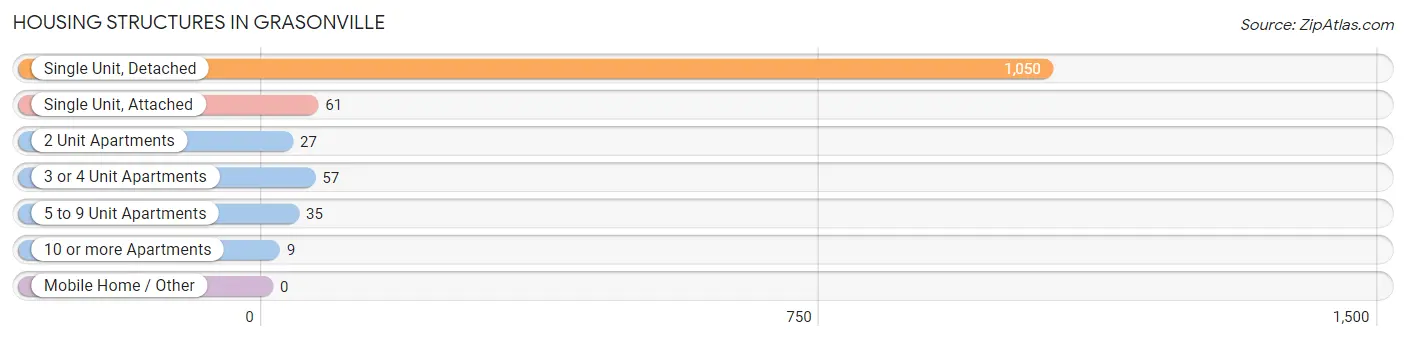
| Structure Type | # Housing Units | % Housing Units |
| Single Unit, Detached | 1,050 | 84.8% |
| Single Unit, Attached | 61 | 4.9% |
| 2 Unit Apartments | 27 | 2.2% |
| 3 or 4 Unit Apartments | 57 | 4.6% |
| 5 to 9 Unit Apartments | 35 | 2.8% |
| 10 or more Apartments | 9 | 0.7% |
| Mobile Home / Other | 0 | 0.0% |
| Total | 1,239 | 100.0% |
Housing Structures by Occupancy in Grasonville
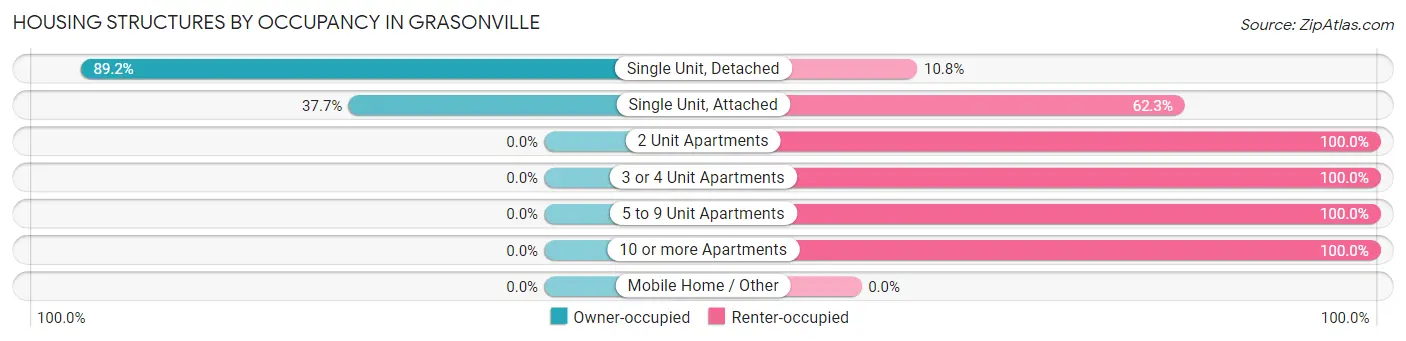
| Structure Type | Owner-occupied | Renter-occupied |
| Single Unit, Detached | 937 (89.2%) | 113 (10.8%) |
| Single Unit, Attached | 23 (37.7%) | 38 (62.3%) |
| 2 Unit Apartments | 0 (0.0%) | 27 (100.0%) |
| 3 or 4 Unit Apartments | 0 (0.0%) | 57 (100.0%) |
| 5 to 9 Unit Apartments | 0 (0.0%) | 35 (100.0%) |
| 10 or more Apartments | 0 (0.0%) | 9 (100.0%) |
| Mobile Home / Other | 0 (0.0%) | 0 (0.0%) |
| Total | 960 (77.5%) | 279 (22.5%) |
Housing Structures by Number of Rooms in Grasonville
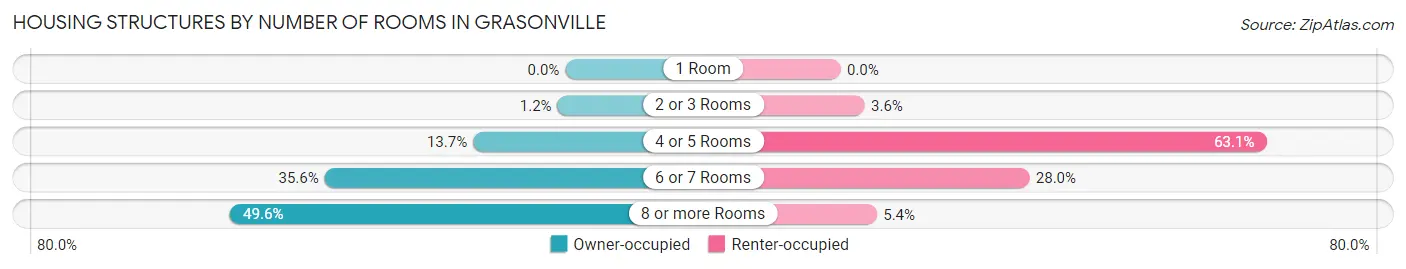
| Number of Rooms | Owner-occupied | Renter-occupied |
| 1 Room | 0 (0.0%) | 0 (0.0%) |
| 2 or 3 Rooms | 11 (1.1%) | 10 (3.6%) |
| 4 or 5 Rooms | 131 (13.7%) | 176 (63.1%) |
| 6 or 7 Rooms | 342 (35.6%) | 78 (28.0%) |
| 8 or more Rooms | 476 (49.6%) | 15 (5.4%) |
| Total | 960 (100.0%) | 279 (100.0%) |
Housing Structure by Heating Type in Grasonville
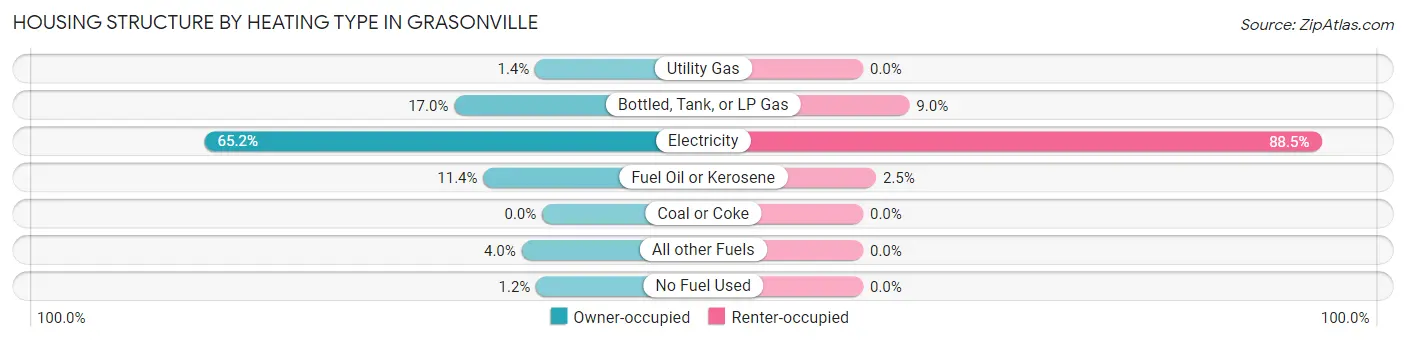
| Heating Type | Owner-occupied | Renter-occupied |
| Utility Gas | 13 (1.3%) | 0 (0.0%) |
| Bottled, Tank, or LP Gas | 163 (17.0%) | 25 (9.0%) |
| Electricity | 626 (65.2%) | 247 (88.5%) |
| Fuel Oil or Kerosene | 109 (11.4%) | 7 (2.5%) |
| Coal or Coke | 0 (0.0%) | 0 (0.0%) |
| All other Fuels | 38 (4.0%) | 0 (0.0%) |
| No Fuel Used | 11 (1.1%) | 0 (0.0%) |
| Total | 960 (100.0%) | 279 (100.0%) |
Household Vehicle Usage in Grasonville
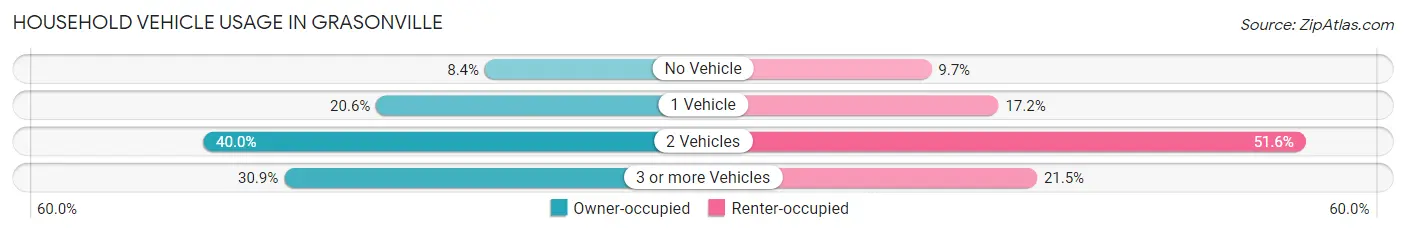
| Vehicles per Household | Owner-occupied | Renter-occupied |
| No Vehicle | 81 (8.4%) | 27 (9.7%) |
| 1 Vehicle | 198 (20.6%) | 48 (17.2%) |
| 2 Vehicles | 384 (40.0%) | 144 (51.6%) |
| 3 or more Vehicles | 297 (30.9%) | 60 (21.5%) |
| Total | 960 (100.0%) | 279 (100.0%) |
Real Estate & Mortgages in Grasonville
Real Estate and Mortgage Overview in Grasonville
| Characteristic | Without Mortgage | With Mortgage |
| Housing Units | 164 | 796 |
| Median Property Value | $526,300 | $380,300 |
| Median Household Income | $110,500 | $275 |
| Monthly Housing Costs | $697 | $95 |
| Real Estate Taxes | $3,500 | $0 |
Property Value by Mortgage Status in Grasonville
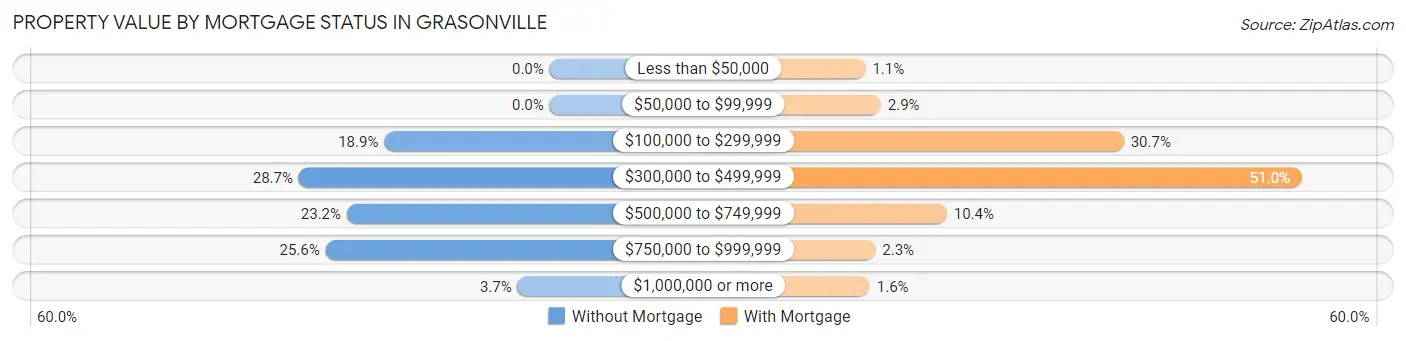
| Property Value | Without Mortgage | With Mortgage |
| Less than $50,000 | 0 (0.0%) | 9 (1.1%) |
| $50,000 to $99,999 | 0 (0.0%) | 23 (2.9%) |
| $100,000 to $299,999 | 31 (18.9%) | 244 (30.6%) |
| $300,000 to $499,999 | 47 (28.7%) | 406 (51.0%) |
| $500,000 to $749,999 | 38 (23.2%) | 83 (10.4%) |
| $750,000 to $999,999 | 42 (25.6%) | 18 (2.3%) |
| $1,000,000 or more | 6 (3.7%) | 13 (1.6%) |
| Total | 164 (100.0%) | 796 (100.0%) |
Household Income by Mortgage Status in Grasonville
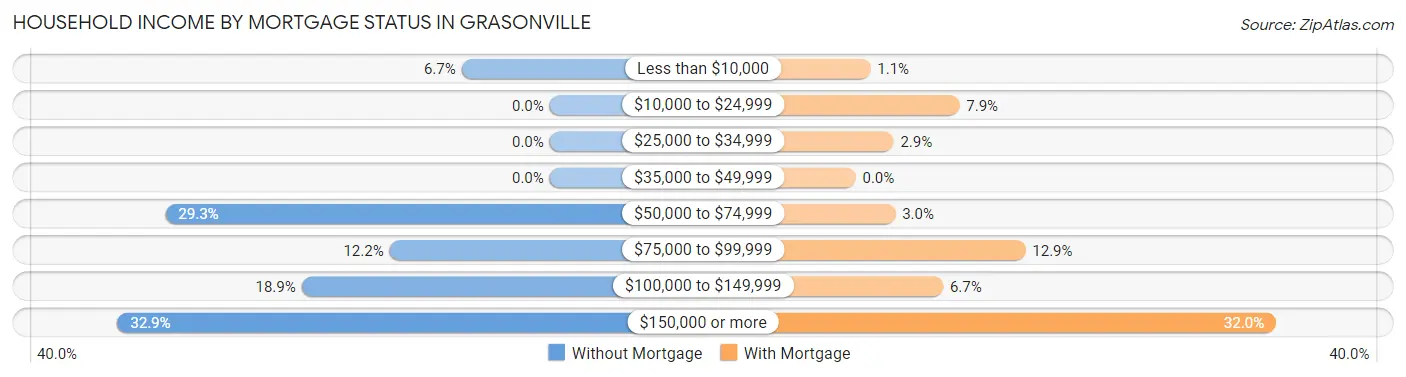
| Household Income | Without Mortgage | With Mortgage |
| Less than $10,000 | 11 (6.7%) | 9 (1.1%) |
| $10,000 to $24,999 | 0 (0.0%) | 63 (7.9%) |
| $25,000 to $34,999 | 0 (0.0%) | 23 (2.9%) |
| $35,000 to $49,999 | 0 (0.0%) | 0 (0.0%) |
| $50,000 to $74,999 | 48 (29.3%) | 24 (3.0%) |
| $75,000 to $99,999 | 20 (12.2%) | 103 (12.9%) |
| $100,000 to $149,999 | 31 (18.9%) | 53 (6.7%) |
| $150,000 or more | 54 (32.9%) | 255 (32.0%) |
| Total | 164 (100.0%) | 796 (100.0%) |
Property Value to Household Income Ratio in Grasonville
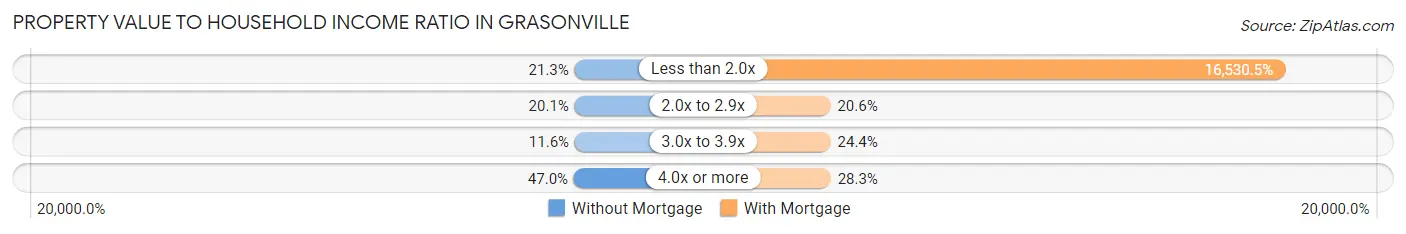
| Value-to-Income Ratio | Without Mortgage | With Mortgage |
| Less than 2.0x | 35 (21.3%) | 131,583 (16,530.5%) |
| 2.0x to 2.9x | 33 (20.1%) | 164 (20.6%) |
| 3.0x to 3.9x | 19 (11.6%) | 194 (24.4%) |
| 4.0x or more | 77 (46.9%) | 225 (28.3%) |
| Total | 164 (100.0%) | 796 (100.0%) |
Real Estate Taxes by Mortgage Status in Grasonville
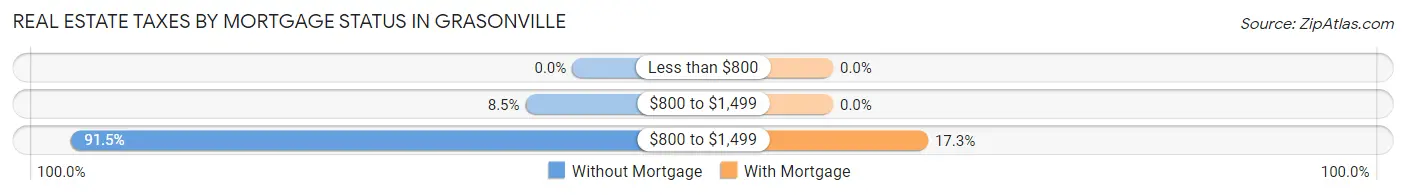
| Property Taxes | Without Mortgage | With Mortgage |
| Less than $800 | 0 (0.0%) | 0 (0.0%) |
| $800 to $1,499 | 14 (8.5%) | 0 (0.0%) |
| $800 to $1,499 | 150 (91.5%) | 138 (17.3%) |
| Total | 164 (100.0%) | 796 (100.0%) |
Health & Disability in Grasonville
Health Insurance Coverage by Age in Grasonville
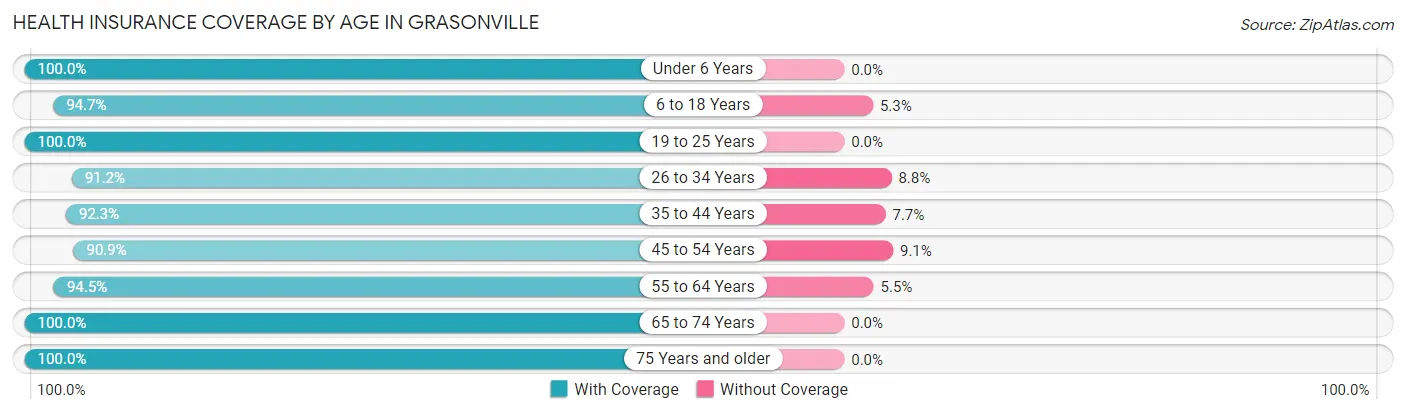
| Age Bracket | With Coverage | Without Coverage |
| Under 6 Years | 180 (100.0%) | 0 (0.0%) |
| 6 to 18 Years | 656 (94.7%) | 37 (5.3%) |
| 19 to 25 Years | 139 (100.0%) | 0 (0.0%) |
| 26 to 34 Years | 353 (91.2%) | 34 (8.8%) |
| 35 to 44 Years | 360 (92.3%) | 30 (7.7%) |
| 45 to 54 Years | 590 (90.9%) | 59 (9.1%) |
| 55 to 64 Years | 467 (94.5%) | 27 (5.5%) |
| 65 to 74 Years | 230 (100.0%) | 0 (0.0%) |
| 75 Years and older | 144 (100.0%) | 0 (0.0%) |
| Total | 3,119 (94.3%) | 187 (5.7%) |
Health Insurance Coverage by Citizenship Status in Grasonville
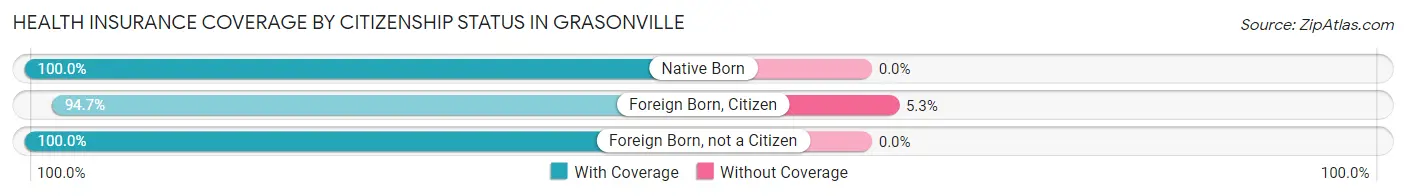
| Citizenship Status | With Coverage | Without Coverage |
| Native Born | 180 (100.0%) | 0 (0.0%) |
| Foreign Born, Citizen | 656 (94.7%) | 37 (5.3%) |
| Foreign Born, not a Citizen | 139 (100.0%) | 0 (0.0%) |
Health Insurance Coverage by Household Income in Grasonville
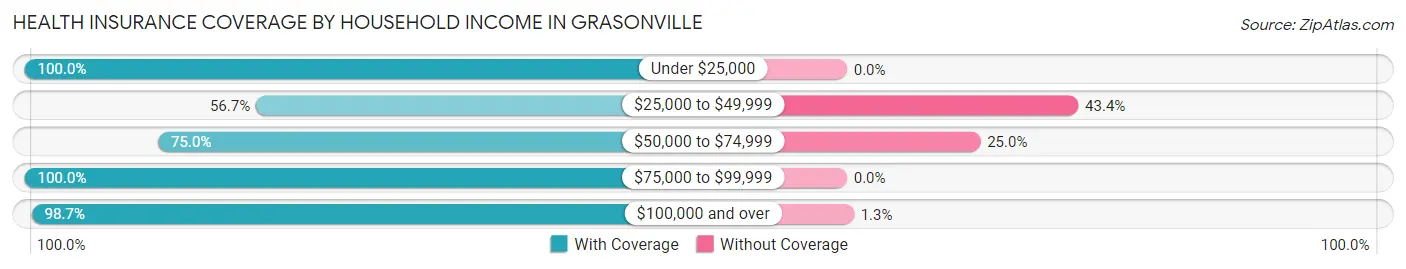
| Household Income | With Coverage | Without Coverage |
| Under $25,000 | 312 (100.0%) | 0 (0.0%) |
| $25,000 to $49,999 | 98 (56.7%) | 75 (43.3%) |
| $50,000 to $74,999 | 258 (75.0%) | 86 (25.0%) |
| $75,000 to $99,999 | 448 (100.0%) | 0 (0.0%) |
| $100,000 and over | 1,974 (98.7%) | 26 (1.3%) |
Public vs Private Health Insurance Coverage by Age in Grasonville
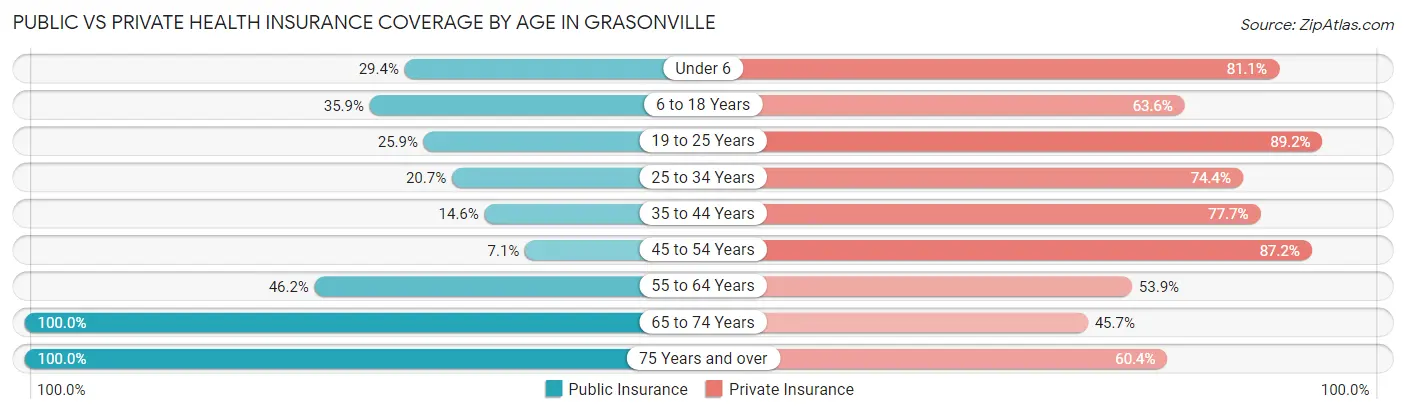
| Age Bracket | Public Insurance | Private Insurance |
| Under 6 | 53 (29.4%) | 146 (81.1%) |
| 6 to 18 Years | 249 (35.9%) | 441 (63.6%) |
| 19 to 25 Years | 36 (25.9%) | 124 (89.2%) |
| 25 to 34 Years | 80 (20.7%) | 288 (74.4%) |
| 35 to 44 Years | 57 (14.6%) | 303 (77.7%) |
| 45 to 54 Years | 46 (7.1%) | 566 (87.2%) |
| 55 to 64 Years | 228 (46.2%) | 266 (53.8%) |
| 65 to 74 Years | 230 (100.0%) | 105 (45.7%) |
| 75 Years and over | 144 (100.0%) | 87 (60.4%) |
| Total | 1,123 (34.0%) | 2,326 (70.4%) |
Disability Status by Sex by Age in Grasonville
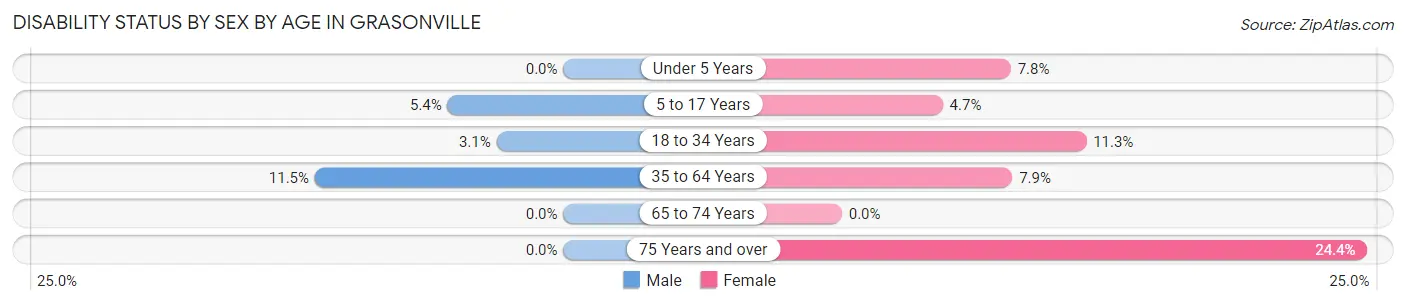
| Age Bracket | Male | Female |
| Under 5 Years | 0 (0.0%) | 8 (7.8%) |
| 5 to 17 Years | 19 (5.4%) | 16 (4.7%) |
| 18 to 34 Years | 10 (3.1%) | 27 (11.3%) |
| 35 to 64 Years | 85 (11.5%) | 63 (7.9%) |
| 65 to 74 Years | 0 (0.0%) | 0 (0.0%) |
| 75 Years and over | 0 (0.0%) | 20 (24.4%) |
Disability Class by Sex by Age in Grasonville
Disability Class: Hearing Difficulty
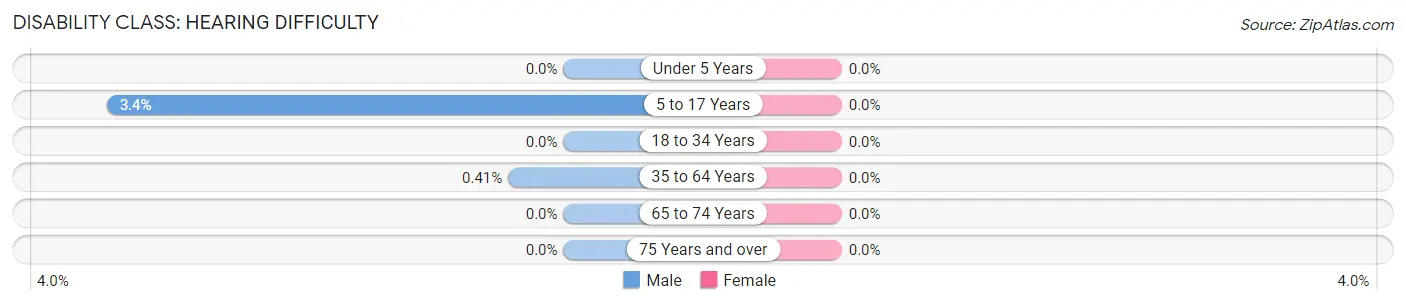
| Age Bracket | Male | Female |
| Under 5 Years | 0 (0.0%) | 0 (0.0%) |
| 5 to 17 Years | 12 (3.4%) | 0 (0.0%) |
| 18 to 34 Years | 0 (0.0%) | 0 (0.0%) |
| 35 to 64 Years | 3 (0.4%) | 0 (0.0%) |
| 65 to 74 Years | 0 (0.0%) | 0 (0.0%) |
| 75 Years and over | 0 (0.0%) | 0 (0.0%) |
Disability Class: Vision Difficulty
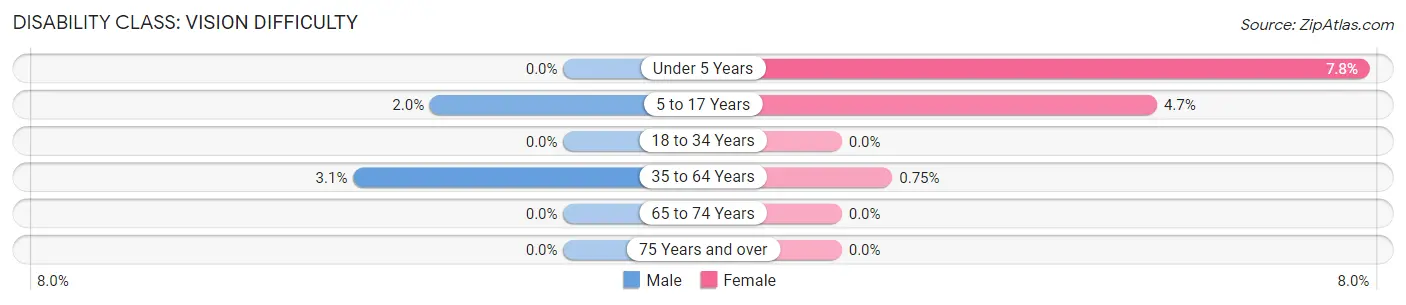
| Age Bracket | Male | Female |
| Under 5 Years | 0 (0.0%) | 8 (7.8%) |
| 5 to 17 Years | 7 (2.0%) | 16 (4.7%) |
| 18 to 34 Years | 0 (0.0%) | 0 (0.0%) |
| 35 to 64 Years | 23 (3.1%) | 6 (0.7%) |
| 65 to 74 Years | 0 (0.0%) | 0 (0.0%) |
| 75 Years and over | 0 (0.0%) | 0 (0.0%) |
Disability Class: Cognitive Difficulty
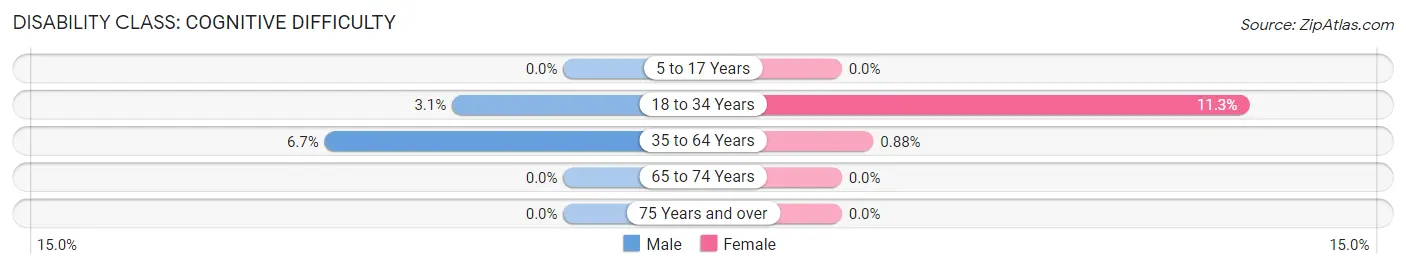
| Age Bracket | Male | Female |
| 5 to 17 Years | 0 (0.0%) | 0 (0.0%) |
| 18 to 34 Years | 10 (3.1%) | 27 (11.3%) |
| 35 to 64 Years | 49 (6.7%) | 7 (0.9%) |
| 65 to 74 Years | 0 (0.0%) | 0 (0.0%) |
| 75 Years and over | 0 (0.0%) | 0 (0.0%) |
Disability Class: Ambulatory Difficulty
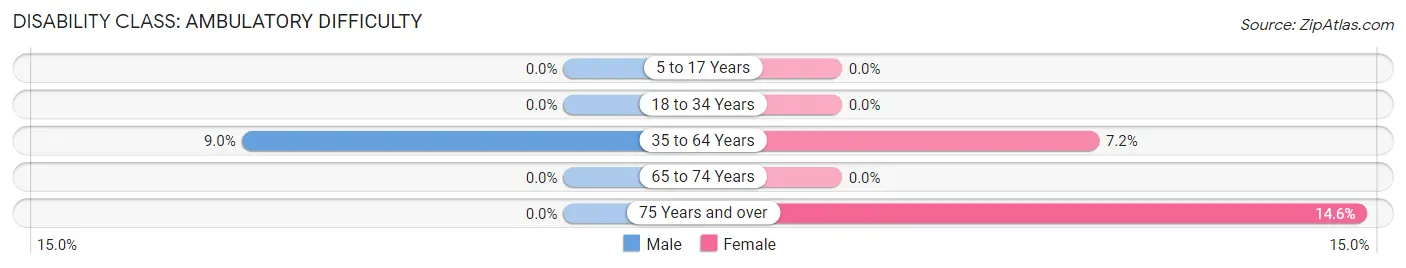
| Age Bracket | Male | Female |
| 5 to 17 Years | 0 (0.0%) | 0 (0.0%) |
| 18 to 34 Years | 0 (0.0%) | 0 (0.0%) |
| 35 to 64 Years | 66 (9.0%) | 57 (7.2%) |
| 65 to 74 Years | 0 (0.0%) | 0 (0.0%) |
| 75 Years and over | 0 (0.0%) | 12 (14.6%) |
Disability Class: Self-Care Difficulty
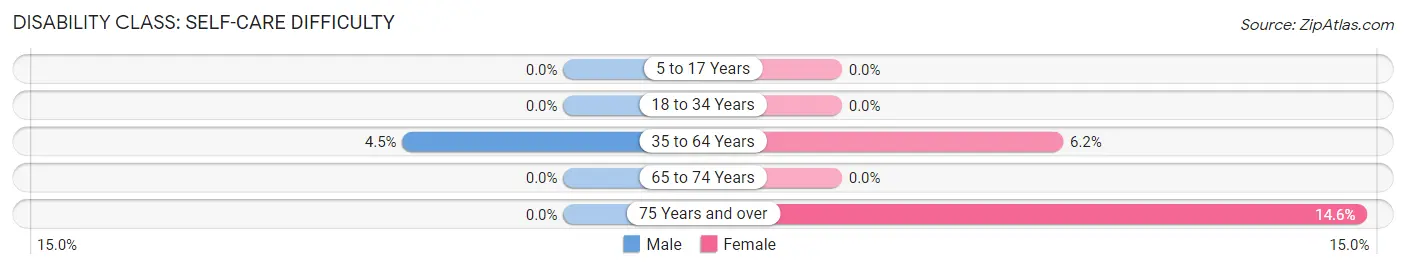
| Age Bracket | Male | Female |
| 5 to 17 Years | 0 (0.0%) | 0 (0.0%) |
| 18 to 34 Years | 0 (0.0%) | 0 (0.0%) |
| 35 to 64 Years | 33 (4.5%) | 49 (6.2%) |
| 65 to 74 Years | 0 (0.0%) | 0 (0.0%) |
| 75 Years and over | 0 (0.0%) | 12 (14.6%) |
Technology Access in Grasonville
Computing Device Access in Grasonville
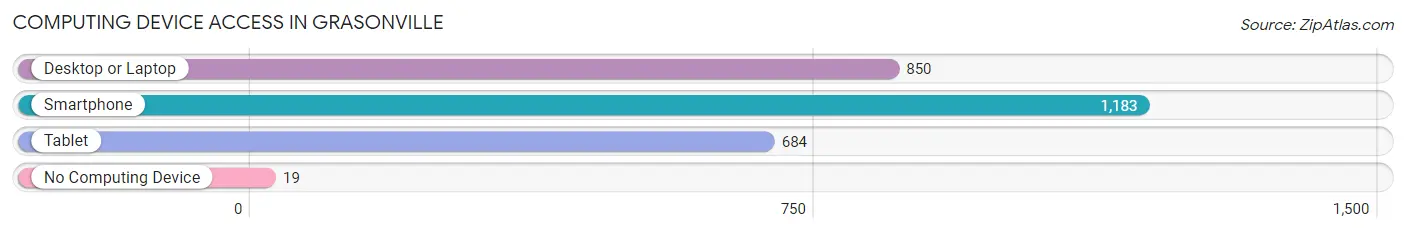
| Device Type | # Households | % Households |
| Desktop or Laptop | 850 | 68.6% |
| Smartphone | 1,183 | 95.5% |
| Tablet | 684 | 55.2% |
| No Computing Device | 19 | 1.5% |
| Total | 1,239 | 100.0% |
Internet Access in Grasonville
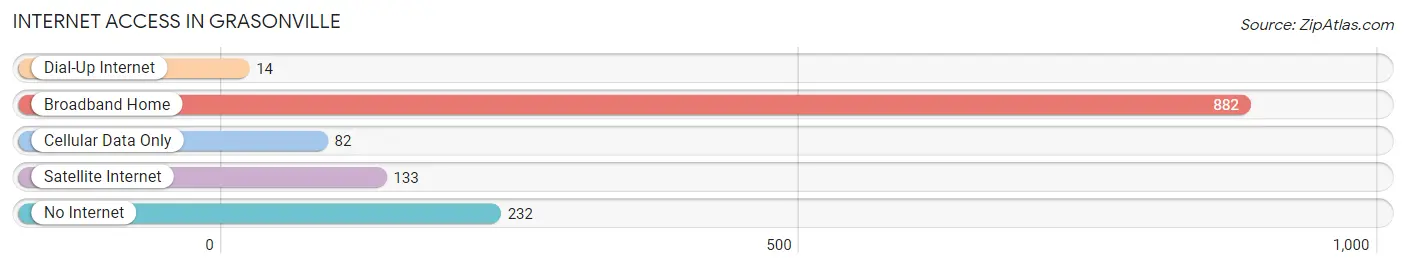
| Internet Type | # Households | % Households |
| Dial-Up Internet | 14 | 1.1% |
| Broadband Home | 882 | 71.2% |
| Cellular Data Only | 82 | 6.6% |
| Satellite Internet | 133 | 10.7% |
| No Internet | 232 | 18.7% |
| Total | 1,239 | 100.0% |
Grasonville Summary
Grasonville is a small town located in Queen Anne’s County, Maryland. It is situated on the Eastern Shore of the Chesapeake Bay, about 25 miles south of Annapolis. The town has a population of about 1,500 people and is part of the larger metropolitan area of Baltimore-Washington.
History
Grasonville was first settled in the early 1700s by English settlers. The town was originally known as “Grason’s Town” after the family who owned the land. The town was officially incorporated in 1872 and was named after the Grason family.
In the late 1800s, Grasonville was a thriving port town. It was a major hub for the oyster industry, and the town was home to several oyster packing houses. The town also had a large shipbuilding industry, and several ships were built in Grasonville.
In the early 1900s, Grasonville began to decline as the oyster industry declined and the shipbuilding industry moved elsewhere. The town was largely forgotten until the 1950s when it was rediscovered by tourists. Since then, Grasonville has become a popular tourist destination, with many visitors coming to enjoy the town’s natural beauty and historic charm.
Geography
Grasonville is located on the Eastern Shore of the Chesapeake Bay, about 25 miles south of Annapolis. The town is situated on a peninsula, with the Chester River to the north and the Miles River to the south. The town is surrounded by several small islands, including Kent Island, Tilghman Island, and Poplar Island.
The town is located in a temperate climate, with mild winters and hot, humid summers. The average temperature in the summer is around 80 degrees Fahrenheit, and the average temperature in the winter is around 40 degrees Fahrenheit.
Economy
Grasonville’s economy is largely based on tourism. The town is home to several popular tourist attractions, including the Chesapeake Bay Maritime Museum, the Chesapeake Bay Bridge, and the Chesapeake Bay Aquarium. The town also has several marinas, which attract boaters from all over the region.
In addition to tourism, Grasonville is also home to several small businesses, including restaurants, shops, and marinas. The town also has a small commercial fishing industry, with several local fishermen catching oysters, crabs, and other seafood.
Demographics
As of the 2010 census, Grasonville had a population of 1,500 people. The town is predominantly white, with about 90% of the population being white. The town also has a small African American population, with about 5% of the population being African American. The town also has a small Hispanic population, with about 2% of the population being Hispanic.
Grasonville is a small, close-knit community. The town is home to several churches, and the town’s residents are very active in their local churches. The town also has several civic organizations, including the Grasonville Lions Club and the Grasonville Historical Society.
Common Questions
What is Per Capita Income in Grasonville?
Per Capita income in Grasonville is $45,736.
What is the Median Family Income in Grasonville?
Median Family Income in Grasonville is $132,656.
What is the Median Household income in Grasonville?
Median Household Income in Grasonville is $109,375.
What is Income or Wage Gap in Grasonville?
Income or Wage Gap in Grasonville is 33.8%.
Women in Grasonville earn 66.2 cents for every dollar earned by a man.
What is Inequality or Gini Index in Grasonville?
Inequality or Gini Index in Grasonville is 0.41.
What is the Total Population of Grasonville?
Total Population of Grasonville is 3,332.
What is the Total Male Population of Grasonville?
Total Male Population of Grasonville is 1,661.
What is the Total Female Population of Grasonville?
Total Female Population of Grasonville is 1,671.
What is the Ratio of Males per 100 Females in Grasonville?
There are 99.40 Males per 100 Females in Grasonville.
What is the Ratio of Females per 100 Males in Grasonville?
There are 100.60 Females per 100 Males in Grasonville.
What is the Median Population Age in Grasonville?
Median Population Age in Grasonville is 41.7 Years.
What is the Average Family Size in Grasonville
Average Family Size in Grasonville is 3.1 People.
What is the Average Household Size in Grasonville
Average Household Size in Grasonville is 2.7 People.
How Large is the Labor Force in Grasonville?
There are 1,833 People in the Labor Forcein in Grasonville.
What is the Percentage of People in the Labor Force in Grasonville?
72.5% of People are in the Labor Force in Grasonville.
What is the Unemployment Rate in Grasonville?
Unemployment Rate in Grasonville is 3.0%.