Betterton, MD Map & Demographics
Betterton Map
Betterton Overview
$34,188
PER CAPITA INCOME
$71,250
AVG FAMILY INCOME
$62,750
AVG HOUSEHOLD INCOME
13.7%
WAGE / INCOME GAP [ % ]
86.3¢/ $1
WAGE / INCOME GAP [ $ ]
0.33
INEQUALITY / GINI INDEX
363
TOTAL POPULATION
159
MALE POPULATION
204
FEMALE POPULATION
77.94
MALES / 100 FEMALES
128.30
FEMALES / 100 MALES
52.8
MEDIAN AGE
2.5
AVG FAMILY SIZE
2.3
AVG HOUSEHOLD SIZE
158
LABOR FORCE [ PEOPLE ]
51.5%
PERCENT IN LABOR FORCE
24.1%
UNEMPLOYMENT RATE
Betterton Zip Codes
Betterton Area Codes
Income in Betterton
Income Overview in Betterton
Per Capita Income in Betterton is $34,188, while median incomes of families and households are $71,250 and $62,750 respectively.
| Characteristic | Number | Measure |
| Per Capita Income | 363 | $34,188 |
| Median Family Income | 110 | $71,250 |
| Mean Family Income | 110 | $86,385 |
| Median Household Income | 157 | $62,750 |
| Mean Household Income | 157 | $82,187 |
| Income Deficit | 110 | $0 |
| Wage / Income Gap (%) | 363 | 13.72% |
| Wage / Income Gap ($) | 363 | 86.28¢ per $1 |
| Gini / Inequality Index | 363 | 0.33 |
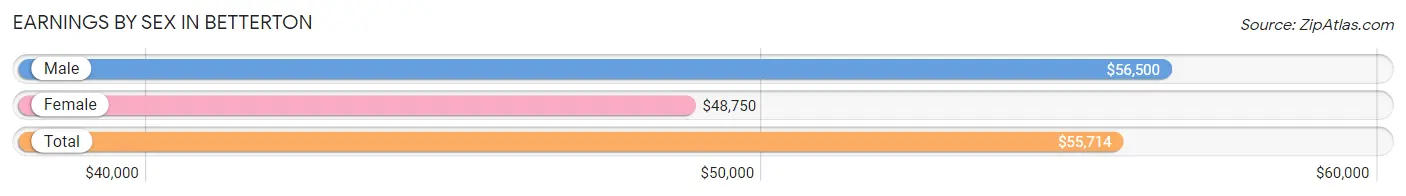
Earnings by Sex in Betterton
Average Earnings in Betterton are $55,714, $56,500 for men and $48,750 for women, a difference of 13.7%.
| Sex | Number | Average Earnings |
| Male | 90 (61.6%) | $56,500 |
| Female | 56 (38.4%) | $48,750 |
| Total | 146 (100.0%) | $55,714 |
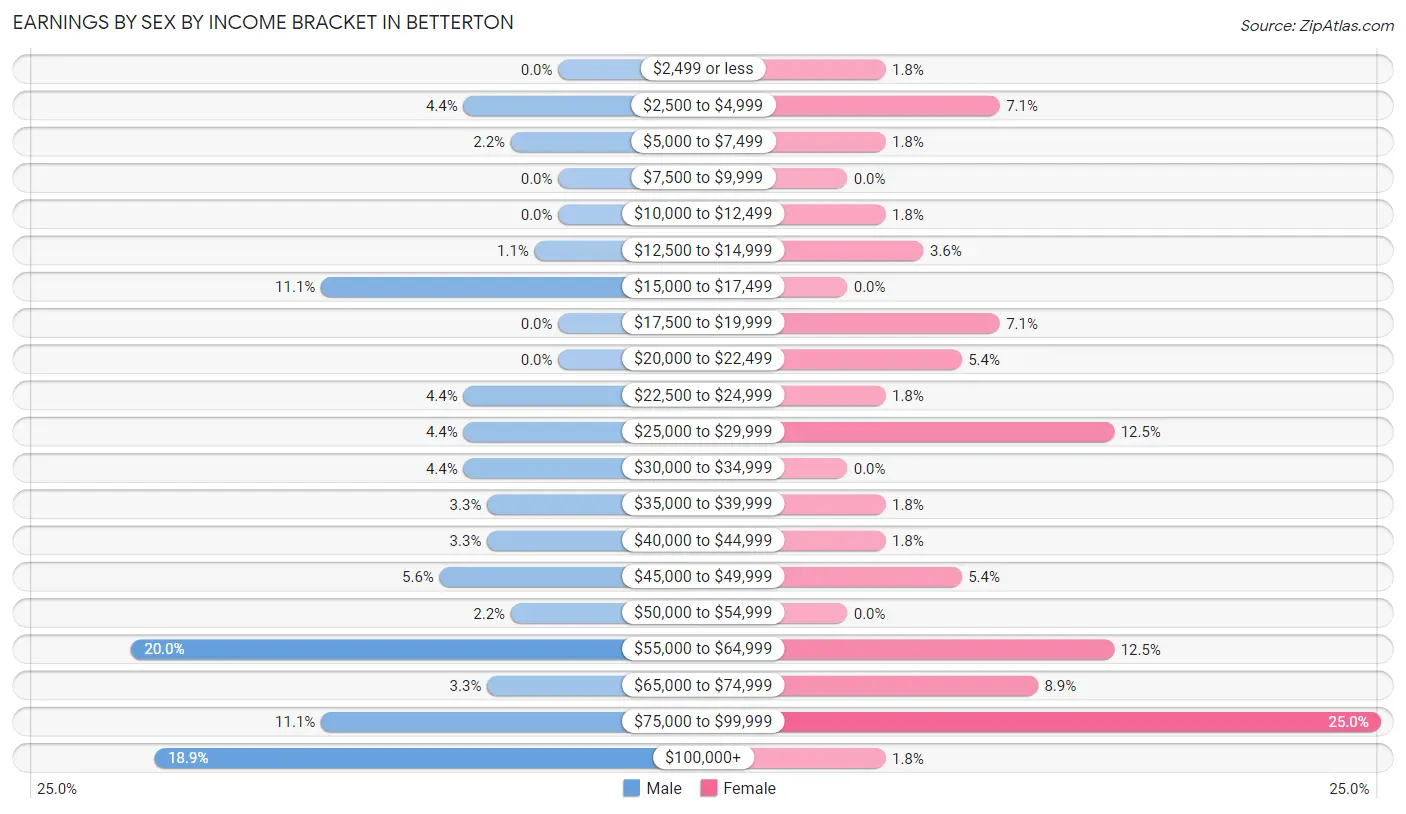
Earnings by Sex by Income Bracket in Betterton
The most common earnings brackets in Betterton are $55,000 to $64,999 for men (18 | 20.0%) and $75,000 to $99,999 for women (14 | 25.0%).
| Income | Male | Female |
| $2,499 or less | 0 (0.0%) | 1 (1.8%) |
| $2,500 to $4,999 | 4 (4.4%) | 4 (7.1%) |
| $5,000 to $7,499 | 2 (2.2%) | 1 (1.8%) |
| $7,500 to $9,999 | 0 (0.0%) | 0 (0.0%) |
| $10,000 to $12,499 | 0 (0.0%) | 1 (1.8%) |
| $12,500 to $14,999 | 1 (1.1%) | 2 (3.6%) |
| $15,000 to $17,499 | 10 (11.1%) | 0 (0.0%) |
| $17,500 to $19,999 | 0 (0.0%) | 4 (7.1%) |
| $20,000 to $22,499 | 0 (0.0%) | 3 (5.4%) |
| $22,500 to $24,999 | 4 (4.4%) | 1 (1.8%) |
| $25,000 to $29,999 | 4 (4.4%) | 7 (12.5%) |
| $30,000 to $34,999 | 4 (4.4%) | 0 (0.0%) |
| $35,000 to $39,999 | 3 (3.3%) | 1 (1.8%) |
| $40,000 to $44,999 | 3 (3.3%) | 1 (1.8%) |
| $45,000 to $49,999 | 5 (5.6%) | 3 (5.4%) |
| $50,000 to $54,999 | 2 (2.2%) | 0 (0.0%) |
| $55,000 to $64,999 | 18 (20.0%) | 7 (12.5%) |
| $65,000 to $74,999 | 3 (3.3%) | 5 (8.9%) |
| $75,000 to $99,999 | 10 (11.1%) | 14 (25.0%) |
| $100,000+ | 17 (18.9%) | 1 (1.8%) |
| Total | 90 (100.0%) | 56 (100.0%) |
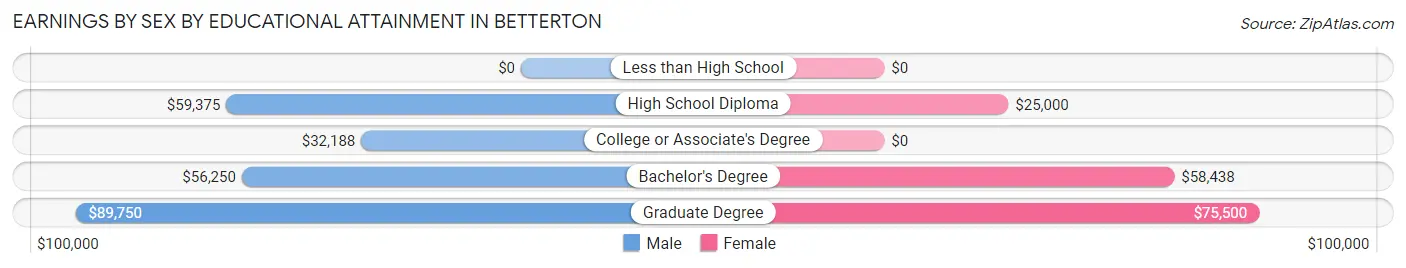
Earnings by Sex by Educational Attainment in Betterton
Average earnings in Betterton are $59,583 for men and $56,250 for women, a difference of 5.6%. Men with an educational attainment of graduate degree enjoy the highest average annual earnings of $89,750, while those with college or associate's degree education earn the least with $32,188. Women with an educational attainment of graduate degree earn the most with the average annual earnings of $75,500, while those with high school diploma education have the smallest earnings of $25,000.
| Educational Attainment | Male Income | Female Income |
| Less than High School | - | - |
| High School Diploma | $59,375 | $25,000 |
| College or Associate's Degree | $32,188 | $0 |
| Bachelor's Degree | $56,250 | $58,438 |
| Graduate Degree | $89,750 | $75,500 |
| Total | $59,583 | $56,250 |
Family Income in Betterton
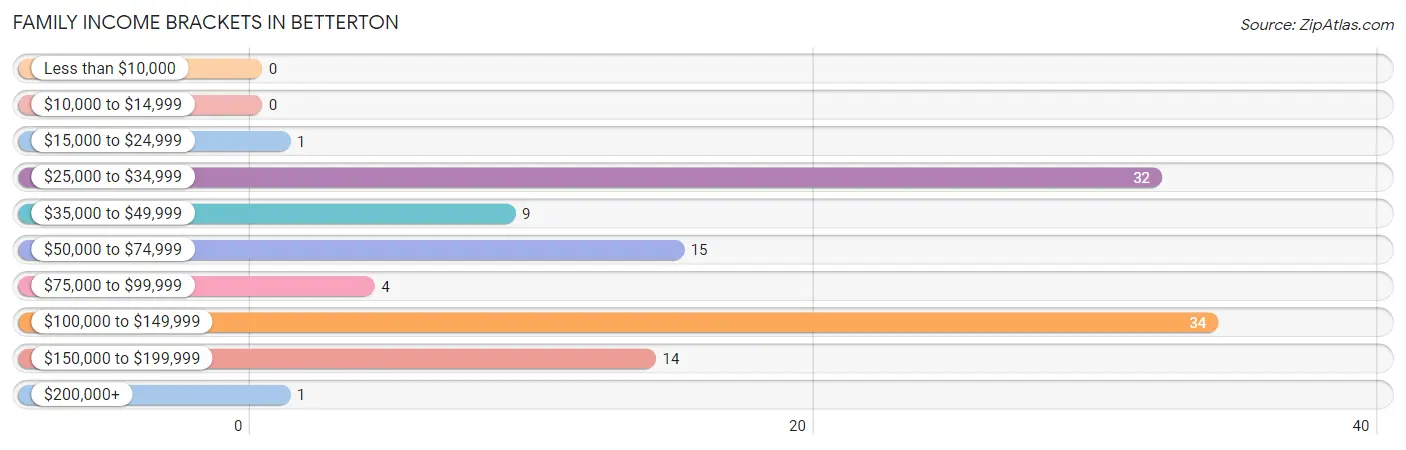
Family Income Brackets in Betterton
According to the Betterton family income data, there are 34 families falling into the $100,000 to $149,999 income range, which is the most common income bracket and makes up 30.9% of all families.
| Income Bracket | # Families | % Families |
| Less than $10,000 | 0 | 0.0% |
| $10,000 to $14,999 | 0 | 0.0% |
| $15,000 to $24,999 | 1 | 0.9% |
| $25,000 to $34,999 | 32 | 29.1% |
| $35,000 to $49,999 | 9 | 8.2% |
| $50,000 to $74,999 | 15 | 13.6% |
| $75,000 to $99,999 | 4 | 3.6% |
| $100,000 to $149,999 | 34 | 30.9% |
| $150,000 to $199,999 | 14 | 12.7% |
| $200,000+ | 1 | 0.9% |
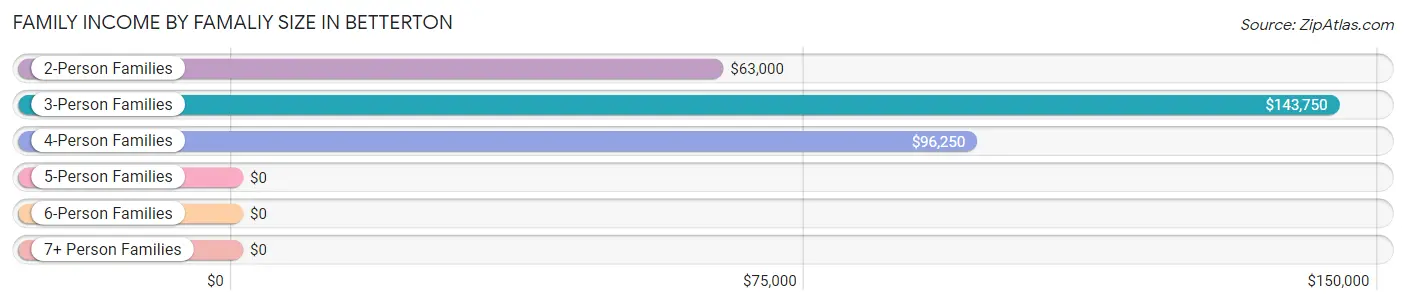
Family Income by Famaliy Size in Betterton
3-person families (14 | 12.7%) account for the highest median family income in Betterton with $143,750 per family, while 3-person families (14 | 12.7%) have the highest median income of $47,917 per family member.
| Income Bracket | # Families | Median Income |
| 2-Person Families | 80 (72.7%) | $63,000 |
| 3-Person Families | 14 (12.7%) | $143,750 |
| 4-Person Families | 6 (5.4%) | $96,250 |
| 5-Person Families | 8 (7.3%) | $0 |
| 6-Person Families | 1 (0.9%) | $0 |
| 7+ Person Families | 1 (0.9%) | $0 |
| Total | 110 (100.0%) | $71,250 |
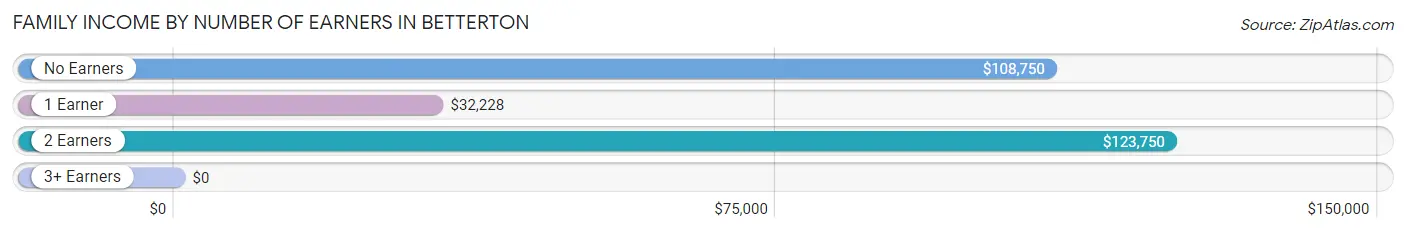
Family Income by Number of Earners in Betterton
| Number of Earners | # Families | Median Income |
| No Earners | 18 (16.4%) | $108,750 |
| 1 Earner | 55 (50.0%) | $32,228 |
| 2 Earners | 31 (28.2%) | $123,750 |
| 3+ Earners | 6 (5.4%) | $0 |
| Total | 110 (100.0%) | $71,250 |
Household Income in Betterton
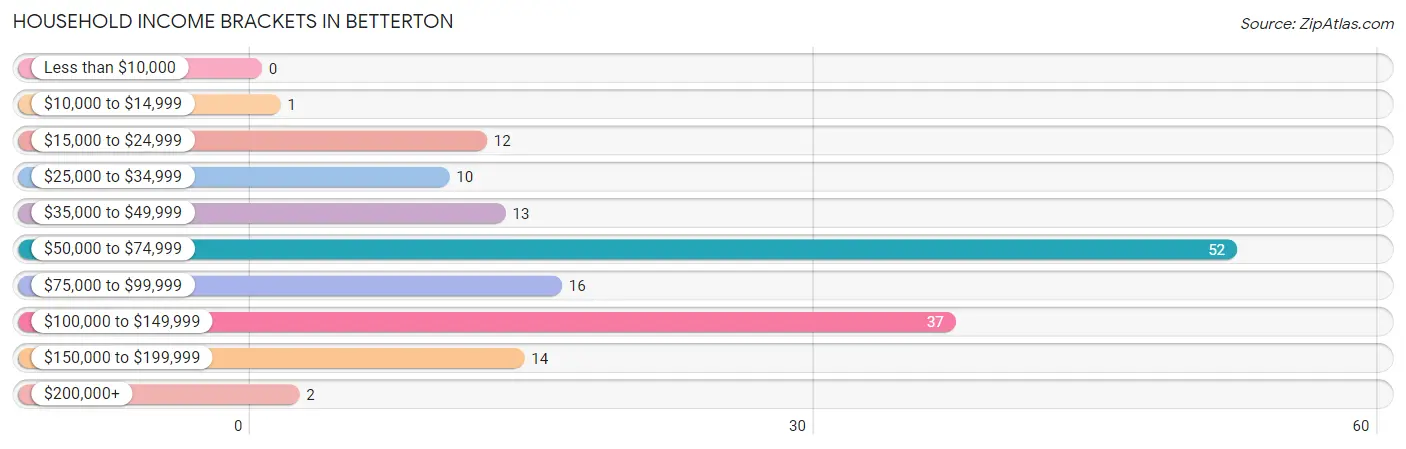
Household Income Brackets in Betterton
With 52 households falling in the category, the $50,000 to $74,999 income range is the most frequent in Betterton, accounting for 33.1% of all households.
| Income Bracket | # Households | % Households |
| Less than $10,000 | 0 | 0.0% |
| $10,000 to $14,999 | 1 | 0.6% |
| $15,000 to $24,999 | 12 | 7.6% |
| $25,000 to $34,999 | 10 | 6.4% |
| $35,000 to $49,999 | 13 | 8.3% |
| $50,000 to $74,999 | 52 | 33.1% |
| $75,000 to $99,999 | 16 | 10.2% |
| $100,000 to $149,999 | 37 | 23.6% |
| $150,000 to $199,999 | 14 | 8.9% |
| $200,000+ | 2 | 1.3% |
Household Income by Householder Age in Betterton
The median household income in Betterton is $62,750, with the highest median household income of $76,875 found in the 45 to 64 years age bracket for the primary householder. A total of 82 households (52.2%) fall into this category.
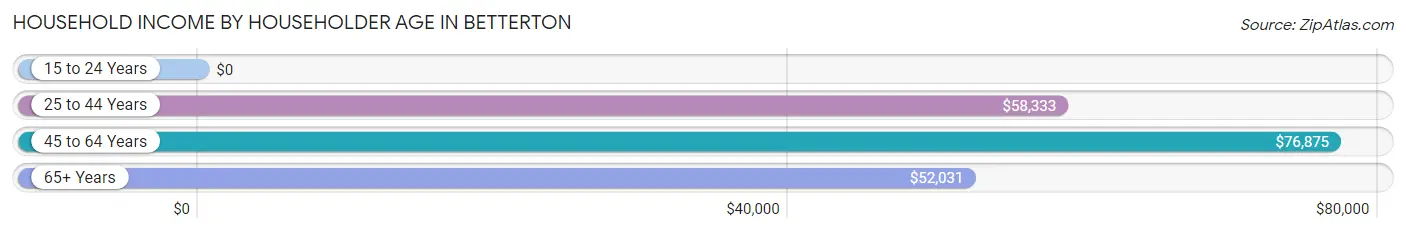
| Income Bracket | # Households | Median Income |
| 15 to 24 Years | 0 (0.0%) | $0 |
| 25 to 44 Years | 24 (15.3%) | $58,333 |
| 45 to 64 Years | 82 (52.2%) | $76,875 |
| 65+ Years | 51 (32.5%) | $52,031 |
| Total | 157 (100.0%) | $62,750 |
Poverty in Betterton
Income Below Poverty by Sex and Age in Betterton
With 8.3% poverty level for males and 12.4% for females among the residents of Betterton, 25 to 34 year old males and 35 to 44 year old females are the most vulnerable to poverty, with 4 males (33.3%) and 18 females (62.1%) in their respective age groups living below the poverty level.
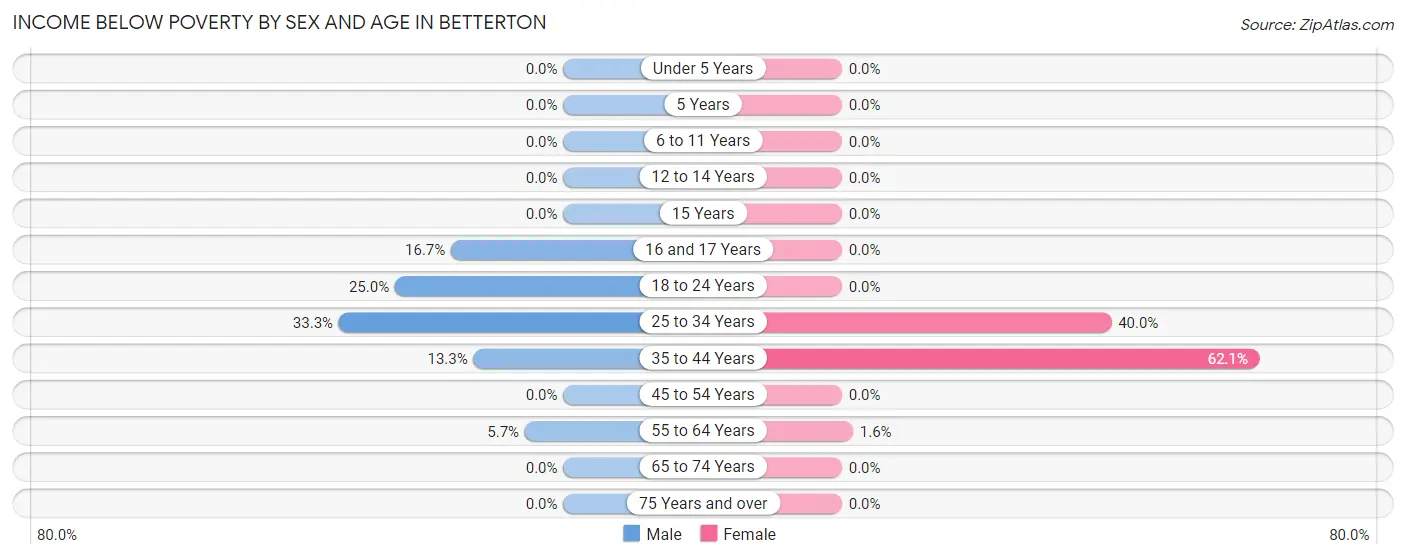
| Age Bracket | Male | Female |
| Under 5 Years | 0 (0.0%) | 0 (0.0%) |
| 5 Years | 0 (0.0%) | 0 (0.0%) |
| 6 to 11 Years | 0 (0.0%) | 0 (0.0%) |
| 12 to 14 Years | 0 (0.0%) | 0 (0.0%) |
| 15 Years | 0 (0.0%) | 0 (0.0%) |
| 16 and 17 Years | 1 (16.7%) | 0 (0.0%) |
| 18 to 24 Years | 4 (25.0%) | 0 (0.0%) |
| 25 to 34 Years | 4 (33.3%) | 6 (40.0%) |
| 35 to 44 Years | 2 (13.3%) | 18 (62.1%) |
| 45 to 54 Years | 0 (0.0%) | 0 (0.0%) |
| 55 to 64 Years | 2 (5.7%) | 1 (1.6%) |
| 65 to 74 Years | 0 (0.0%) | 0 (0.0%) |
| 75 Years and over | 0 (0.0%) | 0 (0.0%) |
| Total | 13 (8.3%) | 25 (12.4%) |
Income Above Poverty by Sex and Age in Betterton
According to the poverty statistics in Betterton, males aged under 5 years and females aged under 5 years are the age groups that are most secure financially, with 100.0% of males and 100.0% of females in these age groups living above the poverty line.
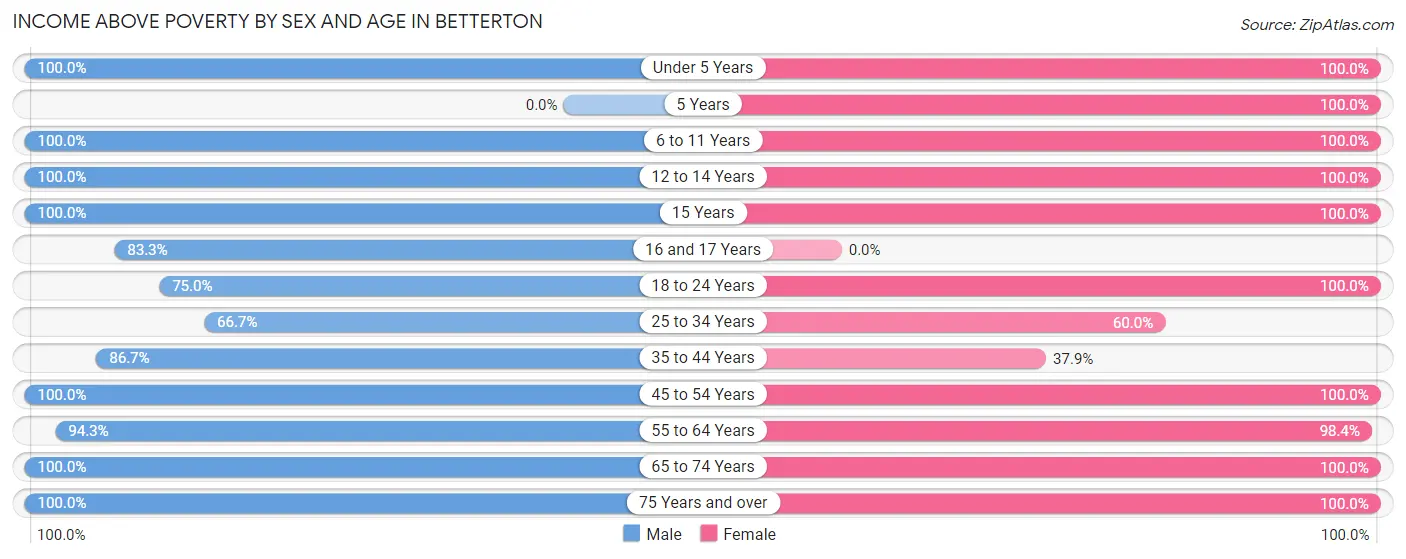
| Age Bracket | Male | Female |
| Under 5 Years | 2 (100.0%) | 20 (100.0%) |
| 5 Years | 0 (0.0%) | 9 (100.0%) |
| 6 to 11 Years | 6 (100.0%) | 2 (100.0%) |
| 12 to 14 Years | 6 (100.0%) | 1 (100.0%) |
| 15 Years | 4 (100.0%) | 2 (100.0%) |
| 16 and 17 Years | 5 (83.3%) | 0 (0.0%) |
| 18 to 24 Years | 12 (75.0%) | 4 (100.0%) |
| 25 to 34 Years | 8 (66.7%) | 9 (60.0%) |
| 35 to 44 Years | 13 (86.7%) | 11 (37.9%) |
| 45 to 54 Years | 20 (100.0%) | 14 (100.0%) |
| 55 to 64 Years | 33 (94.3%) | 60 (98.4%) |
| 65 to 74 Years | 22 (100.0%) | 8 (100.0%) |
| 75 Years and over | 13 (100.0%) | 37 (100.0%) |
| Total | 144 (91.7%) | 177 (87.6%) |
Income Below Poverty Among Married-Couple Families in Betterton
The poverty statistics for married-couple families in Betterton show that 1.5% or 1 of the total 65 families live below the poverty line. Families with 1 or 2 children have the highest poverty rate of 7.7%, comprising of 1 families. On the other hand, families with no children have the lowest poverty rate of 0.0%, which includes 0 families.
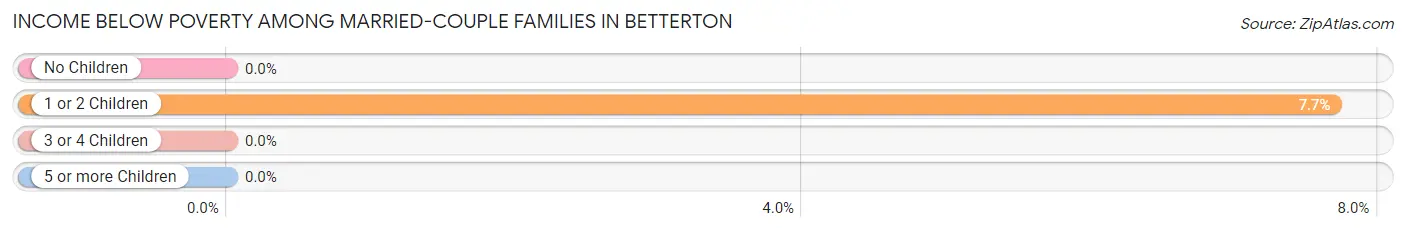
| Children | Above Poverty | Below Poverty |
| No Children | 48 (100.0%) | 0 (0.0%) |
| 1 or 2 Children | 12 (92.3%) | 1 (7.7%) |
| 3 or 4 Children | 4 (100.0%) | 0 (0.0%) |
| 5 or more Children | 0 (0.0%) | 0 (0.0%) |
| Total | 64 (98.5%) | 1 (1.5%) |
Income Below Poverty Among Single-Parent Households in Betterton
| Children | Single Father | Single Mother |
| No Children | 0 (0.0%) | 0 (0.0%) |
| 1 or 2 Children | 0 (0.0%) | 0 (0.0%) |
| 3 or 4 Children | 0 (0.0%) | 0 (0.0%) |
| 5 or more Children | 0 (0.0%) | 0 (0.0%) |
| Total | 0 (0.0%) | 0 (0.0%) |
Income Below Poverty Among Married-Couple vs Single-Parent Households in Betterton
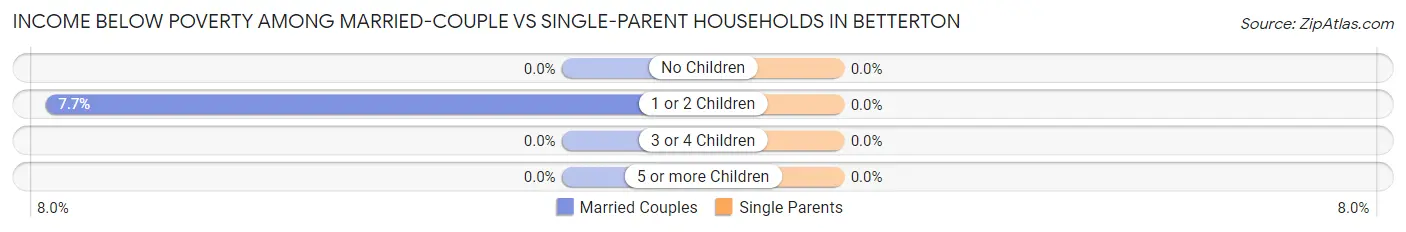
| Children | Married-Couple Families | Single-Parent Households |
| No Children | 0 (0.0%) | 0 (0.0%) |
| 1 or 2 Children | 1 (7.7%) | 0 (0.0%) |
| 3 or 4 Children | 0 (0.0%) | 0 (0.0%) |
| 5 or more Children | 0 (0.0%) | 0 (0.0%) |
| Total | 1 (1.5%) | 0 (0.0%) |
Race in Betterton
The most populous races in Betterton are White / Caucasian (286 | 78.8%), Black / African American (57 | 15.7%), and Hispanic or Latino (24 | 6.6%).
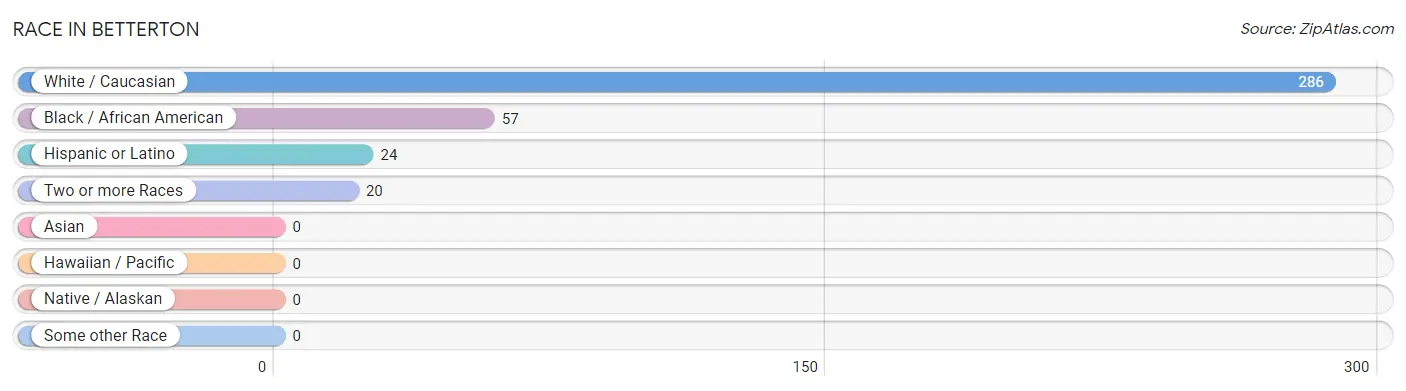
| Race | # Population | % Population |
| Asian | 0 | 0.0% |
| Black / African American | 57 | 15.7% |
| Hawaiian / Pacific | 0 | 0.0% |
| Hispanic or Latino | 24 | 6.6% |
| Native / Alaskan | 0 | 0.0% |
| White / Caucasian | 286 | 78.8% |
| Two or more Races | 20 | 5.5% |
| Some other Race | 0 | 0.0% |
| Total | 363 | 100.0% |
Ancestry in Betterton
The most populous ancestries reported in Betterton are German (89 | 24.5%), Irish (78 | 21.5%), English (51 | 14.1%), Italian (22 | 6.1%), and Puerto Rican (18 | 5.0%), together accounting for 71.1% of all Betterton residents.
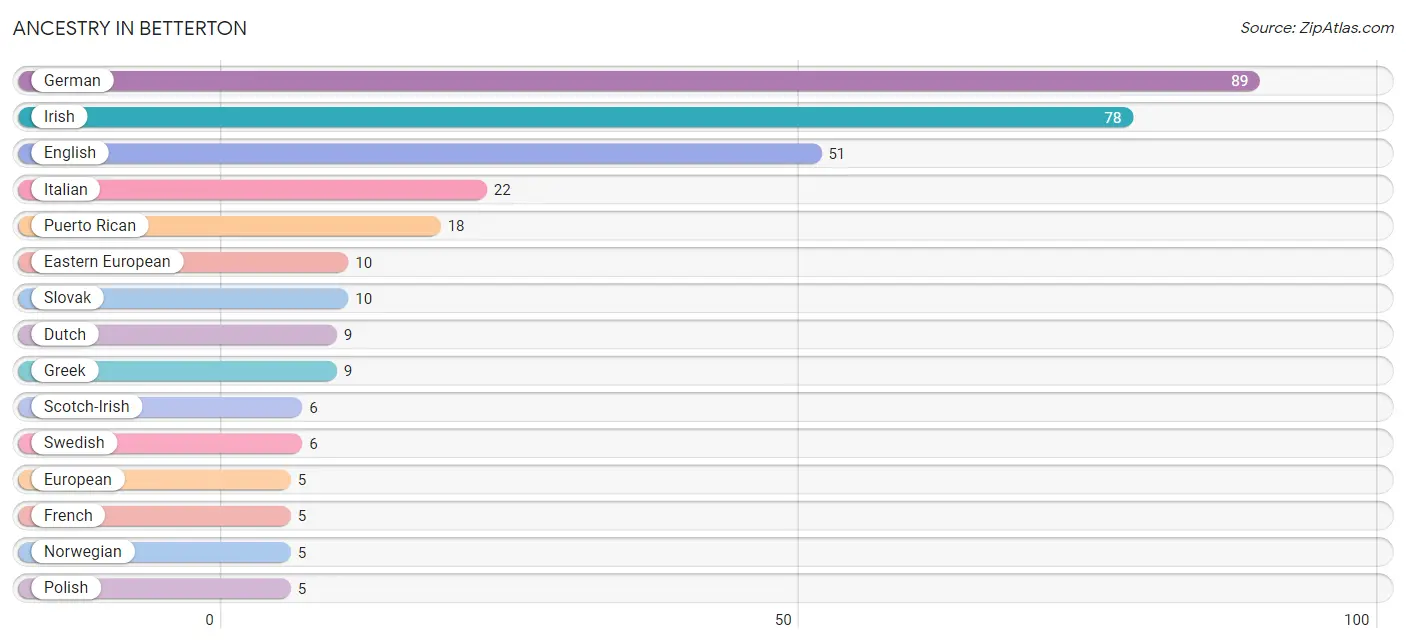
| Ancestry | # Population | % Population |
| Bolivian | 2 | 0.5% |
| British | 4 | 1.1% |
| Dominican | 4 | 1.1% |
| Dutch | 9 | 2.5% |
| Eastern European | 10 | 2.8% |
| English | 51 | 14.1% |
| European | 5 | 1.4% |
| French | 5 | 1.4% |
| German | 89 | 24.5% |
| Greek | 9 | 2.5% |
| Hungarian | 3 | 0.8% |
| Irish | 78 | 21.5% |
| Italian | 22 | 6.1% |
| Lithuanian | 4 | 1.1% |
| Norwegian | 5 | 1.4% |
| Polish | 5 | 1.4% |
| Puerto Rican | 18 | 5.0% |
| Scandinavian | 1 | 0.3% |
| Scotch-Irish | 6 | 1.7% |
| Scottish | 4 | 1.1% |
| Slovak | 10 | 2.8% |
| South American | 2 | 0.5% |
| Swedish | 6 | 1.7% |
| Ukrainian | 4 | 1.1% |
| Welsh | 1 | 0.3% | View All 25 Rows |
Immigrants in Betterton
The most numerous immigrant groups reported in Betterton came from Europe (6 | 1.7%), Germany (6 | 1.7%), Western Europe (6 | 1.7%), Bolivia (2 | 0.5%), and Latin America (2 | 0.5%), together accounting for 6.0% of all Betterton residents.
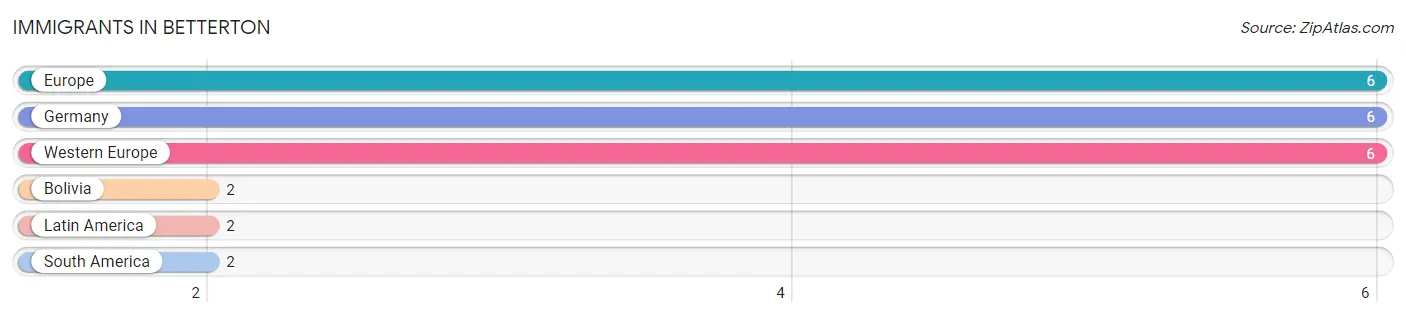
| Immigration Origin | # Population | % Population |
| Bolivia | 2 | 0.5% |
| Europe | 6 | 1.7% |
| Germany | 6 | 1.7% |
| Latin America | 2 | 0.5% |
| South America | 2 | 0.5% |
| Western Europe | 6 | 1.7% | View All 6 Rows |
Sex and Age in Betterton
Sex and Age in Betterton
The most populous age groups in Betterton are 60 to 64 Years (30 | 18.9%) for men and 60 to 64 Years (52 | 25.5%) for women.
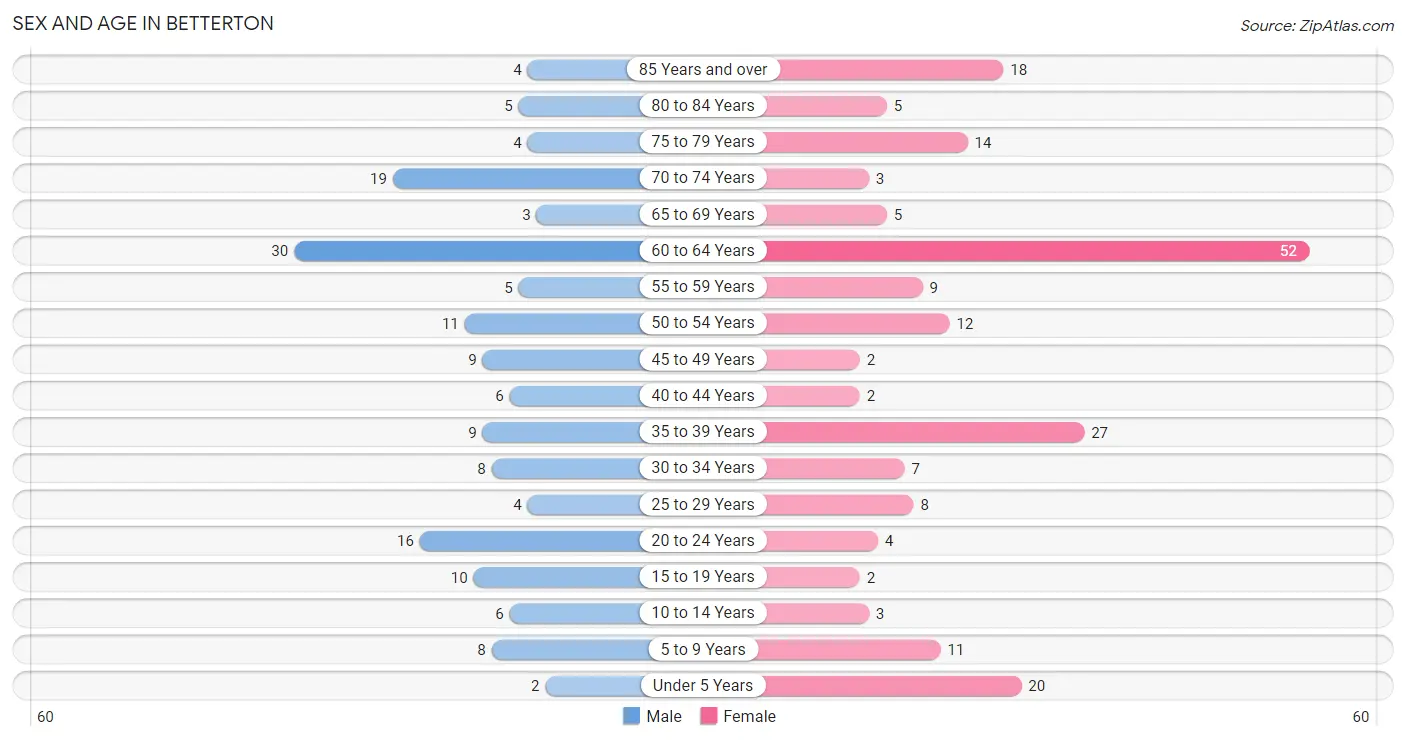
| Age Bracket | Male | Female |
| Under 5 Years | 2 (1.3%) | 20 (9.8%) |
| 5 to 9 Years | 8 (5.0%) | 11 (5.4%) |
| 10 to 14 Years | 6 (3.8%) | 3 (1.5%) |
| 15 to 19 Years | 10 (6.3%) | 2 (1.0%) |
| 20 to 24 Years | 16 (10.1%) | 4 (2.0%) |
| 25 to 29 Years | 4 (2.5%) | 8 (3.9%) |
| 30 to 34 Years | 8 (5.0%) | 7 (3.4%) |
| 35 to 39 Years | 9 (5.7%) | 27 (13.2%) |
| 40 to 44 Years | 6 (3.8%) | 2 (1.0%) |
| 45 to 49 Years | 9 (5.7%) | 2 (1.0%) |
| 50 to 54 Years | 11 (6.9%) | 12 (5.9%) |
| 55 to 59 Years | 5 (3.1%) | 9 (4.4%) |
| 60 to 64 Years | 30 (18.9%) | 52 (25.5%) |
| 65 to 69 Years | 3 (1.9%) | 5 (2.5%) |
| 70 to 74 Years | 19 (11.9%) | 3 (1.5%) |
| 75 to 79 Years | 4 (2.5%) | 14 (6.9%) |
| 80 to 84 Years | 5 (3.1%) | 5 (2.5%) |
| 85 Years and over | 4 (2.5%) | 18 (8.8%) |
| Total | 159 (100.0%) | 204 (100.0%) |
Families and Households in Betterton
Median Family Size in Betterton
The median family size in Betterton is 2.48 persons per family, with single male/father families (14 | 12.7%) accounting for the largest median family size of 3.07 persons per family. On the other hand, single female/mother families (31 | 28.2%) represent the smallest median family size with 1.77 persons per family.
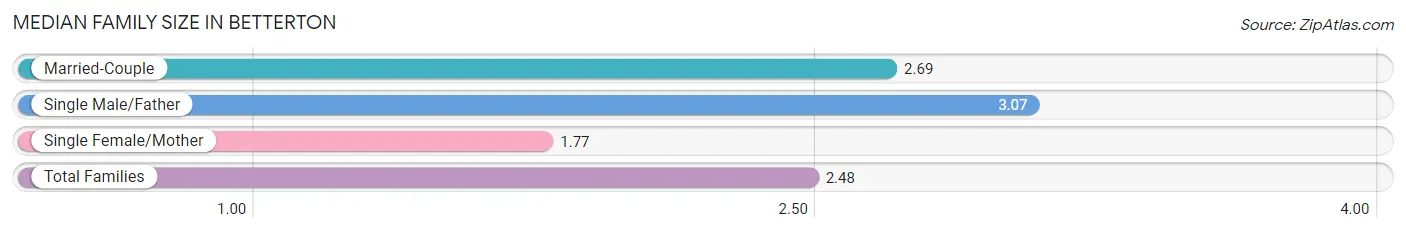
| Family Type | # Families | Family Size |
| Married-Couple | 65 (59.1%) | 2.69 |
| Single Male/Father | 14 (12.7%) | 3.07 |
| Single Female/Mother | 31 (28.2%) | 1.77 |
| Total Families | 110 (100.0%) | 2.48 |
Median Household Size in Betterton
The median household size in Betterton is 2.31 persons per household, with single male/father households (14 | 8.9%) accounting for the largest median household size of 3.29 persons per household. non-family households (47 | 29.9%) represent the smallest median household size with 1.13 persons per household.
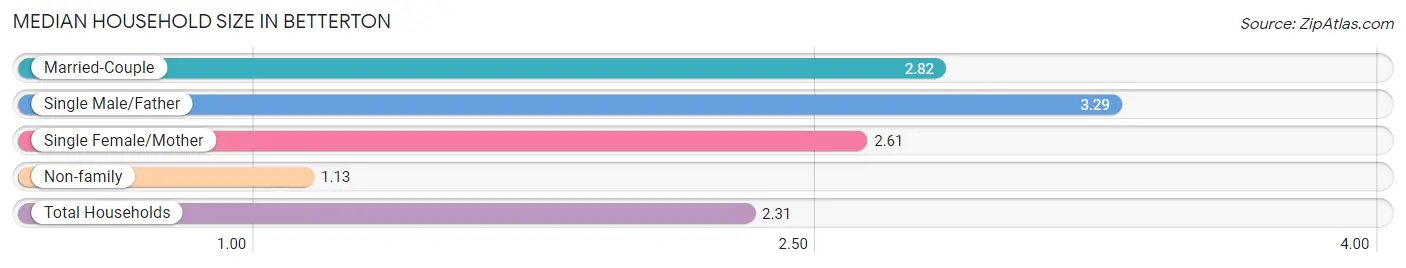
| Household Type | # Households | Household Size |
| Married-Couple | 65 (41.4%) | 2.82 |
| Single Male/Father | 14 (8.9%) | 3.29 |
| Single Female/Mother | 31 (19.8%) | 2.61 |
| Non-family | 47 (29.9%) | 1.13 |
| Total Households | 157 (100.0%) | 2.31 |
Household Size by Marriage Status in Betterton
Out of a total of 157 households in Betterton, 110 (70.1%) are family households, while 47 (29.9%) are nonfamily households. The most numerous type of family households are 2-person households, comprising 51, and the most common type of nonfamily households are 1-person households, comprising 41.
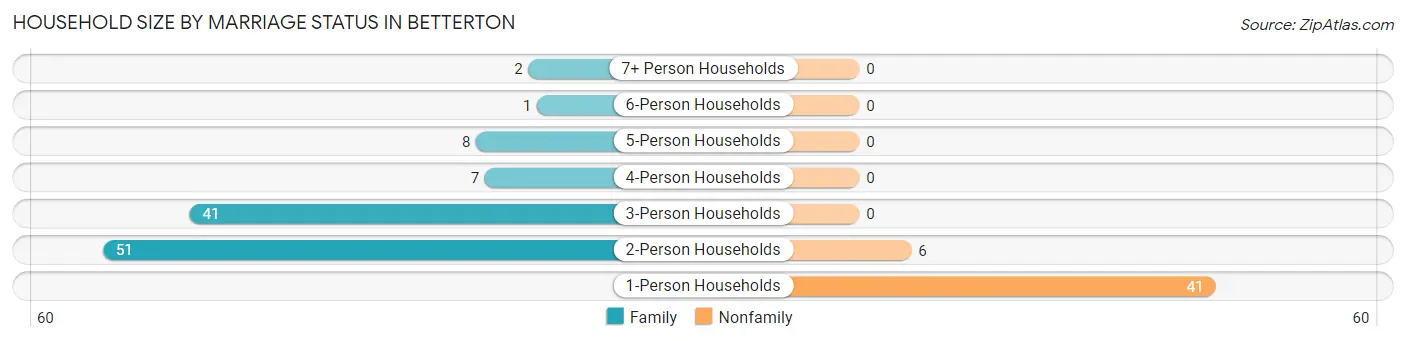
| Household Size | Family Households | Nonfamily Households |
| 1-Person Households | - | 41 (26.1%) |
| 2-Person Households | 51 (32.5%) | 6 (3.8%) |
| 3-Person Households | 41 (26.1%) | 0 (0.0%) |
| 4-Person Households | 7 (4.5%) | 0 (0.0%) |
| 5-Person Households | 8 (5.1%) | 0 (0.0%) |
| 6-Person Households | 1 (0.6%) | 0 (0.0%) |
| 7+ Person Households | 2 (1.3%) | 0 (0.0%) |
| Total | 110 (70.1%) | 47 (29.9%) |
Female Fertility in Betterton
Fertility by Age in Betterton
Average fertility rate in Betterton is 74.0 births per 1,000 women. Women in the age bracket of 20 to 34 years have the highest fertility rate with 211.0 births per 1,000 women. Women in the age bracket of 20 to 34 years acount for 100.0% of all women with births.
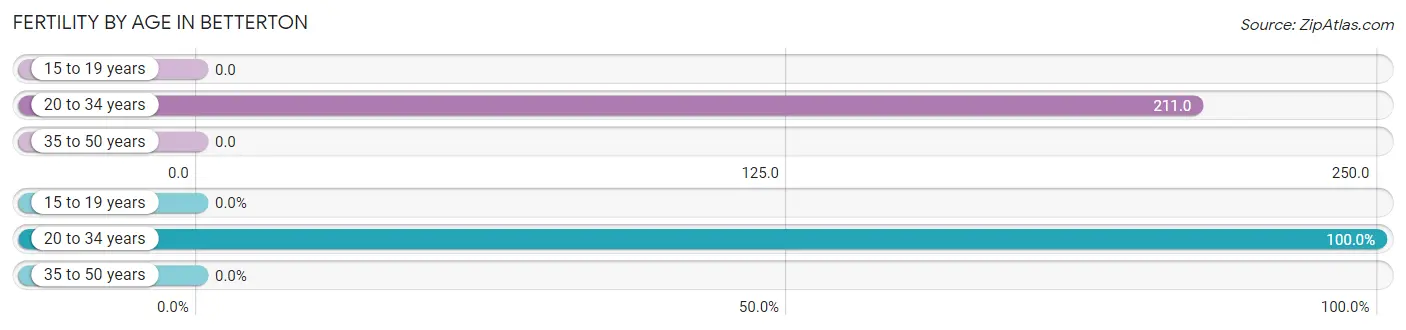
| Age Bracket | Women with Births | Births / 1,000 Women |
| 15 to 19 years | 0 (0.0%) | 0.0 |
| 20 to 34 years | 4 (100.0%) | 211.0 |
| 35 to 50 years | 0 (0.0%) | 0.0 |
| Total | 4 (100.0%) | 74.0 |
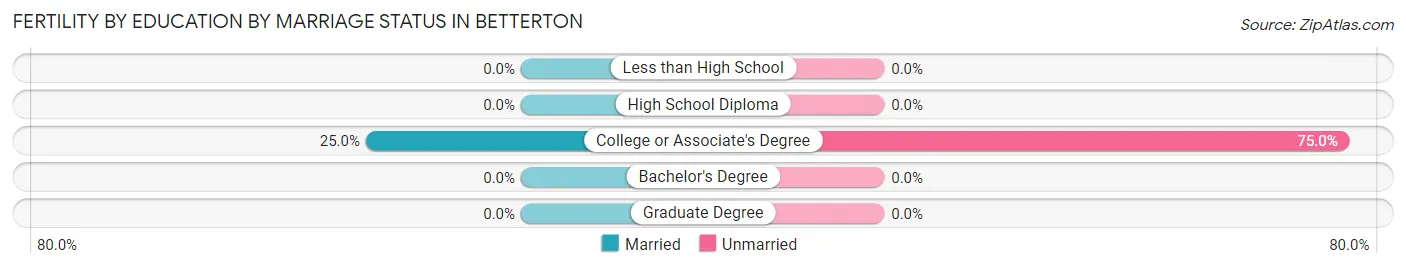
Fertility by Age by Marriage Status in Betterton
25.0% of women with births (4) in Betterton are married. The highest percentage of unmarried women with births falls into 20 to 34 years age bracket with 75.0% of them unmarried at the time of birth, while the lowest percentage of unmarried women with births belong to 20 to 34 years age bracket with 75.0% of them unmarried.
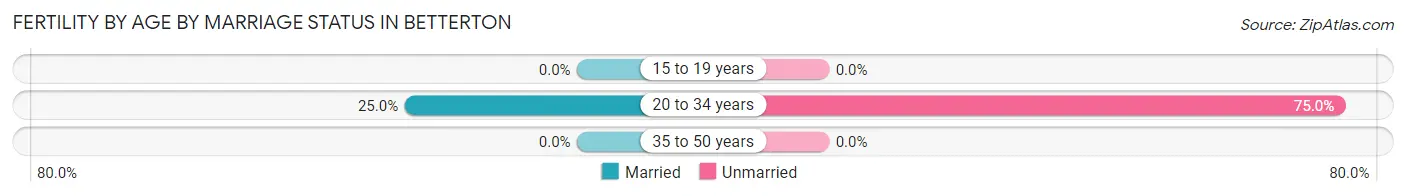
| Age Bracket | Married | Unmarried |
| 15 to 19 years | 0 (0.0%) | 0 (0.0%) |
| 20 to 34 years | 1 (25.0%) | 3 (75.0%) |
| 35 to 50 years | 0 (0.0%) | 0 (0.0%) |
| Total | 1 (25.0%) | 3 (75.0%) |
Fertility by Education in Betterton
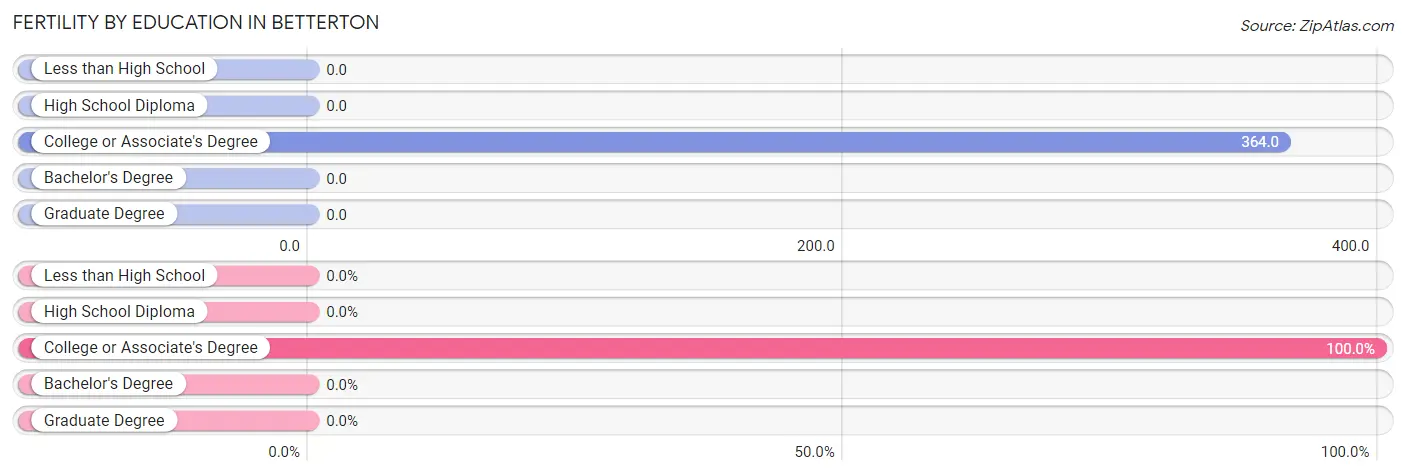
| Educational Attainment | Women with Births | Births / 1,000 Women |
| Less than High School | 0 (0.0%) | 0.0 |
| High School Diploma | 0 (0.0%) | 0.0 |
| College or Associate's Degree | 4 (100.0%) | 364.0 |
| Bachelor's Degree | 0 (0.0%) | 0.0 |
| Graduate Degree | 0 (0.0%) | 0.0 |
| Total | 4 (100.0%) | 74.0 |
Fertility by Education by Marriage Status in Betterton
75.0% of women with births in Betterton are unmarried. Women with the educational attainment of college or associate's degree are most likely to be married with 25.0% of them married at childbirth, while women with the educational attainment of college or associate's degree are least likely to be married with 75.0% of them unmarried at childbirth.
| Educational Attainment | Married | Unmarried |
| Less than High School | 0 (0.0%) | 0 (0.0%) |
| High School Diploma | 0 (0.0%) | 0 (0.0%) |
| College or Associate's Degree | 1 (25.0%) | 3 (75.0%) |
| Bachelor's Degree | 0 (0.0%) | 0 (0.0%) |
| Graduate Degree | 0 (0.0%) | 0 (0.0%) |
| Total | 1 (25.0%) | 3 (75.0%) |
Employment Characteristics in Betterton
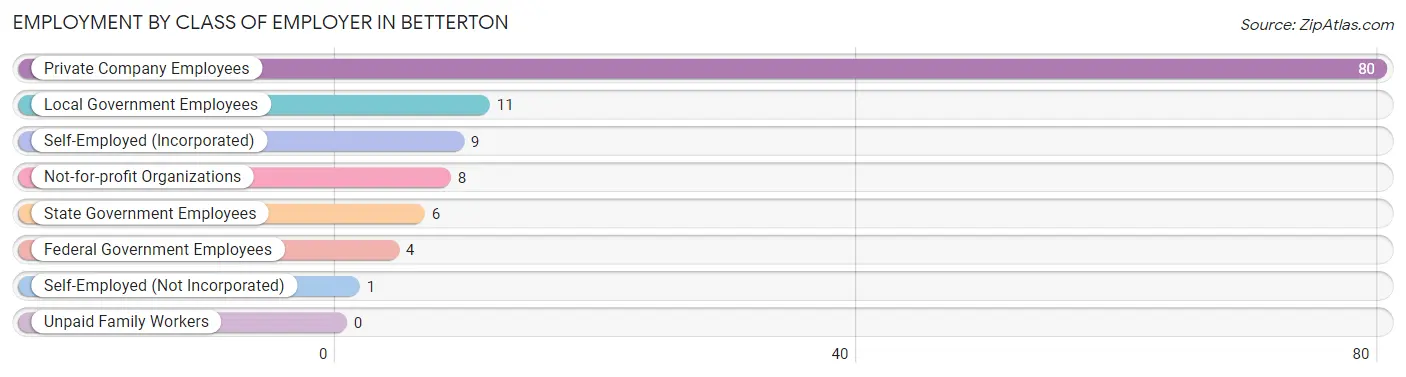
Employment by Class of Employer in Betterton
Among the 119 employed individuals in Betterton, private company employees (80 | 67.2%), local government employees (11 | 9.2%), and self-employed (incorporated) (9 | 7.6%) make up the most common classes of employment.
| Employer Class | # Employees | % Employees |
| Private Company Employees | 80 | 67.2% |
| Self-Employed (Incorporated) | 9 | 7.6% |
| Self-Employed (Not Incorporated) | 1 | 0.8% |
| Not-for-profit Organizations | 8 | 6.7% |
| Local Government Employees | 11 | 9.2% |
| State Government Employees | 6 | 5.0% |
| Federal Government Employees | 4 | 3.4% |
| Unpaid Family Workers | 0 | 0.0% |
| Total | 119 | 100.0% |
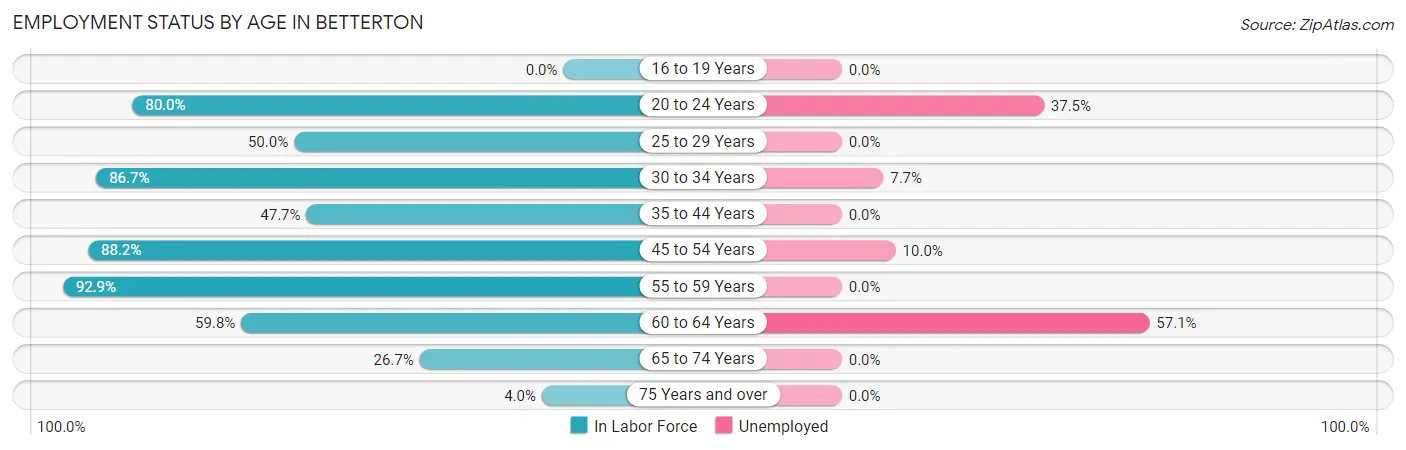
Employment Status by Age in Betterton
According to the labor force statistics for Betterton, out of the total population over 16 years of age (307), 51.5% or 158 individuals are in the labor force, with 24.1% or 38 of them unemployed. The age group with the highest labor force participation rate is 55 to 59 years, with 92.9% or 13 individuals in the labor force. Within the labor force, the 60 to 64 years age range has the highest percentage of unemployed individuals, with 57.1% or 28 of them being unemployed.
| Age Bracket | In Labor Force | Unemployed |
| 16 to 19 Years | 0 (0.0%) | 0 (0.0%) |
| 20 to 24 Years | 16 (80.0%) | 6 (37.5%) |
| 25 to 29 Years | 6 (50.0%) | 0 (0.0%) |
| 30 to 34 Years | 13 (86.7%) | 1 (7.7%) |
| 35 to 44 Years | 21 (47.7%) | 0 (0.0%) |
| 45 to 54 Years | 30 (88.2%) | 3 (10.0%) |
| 55 to 59 Years | 13 (92.9%) | 0 (0.0%) |
| 60 to 64 Years | 49 (59.8%) | 28 (57.1%) |
| 65 to 74 Years | 8 (26.7%) | 0 (0.0%) |
| 75 Years and over | 2 (4.0%) | 0 (0.0%) |
| Total | 158 (51.5%) | 38 (24.1%) |
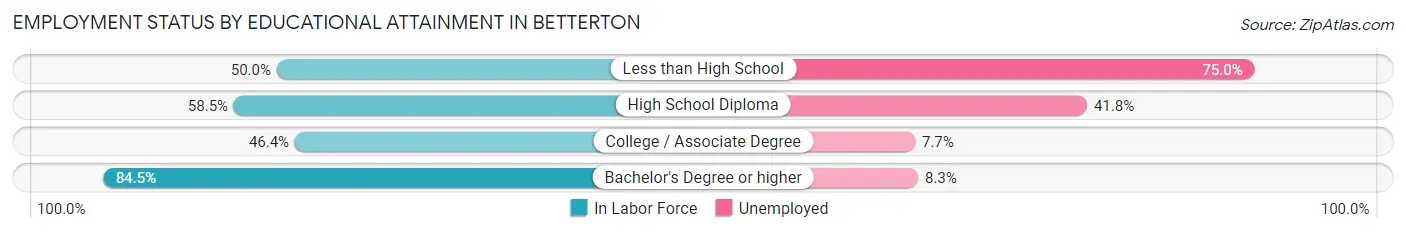
Employment Status by Educational Attainment in Betterton
According to labor force statistics for Betterton, 65.7% of individuals (132) out of the total population between 25 and 64 years of age (201) are in the labor force, with 24.2% or 32 of them being unemployed. The group with the highest labor force participation rate are those with the educational attainment of bachelor's degree or higher, with 84.5% or 60 individuals in the labor force. Within the labor force, individuals with less than high school education have the highest percentage of unemployment, with 75.0% or 3 of them being unemployed.
| Educational Attainment | In Labor Force | Unemployed |
| Less than High School | 4 (50.0%) | 6 (75.0%) |
| High School Diploma | 55 (58.5%) | 39 (41.8%) |
| College / Associate Degree | 13 (46.4%) | 2 (7.7%) |
| Bachelor's Degree or higher | 60 (84.5%) | 6 (8.3%) |
| Total | 132 (65.7%) | 49 (24.2%) |
Employment Occupations by Sex in Betterton
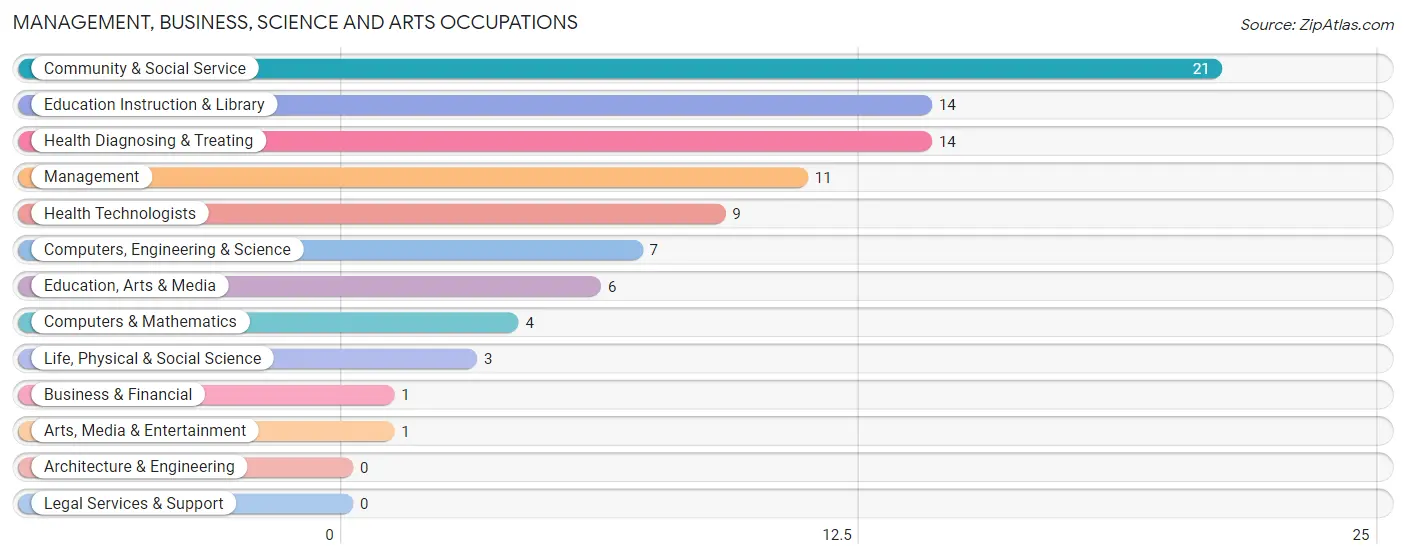
Management, Business, Science and Arts Occupations
The most common Management, Business, Science and Arts occupations in Betterton are Community & Social Service (21 | 17.5%), Education Instruction & Library (14 | 11.7%), Health Diagnosing & Treating (14 | 11.7%), Management (11 | 9.2%), and Health Technologists (9 | 7.5%).
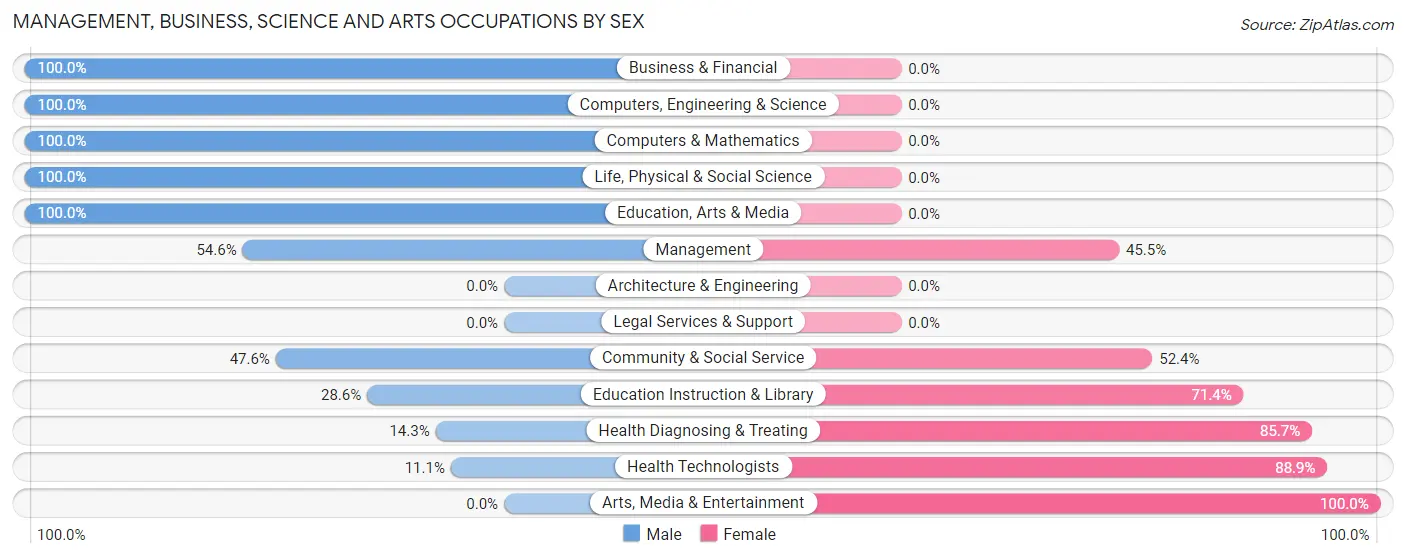
Management, Business, Science and Arts Occupations by Sex
Within the Management, Business, Science and Arts occupations in Betterton, the most male-oriented occupations are Business & Financial (100.0%), Computers, Engineering & Science (100.0%), and Computers & Mathematics (100.0%), while the most female-oriented occupations are Arts, Media & Entertainment (100.0%), Health Technologists (88.9%), and Health Diagnosing & Treating (85.7%).
| Occupation | Male | Female |
| Management | 6 (54.5%) | 5 (45.5%) |
| Business & Financial | 1 (100.0%) | 0 (0.0%) |
| Computers, Engineering & Science | 7 (100.0%) | 0 (0.0%) |
| Computers & Mathematics | 4 (100.0%) | 0 (0.0%) |
| Architecture & Engineering | 0 (0.0%) | 0 (0.0%) |
| Life, Physical & Social Science | 3 (100.0%) | 0 (0.0%) |
| Community & Social Service | 10 (47.6%) | 11 (52.4%) |
| Education, Arts & Media | 6 (100.0%) | 0 (0.0%) |
| Legal Services & Support | 0 (0.0%) | 0 (0.0%) |
| Education Instruction & Library | 4 (28.6%) | 10 (71.4%) |
| Arts, Media & Entertainment | 0 (0.0%) | 1 (100.0%) |
| Health Diagnosing & Treating | 2 (14.3%) | 12 (85.7%) |
| Health Technologists | 1 (11.1%) | 8 (88.9%) |
| Total (Category) | 26 (48.1%) | 28 (51.8%) |
| Total (Overall) | 72 (60.0%) | 48 (40.0%) |
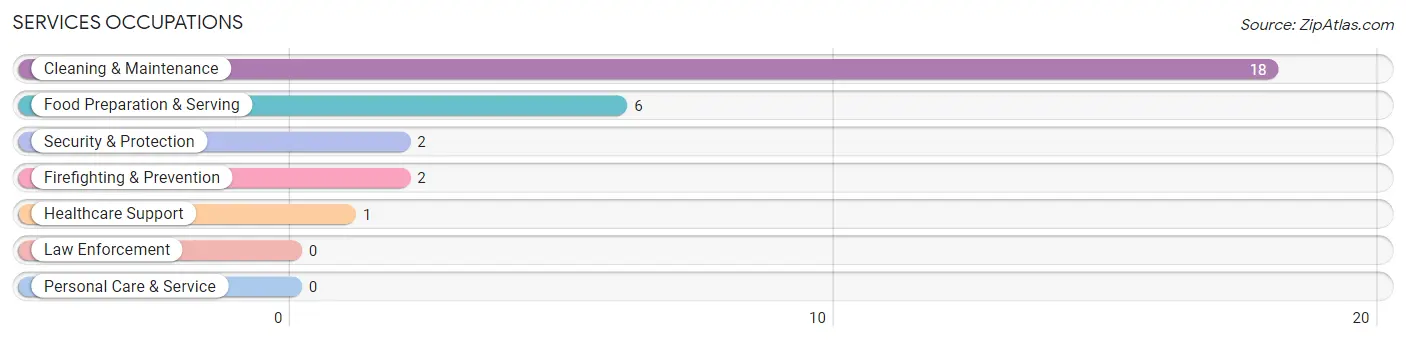
Services Occupations
The most common Services occupations in Betterton are Cleaning & Maintenance (18 | 15.0%), Food Preparation & Serving (6 | 5.0%), Security & Protection (2 | 1.7%), Firefighting & Prevention (2 | 1.7%), and Healthcare Support (1 | 0.8%).
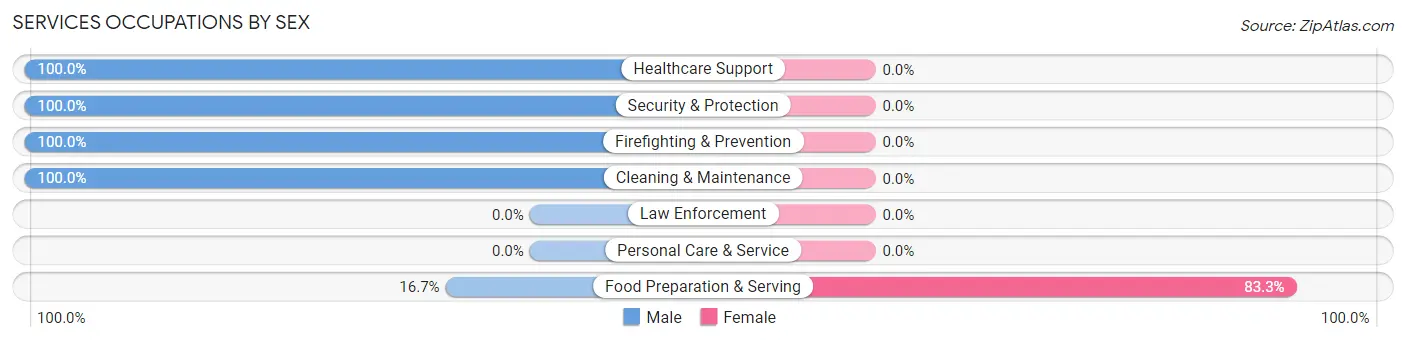
Services Occupations by Sex
| Occupation | Male | Female |
| Healthcare Support | 1 (100.0%) | 0 (0.0%) |
| Security & Protection | 2 (100.0%) | 0 (0.0%) |
| Firefighting & Prevention | 2 (100.0%) | 0 (0.0%) |
| Law Enforcement | 0 (0.0%) | 0 (0.0%) |
| Food Preparation & Serving | 1 (16.7%) | 5 (83.3%) |
| Cleaning & Maintenance | 18 (100.0%) | 0 (0.0%) |
| Personal Care & Service | 0 (0.0%) | 0 (0.0%) |
| Total (Category) | 22 (81.5%) | 5 (18.5%) |
| Total (Overall) | 72 (60.0%) | 48 (40.0%) |
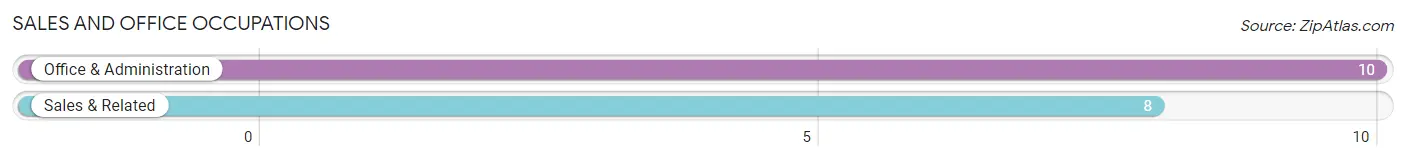
Sales and Office Occupations
The most common Sales and Office occupations in Betterton are Office & Administration (10 | 8.3%), and Sales & Related (8 | 6.7%).
Sales and Office Occupations by Sex
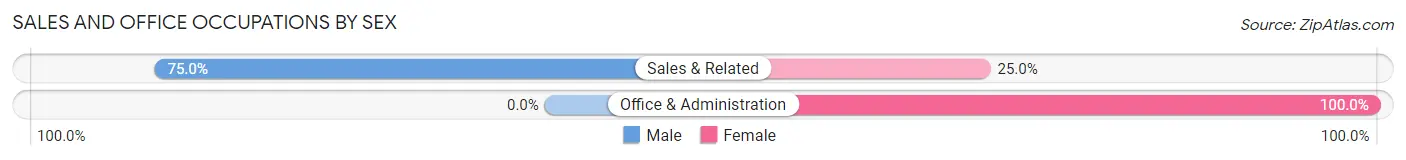
| Occupation | Male | Female |
| Sales & Related | 6 (75.0%) | 2 (25.0%) |
| Office & Administration | 0 (0.0%) | 10 (100.0%) |
| Total (Category) | 6 (33.3%) | 12 (66.7%) |
| Total (Overall) | 72 (60.0%) | 48 (40.0%) |
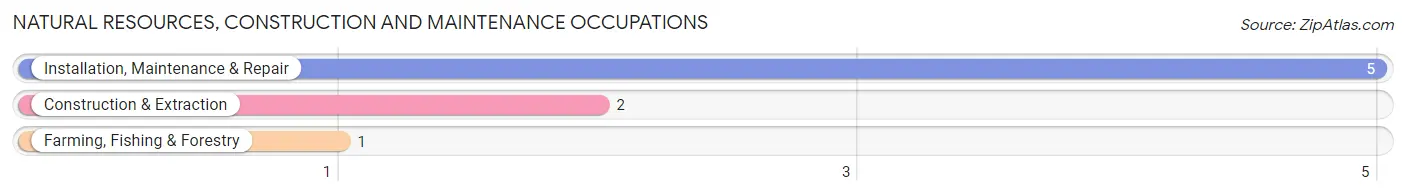
Natural Resources, Construction and Maintenance Occupations
The most common Natural Resources, Construction and Maintenance occupations in Betterton are Installation, Maintenance & Repair (5 | 4.2%), Construction & Extraction (2 | 1.7%), and Farming, Fishing & Forestry (1 | 0.8%).
Natural Resources, Construction and Maintenance Occupations by Sex
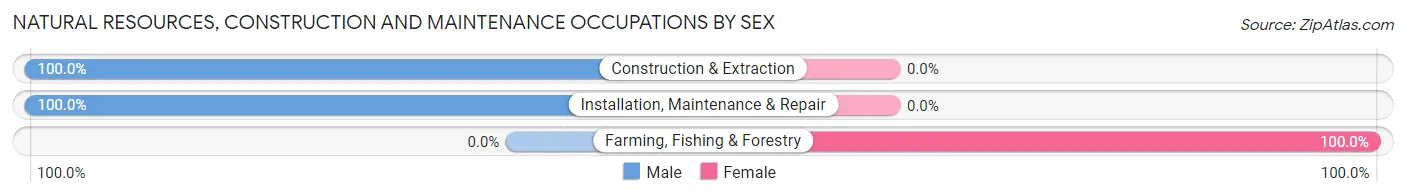
| Occupation | Male | Female |
| Farming, Fishing & Forestry | 0 (0.0%) | 1 (100.0%) |
| Construction & Extraction | 2 (100.0%) | 0 (0.0%) |
| Installation, Maintenance & Repair | 5 (100.0%) | 0 (0.0%) |
| Total (Category) | 7 (87.5%) | 1 (12.5%) |
| Total (Overall) | 72 (60.0%) | 48 (40.0%) |
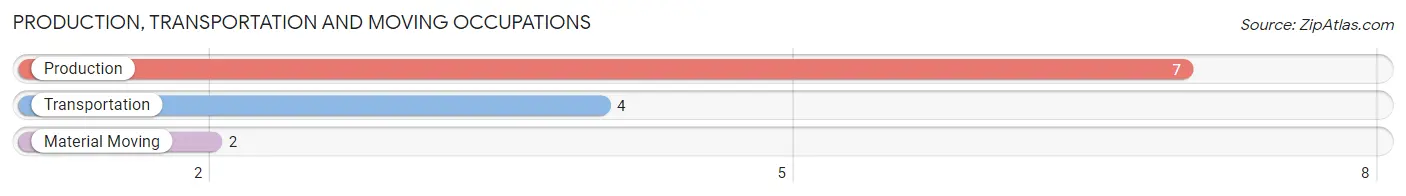
Production, Transportation and Moving Occupations
The most common Production, Transportation and Moving occupations in Betterton are Production (7 | 5.8%), Transportation (4 | 3.3%), and Material Moving (2 | 1.7%).
Production, Transportation and Moving Occupations by Sex
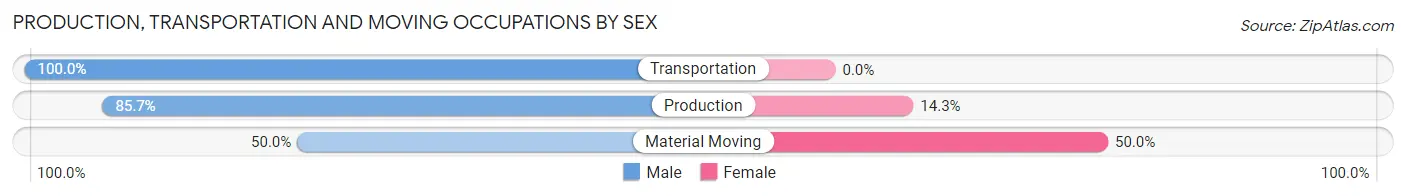
| Occupation | Male | Female |
| Production | 6 (85.7%) | 1 (14.3%) |
| Transportation | 4 (100.0%) | 0 (0.0%) |
| Material Moving | 1 (50.0%) | 1 (50.0%) |
| Total (Category) | 11 (84.6%) | 2 (15.4%) |
| Total (Overall) | 72 (60.0%) | 48 (40.0%) |
Employment Industries by Sex in Betterton
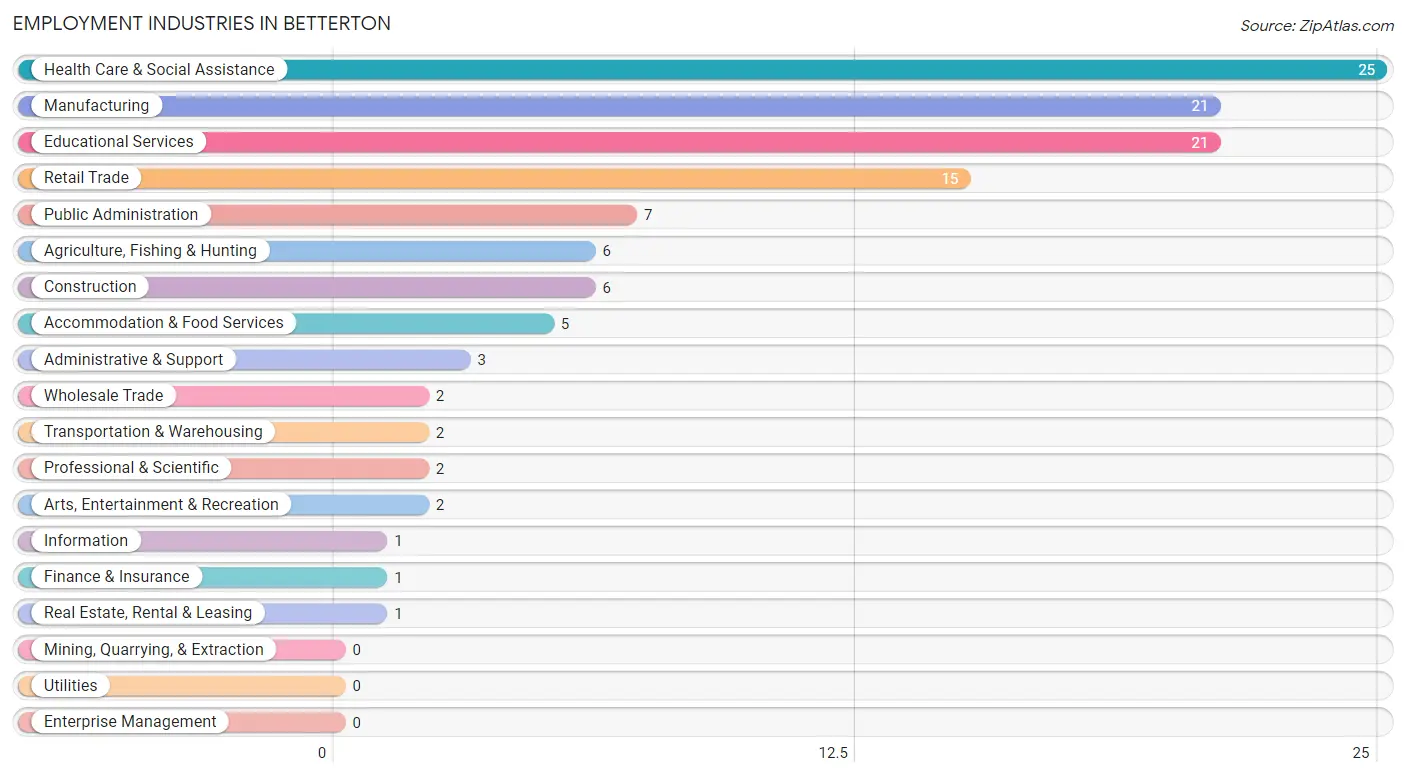
Employment Industries in Betterton
The major employment industries in Betterton include Health Care & Social Assistance (25 | 20.8%), Manufacturing (21 | 17.5%), Educational Services (21 | 17.5%), Retail Trade (15 | 12.5%), and Public Administration (7 | 5.8%).
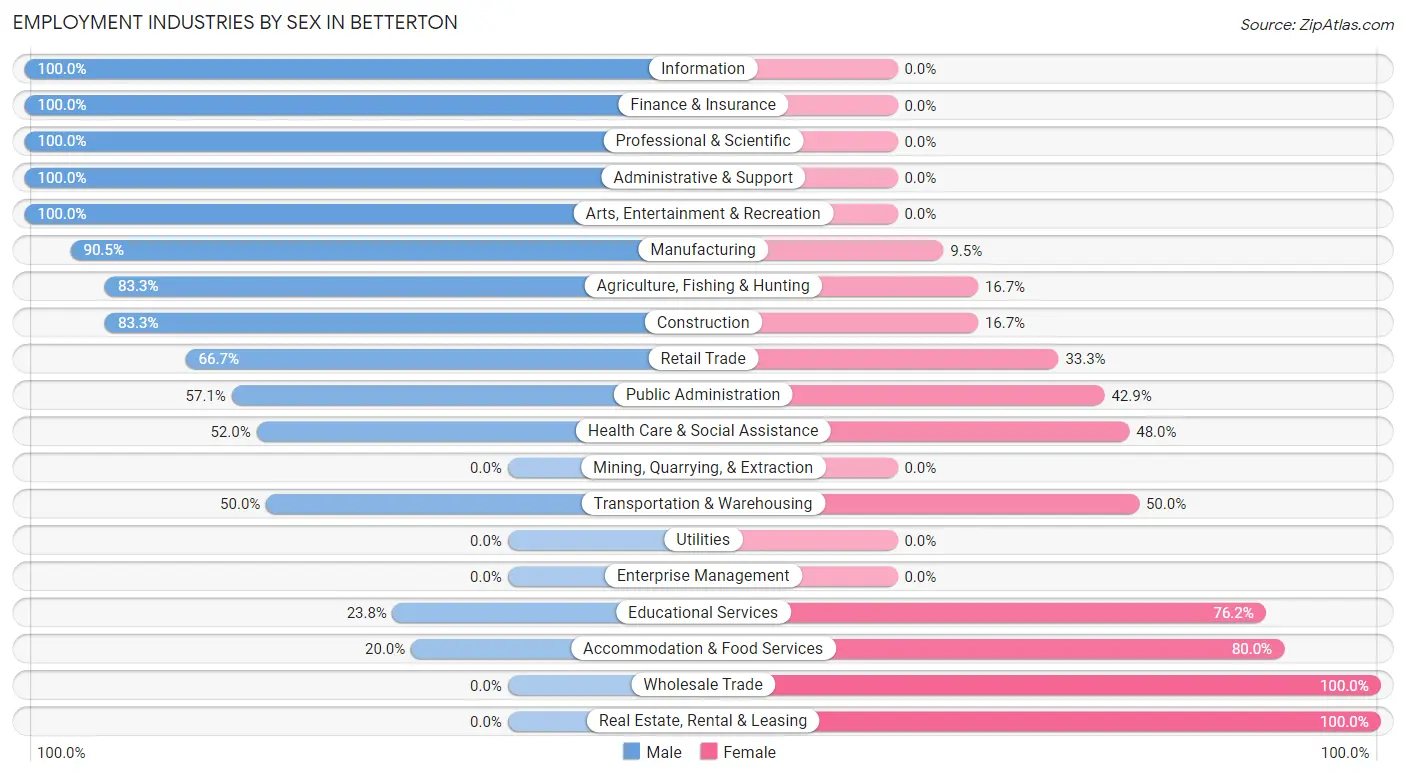
Employment Industries by Sex in Betterton
The Betterton industries that see more men than women are Information (100.0%), Finance & Insurance (100.0%), and Professional & Scientific (100.0%), whereas the industries that tend to have a higher number of women are Wholesale Trade (100.0%), Real Estate, Rental & Leasing (100.0%), and Accommodation & Food Services (80.0%).
| Industry | Male | Female |
| Agriculture, Fishing & Hunting | 5 (83.3%) | 1 (16.7%) |
| Mining, Quarrying, & Extraction | 0 (0.0%) | 0 (0.0%) |
| Construction | 5 (83.3%) | 1 (16.7%) |
| Manufacturing | 19 (90.5%) | 2 (9.5%) |
| Wholesale Trade | 0 (0.0%) | 2 (100.0%) |
| Retail Trade | 10 (66.7%) | 5 (33.3%) |
| Transportation & Warehousing | 1 (50.0%) | 1 (50.0%) |
| Utilities | 0 (0.0%) | 0 (0.0%) |
| Information | 1 (100.0%) | 0 (0.0%) |
| Finance & Insurance | 1 (100.0%) | 0 (0.0%) |
| Real Estate, Rental & Leasing | 0 (0.0%) | 1 (100.0%) |
| Professional & Scientific | 2 (100.0%) | 0 (0.0%) |
| Enterprise Management | 0 (0.0%) | 0 (0.0%) |
| Administrative & Support | 3 (100.0%) | 0 (0.0%) |
| Educational Services | 5 (23.8%) | 16 (76.2%) |
| Health Care & Social Assistance | 13 (52.0%) | 12 (48.0%) |
| Arts, Entertainment & Recreation | 2 (100.0%) | 0 (0.0%) |
| Accommodation & Food Services | 1 (20.0%) | 4 (80.0%) |
| Public Administration | 4 (57.1%) | 3 (42.9%) |
| Total | 72 (60.0%) | 48 (40.0%) |
Education in Betterton
School Enrollment in Betterton
The most common levels of schooling among the 58 students in Betterton are college / undergraduate (16 | 27.6%), high school (12 | 20.7%), and kindergarten (11 | 19.0%).
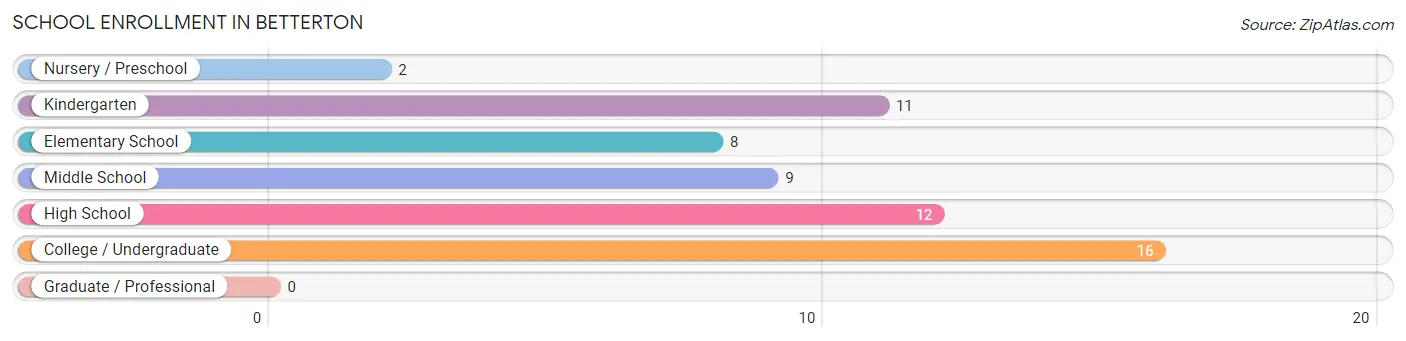
| School Level | # Students | % Students |
| Nursery / Preschool | 2 | 3.5% |
| Kindergarten | 11 | 19.0% |
| Elementary School | 8 | 13.8% |
| Middle School | 9 | 15.5% |
| High School | 12 | 20.7% |
| College / Undergraduate | 16 | 27.6% |
| Graduate / Professional | 0 | 0.0% |
| Total | 58 | 100.0% |
School Enrollment by Age by Funding Source in Betterton
Out of a total of 58 students who are enrolled in schools in Betterton, 19 (32.8%) attend a private institution, while the remaining 39 (67.2%) are enrolled in public schools. The age group of 20 to 24 year olds has the highest likelihood of being enrolled in private schools, with 14 (87.5% in the age bracket) enrolled. Conversely, the age group of 3 to 4 year olds has the lowest likelihood of being enrolled in a private school, with 2 (100.0% in the age bracket) attending a public institution.
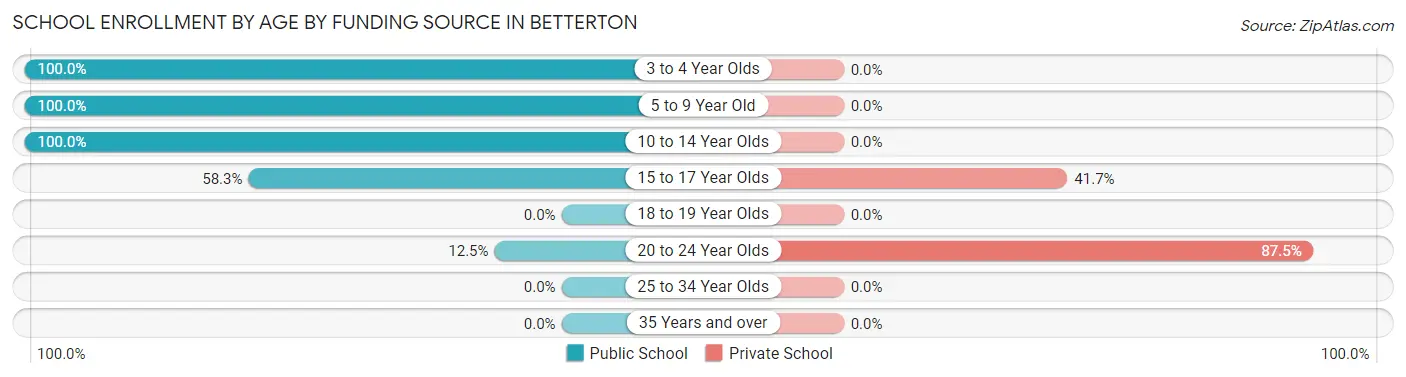
| Age Bracket | Public School | Private School |
| 3 to 4 Year Olds | 2 (100.0%) | 0 (0.0%) |
| 5 to 9 Year Old | 19 (100.0%) | 0 (0.0%) |
| 10 to 14 Year Olds | 9 (100.0%) | 0 (0.0%) |
| 15 to 17 Year Olds | 7 (58.3%) | 5 (41.7%) |
| 18 to 19 Year Olds | 0 (0.0%) | 0 (0.0%) |
| 20 to 24 Year Olds | 2 (12.5%) | 14 (87.5%) |
| 25 to 34 Year Olds | 0 (0.0%) | 0 (0.0%) |
| 35 Years and over | 0 (0.0%) | 0 (0.0%) |
| Total | 39 (67.2%) | 19 (32.8%) |
Educational Attainment by Field of Study in Betterton
Business (18 | 17.0%), bio, nature & agricultural (14 | 13.2%), engineering (12 | 11.3%), liberal arts & history (12 | 11.3%), and science & technology (11 | 10.4%) are the most common fields of study among 106 individuals in Betterton who have obtained a bachelor's degree or higher.
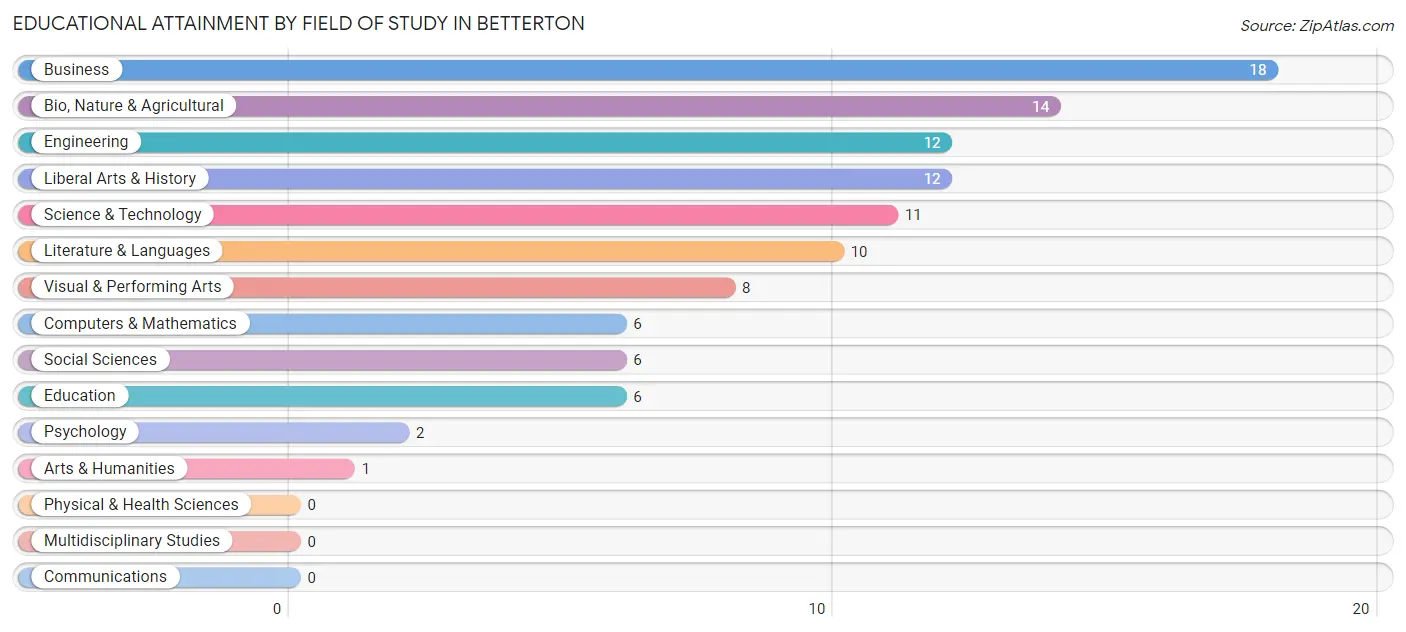
| Field of Study | # Graduates | % Graduates |
| Computers & Mathematics | 6 | 5.7% |
| Bio, Nature & Agricultural | 14 | 13.2% |
| Physical & Health Sciences | 0 | 0.0% |
| Psychology | 2 | 1.9% |
| Social Sciences | 6 | 5.7% |
| Engineering | 12 | 11.3% |
| Multidisciplinary Studies | 0 | 0.0% |
| Science & Technology | 11 | 10.4% |
| Business | 18 | 17.0% |
| Education | 6 | 5.7% |
| Literature & Languages | 10 | 9.4% |
| Liberal Arts & History | 12 | 11.3% |
| Visual & Performing Arts | 8 | 7.5% |
| Communications | 0 | 0.0% |
| Arts & Humanities | 1 | 0.9% |
| Total | 106 | 100.0% |
Transportation & Commute in Betterton
Vehicle Availability by Sex in Betterton
The most prevalent vehicle ownership categories in Betterton are males with 3 vehicles (27, accounting for 37.5%) and females with 3 vehicles (9, making up 57.5%).
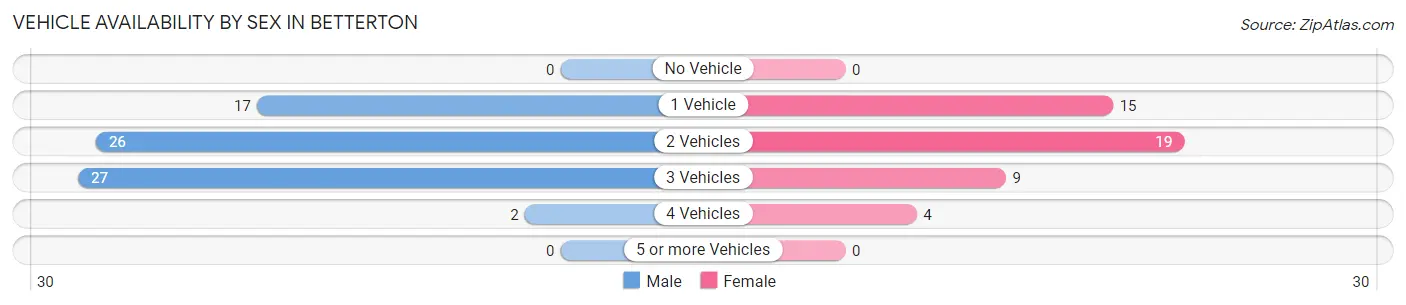
| Vehicles Available | Male | Female |
| No Vehicle | 0 (0.0%) | 0 (0.0%) |
| 1 Vehicle | 17 (23.6%) | 15 (31.9%) |
| 2 Vehicles | 26 (36.1%) | 19 (40.4%) |
| 3 Vehicles | 27 (37.5%) | 9 (19.2%) |
| 4 Vehicles | 2 (2.8%) | 4 (8.5%) |
| 5 or more Vehicles | 0 (0.0%) | 0 (0.0%) |
| Total | 72 (100.0%) | 47 (100.0%) |
Commute Time in Betterton
The most frequently occuring commute durations in Betterton are 20 to 24 minutes (32 commuters, 29.4%), 45 to 59 minutes (19 commuters, 17.4%), and 15 to 19 minutes (16 commuters, 14.7%).
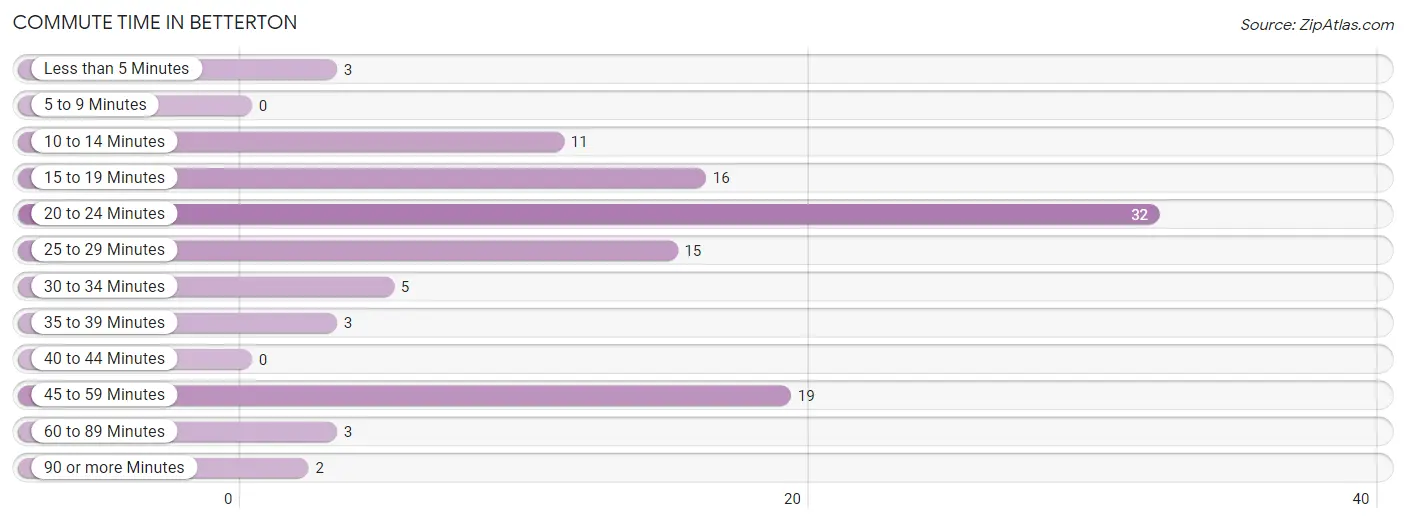
| Commute Time | # Commuters | % Commuters |
| Less than 5 Minutes | 3 | 2.8% |
| 5 to 9 Minutes | 0 | 0.0% |
| 10 to 14 Minutes | 11 | 10.1% |
| 15 to 19 Minutes | 16 | 14.7% |
| 20 to 24 Minutes | 32 | 29.4% |
| 25 to 29 Minutes | 15 | 13.8% |
| 30 to 34 Minutes | 5 | 4.6% |
| 35 to 39 Minutes | 3 | 2.8% |
| 40 to 44 Minutes | 0 | 0.0% |
| 45 to 59 Minutes | 19 | 17.4% |
| 60 to 89 Minutes | 3 | 2.8% |
| 90 or more Minutes | 2 | 1.8% |
Commute Time by Sex in Betterton
The most common commute times in Betterton are 20 to 24 minutes (17 commuters, 24.3%) for males and 20 to 24 minutes (15 commuters, 38.5%) for females.
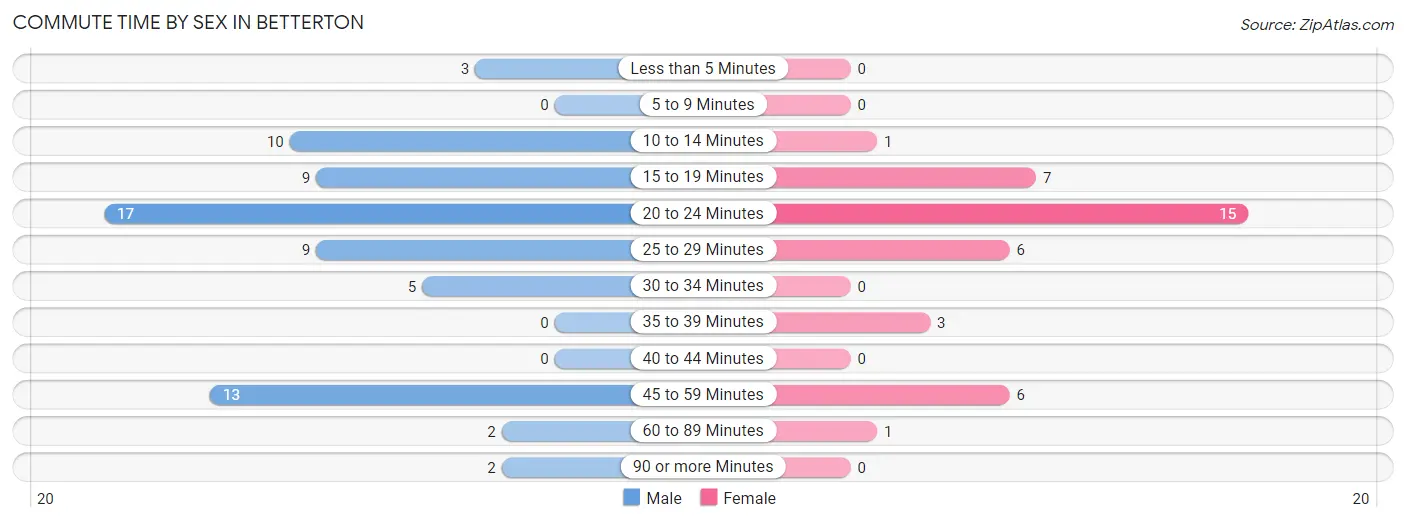
| Commute Time | Male | Female |
| Less than 5 Minutes | 3 (4.3%) | 0 (0.0%) |
| 5 to 9 Minutes | 0 (0.0%) | 0 (0.0%) |
| 10 to 14 Minutes | 10 (14.3%) | 1 (2.6%) |
| 15 to 19 Minutes | 9 (12.9%) | 7 (17.9%) |
| 20 to 24 Minutes | 17 (24.3%) | 15 (38.5%) |
| 25 to 29 Minutes | 9 (12.9%) | 6 (15.4%) |
| 30 to 34 Minutes | 5 (7.1%) | 0 (0.0%) |
| 35 to 39 Minutes | 0 (0.0%) | 3 (7.7%) |
| 40 to 44 Minutes | 0 (0.0%) | 0 (0.0%) |
| 45 to 59 Minutes | 13 (18.6%) | 6 (15.4%) |
| 60 to 89 Minutes | 2 (2.9%) | 1 (2.6%) |
| 90 or more Minutes | 2 (2.9%) | 0 (0.0%) |
Time of Departure to Work by Sex in Betterton
The most frequent times of departure to work in Betterton are 8:00 AM to 8:29 AM (19, 27.1%) for males and 7:00 AM to 7:29 AM (11, 28.2%) for females.
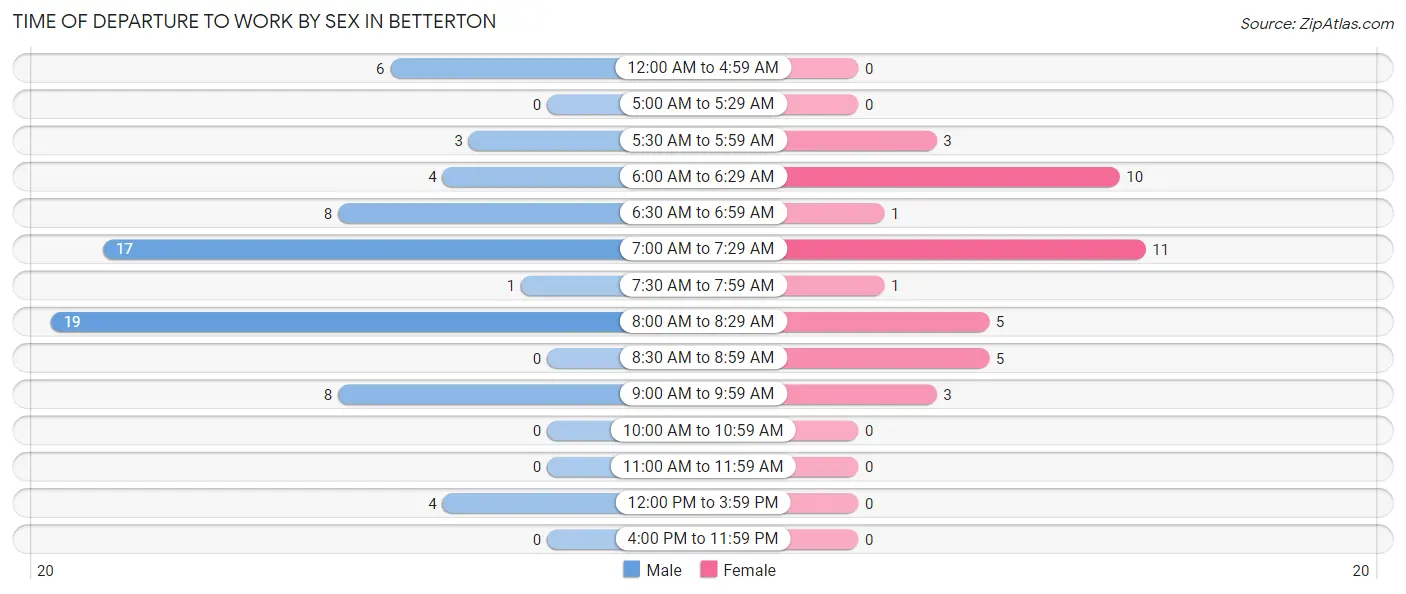
| Time of Departure | Male | Female |
| 12:00 AM to 4:59 AM | 6 (8.6%) | 0 (0.0%) |
| 5:00 AM to 5:29 AM | 0 (0.0%) | 0 (0.0%) |
| 5:30 AM to 5:59 AM | 3 (4.3%) | 3 (7.7%) |
| 6:00 AM to 6:29 AM | 4 (5.7%) | 10 (25.6%) |
| 6:30 AM to 6:59 AM | 8 (11.4%) | 1 (2.6%) |
| 7:00 AM to 7:29 AM | 17 (24.3%) | 11 (28.2%) |
| 7:30 AM to 7:59 AM | 1 (1.4%) | 1 (2.6%) |
| 8:00 AM to 8:29 AM | 19 (27.1%) | 5 (12.8%) |
| 8:30 AM to 8:59 AM | 0 (0.0%) | 5 (12.8%) |
| 9:00 AM to 9:59 AM | 8 (11.4%) | 3 (7.7%) |
| 10:00 AM to 10:59 AM | 0 (0.0%) | 0 (0.0%) |
| 11:00 AM to 11:59 AM | 0 (0.0%) | 0 (0.0%) |
| 12:00 PM to 3:59 PM | 4 (5.7%) | 0 (0.0%) |
| 4:00 PM to 11:59 PM | 0 (0.0%) | 0 (0.0%) |
| Total | 70 (100.0%) | 39 (100.0%) |
Housing Occupancy in Betterton
Occupancy by Ownership in Betterton
Of the total 157 dwellings in Betterton, owner-occupied units account for 99 (63.1%), while renter-occupied units make up 58 (36.9%).
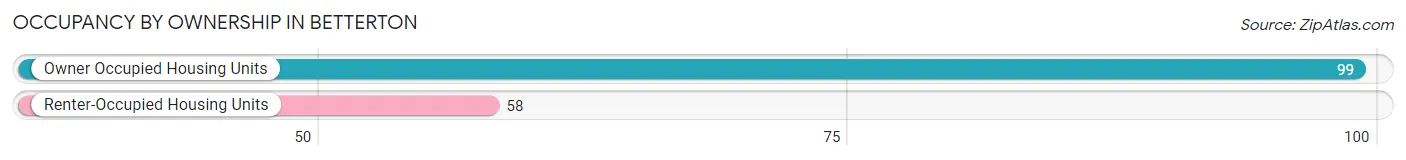
| Occupancy | # Housing Units | % Housing Units |
| Owner Occupied Housing Units | 99 | 63.1% |
| Renter-Occupied Housing Units | 58 | 36.9% |
| Total Occupied Housing Units | 157 | 100.0% |
Occupancy by Household Size in Betterton
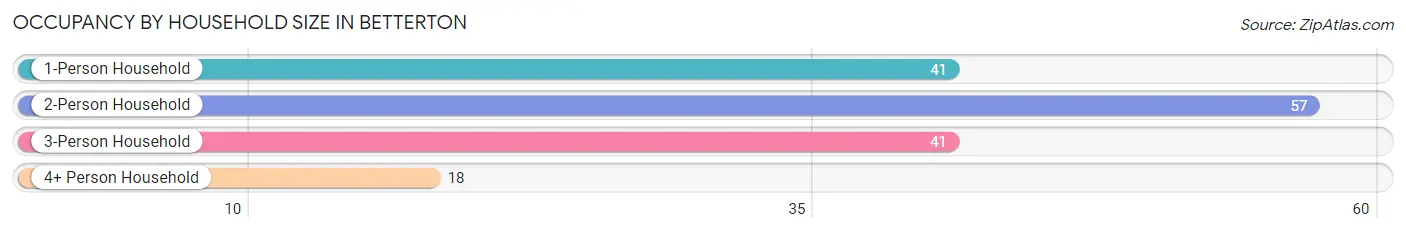
| Household Size | # Housing Units | % Housing Units |
| 1-Person Household | 41 | 26.1% |
| 2-Person Household | 57 | 36.3% |
| 3-Person Household | 41 | 26.1% |
| 4+ Person Household | 18 | 11.5% |
| Total Housing Units | 157 | 100.0% |
Occupancy by Ownership by Household Size in Betterton
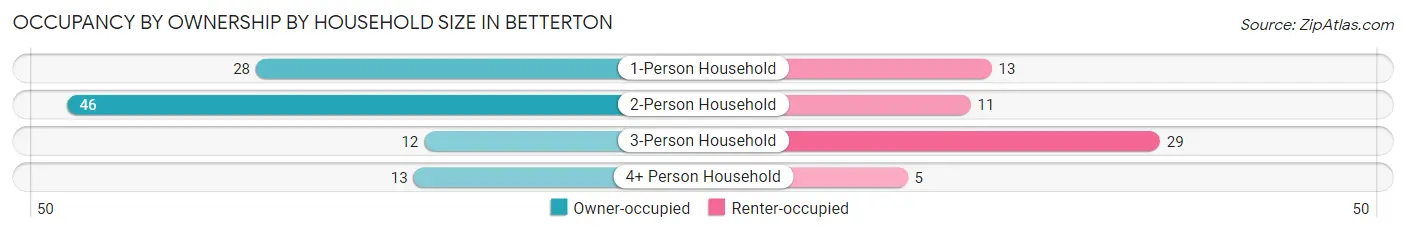
| Household Size | Owner-occupied | Renter-occupied |
| 1-Person Household | 28 (68.3%) | 13 (31.7%) |
| 2-Person Household | 46 (80.7%) | 11 (19.3%) |
| 3-Person Household | 12 (29.3%) | 29 (70.7%) |
| 4+ Person Household | 13 (72.2%) | 5 (27.8%) |
| Total Housing Units | 99 (63.1%) | 58 (36.9%) |
Occupancy by Educational Attainment in Betterton
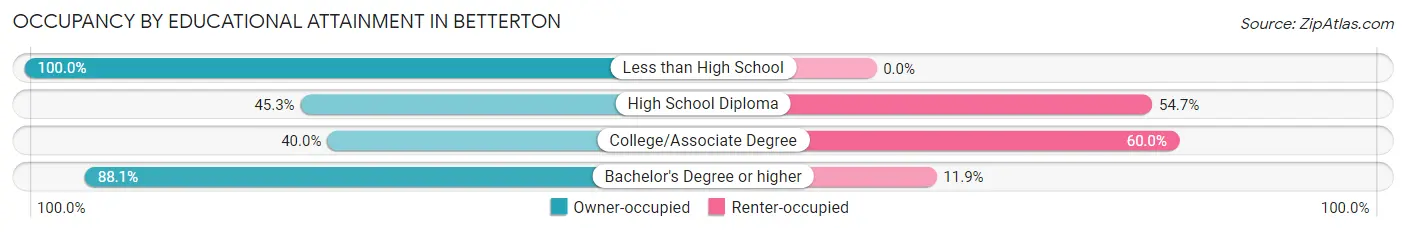
| Household Size | Owner-occupied | Renter-occupied |
| Less than High School | 1 (100.0%) | 0 (0.0%) |
| High School Diploma | 29 (45.3%) | 35 (54.7%) |
| College/Associate Degree | 10 (40.0%) | 15 (60.0%) |
| Bachelor's Degree or higher | 59 (88.1%) | 8 (11.9%) |
Occupancy by Age of Householder in Betterton
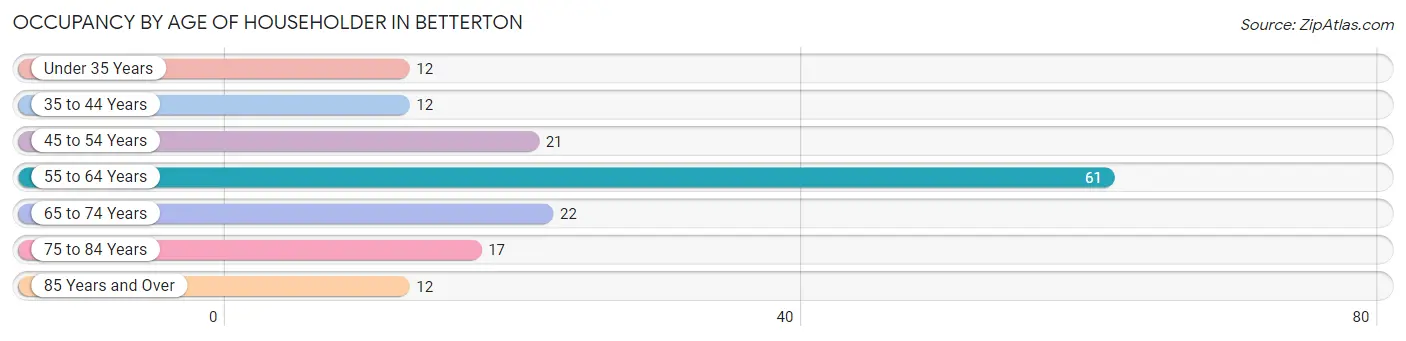
| Age Bracket | # Households | % Households |
| Under 35 Years | 12 | 7.6% |
| 35 to 44 Years | 12 | 7.6% |
| 45 to 54 Years | 21 | 13.4% |
| 55 to 64 Years | 61 | 38.9% |
| 65 to 74 Years | 22 | 14.0% |
| 75 to 84 Years | 17 | 10.8% |
| 85 Years and Over | 12 | 7.6% |
| Total | 157 | 100.0% |
Housing Finances in Betterton
Median Income by Occupancy in Betterton
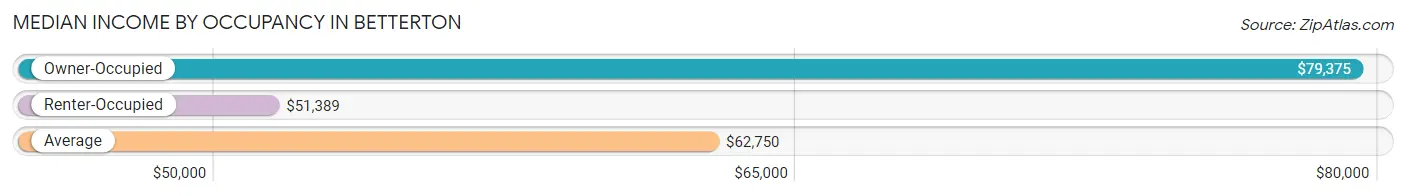
| Occupancy Type | # Households | Median Income |
| Owner-Occupied | 99 (63.1%) | $79,375 |
| Renter-Occupied | 58 (36.9%) | $51,389 |
| Average | 157 (100.0%) | $62,750 |
Occupancy by Householder Income Bracket in Betterton
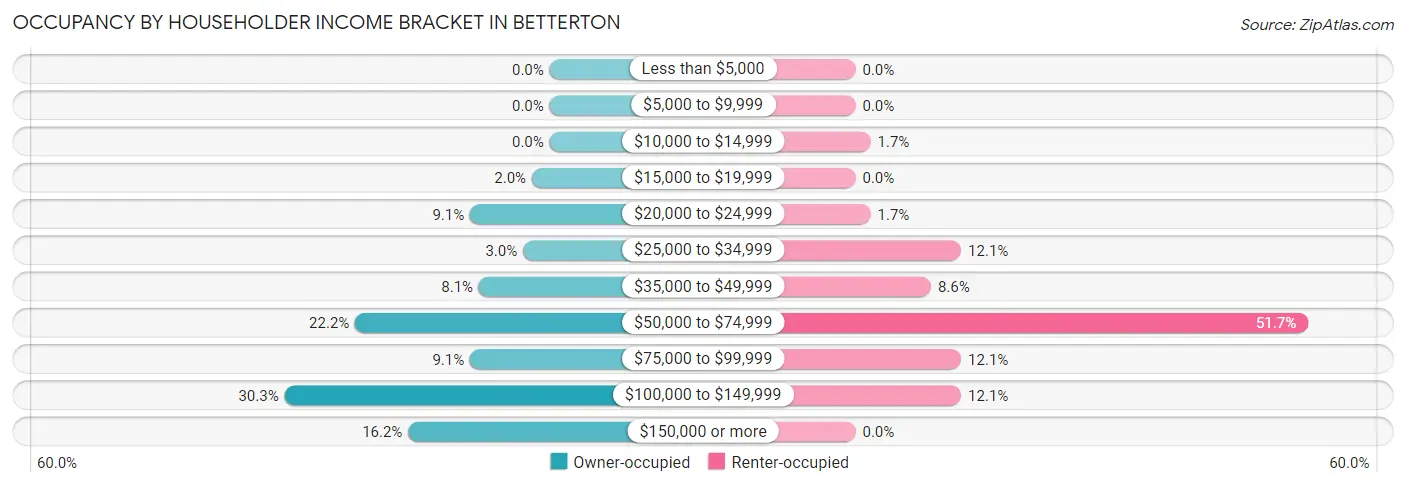
| Income Bracket | Owner-occupied | Renter-occupied |
| Less than $5,000 | 0 (0.0%) | 0 (0.0%) |
| $5,000 to $9,999 | 0 (0.0%) | 0 (0.0%) |
| $10,000 to $14,999 | 0 (0.0%) | 1 (1.7%) |
| $15,000 to $19,999 | 2 (2.0%) | 0 (0.0%) |
| $20,000 to $24,999 | 9 (9.1%) | 1 (1.7%) |
| $25,000 to $34,999 | 3 (3.0%) | 7 (12.1%) |
| $35,000 to $49,999 | 8 (8.1%) | 5 (8.6%) |
| $50,000 to $74,999 | 22 (22.2%) | 30 (51.7%) |
| $75,000 to $99,999 | 9 (9.1%) | 7 (12.1%) |
| $100,000 to $149,999 | 30 (30.3%) | 7 (12.1%) |
| $150,000 or more | 16 (16.2%) | 0 (0.0%) |
| Total | 99 (100.0%) | 58 (100.0%) |
Monthly Housing Cost Tiers in Betterton
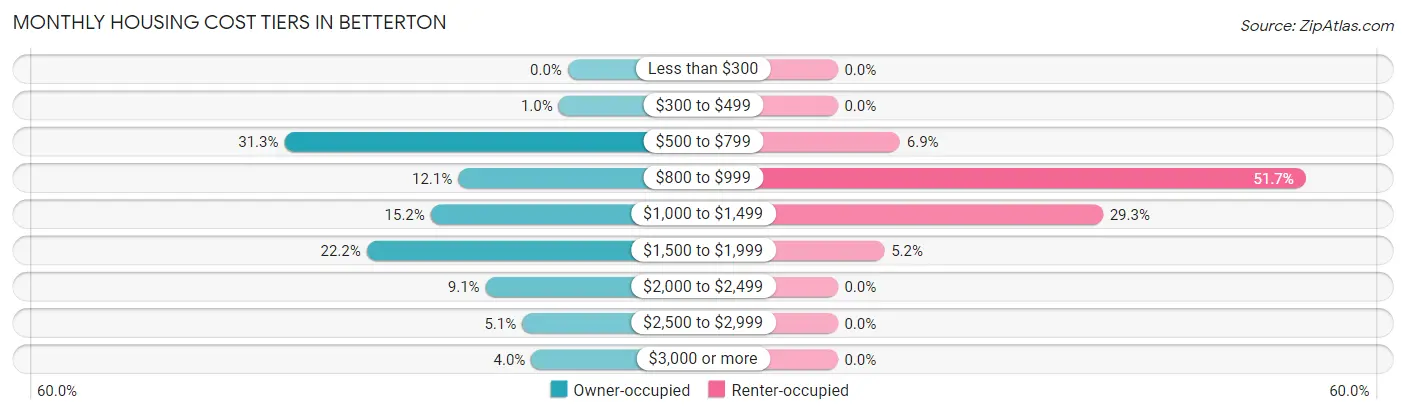
| Monthly Cost | Owner-occupied | Renter-occupied |
| Less than $300 | 0 (0.0%) | 0 (0.0%) |
| $300 to $499 | 1 (1.0%) | 0 (0.0%) |
| $500 to $799 | 31 (31.3%) | 4 (6.9%) |
| $800 to $999 | 12 (12.1%) | 30 (51.7%) |
| $1,000 to $1,499 | 15 (15.1%) | 17 (29.3%) |
| $1,500 to $1,999 | 22 (22.2%) | 3 (5.2%) |
| $2,000 to $2,499 | 9 (9.1%) | 0 (0.0%) |
| $2,500 to $2,999 | 5 (5.1%) | 0 (0.0%) |
| $3,000 or more | 4 (4.0%) | 0 (0.0%) |
| Total | 99 (100.0%) | 58 (100.0%) |
Physical Housing Characteristics in Betterton
Housing Structures in Betterton
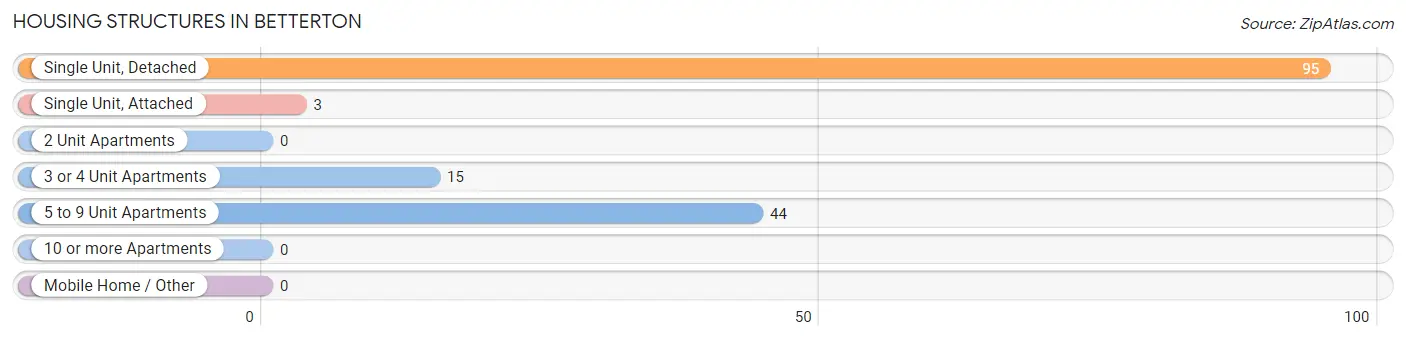
| Structure Type | # Housing Units | % Housing Units |
| Single Unit, Detached | 95 | 60.5% |
| Single Unit, Attached | 3 | 1.9% |
| 2 Unit Apartments | 0 | 0.0% |
| 3 or 4 Unit Apartments | 15 | 9.6% |
| 5 to 9 Unit Apartments | 44 | 28.0% |
| 10 or more Apartments | 0 | 0.0% |
| Mobile Home / Other | 0 | 0.0% |
| Total | 157 | 100.0% |
Housing Structures by Occupancy in Betterton
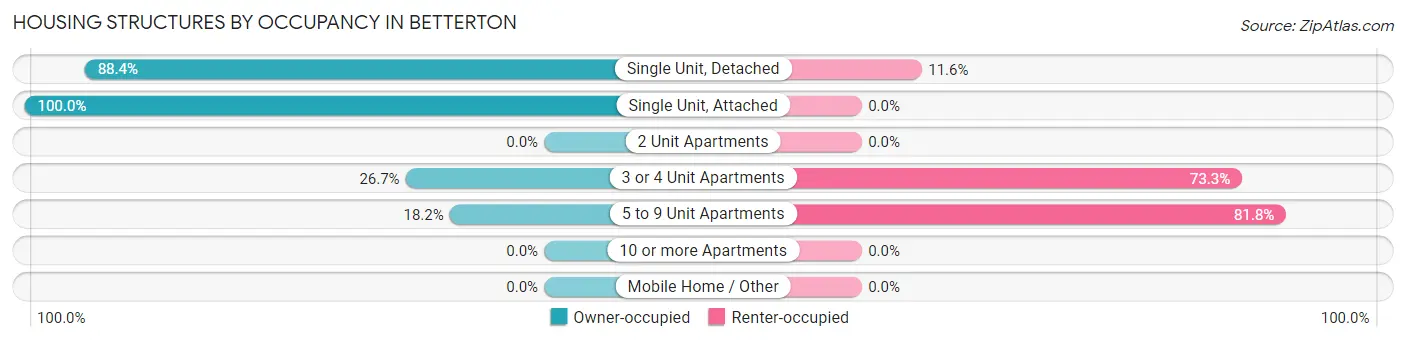
| Structure Type | Owner-occupied | Renter-occupied |
| Single Unit, Detached | 84 (88.4%) | 11 (11.6%) |
| Single Unit, Attached | 3 (100.0%) | 0 (0.0%) |
| 2 Unit Apartments | 0 (0.0%) | 0 (0.0%) |
| 3 or 4 Unit Apartments | 4 (26.7%) | 11 (73.3%) |
| 5 to 9 Unit Apartments | 8 (18.2%) | 36 (81.8%) |
| 10 or more Apartments | 0 (0.0%) | 0 (0.0%) |
| Mobile Home / Other | 0 (0.0%) | 0 (0.0%) |
| Total | 99 (63.1%) | 58 (36.9%) |
Housing Structures by Number of Rooms in Betterton
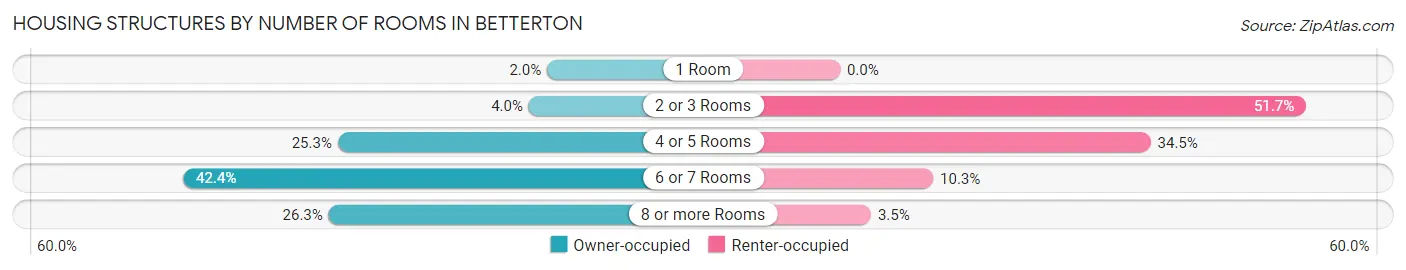
| Number of Rooms | Owner-occupied | Renter-occupied |
| 1 Room | 2 (2.0%) | 0 (0.0%) |
| 2 or 3 Rooms | 4 (4.0%) | 30 (51.7%) |
| 4 or 5 Rooms | 25 (25.3%) | 20 (34.5%) |
| 6 or 7 Rooms | 42 (42.4%) | 6 (10.3%) |
| 8 or more Rooms | 26 (26.3%) | 2 (3.5%) |
| Total | 99 (100.0%) | 58 (100.0%) |
Housing Structure by Heating Type in Betterton
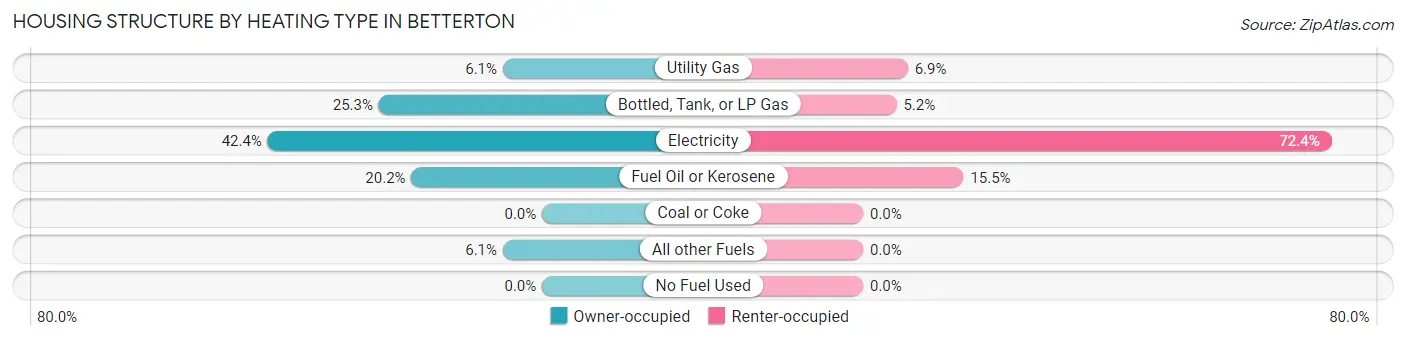
| Heating Type | Owner-occupied | Renter-occupied |
| Utility Gas | 6 (6.1%) | 4 (6.9%) |
| Bottled, Tank, or LP Gas | 25 (25.3%) | 3 (5.2%) |
| Electricity | 42 (42.4%) | 42 (72.4%) |
| Fuel Oil or Kerosene | 20 (20.2%) | 9 (15.5%) |
| Coal or Coke | 0 (0.0%) | 0 (0.0%) |
| All other Fuels | 6 (6.1%) | 0 (0.0%) |
| No Fuel Used | 0 (0.0%) | 0 (0.0%) |
| Total | 99 (100.0%) | 58 (100.0%) |
Household Vehicle Usage in Betterton
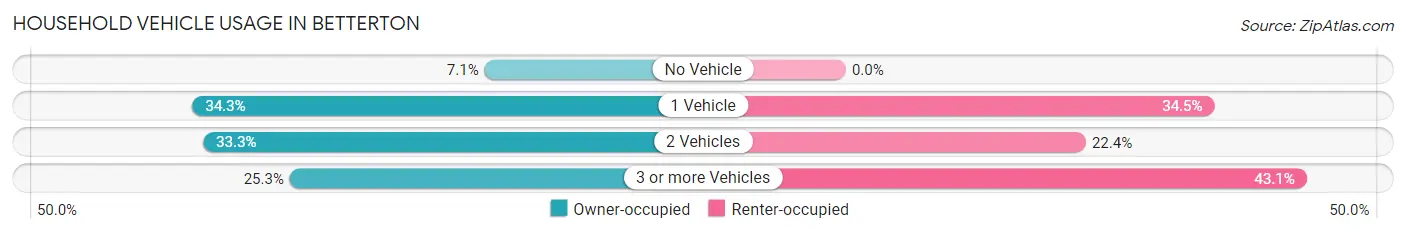
| Vehicles per Household | Owner-occupied | Renter-occupied |
| No Vehicle | 7 (7.1%) | 0 (0.0%) |
| 1 Vehicle | 34 (34.3%) | 20 (34.5%) |
| 2 Vehicles | 33 (33.3%) | 13 (22.4%) |
| 3 or more Vehicles | 25 (25.3%) | 25 (43.1%) |
| Total | 99 (100.0%) | 58 (100.0%) |
Real Estate & Mortgages in Betterton
Real Estate and Mortgage Overview in Betterton
| Characteristic | Without Mortgage | With Mortgage |
| Housing Units | 45 | 54 |
| Median Property Value | $266,100 | $210,700 |
| Median Household Income | $71,563 | $7 |
| Monthly Housing Costs | $666 | $4 |
| Real Estate Taxes | $2,712 | $1 |
Property Value by Mortgage Status in Betterton
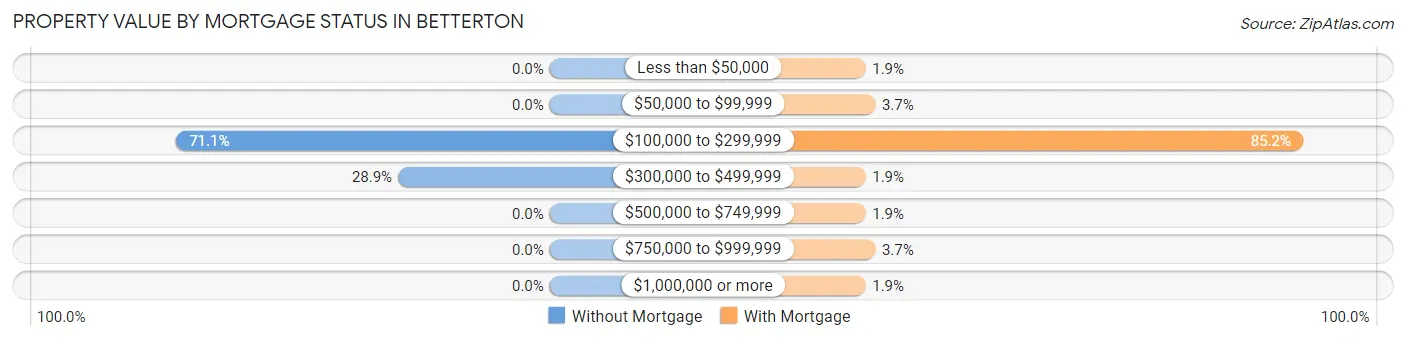
| Property Value | Without Mortgage | With Mortgage |
| Less than $50,000 | 0 (0.0%) | 1 (1.8%) |
| $50,000 to $99,999 | 0 (0.0%) | 2 (3.7%) |
| $100,000 to $299,999 | 32 (71.1%) | 46 (85.2%) |
| $300,000 to $499,999 | 13 (28.9%) | 1 (1.8%) |
| $500,000 to $749,999 | 0 (0.0%) | 1 (1.8%) |
| $750,000 to $999,999 | 0 (0.0%) | 2 (3.7%) |
| $1,000,000 or more | 0 (0.0%) | 1 (1.8%) |
| Total | 45 (100.0%) | 54 (100.0%) |
Household Income by Mortgage Status in Betterton
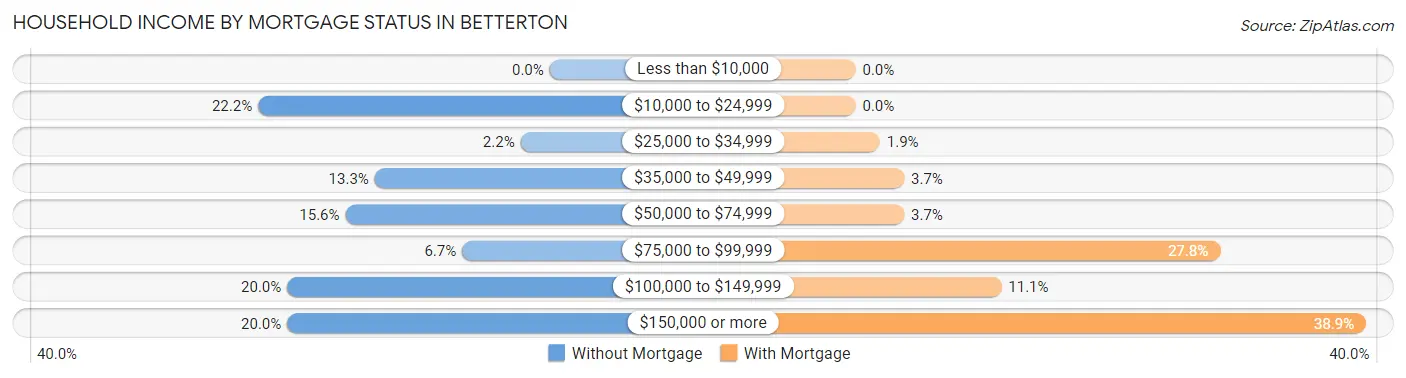
| Household Income | Without Mortgage | With Mortgage |
| Less than $10,000 | 0 (0.0%) | 0 (0.0%) |
| $10,000 to $24,999 | 10 (22.2%) | 0 (0.0%) |
| $25,000 to $34,999 | 1 (2.2%) | 1 (1.8%) |
| $35,000 to $49,999 | 6 (13.3%) | 2 (3.7%) |
| $50,000 to $74,999 | 7 (15.6%) | 2 (3.7%) |
| $75,000 to $99,999 | 3 (6.7%) | 15 (27.8%) |
| $100,000 to $149,999 | 9 (20.0%) | 6 (11.1%) |
| $150,000 or more | 9 (20.0%) | 21 (38.9%) |
| Total | 45 (100.0%) | 54 (100.0%) |
Property Value to Household Income Ratio in Betterton
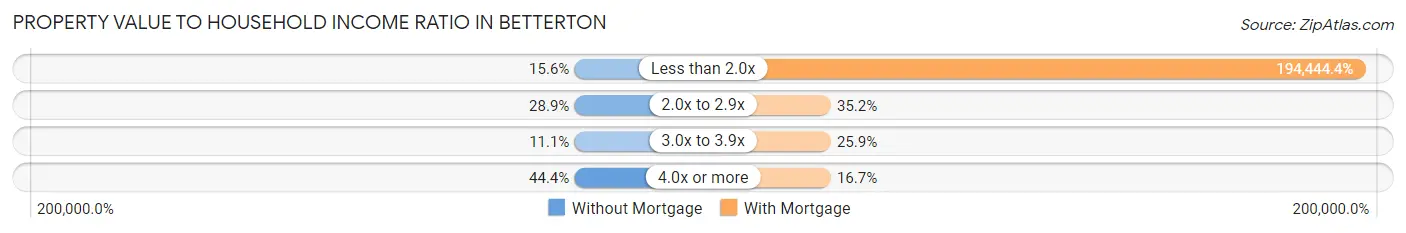
| Value-to-Income Ratio | Without Mortgage | With Mortgage |
| Less than 2.0x | 7 (15.6%) | 105,000 (194,444.4%) |
| 2.0x to 2.9x | 13 (28.9%) | 19 (35.2%) |
| 3.0x to 3.9x | 5 (11.1%) | 14 (25.9%) |
| 4.0x or more | 20 (44.4%) | 9 (16.7%) |
| Total | 45 (100.0%) | 54 (100.0%) |
Real Estate Taxes by Mortgage Status in Betterton
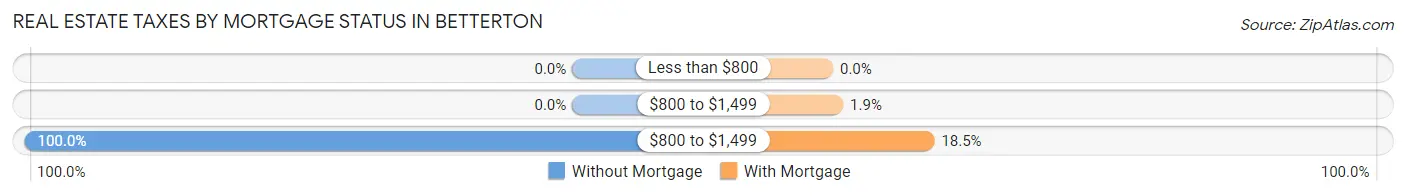
| Property Taxes | Without Mortgage | With Mortgage |
| Less than $800 | 0 (0.0%) | 0 (0.0%) |
| $800 to $1,499 | 0 (0.0%) | 1 (1.8%) |
| $800 to $1,499 | 45 (100.0%) | 10 (18.5%) |
| Total | 45 (100.0%) | 54 (100.0%) |
Health & Disability in Betterton
Health Insurance Coverage by Age in Betterton
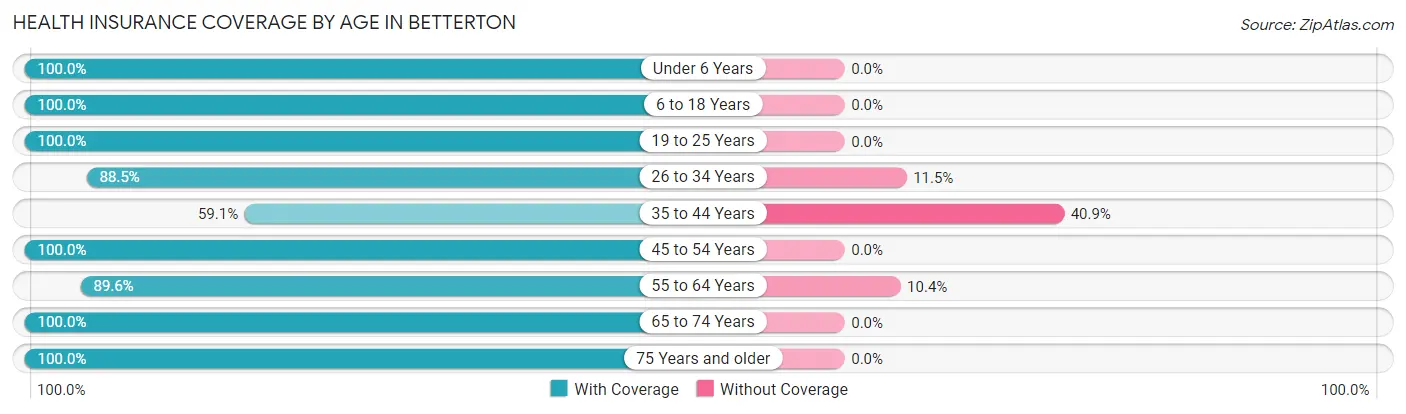
| Age Bracket | With Coverage | Without Coverage |
| Under 6 Years | 31 (100.0%) | 0 (0.0%) |
| 6 to 18 Years | 31 (100.0%) | 0 (0.0%) |
| 19 to 25 Years | 21 (100.0%) | 0 (0.0%) |
| 26 to 34 Years | 23 (88.5%) | 3 (11.5%) |
| 35 to 44 Years | 26 (59.1%) | 18 (40.9%) |
| 45 to 54 Years | 34 (100.0%) | 0 (0.0%) |
| 55 to 64 Years | 86 (89.6%) | 10 (10.4%) |
| 65 to 74 Years | 30 (100.0%) | 0 (0.0%) |
| 75 Years and older | 50 (100.0%) | 0 (0.0%) |
| Total | 332 (91.5%) | 31 (8.5%) |
Health Insurance Coverage by Citizenship Status in Betterton
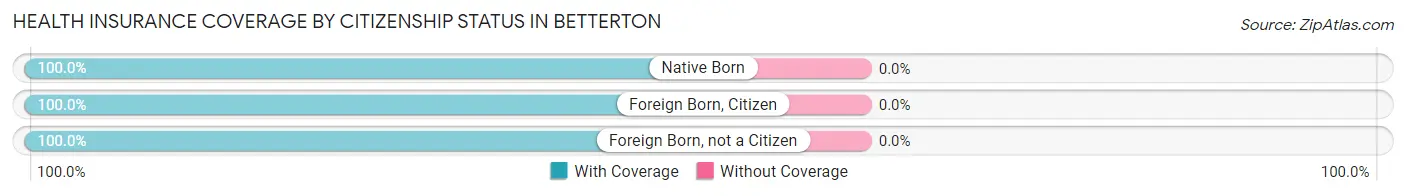
| Citizenship Status | With Coverage | Without Coverage |
| Native Born | 31 (100.0%) | 0 (0.0%) |
| Foreign Born, Citizen | 31 (100.0%) | 0 (0.0%) |
| Foreign Born, not a Citizen | 21 (100.0%) | 0 (0.0%) |
Health Insurance Coverage by Household Income in Betterton
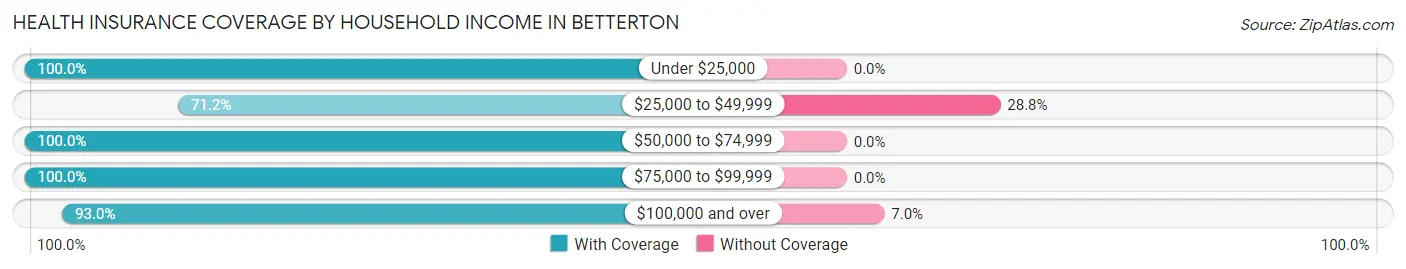
| Household Income | With Coverage | Without Coverage |
| Under $25,000 | 22 (100.0%) | 0 (0.0%) |
| $25,000 to $49,999 | 52 (71.2%) | 21 (28.8%) |
| $50,000 to $74,999 | 92 (100.0%) | 0 (0.0%) |
| $75,000 to $99,999 | 34 (100.0%) | 0 (0.0%) |
| $100,000 and over | 132 (93.0%) | 10 (7.0%) |
Public vs Private Health Insurance Coverage by Age in Betterton
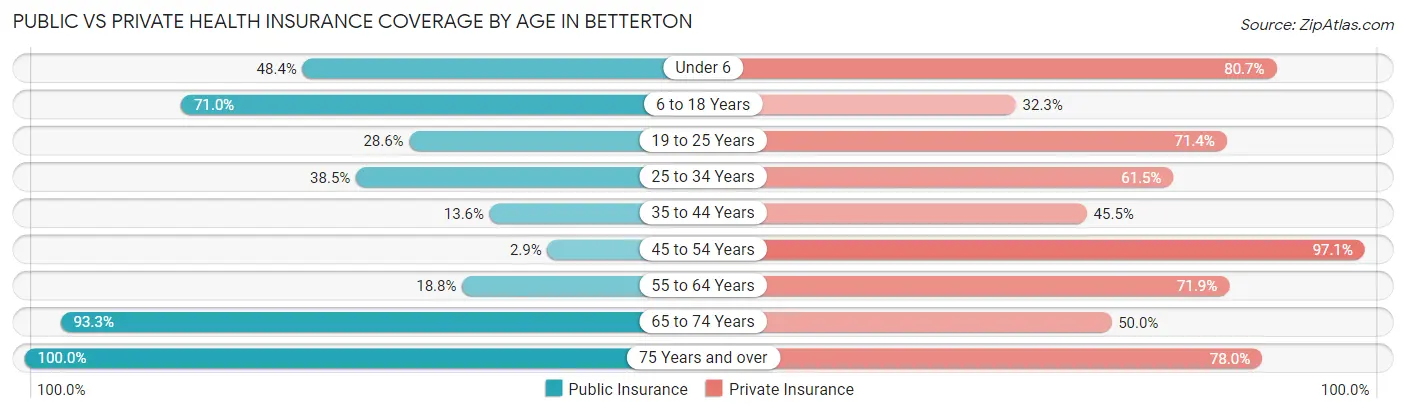
| Age Bracket | Public Insurance | Private Insurance |
| Under 6 | 15 (48.4%) | 25 (80.6%) |
| 6 to 18 Years | 22 (71.0%) | 10 (32.3%) |
| 19 to 25 Years | 6 (28.6%) | 15 (71.4%) |
| 25 to 34 Years | 10 (38.5%) | 16 (61.5%) |
| 35 to 44 Years | 6 (13.6%) | 20 (45.5%) |
| 45 to 54 Years | 1 (2.9%) | 33 (97.1%) |
| 55 to 64 Years | 18 (18.8%) | 69 (71.9%) |
| 65 to 74 Years | 28 (93.3%) | 15 (50.0%) |
| 75 Years and over | 50 (100.0%) | 39 (78.0%) |
| Total | 156 (43.0%) | 242 (66.7%) |
Disability Status by Sex by Age in Betterton
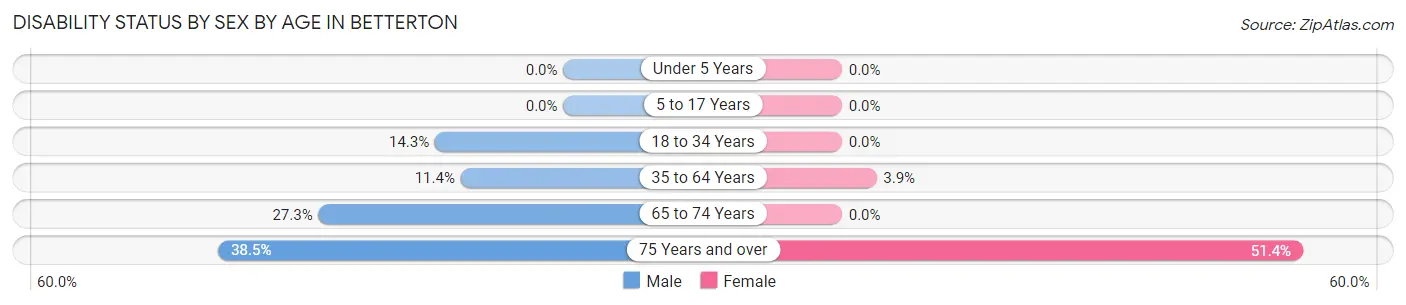
| Age Bracket | Male | Female |
| Under 5 Years | 0 (0.0%) | 0 (0.0%) |
| 5 to 17 Years | 0 (0.0%) | 0 (0.0%) |
| 18 to 34 Years | 4 (14.3%) | 0 (0.0%) |
| 35 to 64 Years | 8 (11.4%) | 4 (3.8%) |
| 65 to 74 Years | 6 (27.3%) | 0 (0.0%) |
| 75 Years and over | 5 (38.5%) | 19 (51.3%) |
Disability Class by Sex by Age in Betterton
Disability Class: Hearing Difficulty
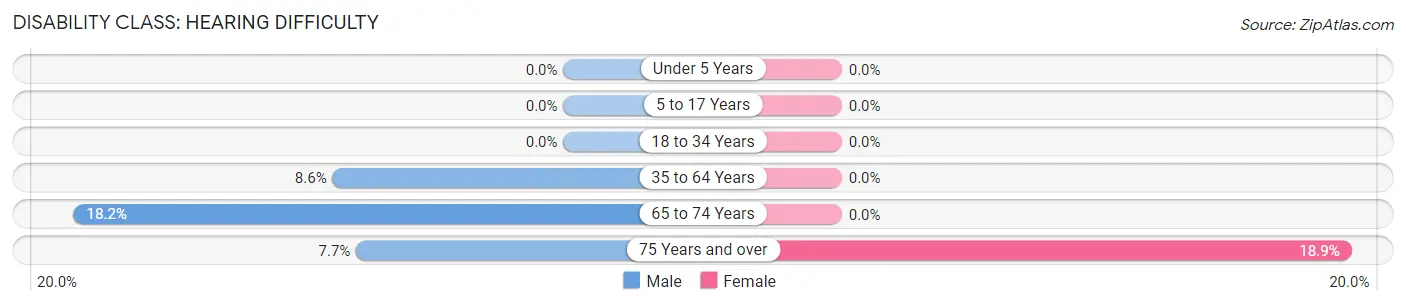
| Age Bracket | Male | Female |
| Under 5 Years | 0 (0.0%) | 0 (0.0%) |
| 5 to 17 Years | 0 (0.0%) | 0 (0.0%) |
| 18 to 34 Years | 0 (0.0%) | 0 (0.0%) |
| 35 to 64 Years | 6 (8.6%) | 0 (0.0%) |
| 65 to 74 Years | 4 (18.2%) | 0 (0.0%) |
| 75 Years and over | 1 (7.7%) | 7 (18.9%) |
Disability Class: Vision Difficulty
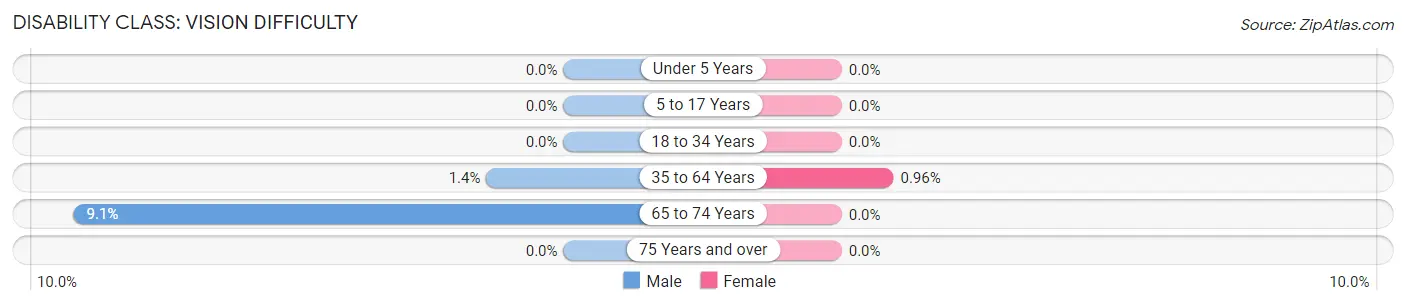
| Age Bracket | Male | Female |
| Under 5 Years | 0 (0.0%) | 0 (0.0%) |
| 5 to 17 Years | 0 (0.0%) | 0 (0.0%) |
| 18 to 34 Years | 0 (0.0%) | 0 (0.0%) |
| 35 to 64 Years | 1 (1.4%) | 1 (1.0%) |
| 65 to 74 Years | 2 (9.1%) | 0 (0.0%) |
| 75 Years and over | 0 (0.0%) | 0 (0.0%) |
Disability Class: Cognitive Difficulty
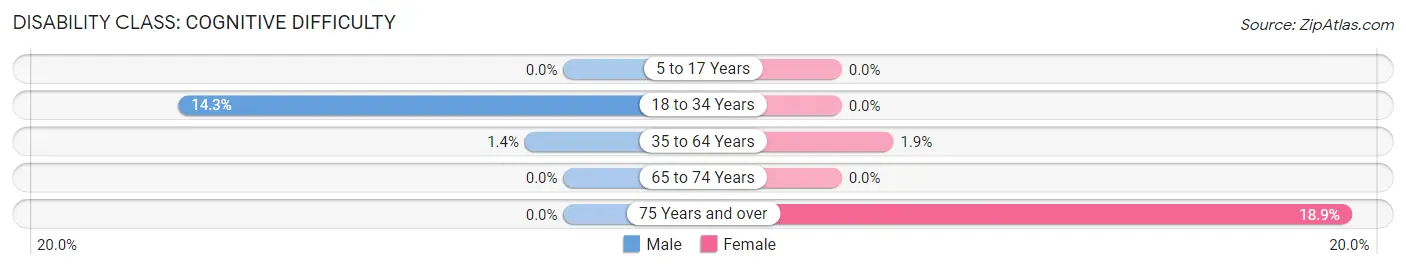
| Age Bracket | Male | Female |
| 5 to 17 Years | 0 (0.0%) | 0 (0.0%) |
| 18 to 34 Years | 4 (14.3%) | 0 (0.0%) |
| 35 to 64 Years | 1 (1.4%) | 2 (1.9%) |
| 65 to 74 Years | 0 (0.0%) | 0 (0.0%) |
| 75 Years and over | 0 (0.0%) | 7 (18.9%) |
Disability Class: Ambulatory Difficulty
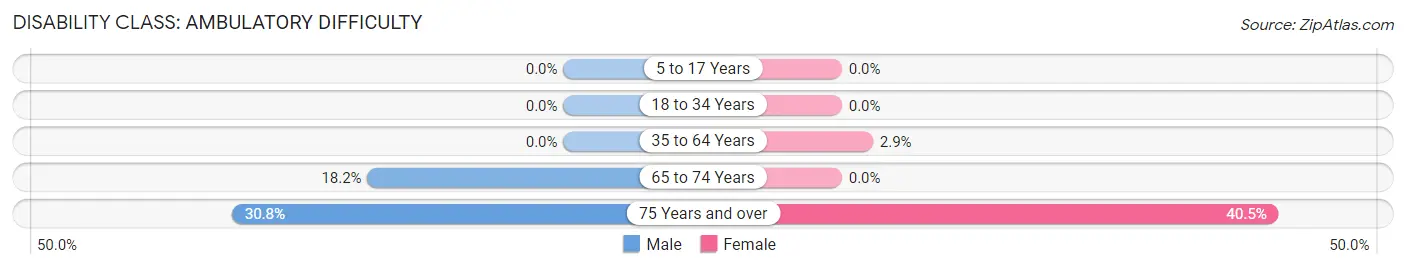
| Age Bracket | Male | Female |
| 5 to 17 Years | 0 (0.0%) | 0 (0.0%) |
| 18 to 34 Years | 0 (0.0%) | 0 (0.0%) |
| 35 to 64 Years | 0 (0.0%) | 3 (2.9%) |
| 65 to 74 Years | 4 (18.2%) | 0 (0.0%) |
| 75 Years and over | 4 (30.8%) | 15 (40.5%) |
Disability Class: Self-Care Difficulty
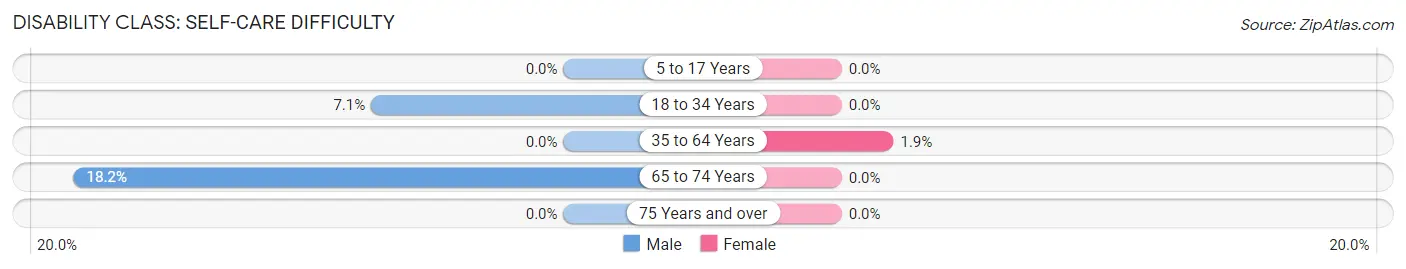
| Age Bracket | Male | Female |
| 5 to 17 Years | 0 (0.0%) | 0 (0.0%) |
| 18 to 34 Years | 2 (7.1%) | 0 (0.0%) |
| 35 to 64 Years | 0 (0.0%) | 2 (1.9%) |
| 65 to 74 Years | 4 (18.2%) | 0 (0.0%) |
| 75 Years and over | 0 (0.0%) | 0 (0.0%) |
Technology Access in Betterton
Computing Device Access in Betterton
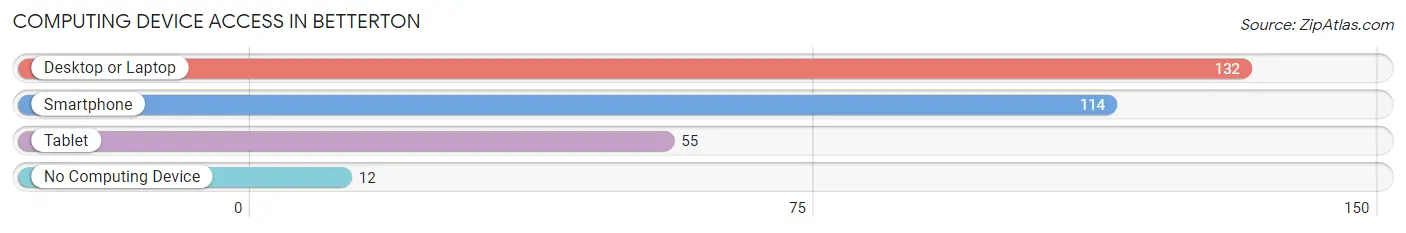
| Device Type | # Households | % Households |
| Desktop or Laptop | 132 | 84.1% |
| Smartphone | 114 | 72.6% |
| Tablet | 55 | 35.0% |
| No Computing Device | 12 | 7.6% |
| Total | 157 | 100.0% |
Internet Access in Betterton
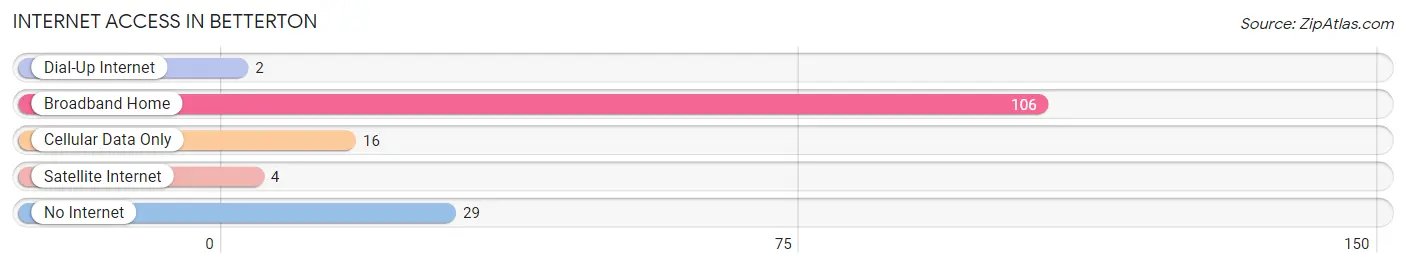
| Internet Type | # Households | % Households |
| Dial-Up Internet | 2 | 1.3% |
| Broadband Home | 106 | 67.5% |
| Cellular Data Only | 16 | 10.2% |
| Satellite Internet | 4 | 2.5% |
| No Internet | 29 | 18.5% |
| Total | 157 | 100.0% |
Betterton Summary
History
Betterton is a small town located in Kent County, Maryland. It is situated on the banks of the Chesapeake Bay, about an hour’s drive from Baltimore. The town was founded in 1883 by William Betterton, a local businessman who wanted to create a resort town for the wealthy. The town was incorporated in 1887 and quickly became a popular destination for wealthy vacationers.
The town’s economy was largely based on the fishing industry, with many of the town’s residents working as fishermen or in related industries. The town also had a thriving oyster industry, with many of the town’s residents harvesting oysters from the bay.
In the early 20th century, Betterton began to attract more tourists, as the town’s beaches and waterfront views became increasingly popular. The town also became a popular destination for summer vacationers, as the town’s hotels and resorts offered a variety of activities and amenities.
In the 1950s, Betterton began to experience a decline in its economy, as the fishing industry began to decline and the town’s tourist industry began to suffer. The town’s population began to decline as well, as many of the town’s residents moved away in search of better economic opportunities.
In the late 20th century, Betterton began to experience a resurgence in its economy, as the town’s waterfront views and beaches once again became popular with tourists. The town also began to attract more businesses, as the town’s proximity to Baltimore and Washington, D.C. made it an attractive location for businesses.
Today, Betterton is a small but vibrant town, with a population of just over 1,000 people. The town’s economy is largely based on tourism, with many of the town’s businesses catering to tourists. The town also has a thriving arts and culture scene, with many of the town’s residents involved in the arts.
Geography
Betterton is located in Kent County, Maryland, on the banks of the Chesapeake Bay. The town is situated on a peninsula, with the Chesapeake Bay to the east and the Sassafras River to the west. The town is bordered by the towns of Galena and Chestertown to the north, and the towns of Rock Hall and Grasonville to the south.
The town is located in a temperate climate, with hot summers and mild winters. The average temperature in the summer is around 80 degrees Fahrenheit, while the average temperature in the winter is around 40 degrees Fahrenheit. The town receives an average of 45 inches of rain per year.
Economy
The economy of Betterton is largely based on tourism, with many of the town’s businesses catering to tourists. The town also has a thriving arts and culture scene, with many of the town’s residents involved in the arts.
The town’s economy is also supported by the fishing industry, with many of the town’s residents working as fishermen or in related industries. The town also has a thriving oyster industry, with many of the town’s residents harvesting oysters from the bay.
Demographics
As of the 2010 census, the population of Betterton was 1,072. The town’s population is largely white, with 92.3% of the population identifying as white. The town’s population is also largely Christian, with 79.3% of the population identifying as Christian.
The median household income in Betterton is $50,972, and the median home value is $179,400. The town’s unemployment rate is 4.2%, which is lower than the national average. The town’s poverty rate is 8.3%, which is also lower than the national average.
Common Questions
What is Per Capita Income in Betterton?
Per Capita income in Betterton is $34,188.
What is the Median Family Income in Betterton?
Median Family Income in Betterton is $71,250.
What is the Median Household income in Betterton?
Median Household Income in Betterton is $62,750.
What is Income or Wage Gap in Betterton?
Income or Wage Gap in Betterton is 13.7%.
Women in Betterton earn 86.3 cents for every dollar earned by a man.
What is Inequality or Gini Index in Betterton?
Inequality or Gini Index in Betterton is 0.33.
What is the Total Population of Betterton?
Total Population of Betterton is 363.
What is the Total Male Population of Betterton?
Total Male Population of Betterton is 159.
What is the Total Female Population of Betterton?
Total Female Population of Betterton is 204.
What is the Ratio of Males per 100 Females in Betterton?
There are 77.94 Males per 100 Females in Betterton.
What is the Ratio of Females per 100 Males in Betterton?
There are 128.30 Females per 100 Males in Betterton.
What is the Median Population Age in Betterton?
Median Population Age in Betterton is 52.8 Years.
What is the Average Family Size in Betterton
Average Family Size in Betterton is 2.5 People.
What is the Average Household Size in Betterton
Average Household Size in Betterton is 2.3 People.
How Large is the Labor Force in Betterton?
There are 158 People in the Labor Forcein in Betterton.
What is the Percentage of People in the Labor Force in Betterton?
51.5% of People are in the Labor Force in Betterton.
What is the Unemployment Rate in Betterton?
Unemployment Rate in Betterton is 24.1%.