Westminster, MD Map & Demographics
Westminster Map
Westminster Overview
$38,841
PER CAPITA INCOME
$102,430
AVG FAMILY INCOME
$71,286
AVG HOUSEHOLD INCOME
25.8%
WAGE / INCOME GAP [ % ]
74.2¢/ $1
WAGE / INCOME GAP [ $ ]
$8,613
FAMILY INCOME DEFICIT
0.43
INEQUALITY / GINI INDEX
20,099
TOTAL POPULATION
9,837
MALE POPULATION
10,262
FEMALE POPULATION
95.86
MALES / 100 FEMALES
104.32
FEMALES / 100 MALES
37.3
MEDIAN AGE
2.9
AVG FAMILY SIZE
2.3
AVG HOUSEHOLD SIZE
10,411
LABOR FORCE [ PEOPLE ]
61.2%
PERCENT IN LABOR FORCE
4.4%
UNEMPLOYMENT RATE
Income in Westminster
Income Overview in Westminster
Per Capita Income in Westminster is $38,841, while median incomes of families and households are $102,430 and $71,286 respectively.
| Characteristic | Number | Measure |
| Per Capita Income | 20,099 | $38,841 |
| Median Family Income | 4,848 | $102,430 |
| Mean Family Income | 4,848 | $116,085 |
| Median Household Income | 8,008 | $71,286 |
| Mean Household Income | 8,008 | $93,525 |
| Income Deficit | 4,848 | $8,613 |
| Wage / Income Gap (%) | 20,099 | 25.78% |
| Wage / Income Gap ($) | 20,099 | 74.22¢ per $1 |
| Gini / Inequality Index | 20,099 | 0.43 |
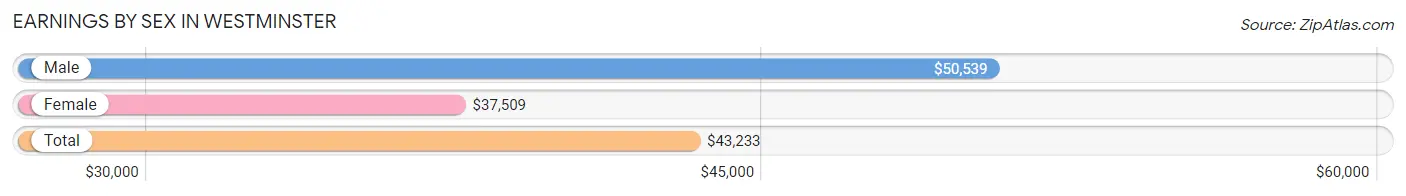
Earnings by Sex in Westminster
Average Earnings in Westminster are $43,233, $50,539 for men and $37,509 for women, a difference of 25.8%.
| Sex | Number | Average Earnings |
| Male | 5,855 (51.6%) | $50,539 |
| Female | 5,491 (48.4%) | $37,509 |
| Total | 11,346 (100.0%) | $43,233 |
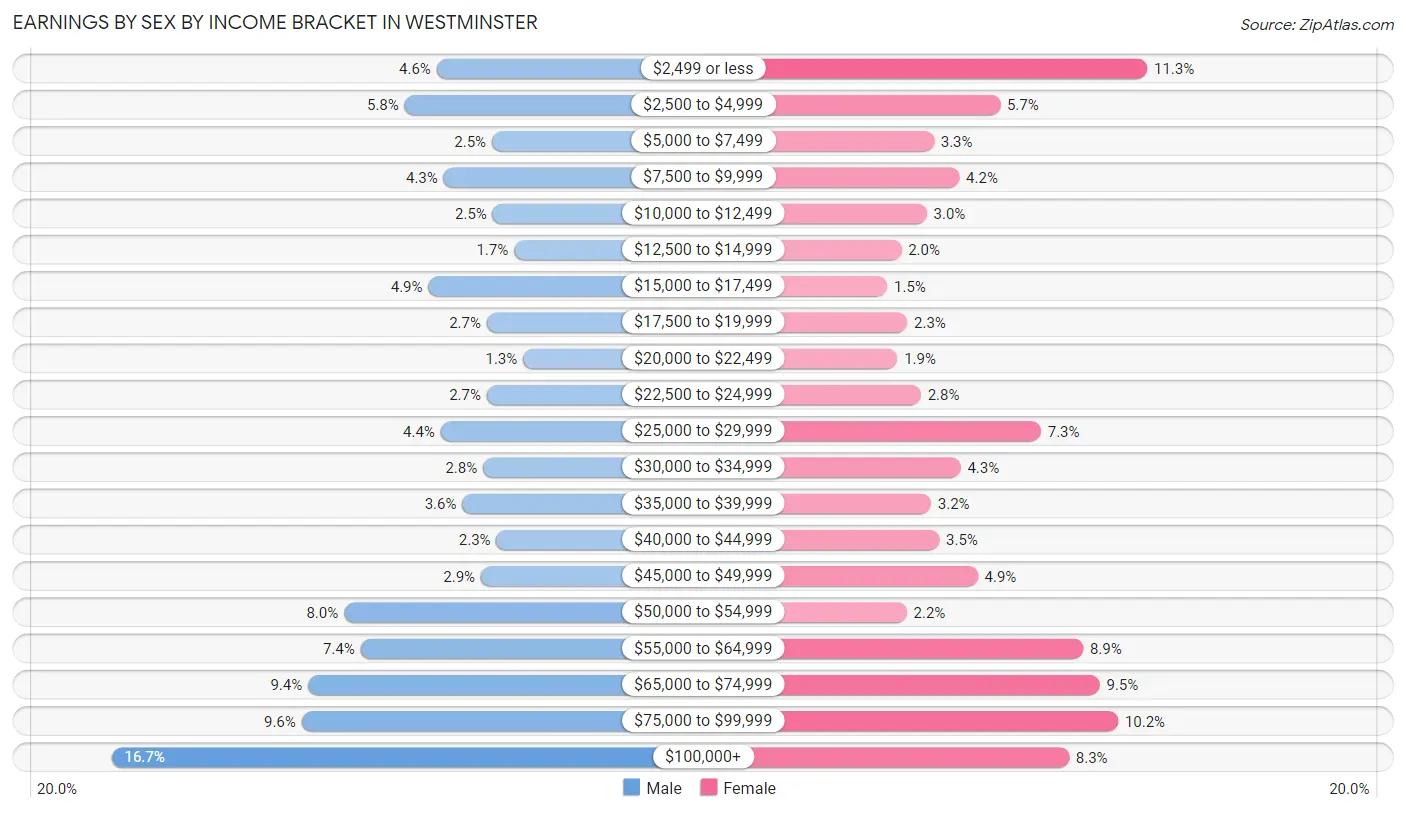
Earnings by Sex by Income Bracket in Westminster
The most common earnings brackets in Westminster are $100,000+ for men (980 | 16.7%) and $2,499 or less for women (618 | 11.3%).
| Income | Male | Female |
| $2,499 or less | 267 (4.6%) | 618 (11.3%) |
| $2,500 to $4,999 | 337 (5.8%) | 315 (5.7%) |
| $5,000 to $7,499 | 146 (2.5%) | 179 (3.3%) |
| $7,500 to $9,999 | 252 (4.3%) | 231 (4.2%) |
| $10,000 to $12,499 | 144 (2.5%) | 164 (3.0%) |
| $12,500 to $14,999 | 97 (1.7%) | 112 (2.0%) |
| $15,000 to $17,499 | 285 (4.9%) | 83 (1.5%) |
| $17,500 to $19,999 | 157 (2.7%) | 124 (2.3%) |
| $20,000 to $22,499 | 77 (1.3%) | 104 (1.9%) |
| $22,500 to $24,999 | 157 (2.7%) | 152 (2.8%) |
| $25,000 to $29,999 | 258 (4.4%) | 399 (7.3%) |
| $30,000 to $34,999 | 165 (2.8%) | 234 (4.3%) |
| $35,000 to $39,999 | 211 (3.6%) | 173 (3.2%) |
| $40,000 to $44,999 | 136 (2.3%) | 190 (3.5%) |
| $45,000 to $49,999 | 170 (2.9%) | 269 (4.9%) |
| $50,000 to $54,999 | 470 (8.0%) | 123 (2.2%) |
| $55,000 to $64,999 | 434 (7.4%) | 486 (8.8%) |
| $65,000 to $74,999 | 549 (9.4%) | 520 (9.5%) |
| $75,000 to $99,999 | 563 (9.6%) | 558 (10.2%) |
| $100,000+ | 980 (16.7%) | 457 (8.3%) |
| Total | 5,855 (100.0%) | 5,491 (100.0%) |
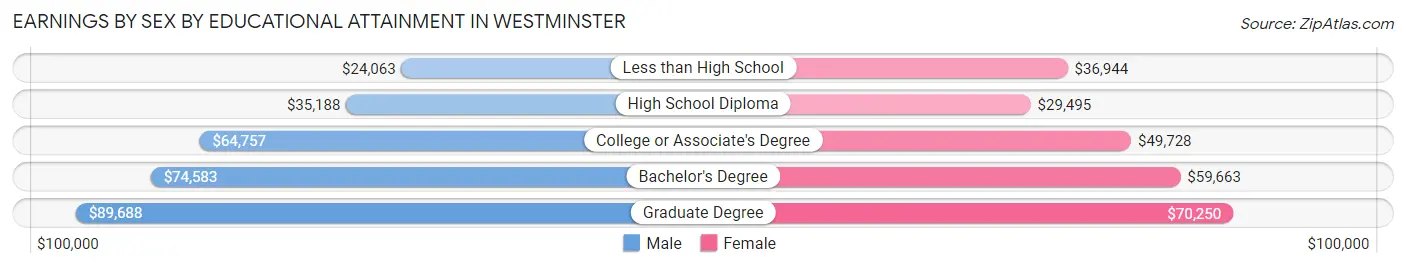
Earnings by Sex by Educational Attainment in Westminster
Average earnings in Westminster are $60,598 for men and $55,144 for women, a difference of 9.0%. Men with an educational attainment of graduate degree enjoy the highest average annual earnings of $89,688, while those with less than high school education earn the least with $24,063. Women with an educational attainment of graduate degree earn the most with the average annual earnings of $70,250, while those with high school diploma education have the smallest earnings of $29,495.
| Educational Attainment | Male Income | Female Income |
| Less than High School | $24,063 | $36,944 |
| High School Diploma | $35,188 | $29,495 |
| College or Associate's Degree | $64,757 | $49,728 |
| Bachelor's Degree | $74,583 | $59,663 |
| Graduate Degree | $89,688 | $70,250 |
| Total | $60,598 | $55,144 |
Family Income in Westminster
Family Income Brackets in Westminster
According to the Westminster family income data, there are 1,110 families falling into the $100,000 to $149,999 income range, which is the most common income bracket and makes up 22.9% of all families. Conversely, the $10,000 to $14,999 income bracket is the least frequent group with only 73 families (1.5%) belonging to this category.
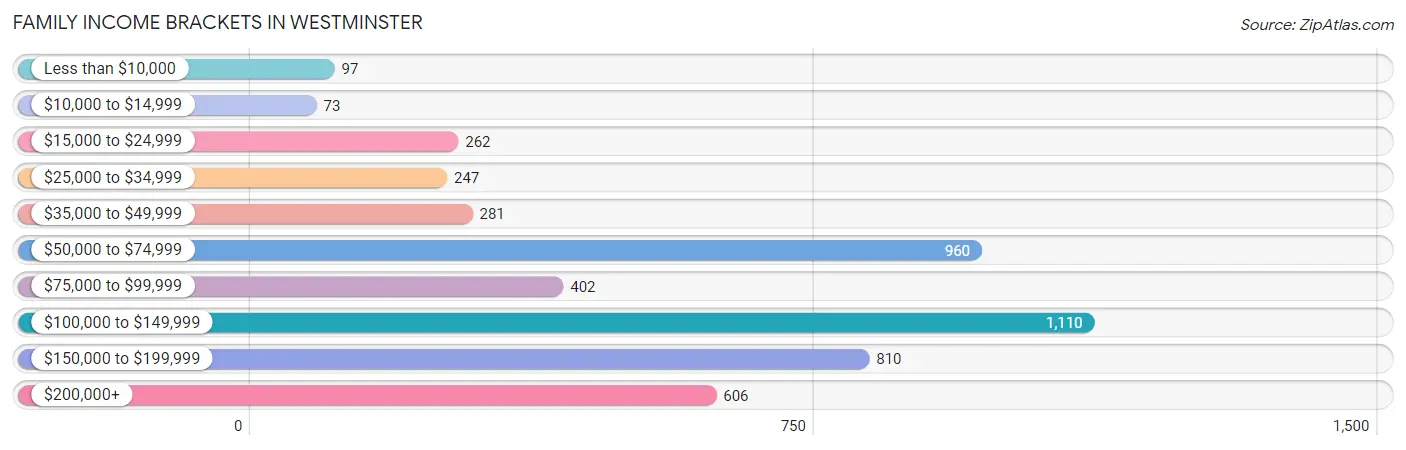
| Income Bracket | # Families | % Families |
| Less than $10,000 | 97 | 2.0% |
| $10,000 to $14,999 | 73 | 1.5% |
| $15,000 to $24,999 | 262 | 5.4% |
| $25,000 to $34,999 | 247 | 5.1% |
| $35,000 to $49,999 | 281 | 5.8% |
| $50,000 to $74,999 | 960 | 19.8% |
| $75,000 to $99,999 | 402 | 8.3% |
| $100,000 to $149,999 | 1,110 | 22.9% |
| $150,000 to $199,999 | 810 | 16.7% |
| $200,000+ | 606 | 12.5% |
Family Income by Famaliy Size in Westminster
6-person families (124 | 2.6%) account for the highest median family income in Westminster with $183,125 per family, while 4-person families (715 | 14.7%) have the highest median income of $42,266 per family member.
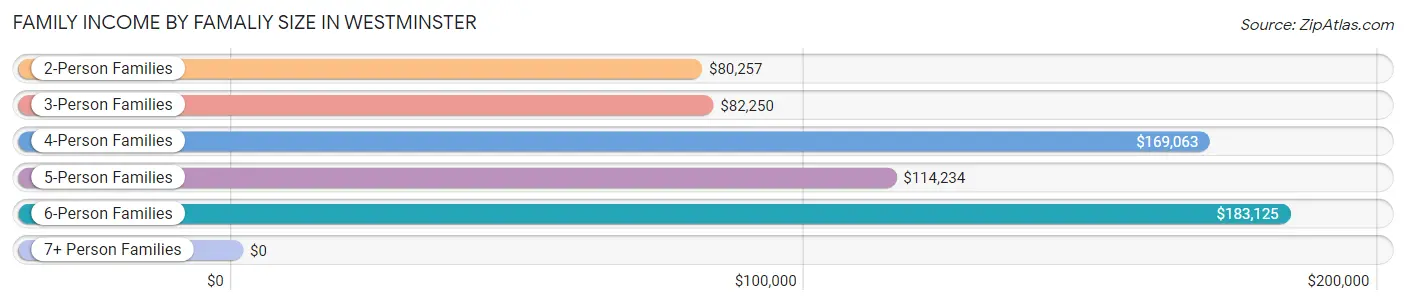
| Income Bracket | # Families | Median Income |
| 2-Person Families | 2,407 (49.6%) | $80,257 |
| 3-Person Families | 1,161 (23.9%) | $82,250 |
| 4-Person Families | 715 (14.7%) | $169,063 |
| 5-Person Families | 417 (8.6%) | $114,234 |
| 6-Person Families | 124 (2.6%) | $183,125 |
| 7+ Person Families | 24 (0.5%) | $0 |
| Total | 4,848 (100.0%) | $102,430 |
Family Income by Number of Earners in Westminster
The median family income in Westminster is $102,430, with families comprising 3+ earners (619) having the highest median family income of $154,712, while families with 1 earner (1,539) have the lowest median family income of $54,452, accounting for 12.8% and 31.8% of families, respectively.
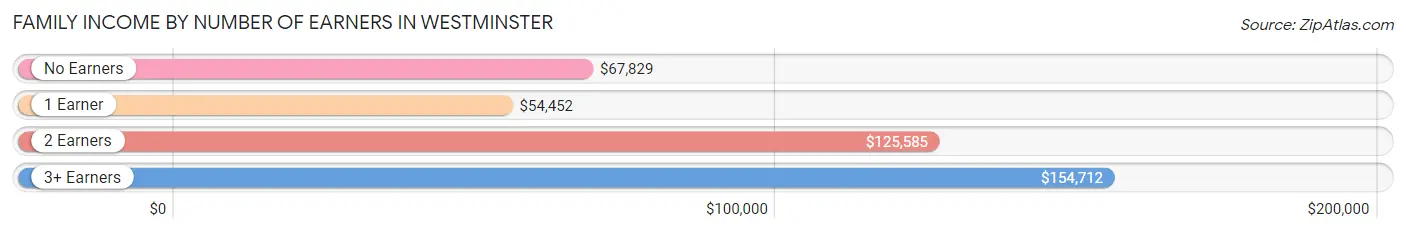
| Number of Earners | # Families | Median Income |
| No Earners | 623 (12.9%) | $67,829 |
| 1 Earner | 1,539 (31.8%) | $54,452 |
| 2 Earners | 2,067 (42.6%) | $125,585 |
| 3+ Earners | 619 (12.8%) | $154,712 |
| Total | 4,848 (100.0%) | $102,430 |
Household Income in Westminster
Household Income Brackets in Westminster
With 1,562 households falling in the category, the $50,000 to $74,999 income range is the most frequent in Westminster, accounting for 19.5% of all households. In contrast, only 352 households (4.4%) fall into the $10,000 to $14,999 income bracket, making it the least populous group.
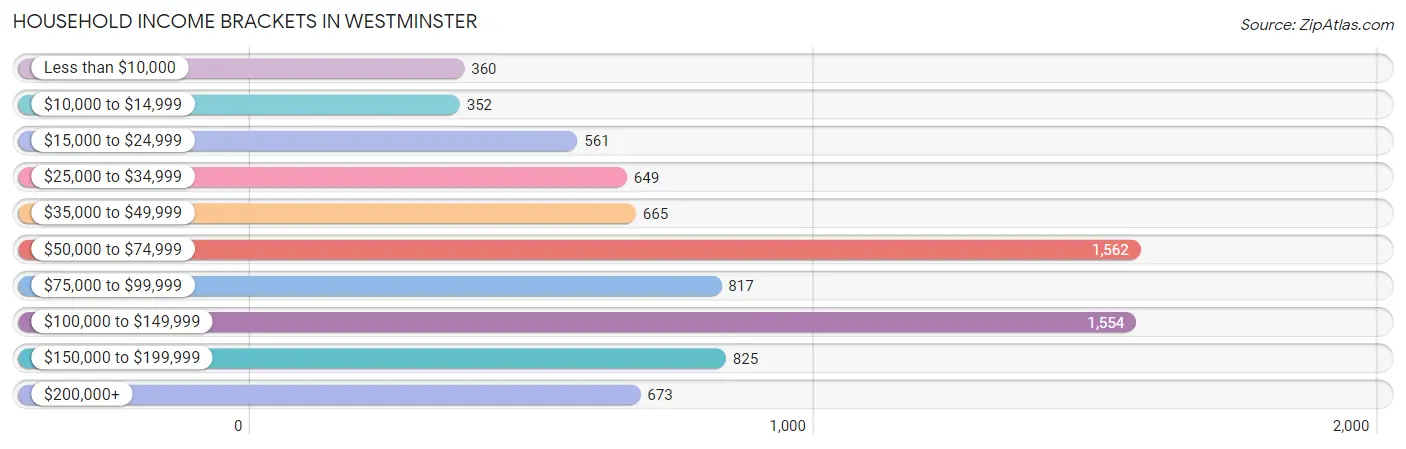
| Income Bracket | # Households | % Households |
| Less than $10,000 | 360 | 4.5% |
| $10,000 to $14,999 | 352 | 4.4% |
| $15,000 to $24,999 | 561 | 7.0% |
| $25,000 to $34,999 | 649 | 8.1% |
| $35,000 to $49,999 | 665 | 8.3% |
| $50,000 to $74,999 | 1,562 | 19.5% |
| $75,000 to $99,999 | 817 | 10.2% |
| $100,000 to $149,999 | 1,554 | 19.4% |
| $150,000 to $199,999 | 825 | 10.3% |
| $200,000+ | 673 | 8.4% |
Household Income by Householder Age in Westminster
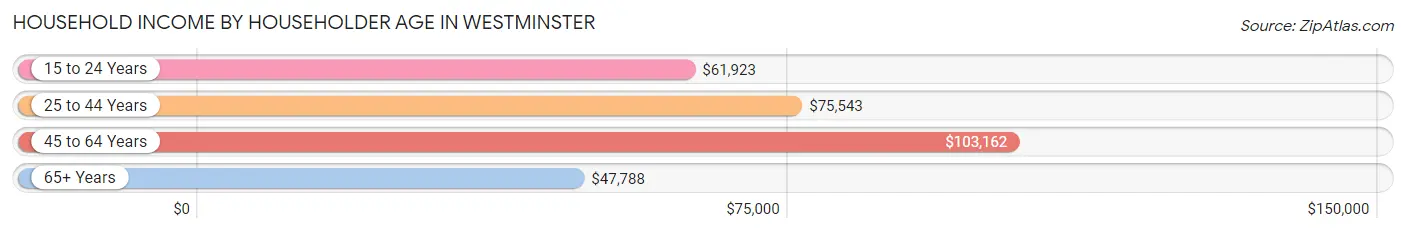
The median household income in Westminster is $71,286, with the highest median household income of $103,162 found in the 45 to 64 years age bracket for the primary householder. A total of 2,588 households (32.3%) fall into this category. Meanwhile, the 65+ years age bracket for the primary householder has the lowest median household income of $47,788, with 2,524 households (31.5%) in this group.
| Income Bracket | # Households | Median Income |
| 15 to 24 Years | 328 (4.1%) | $61,923 |
| 25 to 44 Years | 2,568 (32.1%) | $75,543 |
| 45 to 64 Years | 2,588 (32.3%) | $103,162 |
| 65+ Years | 2,524 (31.5%) | $47,788 |
| Total | 8,008 (100.0%) | $71,286 |
Poverty in Westminster
Income Below Poverty by Sex and Age in Westminster
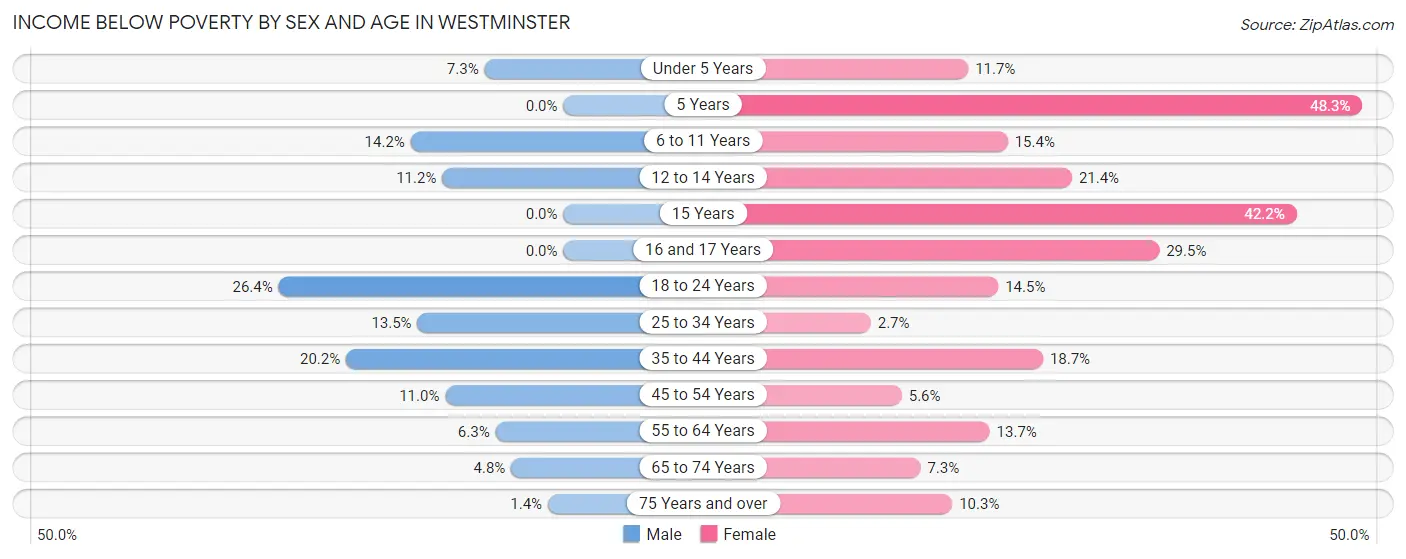
With 12.2% poverty level for males and 12.2% for females among the residents of Westminster, 18 to 24 year old males and 5 year old females are the most vulnerable to poverty, with 249 males (26.4%) and 71 females (48.3%) in their respective age groups living below the poverty level.
| Age Bracket | Male | Female |
| Under 5 Years | 38 (7.3%) | 44 (11.7%) |
| 5 Years | 0 (0.0%) | 71 (48.3%) |
| 6 to 11 Years | 109 (14.2%) | 67 (15.4%) |
| 12 to 14 Years | 40 (11.2%) | 44 (21.4%) |
| 15 Years | 0 (0.0%) | 73 (42.2%) |
| 16 and 17 Years | 0 (0.0%) | 33 (29.5%) |
| 18 to 24 Years | 249 (26.4%) | 124 (14.5%) |
| 25 to 34 Years | 183 (13.5%) | 35 (2.7%) |
| 35 to 44 Years | 261 (20.2%) | 213 (18.7%) |
| 45 to 54 Years | 130 (11.0%) | 62 (5.6%) |
| 55 to 64 Years | 51 (6.3%) | 179 (13.7%) |
| 65 to 74 Years | 39 (4.8%) | 67 (7.3%) |
| 75 Years and over | 9 (1.4%) | 123 (10.2%) |
| Total | 1,109 (12.2%) | 1,135 (12.2%) |
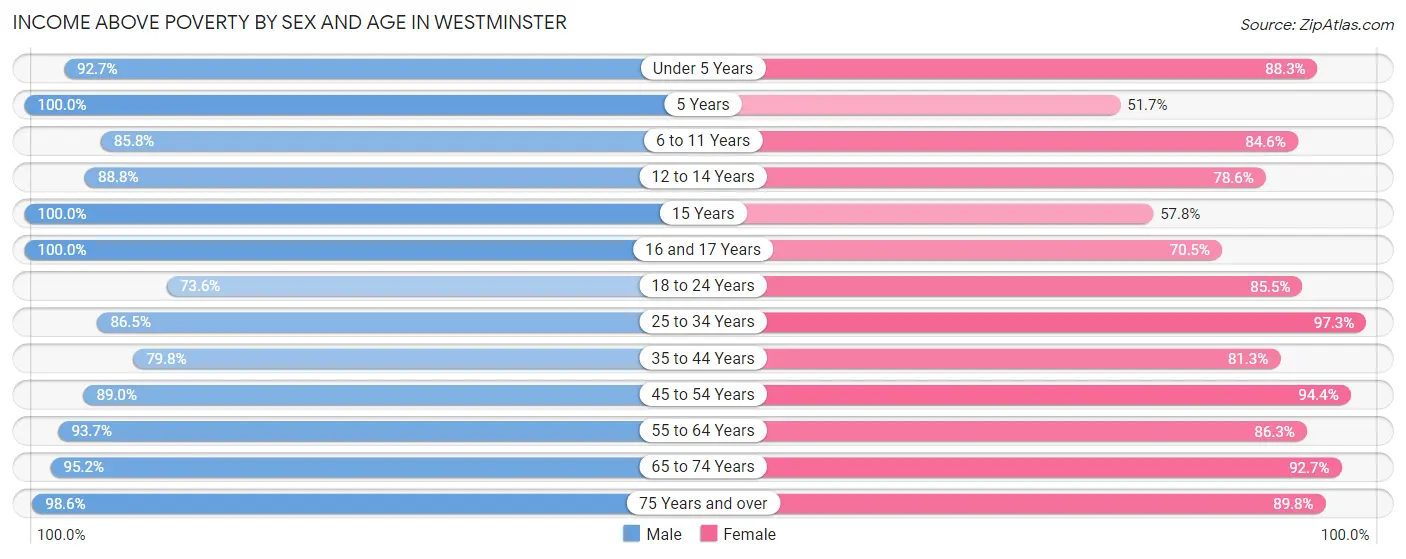
Income Above Poverty by Sex and Age in Westminster
According to the poverty statistics in Westminster, males aged 5 years and females aged 25 to 34 years are the age groups that are most secure financially, with 100.0% of males and 97.3% of females in these age groups living above the poverty line.
| Age Bracket | Male | Female |
| Under 5 Years | 481 (92.7%) | 331 (88.3%) |
| 5 Years | 48 (100.0%) | 76 (51.7%) |
| 6 to 11 Years | 660 (85.8%) | 368 (84.6%) |
| 12 to 14 Years | 316 (88.8%) | 162 (78.6%) |
| 15 Years | 59 (100.0%) | 100 (57.8%) |
| 16 and 17 Years | 286 (100.0%) | 79 (70.5%) |
| 18 to 24 Years | 693 (73.6%) | 730 (85.5%) |
| 25 to 34 Years | 1,169 (86.5%) | 1,267 (97.3%) |
| 35 to 44 Years | 1,033 (79.8%) | 928 (81.3%) |
| 45 to 54 Years | 1,056 (89.0%) | 1,052 (94.4%) |
| 55 to 64 Years | 759 (93.7%) | 1,126 (86.3%) |
| 65 to 74 Years | 767 (95.2%) | 851 (92.7%) |
| 75 Years and over | 619 (98.6%) | 1,077 (89.7%) |
| Total | 7,946 (87.7%) | 8,147 (87.8%) |
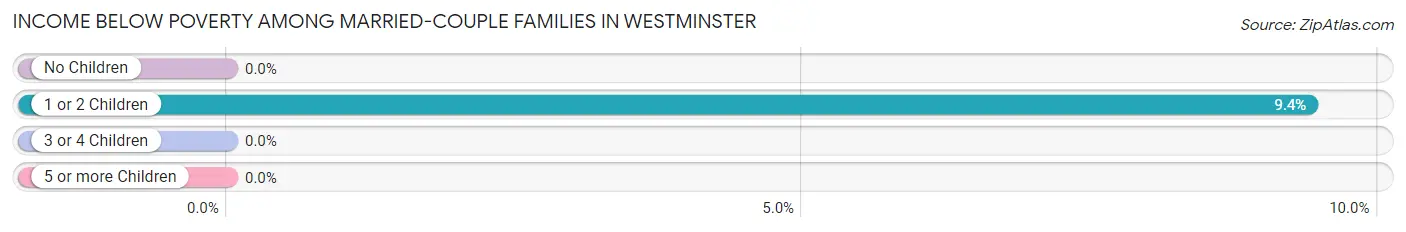
Income Below Poverty Among Married-Couple Families in Westminster
The poverty statistics for married-couple families in Westminster show that 3.2% or 115 of the total 3,638 families live below the poverty line. Families with 1 or 2 children have the highest poverty rate of 9.4%, comprising of 115 families. On the other hand, families with no children have the lowest poverty rate of 0.0%, which includes 0 families.
| Children | Above Poverty | Below Poverty |
| No Children | 2,164 (100.0%) | 0 (0.0%) |
| 1 or 2 Children | 1,109 (90.6%) | 115 (9.4%) |
| 3 or 4 Children | 226 (100.0%) | 0 (0.0%) |
| 5 or more Children | 24 (100.0%) | 0 (0.0%) |
| Total | 3,523 (96.8%) | 115 (3.2%) |
Income Below Poverty Among Single-Parent Households in Westminster
According to the poverty data in Westminster, 51.2% or 191 single-father households and 19.0% or 159 single-mother households are living below the poverty line. Among single-father households, those with 1 or 2 children have the highest poverty rate, with 177 households (63.7%) experiencing poverty. Likewise, among single-mother households, those with 1 or 2 children have the highest poverty rate, with 114 households (25.3%) falling below the poverty line.
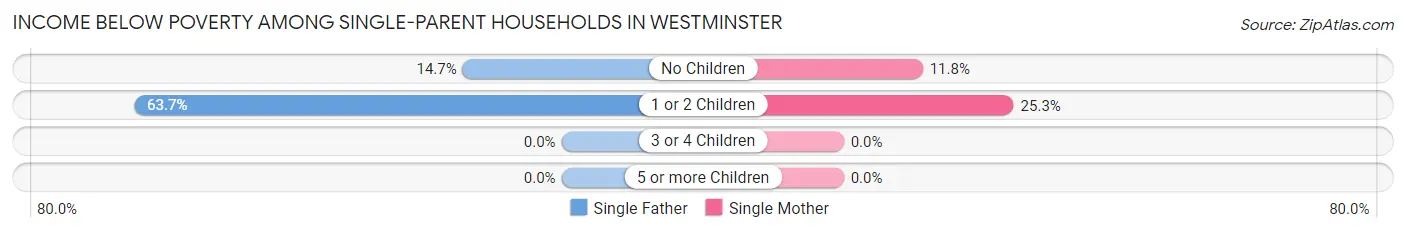
| Children | Single Father | Single Mother |
| No Children | 14 (14.7%) | 45 (11.8%) |
| 1 or 2 Children | 177 (63.7%) | 114 (25.3%) |
| 3 or 4 Children | 0 (0.0%) | 0 (0.0%) |
| 5 or more Children | 0 (0.0%) | 0 (0.0%) |
| Total | 191 (51.2%) | 159 (19.0%) |
Income Below Poverty Among Married-Couple vs Single-Parent Households in Westminster
The poverty data for Westminster shows that 115 of the married-couple family households (3.2%) and 350 of the single-parent households (28.9%) are living below the poverty level. Within the married-couple family households, those with 1 or 2 children have the highest poverty rate, with 115 households (9.4%) falling below the poverty line. Among the single-parent households, those with 1 or 2 children have the highest poverty rate, with 291 household (40.0%) living below poverty.
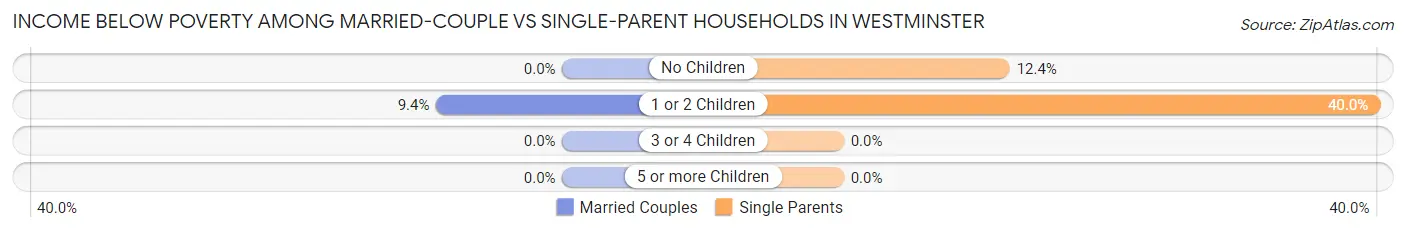
| Children | Married-Couple Families | Single-Parent Households |
| No Children | 0 (0.0%) | 59 (12.4%) |
| 1 or 2 Children | 115 (9.4%) | 291 (40.0%) |
| 3 or 4 Children | 0 (0.0%) | 0 (0.0%) |
| 5 or more Children | 0 (0.0%) | 0 (0.0%) |
| Total | 115 (3.2%) | 350 (28.9%) |
Race in Westminster
The most populous races in Westminster are White / Caucasian (16,414 | 81.7%), Black / African American (1,385 | 6.9%), and Two or more Races (1,361 | 6.8%).
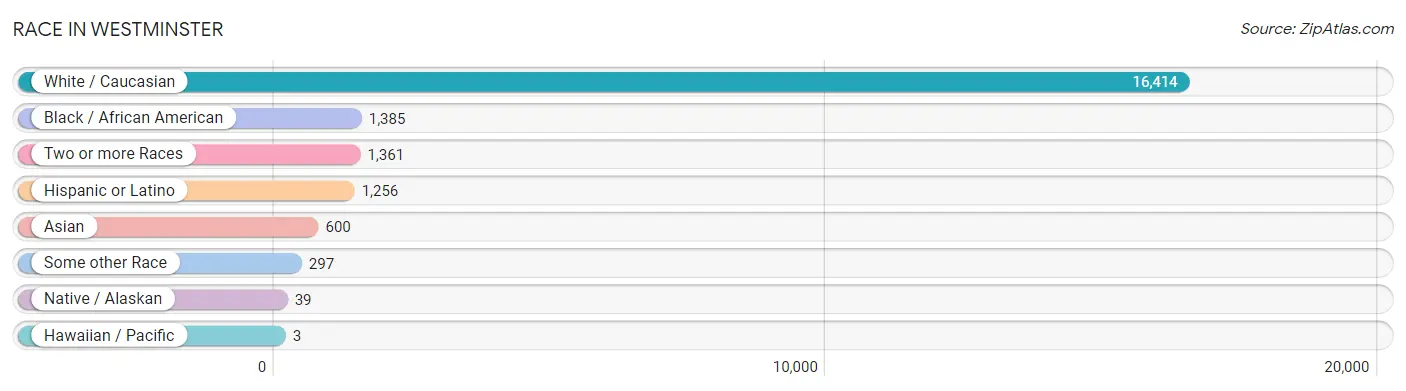
| Race | # Population | % Population |
| Asian | 600 | 3.0% |
| Black / African American | 1,385 | 6.9% |
| Hawaiian / Pacific | 3 | 0.0% |
| Hispanic or Latino | 1,256 | 6.2% |
| Native / Alaskan | 39 | 0.2% |
| White / Caucasian | 16,414 | 81.7% |
| Two or more Races | 1,361 | 6.8% |
| Some other Race | 297 | 1.5% |
| Total | 20,099 | 100.0% |
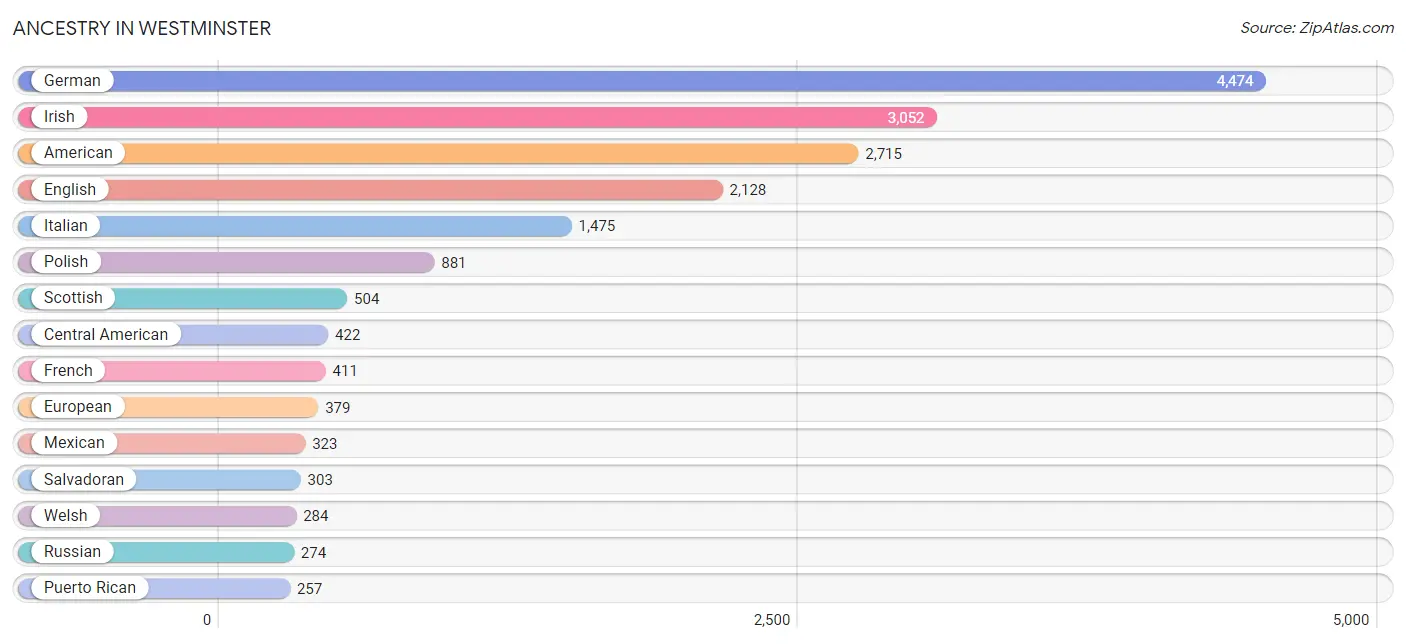
Ancestry in Westminster
The most populous ancestries reported in Westminster are German (4,474 | 22.3%), Irish (3,052 | 15.2%), American (2,715 | 13.5%), English (2,128 | 10.6%), and Italian (1,475 | 7.3%), together accounting for 68.9% of all Westminster residents.
| Ancestry | # Population | % Population |
| African | 96 | 0.5% |
| American | 2,715 | 13.5% |
| Arab | 12 | 0.1% |
| Argentinean | 24 | 0.1% |
| Austrian | 67 | 0.3% |
| Bhutanese | 77 | 0.4% |
| Blackfeet | 5 | 0.0% |
| Brazilian | 44 | 0.2% |
| British | 38 | 0.2% |
| Burmese | 16 | 0.1% |
| Canadian | 15 | 0.1% |
| Cape Verdean | 7 | 0.0% |
| Central American | 422 | 2.1% |
| Cherokee | 24 | 0.1% |
| Colombian | 8 | 0.0% |
| Croatian | 50 | 0.3% |
| Cuban | 111 | 0.5% |
| Czech | 87 | 0.4% |
| Czechoslovakian | 15 | 0.1% |
| Danish | 21 | 0.1% |
| Dominican | 49 | 0.2% |
| Dutch | 241 | 1.2% |
| Eastern European | 17 | 0.1% |
| Ecuadorian | 11 | 0.1% |
| English | 2,128 | 10.6% |
| Ethiopian | 20 | 0.1% |
| European | 379 | 1.9% |
| Filipino | 16 | 0.1% |
| Finnish | 36 | 0.2% |
| French | 411 | 2.0% |
| French Canadian | 38 | 0.2% |
| German | 4,474 | 22.3% |
| German Russian | 42 | 0.2% |
| Greek | 48 | 0.2% |
| Guatemalan | 116 | 0.6% |
| Hungarian | 78 | 0.4% |
| Indian (Asian) | 254 | 1.3% |
| Iranian | 11 | 0.1% |
| Irish | 3,052 | 15.2% |
| Italian | 1,475 | 7.3% |
| Jamaican | 3 | 0.0% |
| Japanese | 7 | 0.0% |
| Korean | 93 | 0.5% |
| Latvian | 2 | 0.0% |
| Liberian | 34 | 0.2% |
| Lithuanian | 46 | 0.2% |
| Mexican | 323 | 1.6% |
| Native Hawaiian | 6 | 0.0% |
| New Zealander | 25 | 0.1% |
| Nicaraguan | 3 | 0.0% |
| Nigerian | 24 | 0.1% |
| Northern European | 42 | 0.2% |
| Norwegian | 101 | 0.5% |
| Okinawan | 31 | 0.2% |
| Pakistani | 75 | 0.4% |
| Polish | 881 | 4.4% |
| Portuguese | 13 | 0.1% |
| Puerto Rican | 257 | 1.3% |
| Russian | 274 | 1.4% |
| Salvadoran | 303 | 1.5% |
| Scandinavian | 85 | 0.4% |
| Scotch-Irish | 103 | 0.5% |
| Scottish | 504 | 2.5% |
| Sioux | 1 | 0.0% |
| Slovak | 27 | 0.1% |
| South American | 43 | 0.2% |
| Spaniard | 18 | 0.1% |
| Spanish | 17 | 0.1% |
| Sri Lankan | 81 | 0.4% |
| Subsaharan African | 212 | 1.1% |
| Swedish | 172 | 0.9% |
| Swiss | 67 | 0.3% |
| Syrian | 12 | 0.1% |
| Thai | 188 | 0.9% |
| Tongan | 3 | 0.0% |
| Turkish | 47 | 0.2% |
| Ukrainian | 108 | 0.5% |
| Welsh | 284 | 1.4% | View All 78 Rows |
Immigrants in Westminster
The most numerous immigrant groups reported in Westminster came from Latin America (682 | 3.4%), Central America (589 | 2.9%), Asia (377 | 1.9%), El Salvador (339 | 1.7%), and Europe (206 | 1.0%), together accounting for 10.9% of all Westminster residents.
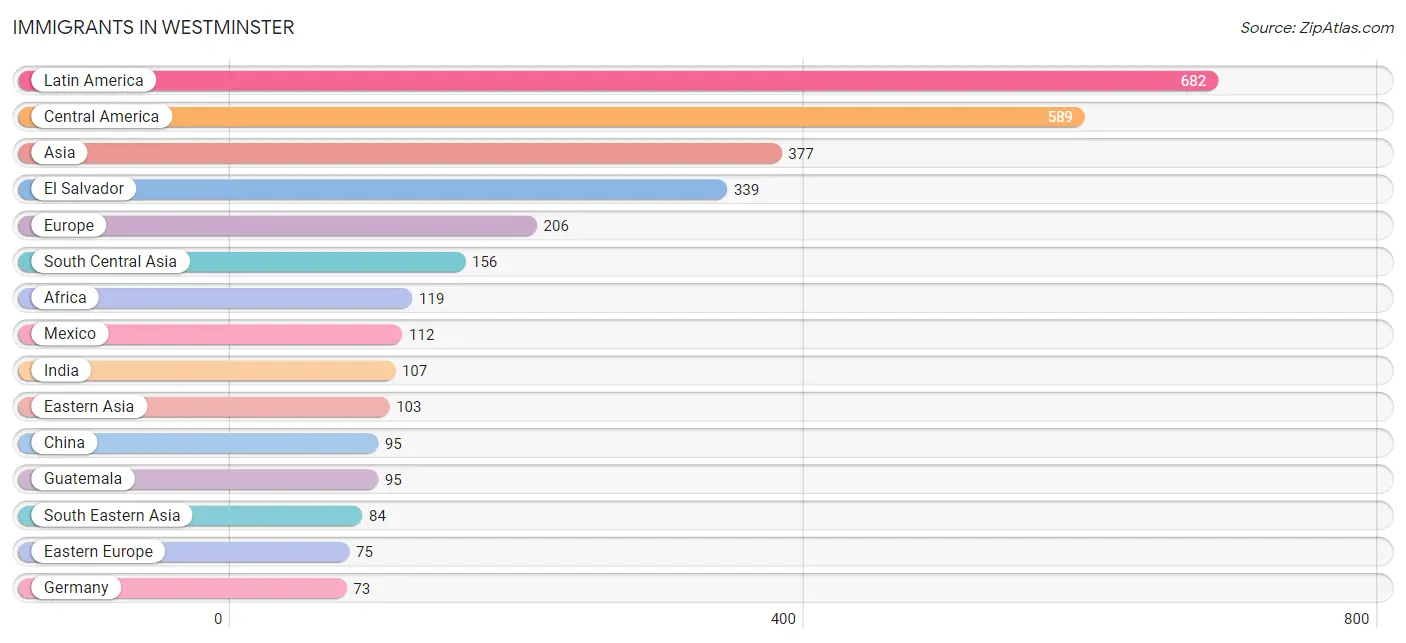
| Immigration Origin | # Population | % Population |
| Africa | 119 | 0.6% |
| Asia | 377 | 1.9% |
| Brazil | 17 | 0.1% |
| Canada | 61 | 0.3% |
| Caribbean | 42 | 0.2% |
| Central America | 589 | 2.9% |
| China | 95 | 0.5% |
| Colombia | 8 | 0.0% |
| Croatia | 32 | 0.2% |
| Dominican Republic | 42 | 0.2% |
| Eastern Africa | 29 | 0.1% |
| Eastern Asia | 103 | 0.5% |
| Eastern Europe | 75 | 0.4% |
| Ecuador | 11 | 0.1% |
| Egypt | 12 | 0.1% |
| El Salvador | 339 | 1.7% |
| Europe | 206 | 1.0% |
| Germany | 73 | 0.4% |
| Greece | 20 | 0.1% |
| Guatemala | 95 | 0.5% |
| Guyana | 15 | 0.1% |
| India | 107 | 0.5% |
| Iran | 11 | 0.1% |
| Israel | 2 | 0.0% |
| Korea | 8 | 0.0% |
| Latin America | 682 | 3.4% |
| Latvia | 14 | 0.1% |
| Liberia | 21 | 0.1% |
| Mexico | 112 | 0.6% |
| Morocco | 16 | 0.1% |
| Nicaragua | 43 | 0.2% |
| Nigeria | 21 | 0.1% |
| Northern Africa | 48 | 0.2% |
| Northern Europe | 38 | 0.2% |
| Oceania | 34 | 0.2% |
| Pakistan | 38 | 0.2% |
| Poland | 16 | 0.1% |
| Russia | 3 | 0.0% |
| Scotland | 38 | 0.2% |
| South America | 51 | 0.3% |
| South Central Asia | 156 | 0.8% |
| South Eastern Asia | 84 | 0.4% |
| Southern Europe | 20 | 0.1% |
| Sudan | 20 | 0.1% |
| Taiwan | 16 | 0.1% |
| Thailand | 23 | 0.1% |
| Turkey | 32 | 0.2% |
| Ukraine | 10 | 0.1% |
| Vietnam | 61 | 0.3% |
| Western Africa | 42 | 0.2% |
| Western Asia | 34 | 0.2% |
| Western Europe | 73 | 0.4% |
| Zimbabwe | 29 | 0.1% | View All 53 Rows |
Sex and Age in Westminster
Sex and Age in Westminster
The most populous age groups in Westminster are 15 to 19 Years (964 | 9.8%) for men and 20 to 24 Years (1,055 | 10.3%) for women.
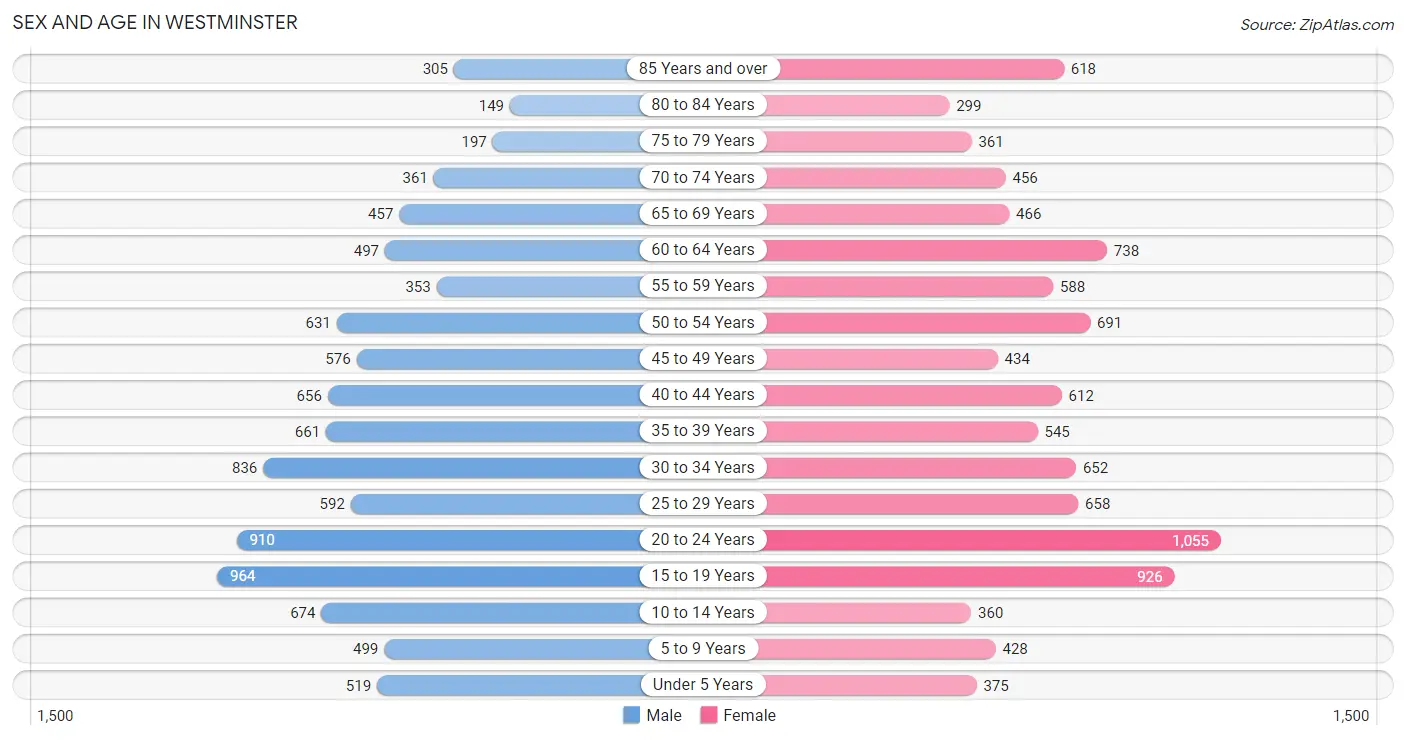
| Age Bracket | Male | Female |
| Under 5 Years | 519 (5.3%) | 375 (3.6%) |
| 5 to 9 Years | 499 (5.1%) | 428 (4.2%) |
| 10 to 14 Years | 674 (6.9%) | 360 (3.5%) |
| 15 to 19 Years | 964 (9.8%) | 926 (9.0%) |
| 20 to 24 Years | 910 (9.2%) | 1,055 (10.3%) |
| 25 to 29 Years | 592 (6.0%) | 658 (6.4%) |
| 30 to 34 Years | 836 (8.5%) | 652 (6.4%) |
| 35 to 39 Years | 661 (6.7%) | 545 (5.3%) |
| 40 to 44 Years | 656 (6.7%) | 612 (6.0%) |
| 45 to 49 Years | 576 (5.9%) | 434 (4.2%) |
| 50 to 54 Years | 631 (6.4%) | 691 (6.7%) |
| 55 to 59 Years | 353 (3.6%) | 588 (5.7%) |
| 60 to 64 Years | 497 (5.1%) | 738 (7.2%) |
| 65 to 69 Years | 457 (4.6%) | 466 (4.5%) |
| 70 to 74 Years | 361 (3.7%) | 456 (4.4%) |
| 75 to 79 Years | 197 (2.0%) | 361 (3.5%) |
| 80 to 84 Years | 149 (1.5%) | 299 (2.9%) |
| 85 Years and over | 305 (3.1%) | 618 (6.0%) |
| Total | 9,837 (100.0%) | 10,262 (100.0%) |
Families and Households in Westminster
Median Family Size in Westminster
The median family size in Westminster is 2.89 persons per family, with married-couple families (3,638 | 75.0%) accounting for the largest median family size of 2.97 persons per family. On the other hand, single male/father families (373 | 7.7%) represent the smallest median family size with 2.38 persons per family.
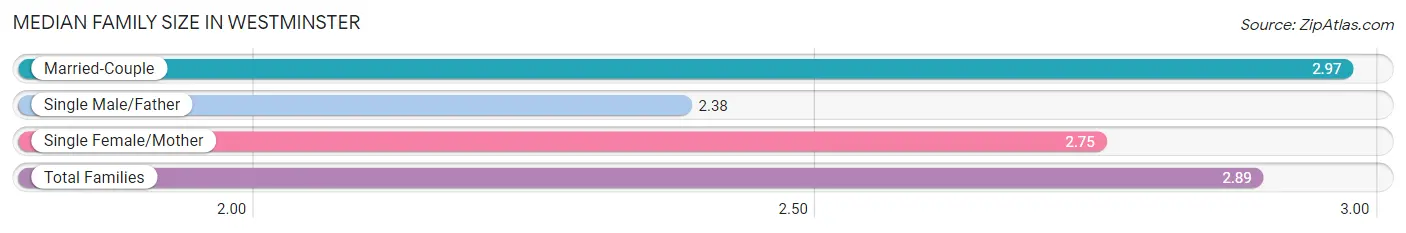
| Family Type | # Families | Family Size |
| Married-Couple | 3,638 (75.0%) | 2.97 |
| Single Male/Father | 373 (7.7%) | 2.38 |
| Single Female/Mother | 837 (17.3%) | 2.75 |
| Total Families | 4,848 (100.0%) | 2.89 |
Median Household Size in Westminster
The median household size in Westminster is 2.28 persons per household, with married-couple households (3,638 | 45.4%) accounting for the largest median household size of 2.99 persons per household. non-family households (3,160 | 39.5%) represent the smallest median household size with 1.20 persons per household.
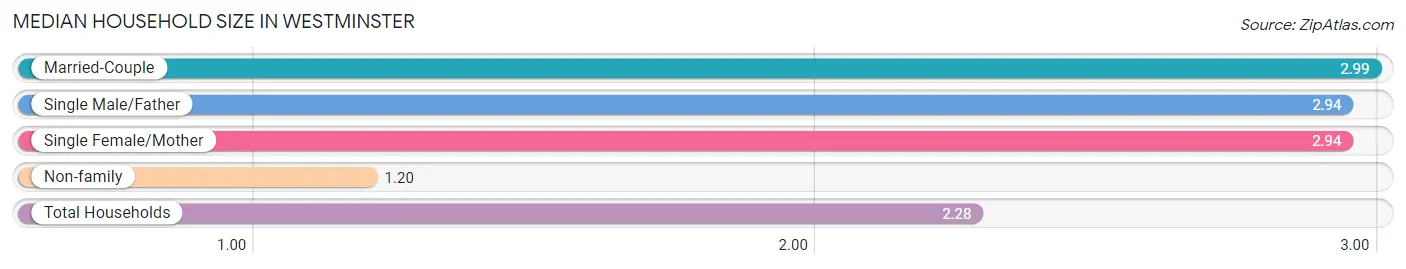
| Household Type | # Households | Household Size |
| Married-Couple | 3,638 (45.4%) | 2.99 |
| Single Male/Father | 373 (4.7%) | 2.94 |
| Single Female/Mother | 837 (10.4%) | 2.94 |
| Non-family | 3,160 (39.5%) | 1.20 |
| Total Households | 8,008 (100.0%) | 2.28 |
Household Size by Marriage Status in Westminster
Out of a total of 8,008 households in Westminster, 4,848 (60.5%) are family households, while 3,160 (39.5%) are nonfamily households. The most numerous type of family households are 2-person households, comprising 2,232, and the most common type of nonfamily households are 1-person households, comprising 2,668.
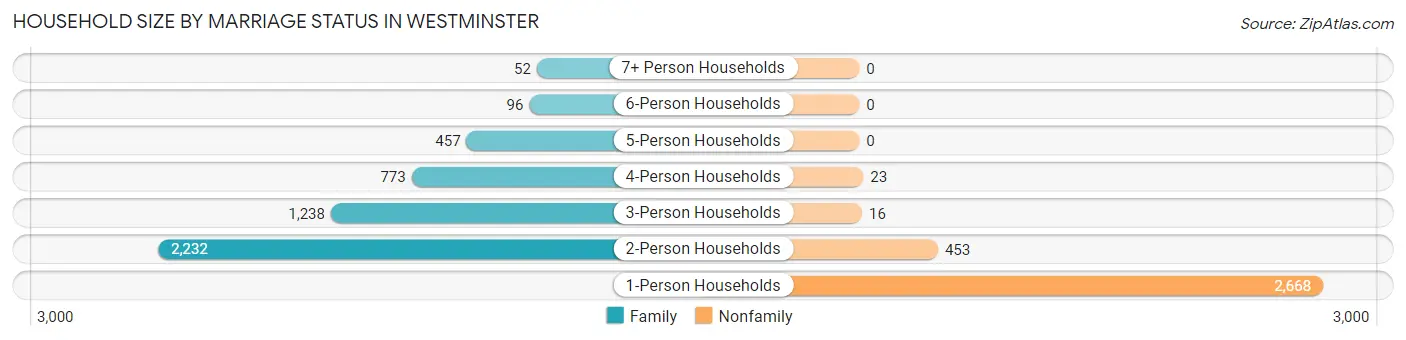
| Household Size | Family Households | Nonfamily Households |
| 1-Person Households | - | 2,668 (33.3%) |
| 2-Person Households | 2,232 (27.9%) | 453 (5.7%) |
| 3-Person Households | 1,238 (15.5%) | 16 (0.2%) |
| 4-Person Households | 773 (9.7%) | 23 (0.3%) |
| 5-Person Households | 457 (5.7%) | 0 (0.0%) |
| 6-Person Households | 96 (1.2%) | 0 (0.0%) |
| 7+ Person Households | 52 (0.6%) | 0 (0.0%) |
| Total | 4,848 (60.5%) | 3,160 (39.5%) |
Female Fertility in Westminster
Fertility by Age in Westminster
Average fertility rate in Westminster is 56.0 births per 1,000 women. Women in the age bracket of 20 to 34 years have the highest fertility rate with 84.0 births per 1,000 women. Women in the age bracket of 20 to 34 years acount for 70.5% of all women with births.
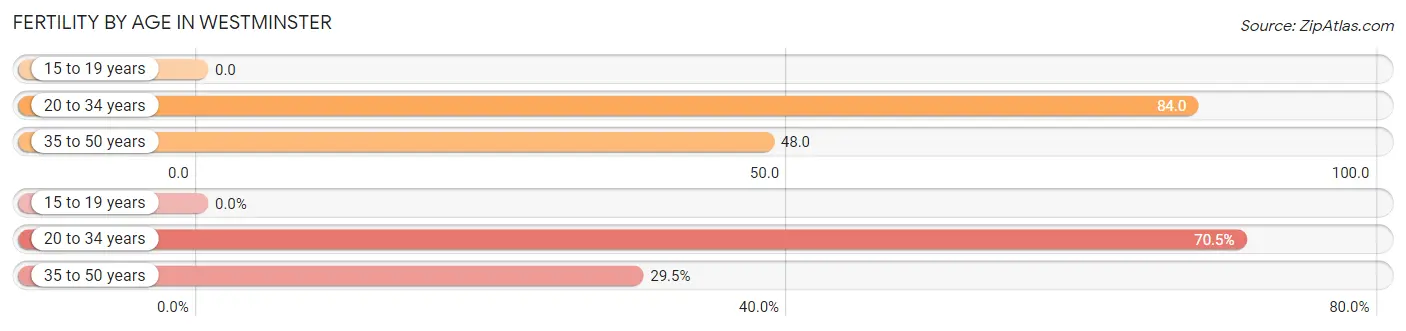
| Age Bracket | Women with Births | Births / 1,000 Women |
| 15 to 19 years | 0 (0.0%) | 0.0 |
| 20 to 34 years | 198 (70.5%) | 84.0 |
| 35 to 50 years | 83 (29.5%) | 48.0 |
| Total | 281 (100.0%) | 56.0 |
Fertility by Age by Marriage Status in Westminster
62.6% of women with births (281) in Westminster are married. The highest percentage of unmarried women with births falls into 20 to 34 years age bracket with 53.0% of them unmarried at the time of birth, while the lowest percentage of unmarried women with births belong to 35 to 50 years age bracket with 0.0% of them unmarried.
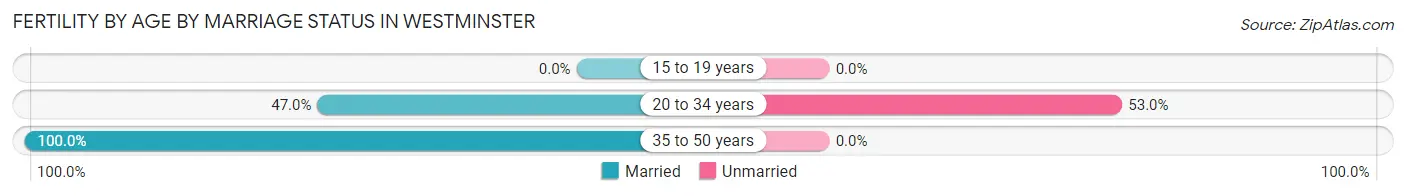
| Age Bracket | Married | Unmarried |
| 15 to 19 years | 0 (0.0%) | 0 (0.0%) |
| 20 to 34 years | 93 (47.0%) | 105 (53.0%) |
| 35 to 50 years | 83 (100.0%) | 0 (0.0%) |
| Total | 176 (62.6%) | 105 (37.4%) |
Fertility by Education in Westminster
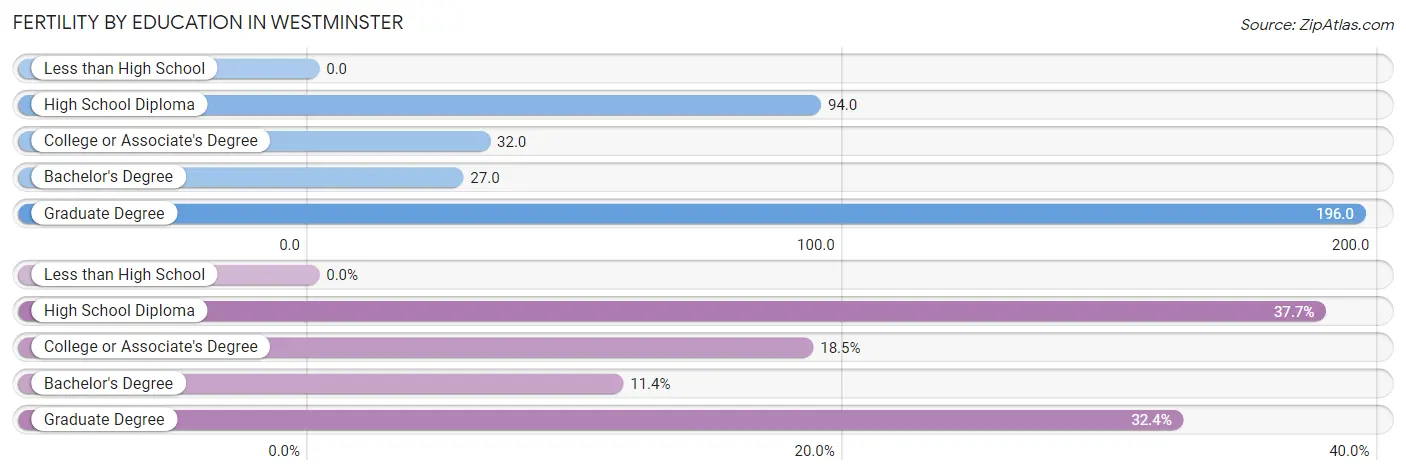
| Educational Attainment | Women with Births | Births / 1,000 Women |
| Less than High School | 0 (0.0%) | 0.0 |
| High School Diploma | 106 (37.7%) | 94.0 |
| College or Associate's Degree | 52 (18.5%) | 32.0 |
| Bachelor's Degree | 32 (11.4%) | 27.0 |
| Graduate Degree | 91 (32.4%) | 196.0 |
| Total | 281 (100.0%) | 56.0 |
Fertility by Education by Marriage Status in Westminster
37.4% of women with births in Westminster are unmarried. Women with the educational attainment of bachelor's degree are most likely to be married with 100.0% of them married at childbirth, while women with the educational attainment of college or associate's degree are least likely to be married with 73.1% of them unmarried at childbirth.
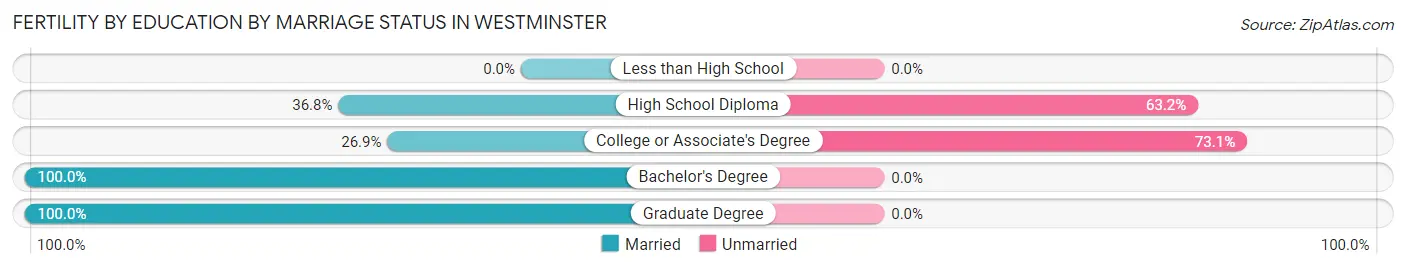
| Educational Attainment | Married | Unmarried |
| Less than High School | 0 (0.0%) | 0 (0.0%) |
| High School Diploma | 39 (36.8%) | 67 (63.2%) |
| College or Associate's Degree | 14 (26.9%) | 38 (73.1%) |
| Bachelor's Degree | 32 (100.0%) | 0 (0.0%) |
| Graduate Degree | 91 (100.0%) | 0 (0.0%) |
| Total | 176 (62.6%) | 105 (37.4%) |
Employment Characteristics in Westminster
Employment by Class of Employer in Westminster
Among the 9,751 employed individuals in Westminster, private company employees (5,988 | 61.4%), local government employees (1,207 | 12.4%), and not-for-profit organizations (989 | 10.1%) make up the most common classes of employment.
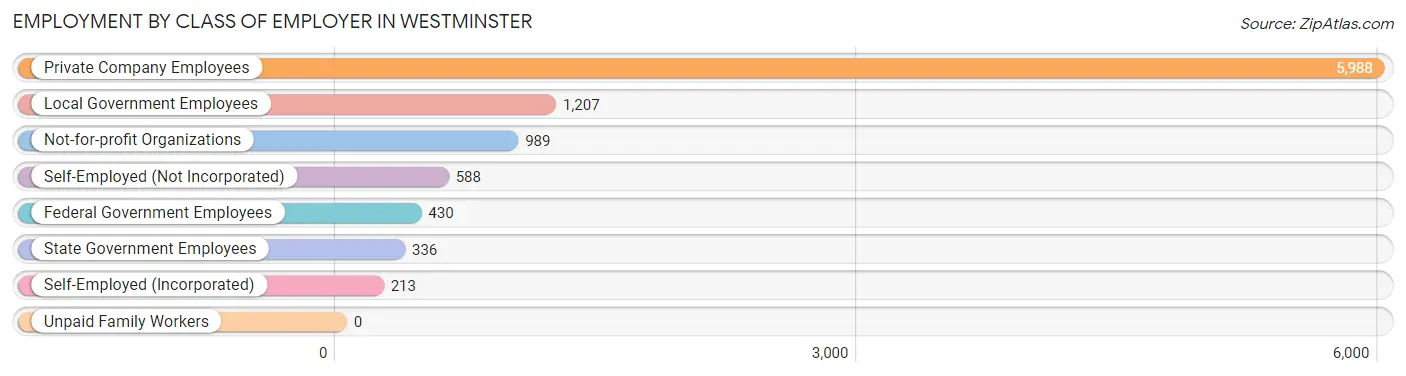
| Employer Class | # Employees | % Employees |
| Private Company Employees | 5,988 | 61.4% |
| Self-Employed (Incorporated) | 213 | 2.2% |
| Self-Employed (Not Incorporated) | 588 | 6.0% |
| Not-for-profit Organizations | 989 | 10.1% |
| Local Government Employees | 1,207 | 12.4% |
| State Government Employees | 336 | 3.5% |
| Federal Government Employees | 430 | 4.4% |
| Unpaid Family Workers | 0 | 0.0% |
| Total | 9,751 | 100.0% |
Employment Status by Age in Westminster
According to the labor force statistics for Westminster, out of the total population over 16 years of age (17,012), 61.2% or 10,411 individuals are in the labor force, with 4.4% or 458 of them unemployed. The age group with the highest labor force participation rate is 25 to 29 years, with 89.1% or 1,114 individuals in the labor force. Within the labor force, the 65 to 74 years age range has the highest percentage of unemployed individuals, with 9.7% or 45 of them being unemployed.
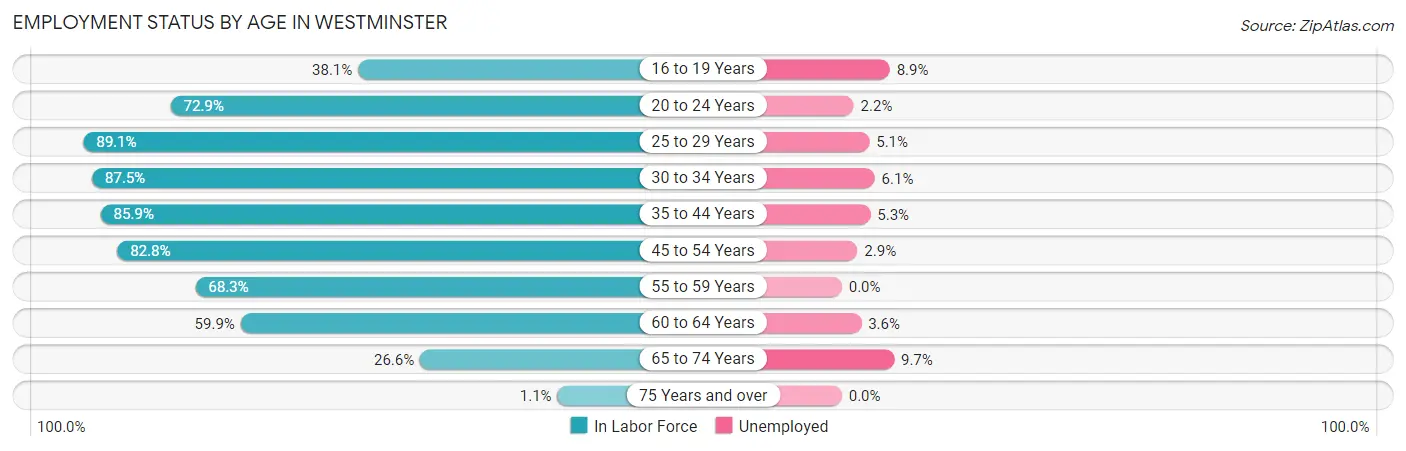
| Age Bracket | In Labor Force | Unemployed |
| 16 to 19 Years | 632 (38.1%) | 56 (8.9%) |
| 20 to 24 Years | 1,432 (72.9%) | 32 (2.2%) |
| 25 to 29 Years | 1,114 (89.1%) | 57 (5.1%) |
| 30 to 34 Years | 1,302 (87.5%) | 79 (6.1%) |
| 35 to 44 Years | 2,125 (85.9%) | 113 (5.3%) |
| 45 to 54 Years | 1,931 (82.8%) | 56 (2.9%) |
| 55 to 59 Years | 643 (68.3%) | 0 (0.0%) |
| 60 to 64 Years | 740 (59.9%) | 27 (3.6%) |
| 65 to 74 Years | 463 (26.6%) | 45 (9.7%) |
| 75 Years and over | 21 (1.1%) | 0 (0.0%) |
| Total | 10,411 (61.2%) | 458 (4.4%) |
Employment Status by Educational Attainment in Westminster
According to labor force statistics for Westminster, 80.8% of individuals (7,854) out of the total population between 25 and 64 years of age (9,720) are in the labor force, with 4.2% or 330 of them being unemployed. The group with the highest labor force participation rate are those with the educational attainment of bachelor's degree or higher, with 87.1% or 3,227 individuals in the labor force. Within the labor force, individuals with less than high school education have the highest percentage of unemployment, with 21.9% or 120 of them being unemployed.
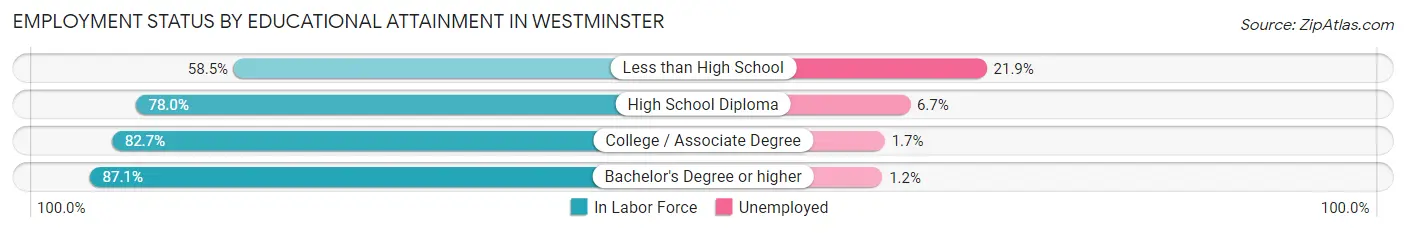
| Educational Attainment | In Labor Force | Unemployed |
| Less than High School | 547 (58.5%) | 205 (21.9%) |
| High School Diploma | 1,993 (78.0%) | 171 (6.7%) |
| College / Associate Degree | 2,088 (82.7%) | 43 (1.7%) |
| Bachelor's Degree or higher | 3,227 (87.1%) | 44 (1.2%) |
| Total | 7,854 (80.8%) | 408 (4.2%) |
Employment Occupations by Sex in Westminster
Management, Business, Science and Arts Occupations
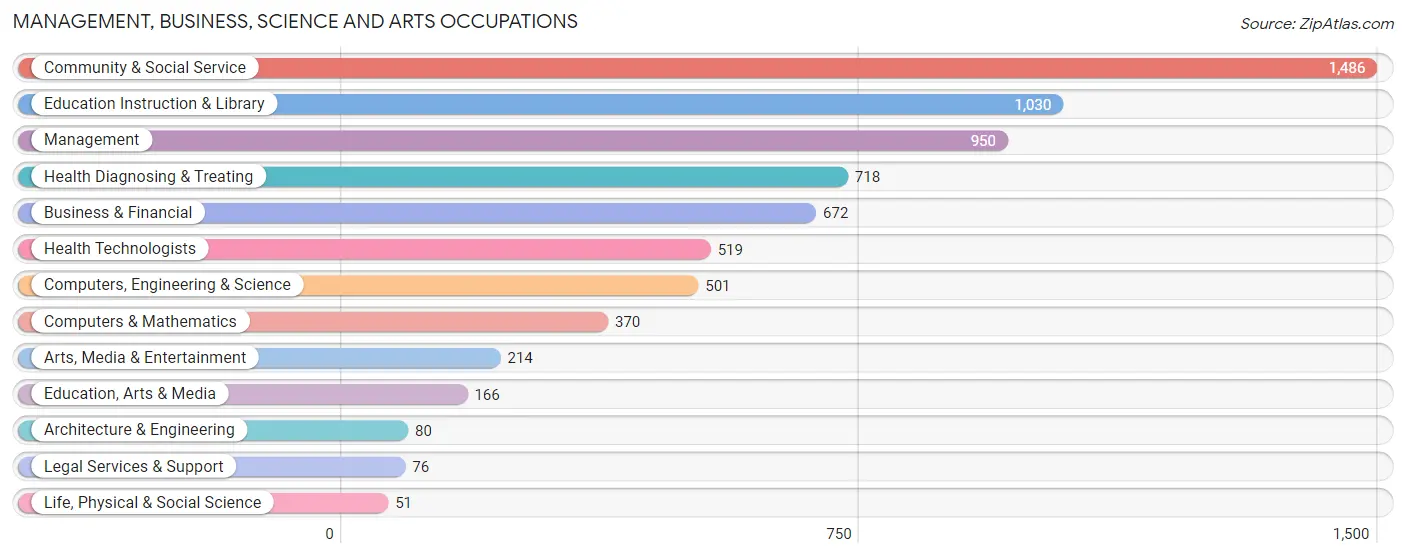
The most common Management, Business, Science and Arts occupations in Westminster are Community & Social Service (1,486 | 15.0%), Education Instruction & Library (1,030 | 10.4%), Management (950 | 9.6%), Health Diagnosing & Treating (718 | 7.3%), and Business & Financial (672 | 6.8%).
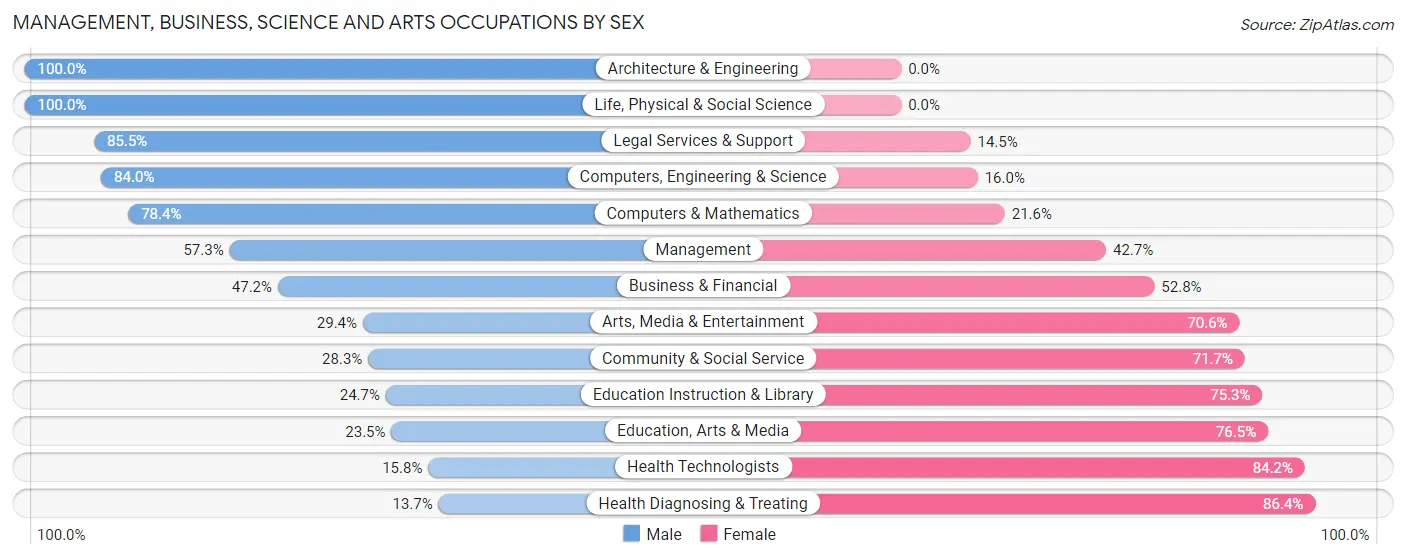
Management, Business, Science and Arts Occupations by Sex
Within the Management, Business, Science and Arts occupations in Westminster, the most male-oriented occupations are Architecture & Engineering (100.0%), Life, Physical & Social Science (100.0%), and Legal Services & Support (85.5%), while the most female-oriented occupations are Health Diagnosing & Treating (86.4%), Health Technologists (84.2%), and Education, Arts & Media (76.5%).
| Occupation | Male | Female |
| Management | 544 (57.3%) | 406 (42.7%) |
| Business & Financial | 317 (47.2%) | 355 (52.8%) |
| Computers, Engineering & Science | 421 (84.0%) | 80 (16.0%) |
| Computers & Mathematics | 290 (78.4%) | 80 (21.6%) |
| Architecture & Engineering | 80 (100.0%) | 0 (0.0%) |
| Life, Physical & Social Science | 51 (100.0%) | 0 (0.0%) |
| Community & Social Service | 421 (28.3%) | 1,065 (71.7%) |
| Education, Arts & Media | 39 (23.5%) | 127 (76.5%) |
| Legal Services & Support | 65 (85.5%) | 11 (14.5%) |
| Education Instruction & Library | 254 (24.7%) | 776 (75.3%) |
| Arts, Media & Entertainment | 63 (29.4%) | 151 (70.6%) |
| Health Diagnosing & Treating | 98 (13.7%) | 620 (86.4%) |
| Health Technologists | 82 (15.8%) | 437 (84.2%) |
| Total (Category) | 1,801 (41.6%) | 2,526 (58.4%) |
| Total (Overall) | 5,071 (51.4%) | 4,802 (48.6%) |
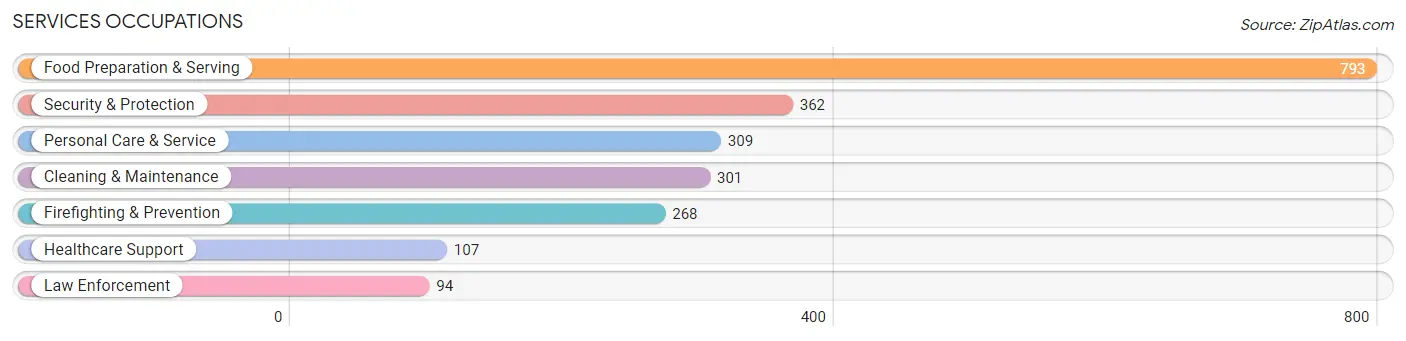
Services Occupations
The most common Services occupations in Westminster are Food Preparation & Serving (793 | 8.0%), Security & Protection (362 | 3.7%), Personal Care & Service (309 | 3.1%), Cleaning & Maintenance (301 | 3.0%), and Firefighting & Prevention (268 | 2.7%).
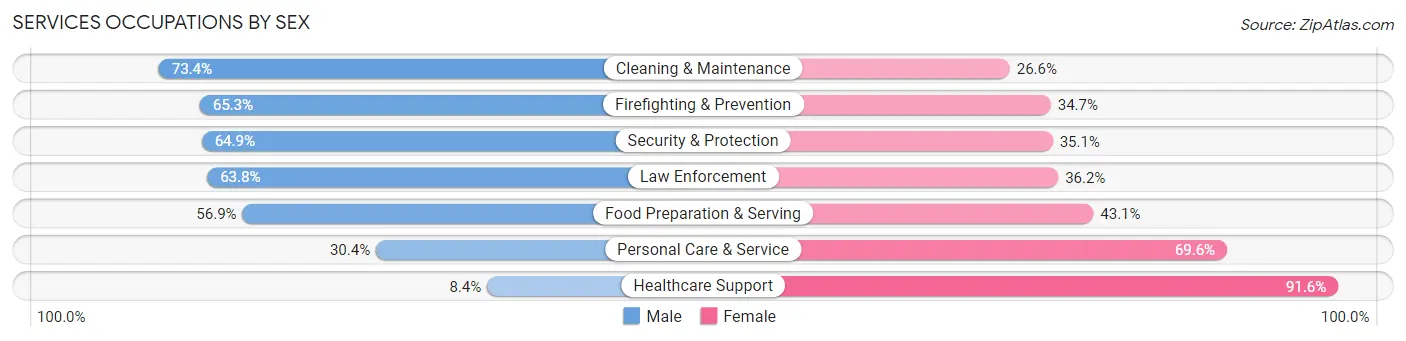
Services Occupations by Sex
Within the Services occupations in Westminster, the most male-oriented occupations are Cleaning & Maintenance (73.4%), Firefighting & Prevention (65.3%), and Security & Protection (64.9%), while the most female-oriented occupations are Healthcare Support (91.6%), Personal Care & Service (69.6%), and Food Preparation & Serving (43.1%).
| Occupation | Male | Female |
| Healthcare Support | 9 (8.4%) | 98 (91.6%) |
| Security & Protection | 235 (64.9%) | 127 (35.1%) |
| Firefighting & Prevention | 175 (65.3%) | 93 (34.7%) |
| Law Enforcement | 60 (63.8%) | 34 (36.2%) |
| Food Preparation & Serving | 451 (56.9%) | 342 (43.1%) |
| Cleaning & Maintenance | 221 (73.4%) | 80 (26.6%) |
| Personal Care & Service | 94 (30.4%) | 215 (69.6%) |
| Total (Category) | 1,010 (53.9%) | 862 (46.1%) |
| Total (Overall) | 5,071 (51.4%) | 4,802 (48.6%) |
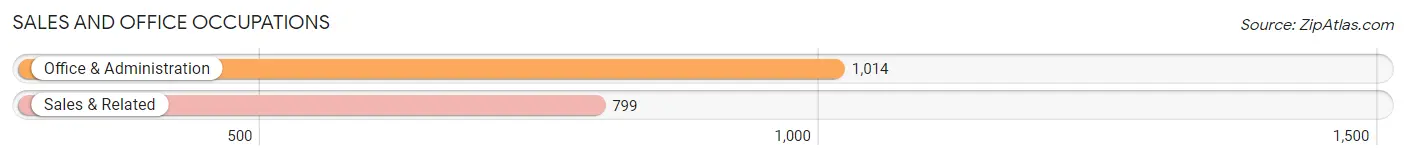
Sales and Office Occupations
The most common Sales and Office occupations in Westminster are Office & Administration (1,014 | 10.3%), and Sales & Related (799 | 8.1%).
Sales and Office Occupations by Sex
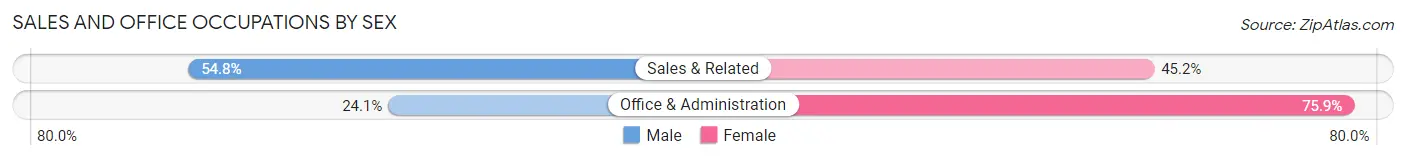
| Occupation | Male | Female |
| Sales & Related | 438 (54.8%) | 361 (45.2%) |
| Office & Administration | 244 (24.1%) | 770 (75.9%) |
| Total (Category) | 682 (37.6%) | 1,131 (62.4%) |
| Total (Overall) | 5,071 (51.4%) | 4,802 (48.6%) |
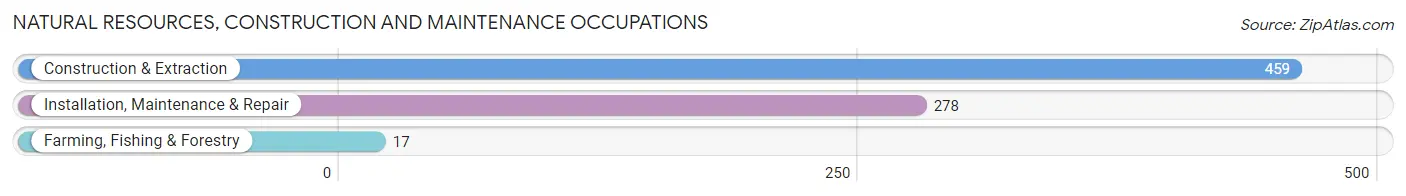
Natural Resources, Construction and Maintenance Occupations
The most common Natural Resources, Construction and Maintenance occupations in Westminster are Construction & Extraction (459 | 4.6%), Installation, Maintenance & Repair (278 | 2.8%), and Farming, Fishing & Forestry (17 | 0.2%).
Natural Resources, Construction and Maintenance Occupations by Sex
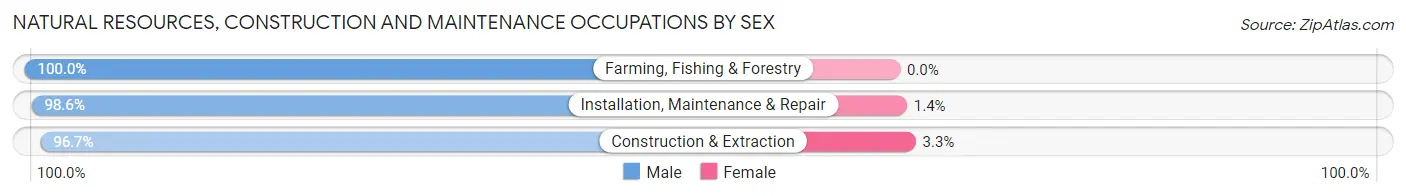
| Occupation | Male | Female |
| Farming, Fishing & Forestry | 17 (100.0%) | 0 (0.0%) |
| Construction & Extraction | 444 (96.7%) | 15 (3.3%) |
| Installation, Maintenance & Repair | 274 (98.6%) | 4 (1.4%) |
| Total (Category) | 735 (97.5%) | 19 (2.5%) |
| Total (Overall) | 5,071 (51.4%) | 4,802 (48.6%) |
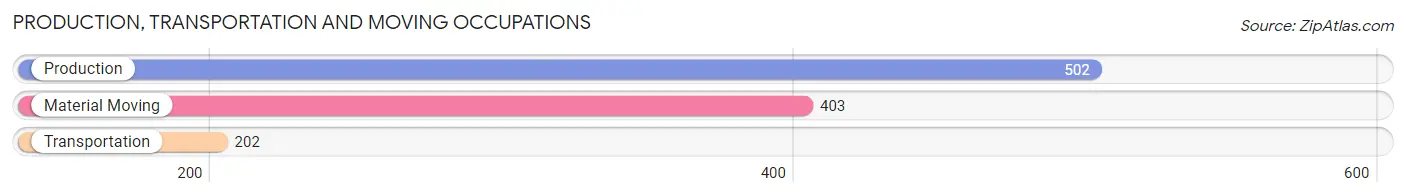
Production, Transportation and Moving Occupations
The most common Production, Transportation and Moving occupations in Westminster are Production (502 | 5.1%), Material Moving (403 | 4.1%), and Transportation (202 | 2.1%).
Production, Transportation and Moving Occupations by Sex
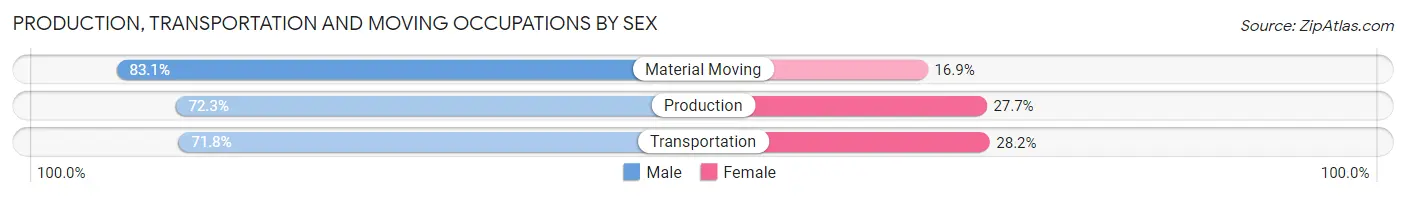
| Occupation | Male | Female |
| Production | 363 (72.3%) | 139 (27.7%) |
| Transportation | 145 (71.8%) | 57 (28.2%) |
| Material Moving | 335 (83.1%) | 68 (16.9%) |
| Total (Category) | 843 (76.1%) | 264 (23.8%) |
| Total (Overall) | 5,071 (51.4%) | 4,802 (48.6%) |
Employment Industries by Sex in Westminster
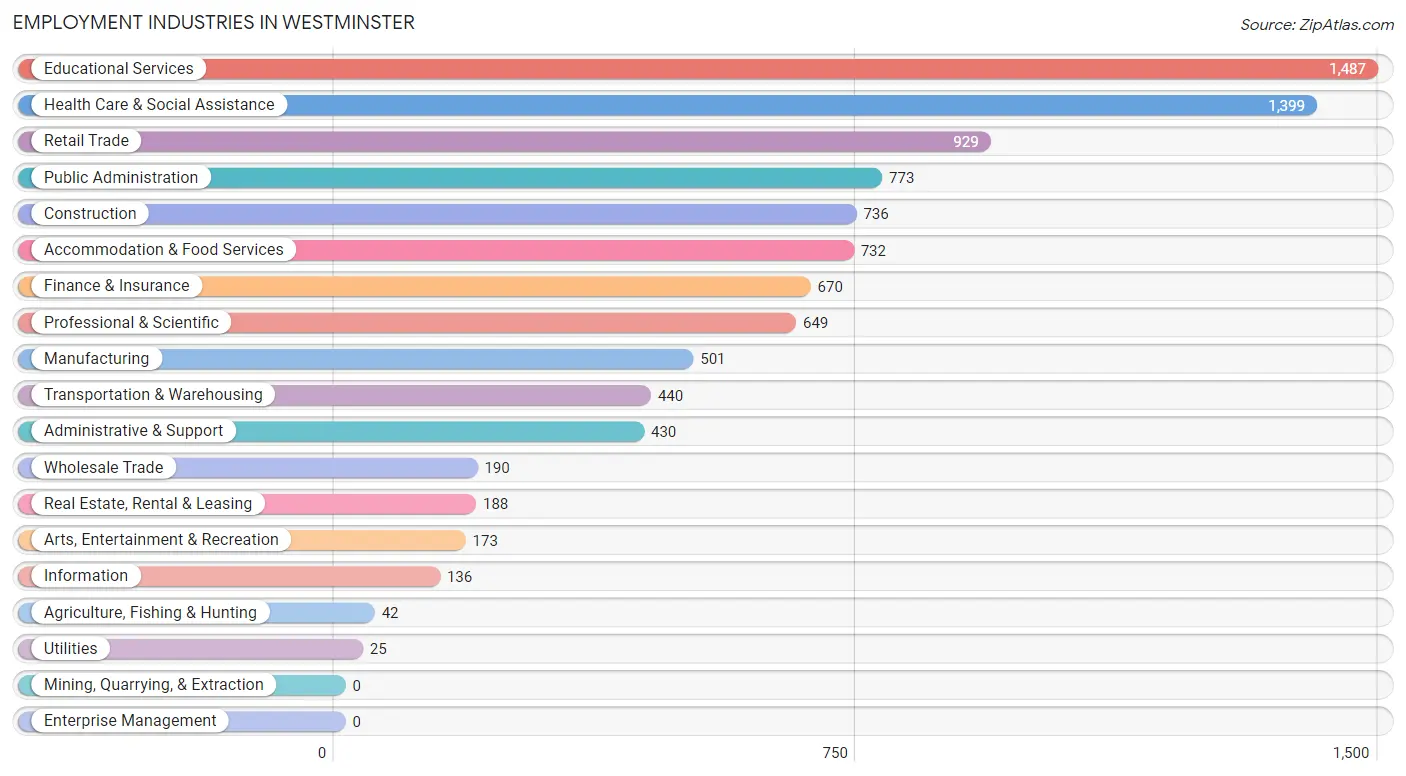
Employment Industries in Westminster
The major employment industries in Westminster include Educational Services (1,487 | 15.1%), Health Care & Social Assistance (1,399 | 14.2%), Retail Trade (929 | 9.4%), Public Administration (773 | 7.8%), and Construction (736 | 7.4%).
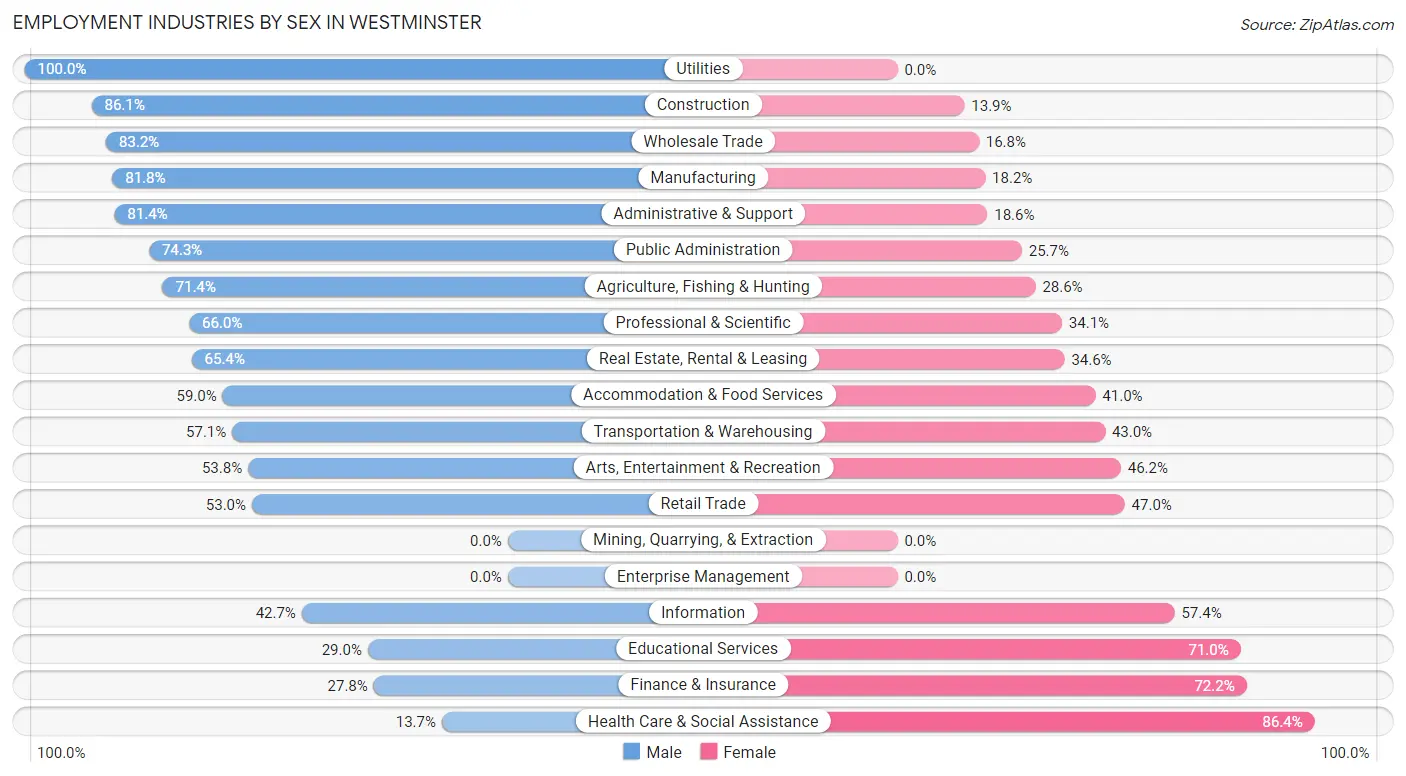
Employment Industries by Sex in Westminster
The Westminster industries that see more men than women are Utilities (100.0%), Construction (86.1%), and Wholesale Trade (83.2%), whereas the industries that tend to have a higher number of women are Health Care & Social Assistance (86.4%), Finance & Insurance (72.2%), and Educational Services (71.0%).
| Industry | Male | Female |
| Agriculture, Fishing & Hunting | 30 (71.4%) | 12 (28.6%) |
| Mining, Quarrying, & Extraction | 0 (0.0%) | 0 (0.0%) |
| Construction | 634 (86.1%) | 102 (13.9%) |
| Manufacturing | 410 (81.8%) | 91 (18.2%) |
| Wholesale Trade | 158 (83.2%) | 32 (16.8%) |
| Retail Trade | 492 (53.0%) | 437 (47.0%) |
| Transportation & Warehousing | 251 (57.1%) | 189 (42.9%) |
| Utilities | 25 (100.0%) | 0 (0.0%) |
| Information | 58 (42.6%) | 78 (57.4%) |
| Finance & Insurance | 186 (27.8%) | 484 (72.2%) |
| Real Estate, Rental & Leasing | 123 (65.4%) | 65 (34.6%) |
| Professional & Scientific | 428 (65.9%) | 221 (34.1%) |
| Enterprise Management | 0 (0.0%) | 0 (0.0%) |
| Administrative & Support | 350 (81.4%) | 80 (18.6%) |
| Educational Services | 431 (29.0%) | 1,056 (71.0%) |
| Health Care & Social Assistance | 191 (13.7%) | 1,208 (86.4%) |
| Arts, Entertainment & Recreation | 93 (53.8%) | 80 (46.2%) |
| Accommodation & Food Services | 432 (59.0%) | 300 (41.0%) |
| Public Administration | 574 (74.3%) | 199 (25.7%) |
| Total | 5,071 (51.4%) | 4,802 (48.6%) |
Education in Westminster
School Enrollment in Westminster
The most common levels of schooling among the 5,475 students in Westminster are college / undergraduate (2,369 | 43.3%), high school (900 | 16.4%), and middle school (815 | 14.9%).
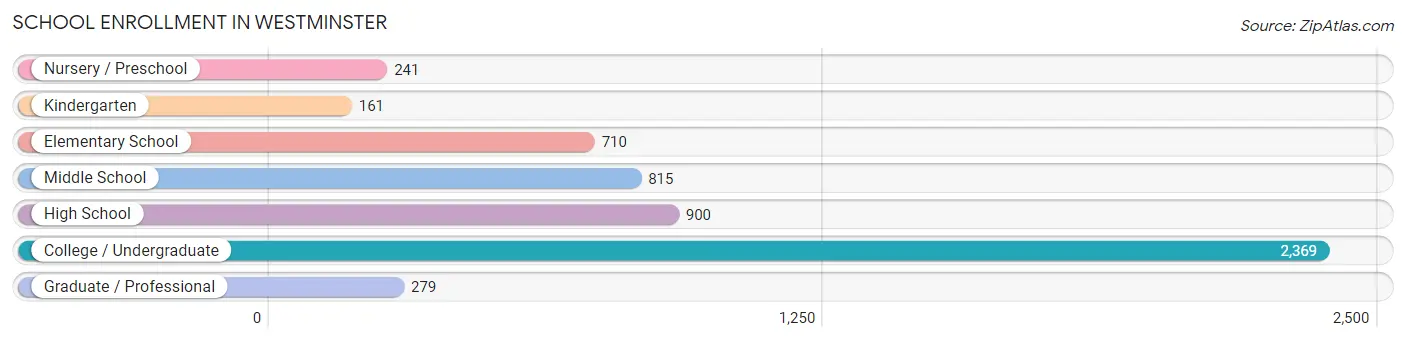
| School Level | # Students | % Students |
| Nursery / Preschool | 241 | 4.4% |
| Kindergarten | 161 | 2.9% |
| Elementary School | 710 | 13.0% |
| Middle School | 815 | 14.9% |
| High School | 900 | 16.4% |
| College / Undergraduate | 2,369 | 43.3% |
| Graduate / Professional | 279 | 5.1% |
| Total | 5,475 | 100.0% |
School Enrollment by Age by Funding Source in Westminster
Out of a total of 5,475 students who are enrolled in schools in Westminster, 1,862 (34.0%) attend a private institution, while the remaining 3,614 (66.0%) are enrolled in public schools. The age group of 20 to 24 year olds has the highest likelihood of being enrolled in private schools, with 674 (57.6% in the age bracket) enrolled. Conversely, the age group of 15 to 17 year olds has the lowest likelihood of being enrolled in a private school, with 567 (95.8% in the age bracket) attending a public institution.
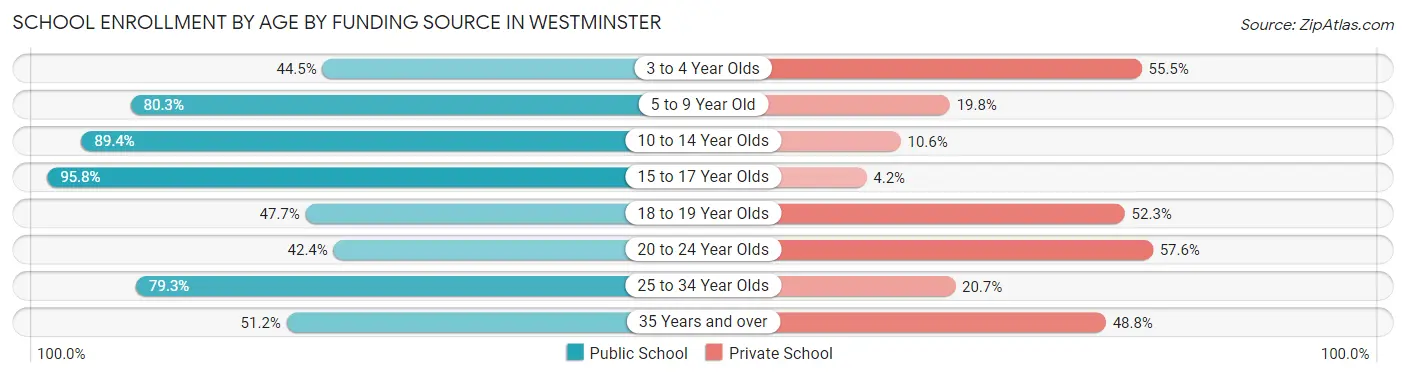
| Age Bracket | Public School | Private School |
| 3 to 4 Year Olds | 85 (44.5%) | 106 (55.5%) |
| 5 to 9 Year Old | 646 (80.2%) | 159 (19.8%) |
| 10 to 14 Year Olds | 912 (89.4%) | 108 (10.6%) |
| 15 to 17 Year Olds | 567 (95.8%) | 25 (4.2%) |
| 18 to 19 Year Olds | 539 (47.7%) | 592 (52.3%) |
| 20 to 24 Year Olds | 497 (42.4%) | 674 (57.6%) |
| 25 to 34 Year Olds | 214 (79.3%) | 56 (20.7%) |
| 35 Years and over | 151 (51.2%) | 144 (48.8%) |
| Total | 3,614 (66.0%) | 1,862 (34.0%) |
Educational Attainment by Field of Study in Westminster
Business (920 | 17.3%), social sciences (727 | 13.7%), education (607 | 11.4%), science & technology (550 | 10.3%), and bio, nature & agricultural (406 | 7.6%) are the most common fields of study among 5,327 individuals in Westminster who have obtained a bachelor's degree or higher.
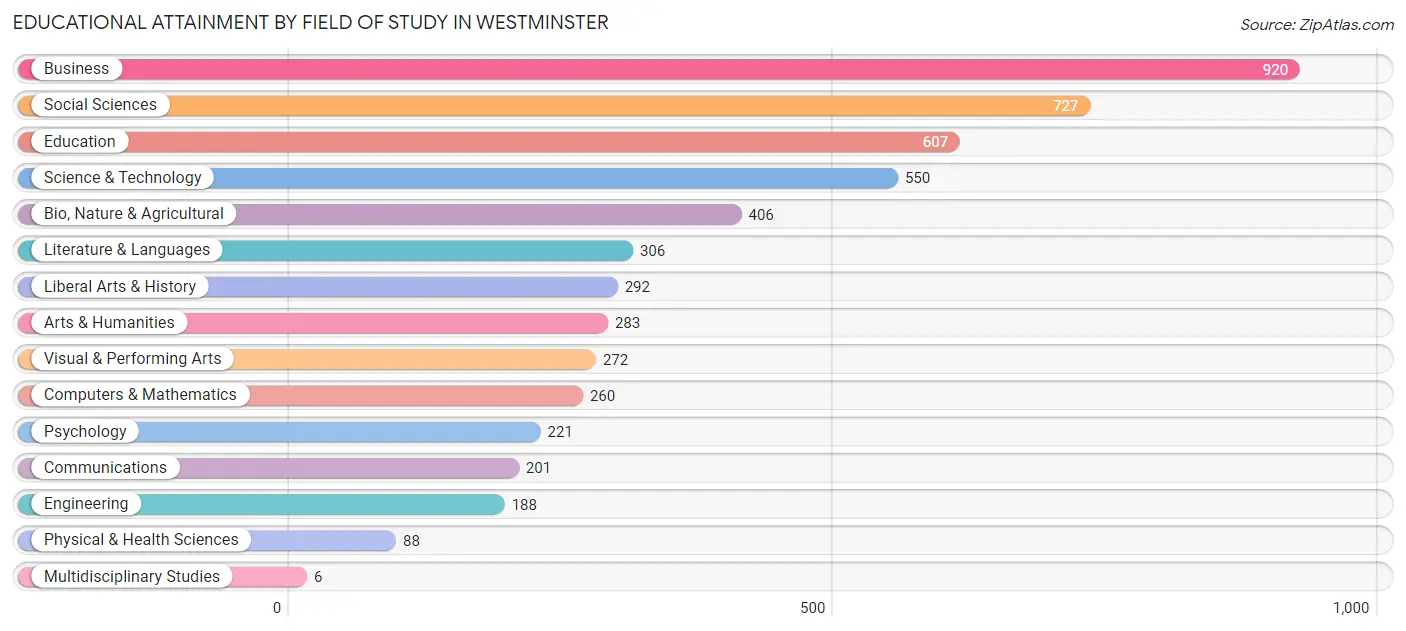
| Field of Study | # Graduates | % Graduates |
| Computers & Mathematics | 260 | 4.9% |
| Bio, Nature & Agricultural | 406 | 7.6% |
| Physical & Health Sciences | 88 | 1.7% |
| Psychology | 221 | 4.2% |
| Social Sciences | 727 | 13.7% |
| Engineering | 188 | 3.5% |
| Multidisciplinary Studies | 6 | 0.1% |
| Science & Technology | 550 | 10.3% |
| Business | 920 | 17.3% |
| Education | 607 | 11.4% |
| Literature & Languages | 306 | 5.7% |
| Liberal Arts & History | 292 | 5.5% |
| Visual & Performing Arts | 272 | 5.1% |
| Communications | 201 | 3.8% |
| Arts & Humanities | 283 | 5.3% |
| Total | 5,327 | 100.0% |
Transportation & Commute in Westminster
Vehicle Availability by Sex in Westminster
The most prevalent vehicle ownership categories in Westminster are males with 2 vehicles (2,422, accounting for 50.5%) and females with 2 vehicles (2,130, making up 56.0%).
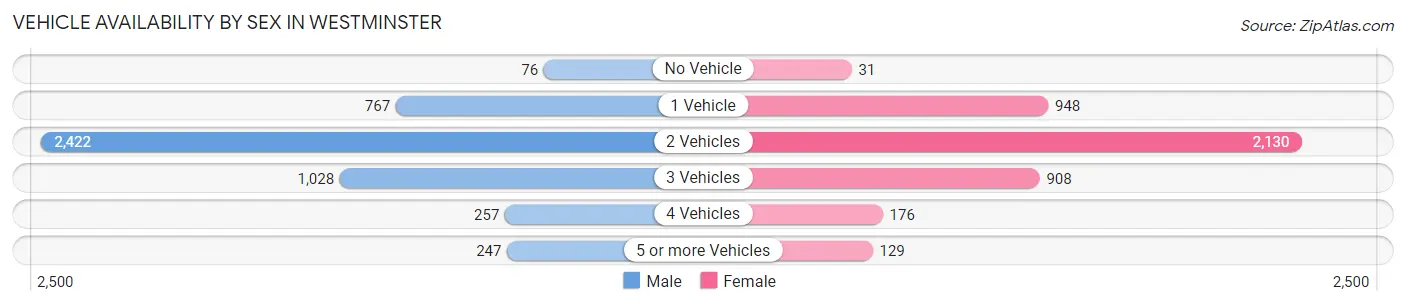
| Vehicles Available | Male | Female |
| No Vehicle | 76 (1.6%) | 31 (0.7%) |
| 1 Vehicle | 767 (16.0%) | 948 (21.9%) |
| 2 Vehicles | 2,422 (50.5%) | 2,130 (49.3%) |
| 3 Vehicles | 1,028 (21.4%) | 908 (21.0%) |
| 4 Vehicles | 257 (5.4%) | 176 (4.1%) |
| 5 or more Vehicles | 247 (5.1%) | 129 (3.0%) |
| Total | 4,797 (100.0%) | 4,322 (100.0%) |
Commute Time in Westminster
The most frequently occuring commute durations in Westminster are 5 to 9 minutes (1,667 commuters, 19.2%), 10 to 14 minutes (1,263 commuters, 14.5%), and 60 to 89 minutes (1,177 commuters, 13.6%).
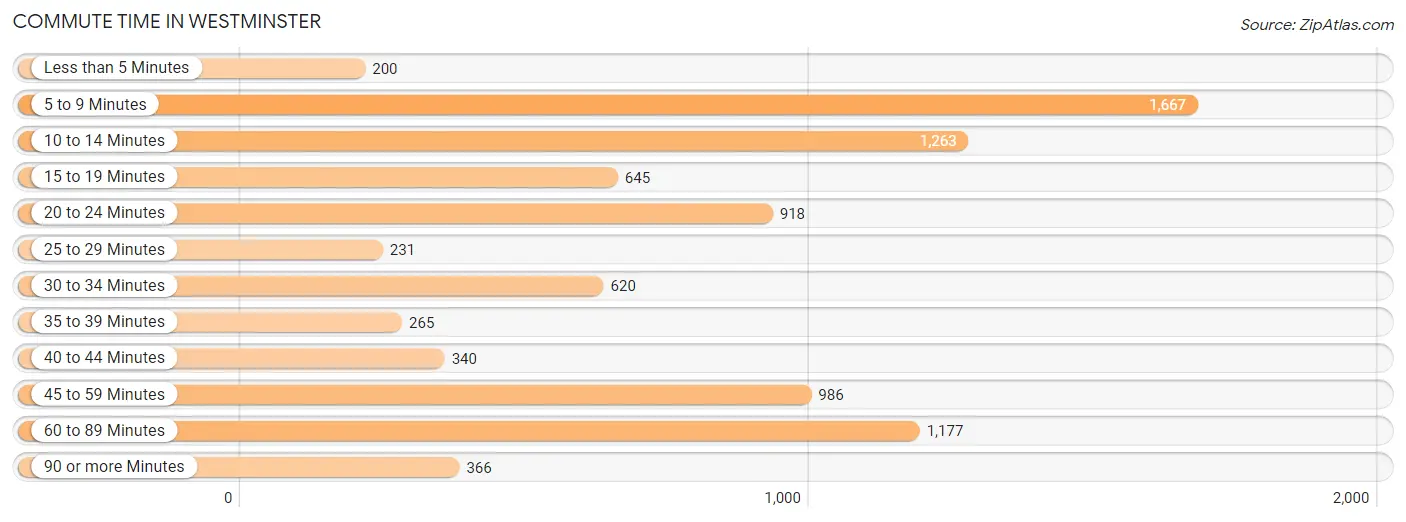
| Commute Time | # Commuters | % Commuters |
| Less than 5 Minutes | 200 | 2.3% |
| 5 to 9 Minutes | 1,667 | 19.2% |
| 10 to 14 Minutes | 1,263 | 14.5% |
| 15 to 19 Minutes | 645 | 7.4% |
| 20 to 24 Minutes | 918 | 10.6% |
| 25 to 29 Minutes | 231 | 2.7% |
| 30 to 34 Minutes | 620 | 7.1% |
| 35 to 39 Minutes | 265 | 3.0% |
| 40 to 44 Minutes | 340 | 3.9% |
| 45 to 59 Minutes | 986 | 11.4% |
| 60 to 89 Minutes | 1,177 | 13.6% |
| 90 or more Minutes | 366 | 4.2% |
Commute Time by Sex in Westminster
The most common commute times in Westminster are 5 to 9 minutes (906 commuters, 19.1%) for males and 10 to 14 minutes (770 commuters, 19.6%) for females.
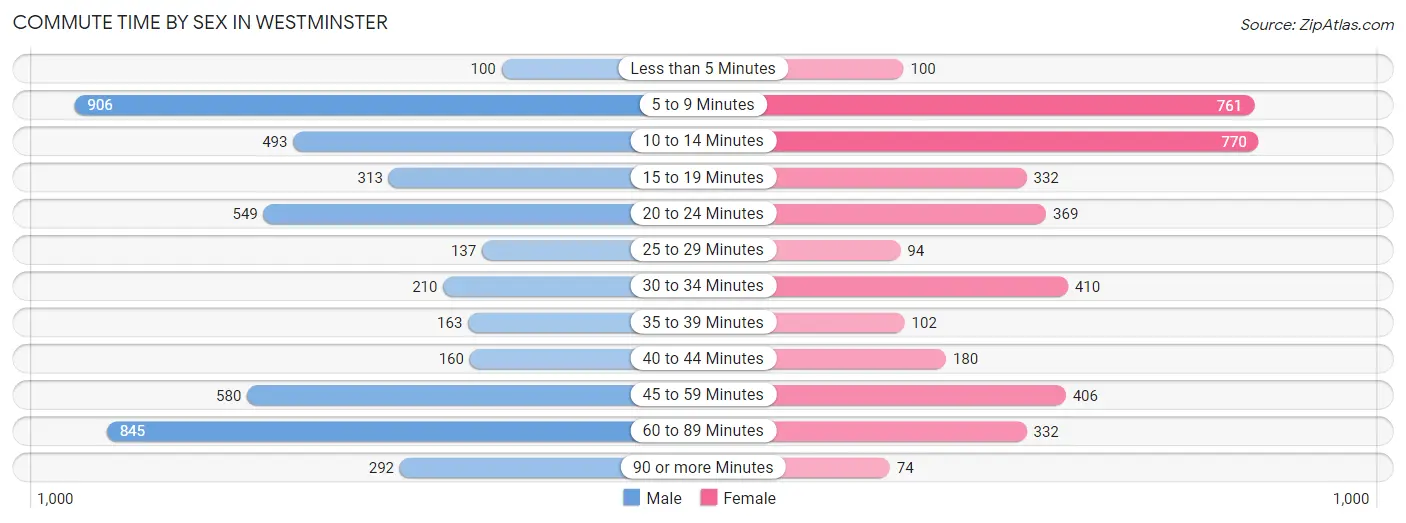
| Commute Time | Male | Female |
| Less than 5 Minutes | 100 (2.1%) | 100 (2.5%) |
| 5 to 9 Minutes | 906 (19.1%) | 761 (19.4%) |
| 10 to 14 Minutes | 493 (10.4%) | 770 (19.6%) |
| 15 to 19 Minutes | 313 (6.6%) | 332 (8.5%) |
| 20 to 24 Minutes | 549 (11.6%) | 369 (9.4%) |
| 25 to 29 Minutes | 137 (2.9%) | 94 (2.4%) |
| 30 to 34 Minutes | 210 (4.4%) | 410 (10.4%) |
| 35 to 39 Minutes | 163 (3.4%) | 102 (2.6%) |
| 40 to 44 Minutes | 160 (3.4%) | 180 (4.6%) |
| 45 to 59 Minutes | 580 (12.2%) | 406 (10.3%) |
| 60 to 89 Minutes | 845 (17.8%) | 332 (8.5%) |
| 90 or more Minutes | 292 (6.1%) | 74 (1.9%) |
Time of Departure to Work by Sex in Westminster
The most frequent times of departure to work in Westminster are 6:30 AM to 6:59 AM (691, 14.5%) for males and 8:00 AM to 8:29 AM (728, 18.5%) for females.
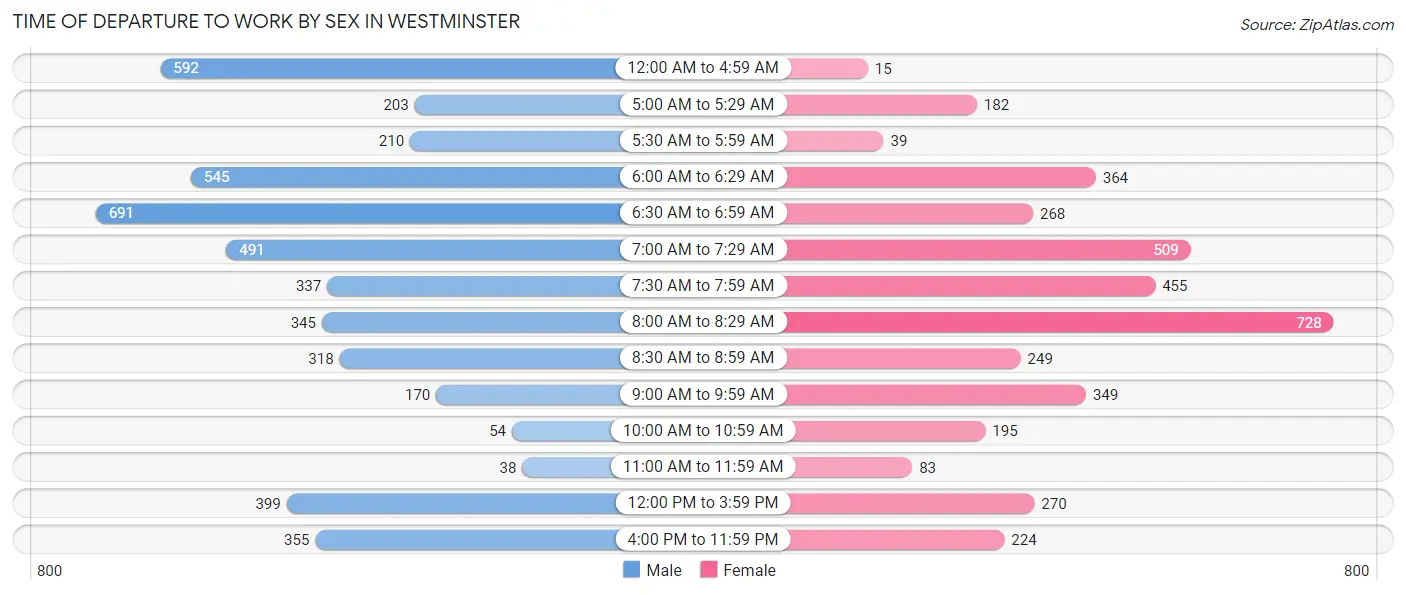
| Time of Departure | Male | Female |
| 12:00 AM to 4:59 AM | 592 (12.5%) | 15 (0.4%) |
| 5:00 AM to 5:29 AM | 203 (4.3%) | 182 (4.6%) |
| 5:30 AM to 5:59 AM | 210 (4.4%) | 39 (1.0%) |
| 6:00 AM to 6:29 AM | 545 (11.5%) | 364 (9.3%) |
| 6:30 AM to 6:59 AM | 691 (14.5%) | 268 (6.8%) |
| 7:00 AM to 7:29 AM | 491 (10.3%) | 509 (13.0%) |
| 7:30 AM to 7:59 AM | 337 (7.1%) | 455 (11.6%) |
| 8:00 AM to 8:29 AM | 345 (7.3%) | 728 (18.5%) |
| 8:30 AM to 8:59 AM | 318 (6.7%) | 249 (6.3%) |
| 9:00 AM to 9:59 AM | 170 (3.6%) | 349 (8.9%) |
| 10:00 AM to 10:59 AM | 54 (1.1%) | 195 (5.0%) |
| 11:00 AM to 11:59 AM | 38 (0.8%) | 83 (2.1%) |
| 12:00 PM to 3:59 PM | 399 (8.4%) | 270 (6.9%) |
| 4:00 PM to 11:59 PM | 355 (7.5%) | 224 (5.7%) |
| Total | 4,748 (100.0%) | 3,930 (100.0%) |
Housing Occupancy in Westminster
Occupancy by Ownership in Westminster
Of the total 8,008 dwellings in Westminster, owner-occupied units account for 4,306 (53.8%), while renter-occupied units make up 3,702 (46.2%).
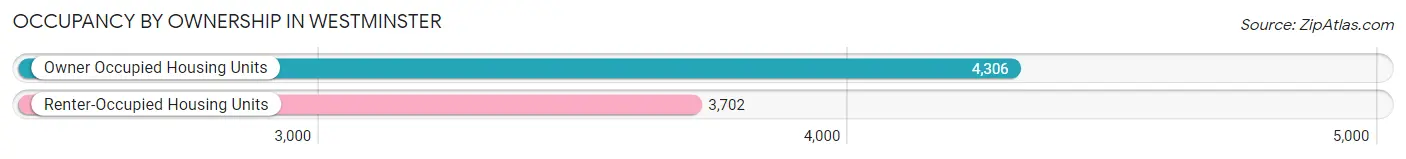
| Occupancy | # Housing Units | % Housing Units |
| Owner Occupied Housing Units | 4,306 | 53.8% |
| Renter-Occupied Housing Units | 3,702 | 46.2% |
| Total Occupied Housing Units | 8,008 | 100.0% |
Occupancy by Household Size in Westminster
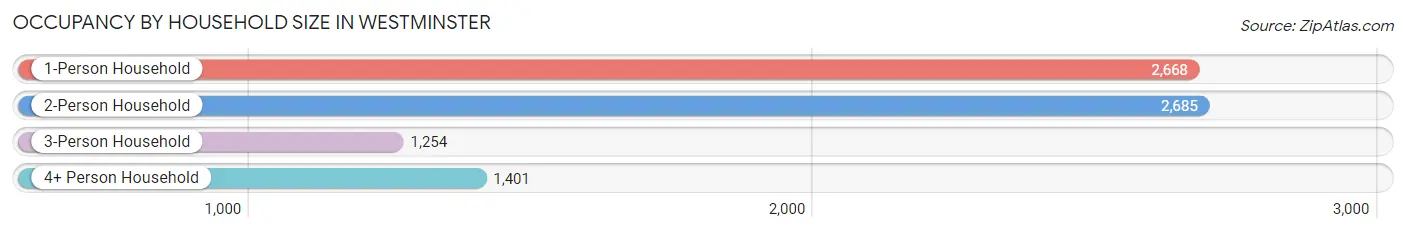
| Household Size | # Housing Units | % Housing Units |
| 1-Person Household | 2,668 | 33.3% |
| 2-Person Household | 2,685 | 33.5% |
| 3-Person Household | 1,254 | 15.7% |
| 4+ Person Household | 1,401 | 17.5% |
| Total Housing Units | 8,008 | 100.0% |
Occupancy by Ownership by Household Size in Westminster
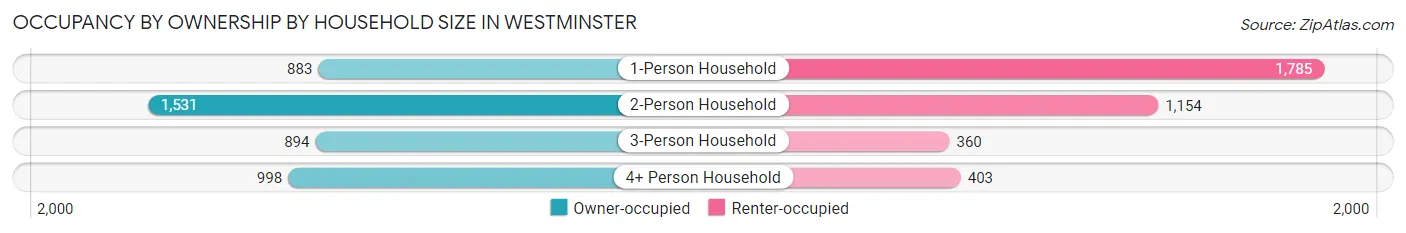
| Household Size | Owner-occupied | Renter-occupied |
| 1-Person Household | 883 (33.1%) | 1,785 (66.9%) |
| 2-Person Household | 1,531 (57.0%) | 1,154 (43.0%) |
| 3-Person Household | 894 (71.3%) | 360 (28.7%) |
| 4+ Person Household | 998 (71.2%) | 403 (28.8%) |
| Total Housing Units | 4,306 (53.8%) | 3,702 (46.2%) |
Occupancy by Educational Attainment in Westminster
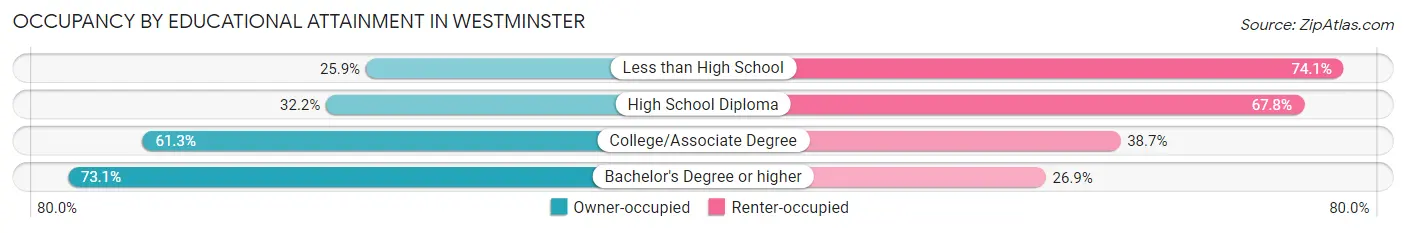
| Household Size | Owner-occupied | Renter-occupied |
| Less than High School | 233 (25.9%) | 668 (74.1%) |
| High School Diploma | 676 (32.2%) | 1,425 (67.8%) |
| College/Associate Degree | 1,368 (61.3%) | 864 (38.7%) |
| Bachelor's Degree or higher | 2,029 (73.1%) | 745 (26.9%) |
Occupancy by Age of Householder in Westminster
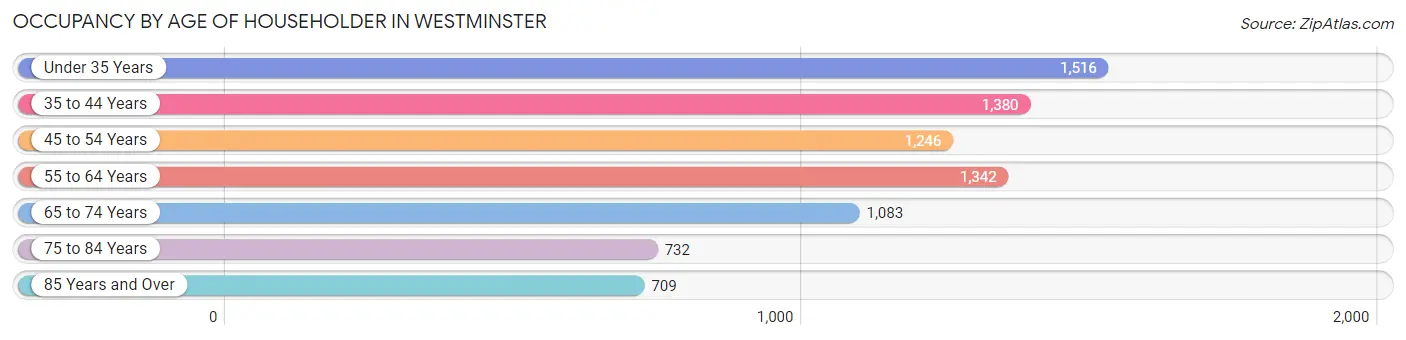
| Age Bracket | # Households | % Households |
| Under 35 Years | 1,516 | 18.9% |
| 35 to 44 Years | 1,380 | 17.2% |
| 45 to 54 Years | 1,246 | 15.6% |
| 55 to 64 Years | 1,342 | 16.8% |
| 65 to 74 Years | 1,083 | 13.5% |
| 75 to 84 Years | 732 | 9.1% |
| 85 Years and Over | 709 | 8.8% |
| Total | 8,008 | 100.0% |
Housing Finances in Westminster
Median Income by Occupancy in Westminster
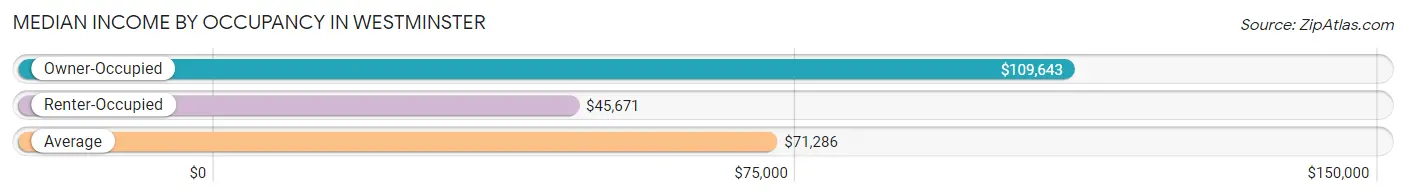
| Occupancy Type | # Households | Median Income |
| Owner-Occupied | 4,306 (53.8%) | $109,643 |
| Renter-Occupied | 3,702 (46.2%) | $45,671 |
| Average | 8,008 (100.0%) | $71,286 |
Occupancy by Householder Income Bracket in Westminster
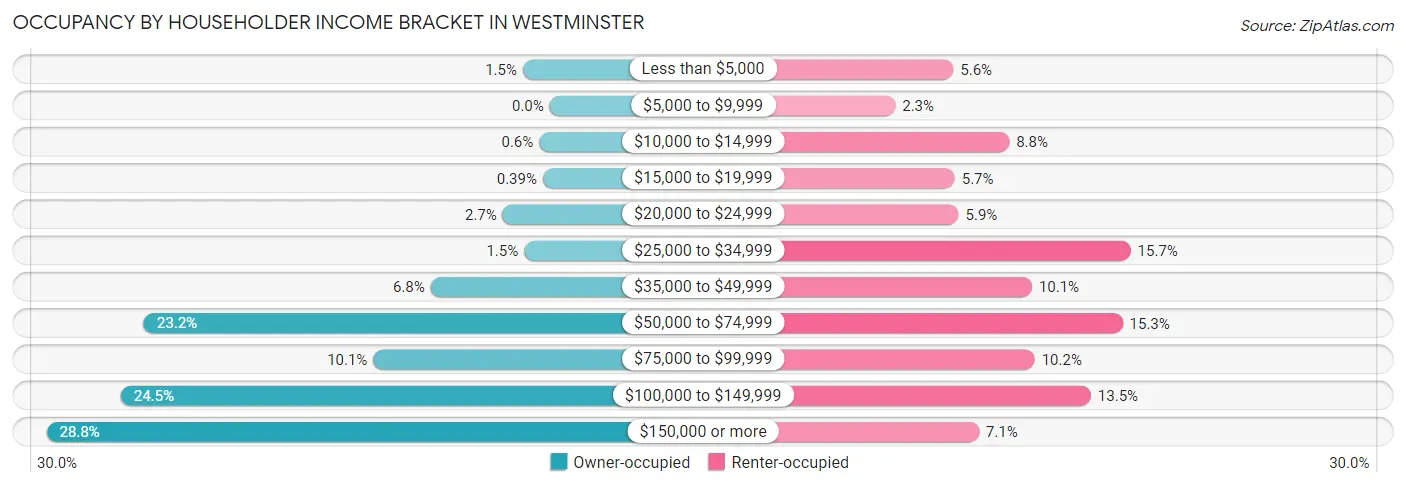
| Income Bracket | Owner-occupied | Renter-occupied |
| Less than $5,000 | 66 (1.5%) | 207 (5.6%) |
| $5,000 to $9,999 | 0 (0.0%) | 84 (2.3%) |
| $10,000 to $14,999 | 26 (0.6%) | 325 (8.8%) |
| $15,000 to $19,999 | 17 (0.4%) | 210 (5.7%) |
| $20,000 to $24,999 | 116 (2.7%) | 218 (5.9%) |
| $25,000 to $34,999 | 63 (1.5%) | 582 (15.7%) |
| $35,000 to $49,999 | 293 (6.8%) | 373 (10.1%) |
| $50,000 to $74,999 | 998 (23.2%) | 565 (15.3%) |
| $75,000 to $99,999 | 434 (10.1%) | 379 (10.2%) |
| $100,000 to $149,999 | 1,055 (24.5%) | 498 (13.5%) |
| $150,000 or more | 1,238 (28.7%) | 261 (7.0%) |
| Total | 4,306 (100.0%) | 3,702 (100.0%) |
Monthly Housing Cost Tiers in Westminster
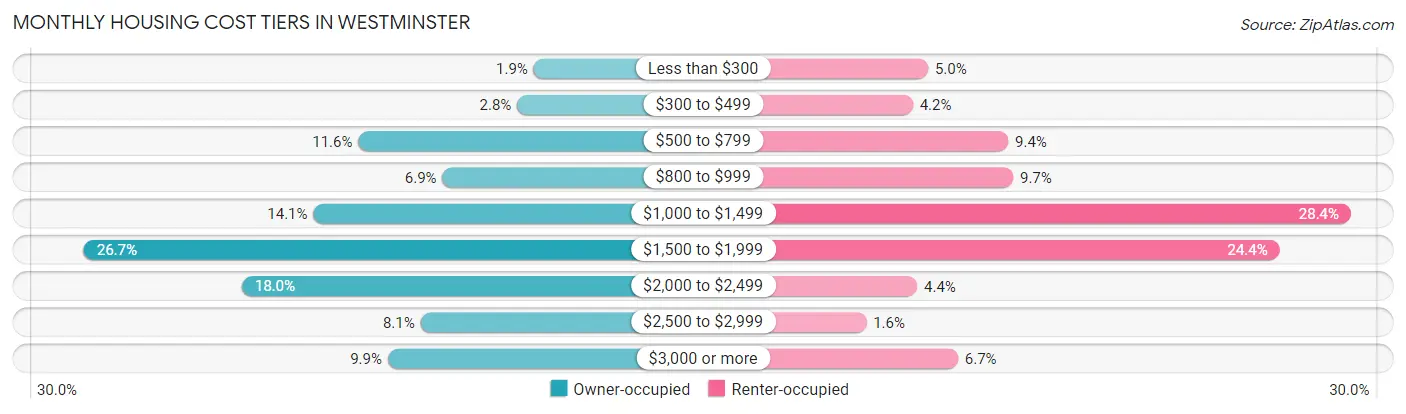
| Monthly Cost | Owner-occupied | Renter-occupied |
| Less than $300 | 81 (1.9%) | 185 (5.0%) |
| $300 to $499 | 120 (2.8%) | 154 (4.2%) |
| $500 to $799 | 498 (11.6%) | 349 (9.4%) |
| $800 to $999 | 298 (6.9%) | 359 (9.7%) |
| $1,000 to $1,499 | 605 (14.1%) | 1,050 (28.4%) |
| $1,500 to $1,999 | 1,151 (26.7%) | 904 (24.4%) |
| $2,000 to $2,499 | 775 (18.0%) | 163 (4.4%) |
| $2,500 to $2,999 | 350 (8.1%) | 59 (1.6%) |
| $3,000 or more | 428 (9.9%) | 246 (6.7%) |
| Total | 4,306 (100.0%) | 3,702 (100.0%) |
Physical Housing Characteristics in Westminster
Housing Structures in Westminster
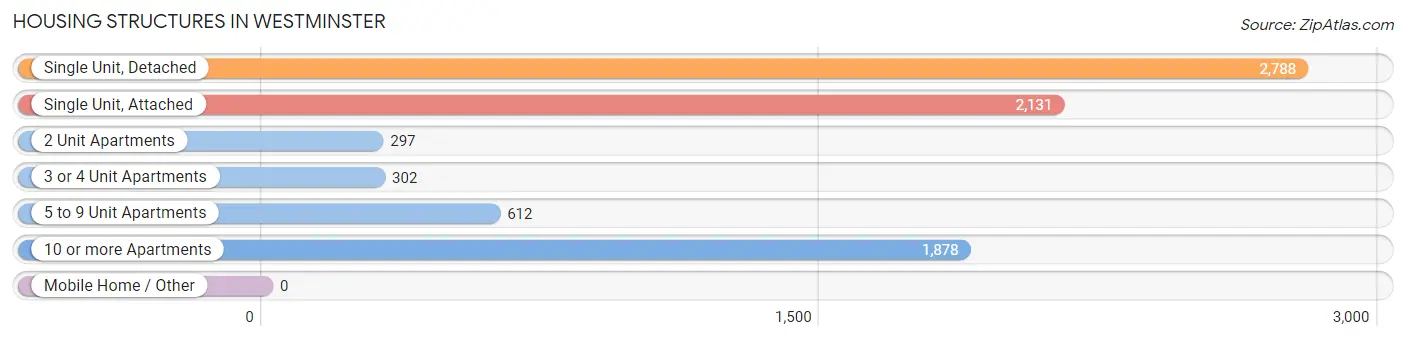
| Structure Type | # Housing Units | % Housing Units |
| Single Unit, Detached | 2,788 | 34.8% |
| Single Unit, Attached | 2,131 | 26.6% |
| 2 Unit Apartments | 297 | 3.7% |
| 3 or 4 Unit Apartments | 302 | 3.8% |
| 5 to 9 Unit Apartments | 612 | 7.6% |
| 10 or more Apartments | 1,878 | 23.4% |
| Mobile Home / Other | 0 | 0.0% |
| Total | 8,008 | 100.0% |
Housing Structures by Occupancy in Westminster
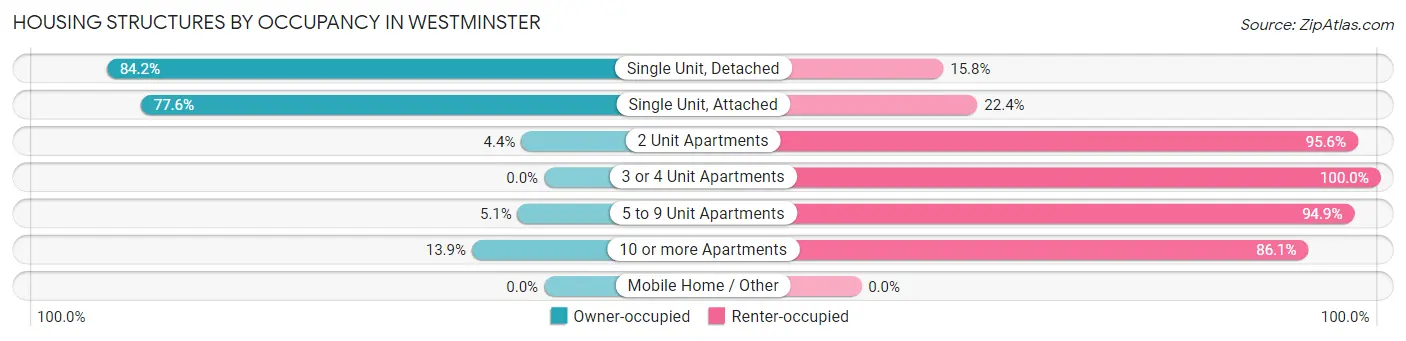
| Structure Type | Owner-occupied | Renter-occupied |
| Single Unit, Detached | 2,347 (84.2%) | 441 (15.8%) |
| Single Unit, Attached | 1,654 (77.6%) | 477 (22.4%) |
| 2 Unit Apartments | 13 (4.4%) | 284 (95.6%) |
| 3 or 4 Unit Apartments | 0 (0.0%) | 302 (100.0%) |
| 5 to 9 Unit Apartments | 31 (5.1%) | 581 (94.9%) |
| 10 or more Apartments | 261 (13.9%) | 1,617 (86.1%) |
| Mobile Home / Other | 0 (0.0%) | 0 (0.0%) |
| Total | 4,306 (53.8%) | 3,702 (46.2%) |
Housing Structures by Number of Rooms in Westminster
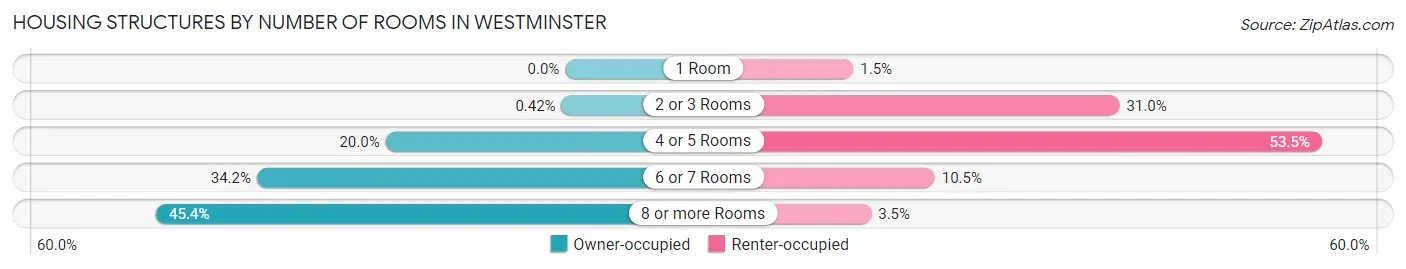
| Number of Rooms | Owner-occupied | Renter-occupied |
| 1 Room | 0 (0.0%) | 55 (1.5%) |
| 2 or 3 Rooms | 18 (0.4%) | 1,149 (31.0%) |
| 4 or 5 Rooms | 859 (20.0%) | 1,979 (53.5%) |
| 6 or 7 Rooms | 1,474 (34.2%) | 390 (10.5%) |
| 8 or more Rooms | 1,955 (45.4%) | 129 (3.5%) |
| Total | 4,306 (100.0%) | 3,702 (100.0%) |
Housing Structure by Heating Type in Westminster
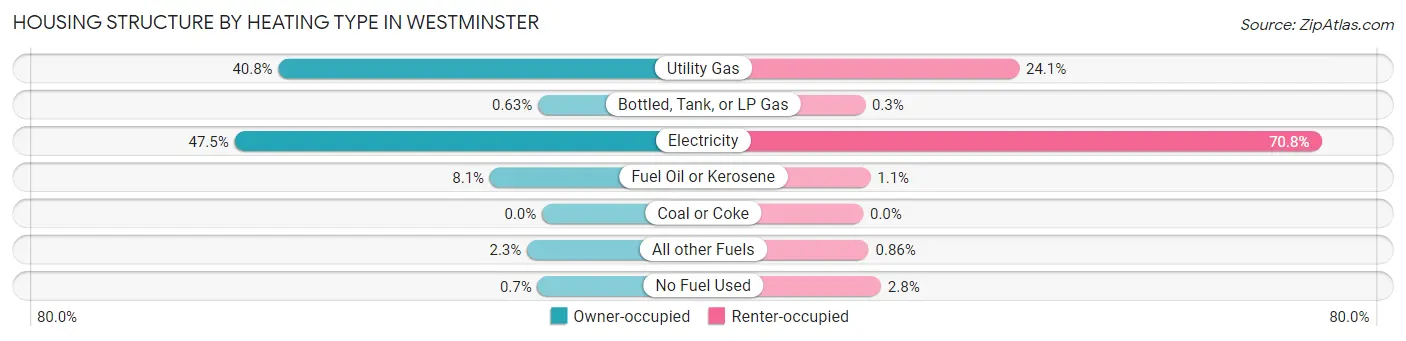
| Heating Type | Owner-occupied | Renter-occupied |
| Utility Gas | 1,755 (40.8%) | 893 (24.1%) |
| Bottled, Tank, or LP Gas | 27 (0.6%) | 11 (0.3%) |
| Electricity | 2,047 (47.5%) | 2,622 (70.8%) |
| Fuel Oil or Kerosene | 347 (8.1%) | 42 (1.1%) |
| Coal or Coke | 0 (0.0%) | 0 (0.0%) |
| All other Fuels | 100 (2.3%) | 32 (0.9%) |
| No Fuel Used | 30 (0.7%) | 102 (2.8%) |
| Total | 4,306 (100.0%) | 3,702 (100.0%) |
Household Vehicle Usage in Westminster
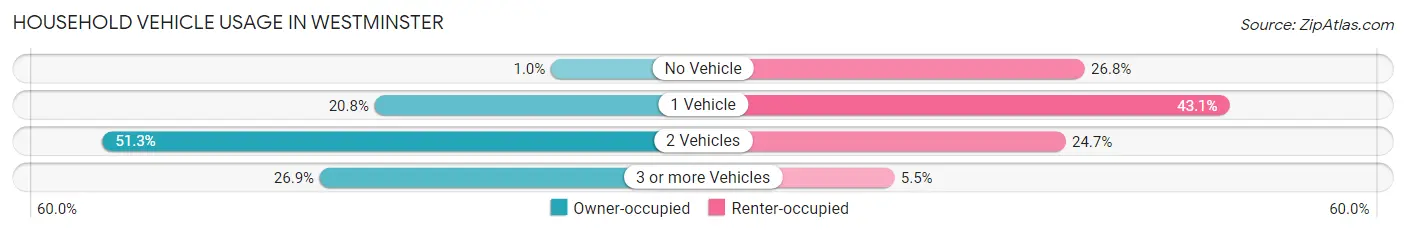
| Vehicles per Household | Owner-occupied | Renter-occupied |
| No Vehicle | 44 (1.0%) | 992 (26.8%) |
| 1 Vehicle | 895 (20.8%) | 1,594 (43.1%) |
| 2 Vehicles | 2,208 (51.3%) | 913 (24.7%) |
| 3 or more Vehicles | 1,159 (26.9%) | 203 (5.5%) |
| Total | 4,306 (100.0%) | 3,702 (100.0%) |
Real Estate & Mortgages in Westminster
Real Estate and Mortgage Overview in Westminster
| Characteristic | Without Mortgage | With Mortgage |
| Housing Units | 905 | 3,401 |
| Median Property Value | $303,400 | $291,200 |
| Median Household Income | $81,089 | $1,060 |
| Monthly Housing Costs | $730 | $428 |
| Real Estate Taxes | $4,306 | $52 |
Property Value by Mortgage Status in Westminster
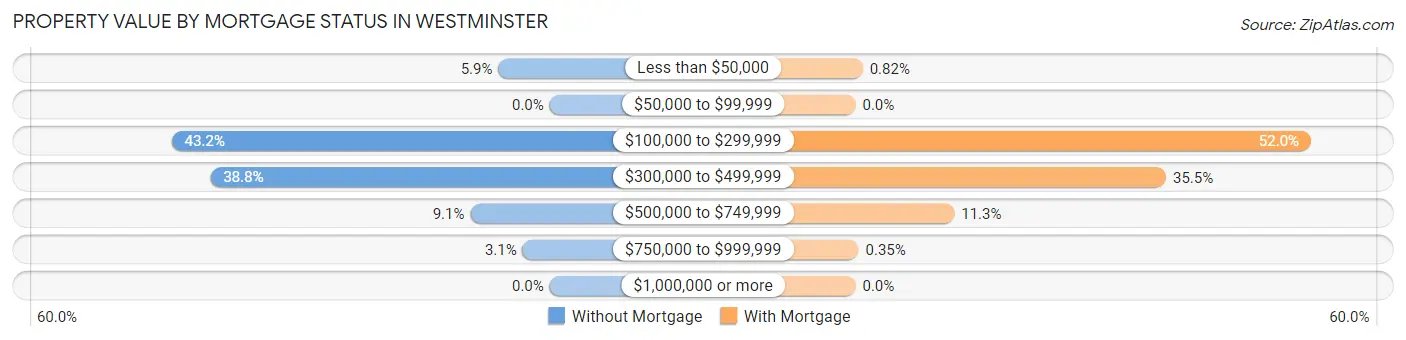
| Property Value | Without Mortgage | With Mortgage |
| Less than $50,000 | 53 (5.9%) | 28 (0.8%) |
| $50,000 to $99,999 | 0 (0.0%) | 0 (0.0%) |
| $100,000 to $299,999 | 391 (43.2%) | 1,770 (52.0%) |
| $300,000 to $499,999 | 351 (38.8%) | 1,207 (35.5%) |
| $500,000 to $749,999 | 82 (9.1%) | 384 (11.3%) |
| $750,000 to $999,999 | 28 (3.1%) | 12 (0.4%) |
| $1,000,000 or more | 0 (0.0%) | 0 (0.0%) |
| Total | 905 (100.0%) | 3,401 (100.0%) |
Household Income by Mortgage Status in Westminster
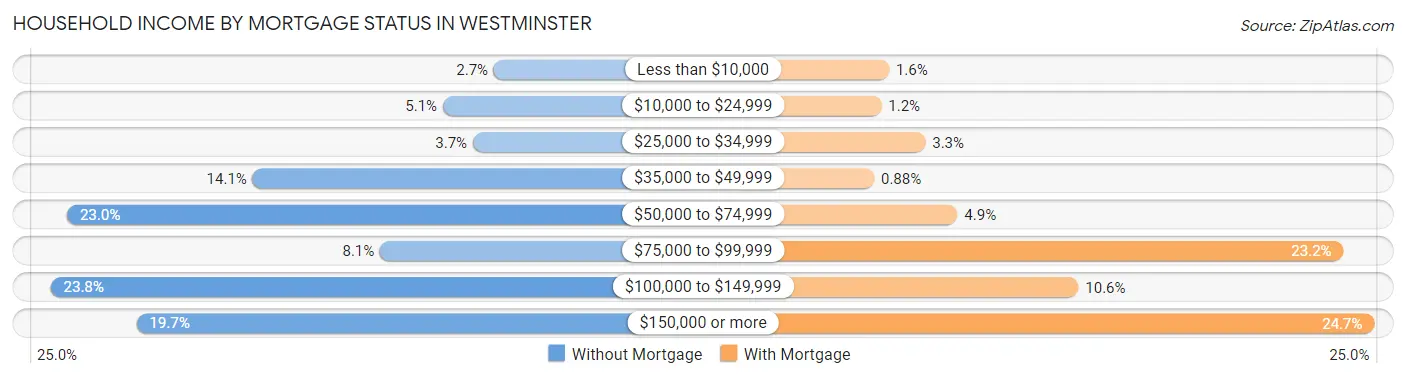
| Household Income | Without Mortgage | With Mortgage |
| Less than $10,000 | 24 (2.6%) | 54 (1.6%) |
| $10,000 to $24,999 | 46 (5.1%) | 42 (1.2%) |
| $25,000 to $34,999 | 33 (3.6%) | 113 (3.3%) |
| $35,000 to $49,999 | 128 (14.1%) | 30 (0.9%) |
| $50,000 to $74,999 | 208 (23.0%) | 165 (4.9%) |
| $75,000 to $99,999 | 73 (8.1%) | 790 (23.2%) |
| $100,000 to $149,999 | 215 (23.8%) | 361 (10.6%) |
| $150,000 or more | 178 (19.7%) | 840 (24.7%) |
| Total | 905 (100.0%) | 3,401 (100.0%) |
Property Value to Household Income Ratio in Westminster
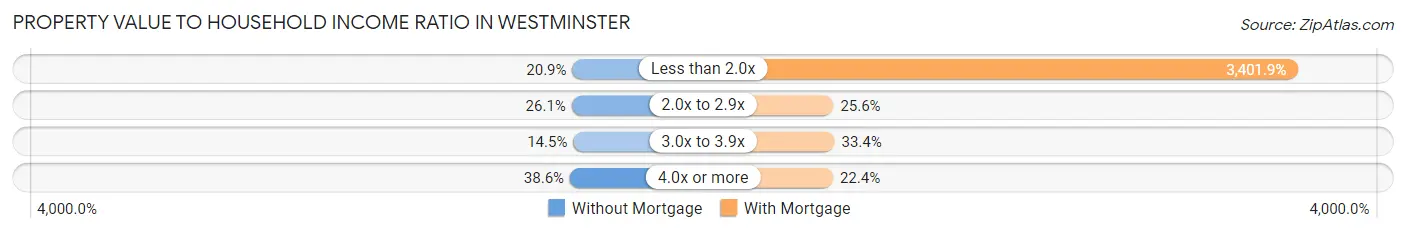
| Value-to-Income Ratio | Without Mortgage | With Mortgage |
| Less than 2.0x | 189 (20.9%) | 115,698 (3,401.9%) |
| 2.0x to 2.9x | 236 (26.1%) | 870 (25.6%) |
| 3.0x to 3.9x | 131 (14.5%) | 1,136 (33.4%) |
| 4.0x or more | 349 (38.6%) | 762 (22.4%) |
| Total | 905 (100.0%) | 3,401 (100.0%) |
Real Estate Taxes by Mortgage Status in Westminster
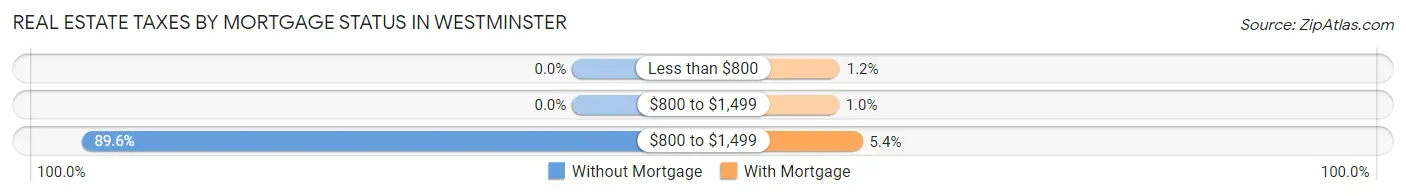
| Property Taxes | Without Mortgage | With Mortgage |
| Less than $800 | 0 (0.0%) | 42 (1.2%) |
| $800 to $1,499 | 0 (0.0%) | 35 (1.0%) |
| $800 to $1,499 | 811 (89.6%) | 184 (5.4%) |
| Total | 905 (100.0%) | 3,401 (100.0%) |
Health & Disability in Westminster
Health Insurance Coverage by Age in Westminster
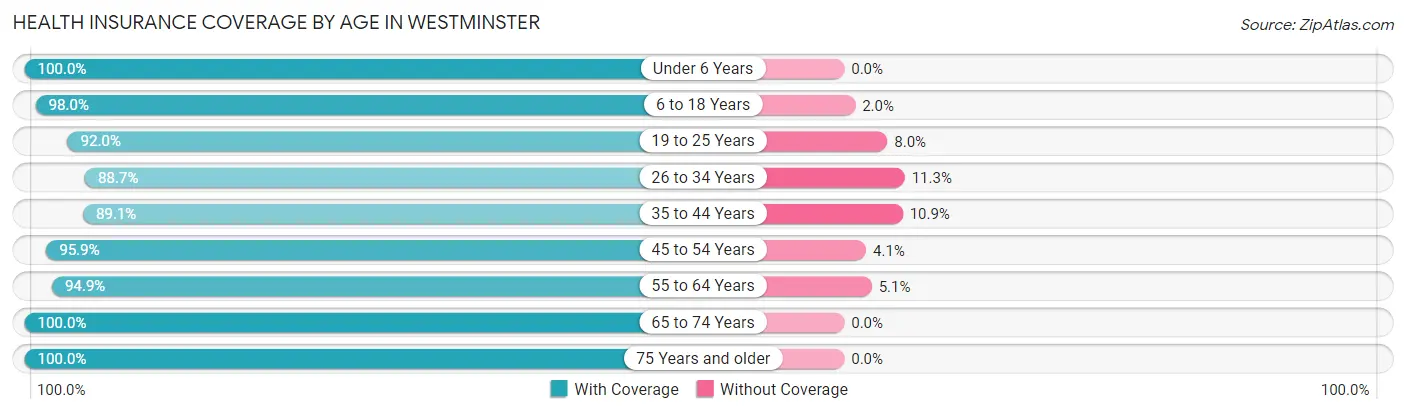
| Age Bracket | With Coverage | Without Coverage |
| Under 6 Years | 1,089 (100.0%) | 0 (0.0%) |
| 6 to 18 Years | 2,935 (98.0%) | 61 (2.0%) |
| 19 to 25 Years | 2,567 (92.0%) | 224 (8.0%) |
| 26 to 34 Years | 2,157 (88.7%) | 274 (11.3%) |
| 35 to 44 Years | 2,160 (89.1%) | 264 (10.9%) |
| 45 to 54 Years | 2,200 (95.9%) | 93 (4.1%) |
| 55 to 64 Years | 2,007 (94.9%) | 108 (5.1%) |
| 65 to 74 Years | 1,724 (100.0%) | 0 (0.0%) |
| 75 Years and older | 1,828 (100.0%) | 0 (0.0%) |
| Total | 18,667 (94.8%) | 1,024 (5.2%) |
Health Insurance Coverage by Citizenship Status in Westminster
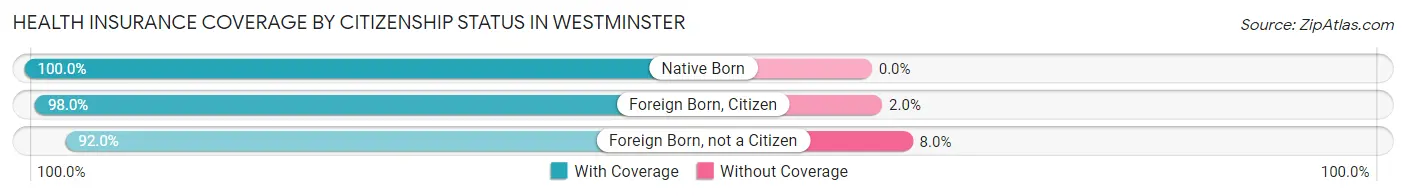
| Citizenship Status | With Coverage | Without Coverage |
| Native Born | 1,089 (100.0%) | 0 (0.0%) |
| Foreign Born, Citizen | 2,935 (98.0%) | 61 (2.0%) |
| Foreign Born, not a Citizen | 2,567 (92.0%) | 224 (8.0%) |
Health Insurance Coverage by Household Income in Westminster
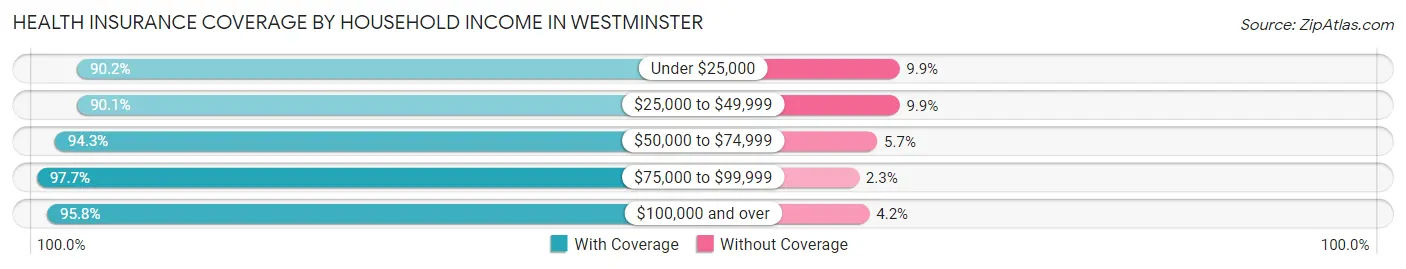
| Household Income | With Coverage | Without Coverage |
| Under $25,000 | 1,766 (90.1%) | 193 (9.9%) |
| $25,000 to $49,999 | 2,027 (90.1%) | 222 (9.9%) |
| $50,000 to $74,999 | 2,700 (94.3%) | 163 (5.7%) |
| $75,000 to $99,999 | 1,805 (97.7%) | 42 (2.3%) |
| $100,000 and over | 8,849 (95.8%) | 390 (4.2%) |
Public vs Private Health Insurance Coverage by Age in Westminster
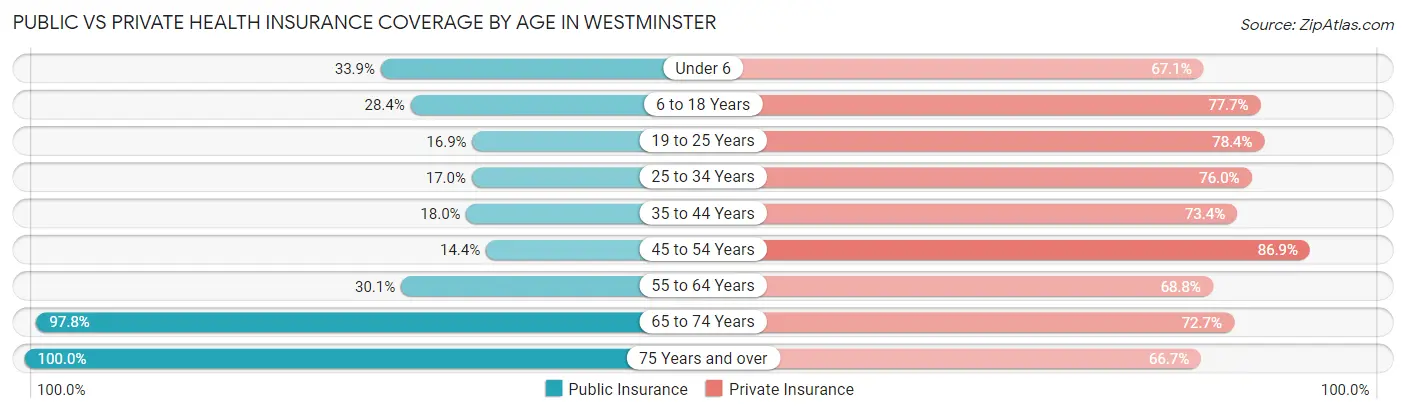
| Age Bracket | Public Insurance | Private Insurance |
| Under 6 | 369 (33.9%) | 731 (67.1%) |
| 6 to 18 Years | 850 (28.4%) | 2,328 (77.7%) |
| 19 to 25 Years | 471 (16.9%) | 2,189 (78.4%) |
| 25 to 34 Years | 413 (17.0%) | 1,848 (76.0%) |
| 35 to 44 Years | 436 (18.0%) | 1,778 (73.4%) |
| 45 to 54 Years | 329 (14.3%) | 1,992 (86.9%) |
| 55 to 64 Years | 637 (30.1%) | 1,456 (68.8%) |
| 65 to 74 Years | 1,686 (97.8%) | 1,254 (72.7%) |
| 75 Years and over | 1,828 (100.0%) | 1,219 (66.7%) |
| Total | 7,019 (35.6%) | 14,795 (75.1%) |
Disability Status by Sex by Age in Westminster
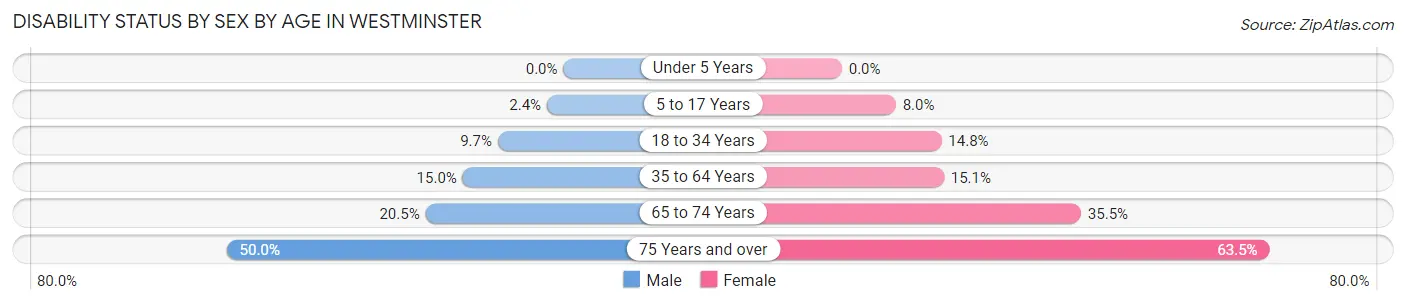
| Age Bracket | Male | Female |
| Under 5 Years | 0 (0.0%) | 0 (0.0%) |
| 5 to 17 Years | 37 (2.4%) | 86 (8.0%) |
| 18 to 34 Years | 279 (9.7%) | 437 (14.8%) |
| 35 to 64 Years | 491 (14.9%) | 537 (15.1%) |
| 65 to 74 Years | 165 (20.5%) | 326 (35.5%) |
| 75 Years and over | 314 (50.0%) | 762 (63.5%) |
Disability Class by Sex by Age in Westminster
Disability Class: Hearing Difficulty
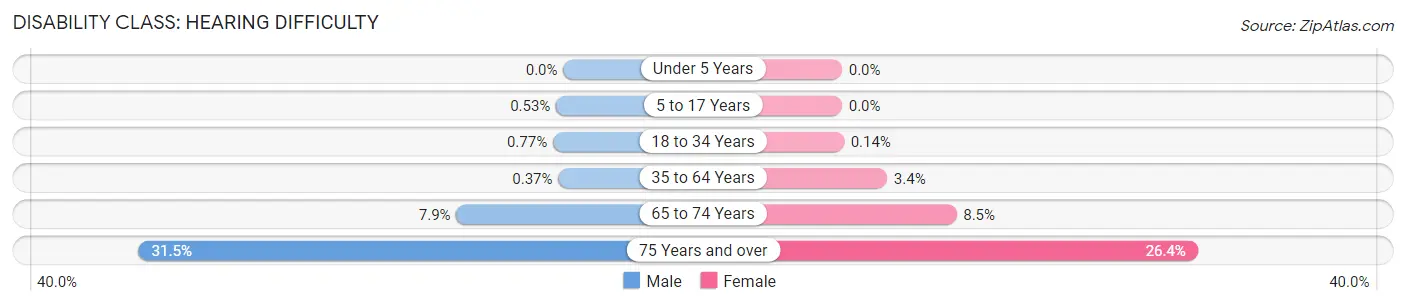
| Age Bracket | Male | Female |
| Under 5 Years | 0 (0.0%) | 0 (0.0%) |
| 5 to 17 Years | 8 (0.5%) | 0 (0.0%) |
| 18 to 34 Years | 22 (0.8%) | 4 (0.1%) |
| 35 to 64 Years | 12 (0.4%) | 119 (3.4%) |
| 65 to 74 Years | 64 (7.9%) | 78 (8.5%) |
| 75 Years and over | 198 (31.5%) | 317 (26.4%) |
Disability Class: Vision Difficulty
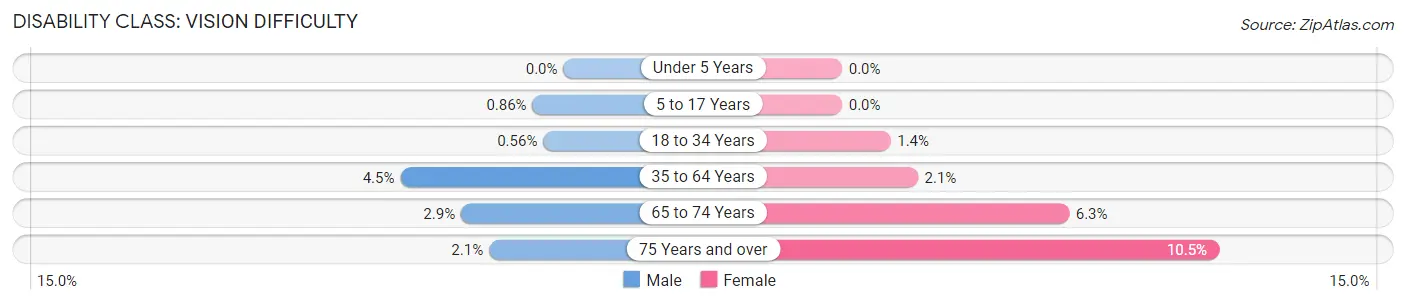
| Age Bracket | Male | Female |
| Under 5 Years | 0 (0.0%) | 0 (0.0%) |
| 5 to 17 Years | 13 (0.9%) | 0 (0.0%) |
| 18 to 34 Years | 16 (0.6%) | 40 (1.3%) |
| 35 to 64 Years | 149 (4.5%) | 75 (2.1%) |
| 65 to 74 Years | 23 (2.9%) | 58 (6.3%) |
| 75 Years and over | 13 (2.1%) | 126 (10.5%) |
Disability Class: Cognitive Difficulty
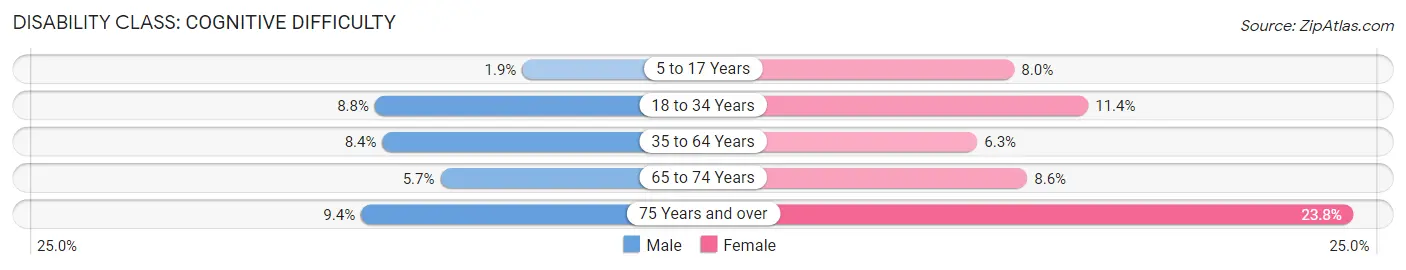
| Age Bracket | Male | Female |
| 5 to 17 Years | 29 (1.9%) | 86 (8.0%) |
| 18 to 34 Years | 251 (8.7%) | 338 (11.4%) |
| 35 to 64 Years | 276 (8.4%) | 223 (6.3%) |
| 65 to 74 Years | 46 (5.7%) | 79 (8.6%) |
| 75 Years and over | 59 (9.4%) | 285 (23.7%) |
Disability Class: Ambulatory Difficulty
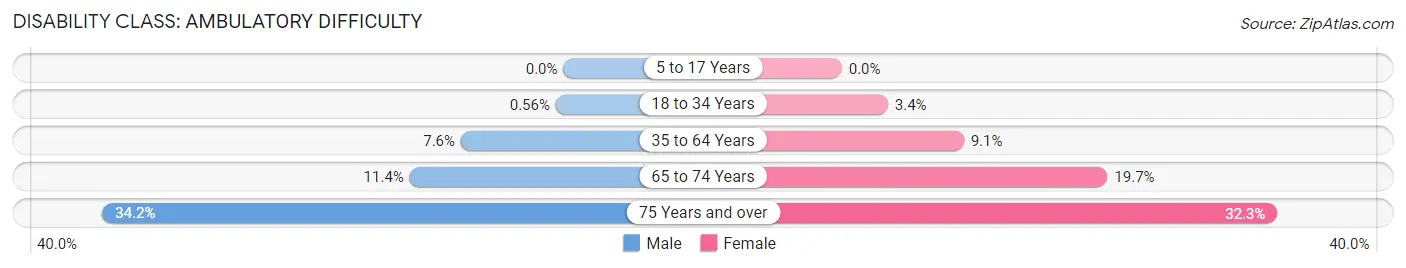
| Age Bracket | Male | Female |
| 5 to 17 Years | 0 (0.0%) | 0 (0.0%) |
| 18 to 34 Years | 16 (0.6%) | 101 (3.4%) |
| 35 to 64 Years | 250 (7.6%) | 321 (9.0%) |
| 65 to 74 Years | 92 (11.4%) | 181 (19.7%) |
| 75 Years and over | 215 (34.2%) | 388 (32.3%) |
Disability Class: Self-Care Difficulty
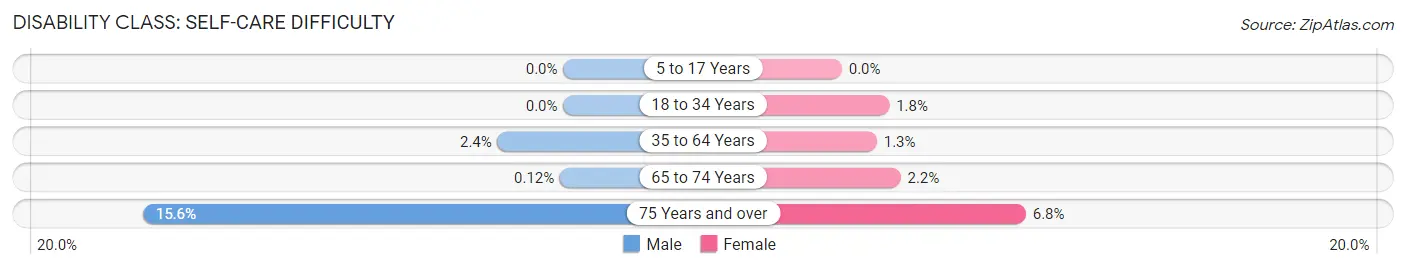
| Age Bracket | Male | Female |
| 5 to 17 Years | 0 (0.0%) | 0 (0.0%) |
| 18 to 34 Years | 0 (0.0%) | 52 (1.8%) |
| 35 to 64 Years | 80 (2.4%) | 46 (1.3%) |
| 65 to 74 Years | 1 (0.1%) | 20 (2.2%) |
| 75 Years and over | 98 (15.6%) | 82 (6.8%) |
Technology Access in Westminster
Computing Device Access in Westminster
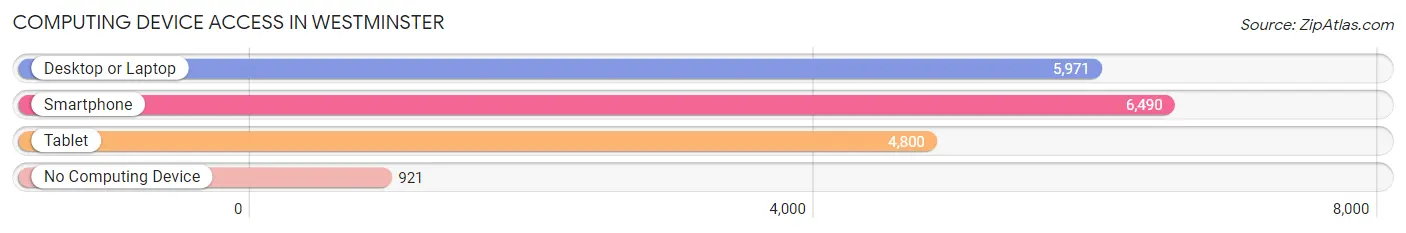
| Device Type | # Households | % Households |
| Desktop or Laptop | 5,971 | 74.6% |
| Smartphone | 6,490 | 81.0% |
| Tablet | 4,800 | 59.9% |
| No Computing Device | 921 | 11.5% |
| Total | 8,008 | 100.0% |
Internet Access in Westminster
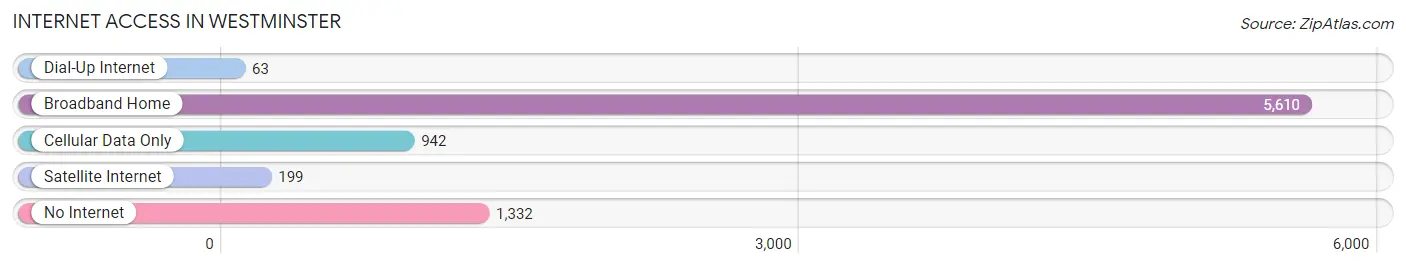
| Internet Type | # Households | % Households |
| Dial-Up Internet | 63 | 0.8% |
| Broadband Home | 5,610 | 70.1% |
| Cellular Data Only | 942 | 11.8% |
| Satellite Internet | 199 | 2.5% |
| No Internet | 1,332 | 16.6% |
| Total | 8,008 | 100.0% |
Westminster Summary
Westminster is a city located in the northern part of Maryland, in Carroll County. It is situated approximately 30 miles northwest of Baltimore and 40 miles northeast of Washington, D.C. The city is home to a population of 18,590 people, according to the 2010 census.
Geography
Westminster is located at 39°34'N, 77°00'W. It is situated in the northern part of Maryland, in Carroll County. The city is bordered by the towns of New Windsor, Union Bridge, and Taneytown to the north, Sykesville to the east, Finksburg to the south, and Hampstead to the west. The city is situated in the Piedmont Plateau region of Maryland, and is characterized by rolling hills and valleys. The city is located in the watershed of the Monocacy River, which flows through the city and empties into the Potomac River.
History
Westminster was founded in 1764 by William Winchester, a Quaker from Pennsylvania. The city was originally known as Winchester, but was renamed Westminster in 1790. The city was incorporated in 1818, and was the county seat of Carroll County from 1837 to 1851. During the Civil War, the city was the site of a major battle between Union and Confederate forces in 1862.
Economy
Westminster is home to a variety of businesses and industries. The city is home to several large employers, including Carroll Hospital Center, Carroll County Public Schools, and McDaniel College. The city is also home to a number of small businesses, including restaurants, retail stores, and professional services.
Demographics
According to the 2010 census, Westminster has a population of 18,590 people. The racial makeup of the city is 87.3% White, 6.2% African American, 0.7% Native American, 2.2% Asian, 0.1% Pacific Islander, 1.3% from other races, and 2.3% from two or more races. The median household income in the city is $50,945, and the median family income is $60,945. The per capita income in the city is $25,945.
Conclusion
Westminster is a city located in the northern part of Maryland, in Carroll County. It is situated approximately 30 miles northwest of Baltimore and 40 miles northeast of Washington, D.C. The city is home to a population of 18,590 people, according to the 2010 census. Westminster is home to a variety of businesses and industries, and is characterized by rolling hills and valleys. The city is also home to a number of small businesses, including restaurants, retail stores, and professional services. The racial makeup of the city is 87.3% White, 6.2% African American, 0.7% Native American, 2.2% Asian, 0.1% Pacific Islander, 1.3% from other races, and 2.3% from two or more races. The median household income in the city is $50,945, and the median family income is $60,945. The per capita income in the city is $25,945.
Common Questions
What is Per Capita Income in Westminster?
Per Capita income in Westminster is $38,841.
What is the Median Family Income in Westminster?
Median Family Income in Westminster is $102,430.
What is the Median Household income in Westminster?
Median Household Income in Westminster is $71,286.
What is Income or Wage Gap in Westminster?
Income or Wage Gap in Westminster is 25.8%.
Women in Westminster earn 74.2 cents for every dollar earned by a man.
What is Family Income Deficit in Westminster?
Family Income Deficit in Westminster is $8,613.
Families that are below poverty line in Westminster earn $8,613 less on average than the poverty threshold level.
What is Inequality or Gini Index in Westminster?
Inequality or Gini Index in Westminster is 0.43.
What is the Total Population of Westminster?
Total Population of Westminster is 20,099.
What is the Total Male Population of Westminster?
Total Male Population of Westminster is 9,837.
What is the Total Female Population of Westminster?
Total Female Population of Westminster is 10,262.
What is the Ratio of Males per 100 Females in Westminster?
There are 95.86 Males per 100 Females in Westminster.
What is the Ratio of Females per 100 Males in Westminster?
There are 104.32 Females per 100 Males in Westminster.
What is the Median Population Age in Westminster?
Median Population Age in Westminster is 37.3 Years.
What is the Average Family Size in Westminster
Average Family Size in Westminster is 2.9 People.
What is the Average Household Size in Westminster
Average Household Size in Westminster is 2.3 People.
How Large is the Labor Force in Westminster?
There are 10,411 People in the Labor Forcein in Westminster.
What is the Percentage of People in the Labor Force in Westminster?
61.2% of People are in the Labor Force in Westminster.
What is the Unemployment Rate in Westminster?
Unemployment Rate in Westminster is 4.4%.