Perryville, MD Map & Demographics
Perryville Map
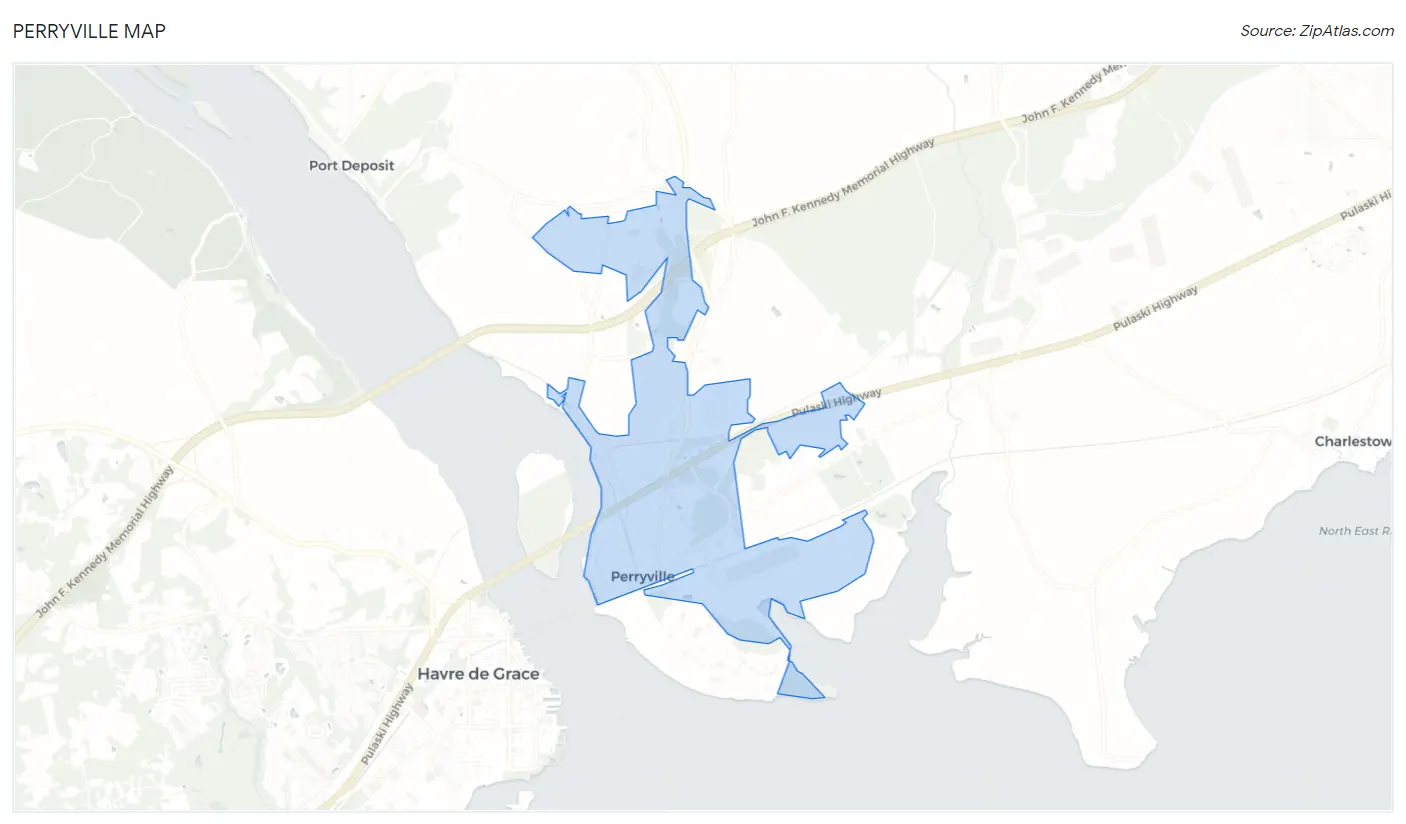
Perryville Overview
$34,000
PER CAPITA INCOME
$101,488
AVG FAMILY INCOME
$71,579
AVG HOUSEHOLD INCOME
24.6%
WAGE / INCOME GAP [ % ]
75.4¢/ $1
WAGE / INCOME GAP [ $ ]
0.41
INEQUALITY / GINI INDEX
4,398
TOTAL POPULATION
2,085
MALE POPULATION
2,313
FEMALE POPULATION
90.14
MALES / 100 FEMALES
110.94
FEMALES / 100 MALES
40.8
MEDIAN AGE
3.3
AVG FAMILY SIZE
2.6
AVG HOUSEHOLD SIZE
2,287
LABOR FORCE [ PEOPLE ]
64.8%
PERCENT IN LABOR FORCE
5.3%
UNEMPLOYMENT RATE
Perryville Zip Codes
Income in Perryville
Income Overview in Perryville
Per Capita Income in Perryville is $34,000, while median incomes of families and households are $101,488 and $71,579 respectively.
| Characteristic | Number | Measure |
| Per Capita Income | 4,398 | $34,000 |
| Median Family Income | 1,091 | $101,488 |
| Mean Family Income | 1,091 | $105,574 |
| Median Household Income | 1,652 | $71,579 |
| Mean Household Income | 1,652 | $87,726 |
| Income Deficit | 1,091 | $0 |
| Wage / Income Gap (%) | 4,398 | 24.58% |
| Wage / Income Gap ($) | 4,398 | 75.42¢ per $1 |
| Gini / Inequality Index | 4,398 | 0.41 |
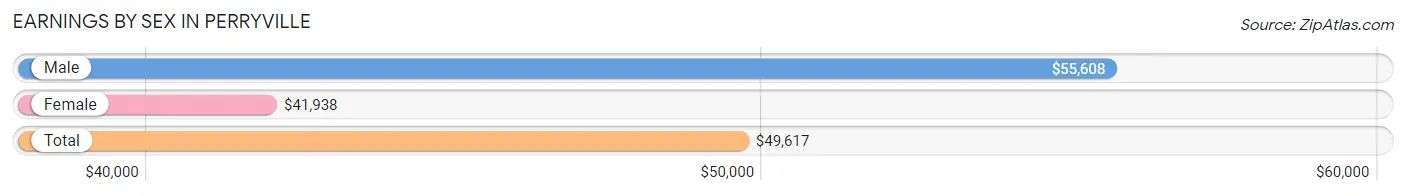
Earnings by Sex in Perryville
Average Earnings in Perryville are $49,617, $55,608 for men and $41,938 for women, a difference of 24.6%.
| Sex | Number | Average Earnings |
| Male | 1,208 (52.4%) | $55,608 |
| Female | 1,097 (47.6%) | $41,938 |
| Total | 2,305 (100.0%) | $49,617 |
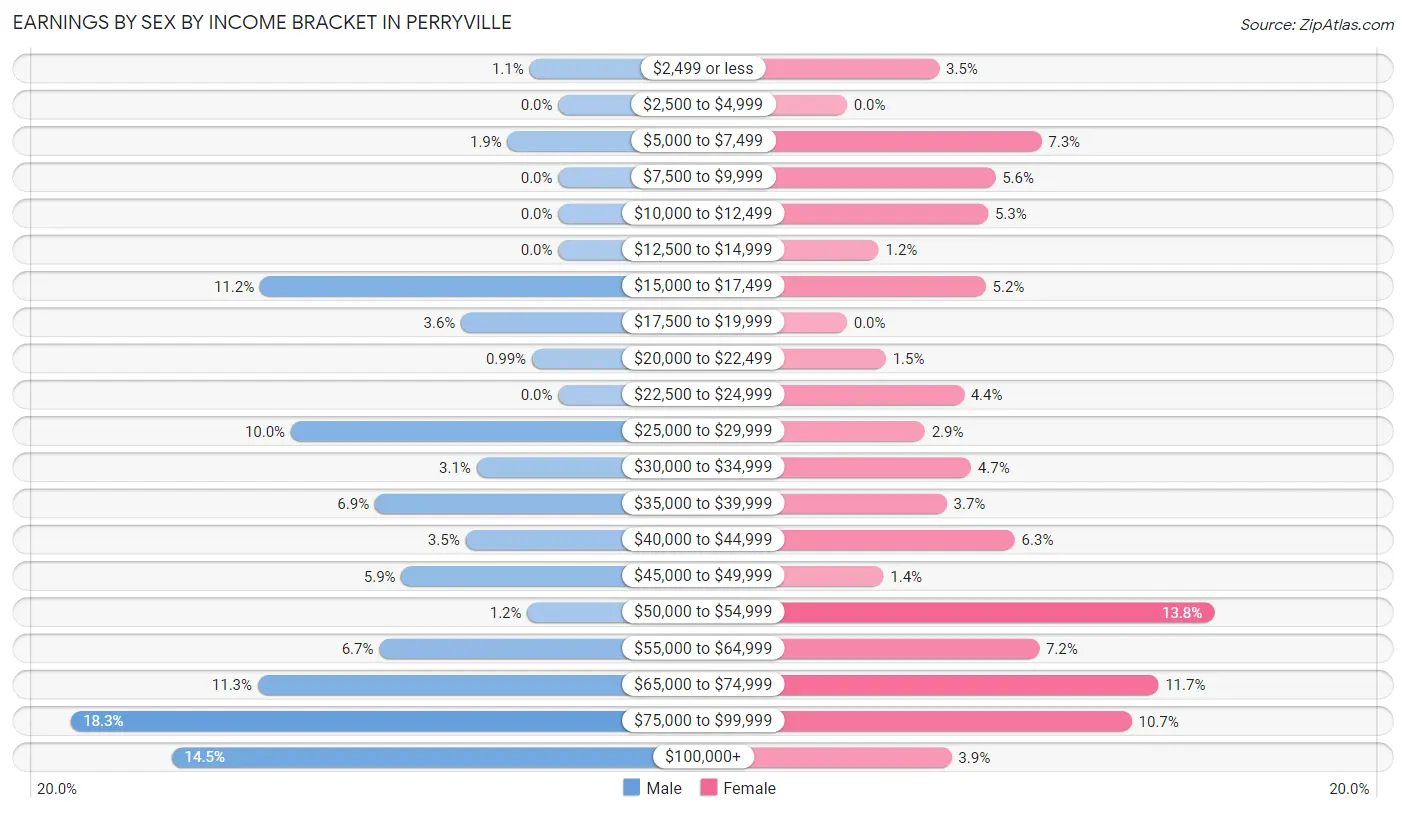
Earnings by Sex by Income Bracket in Perryville
The most common earnings brackets in Perryville are $75,000 to $99,999 for men (221 | 18.3%) and $50,000 to $54,999 for women (151 | 13.8%).
| Income | Male | Female |
| $2,499 or less | 13 (1.1%) | 38 (3.5%) |
| $2,500 to $4,999 | 0 (0.0%) | 0 (0.0%) |
| $5,000 to $7,499 | 23 (1.9%) | 80 (7.3%) |
| $7,500 to $9,999 | 0 (0.0%) | 61 (5.6%) |
| $10,000 to $12,499 | 0 (0.0%) | 58 (5.3%) |
| $12,500 to $14,999 | 0 (0.0%) | 13 (1.2%) |
| $15,000 to $17,499 | 135 (11.2%) | 57 (5.2%) |
| $17,500 to $19,999 | 44 (3.6%) | 0 (0.0%) |
| $20,000 to $22,499 | 12 (1.0%) | 16 (1.5%) |
| $22,500 to $24,999 | 0 (0.0%) | 48 (4.4%) |
| $25,000 to $29,999 | 121 (10.0%) | 32 (2.9%) |
| $30,000 to $34,999 | 37 (3.1%) | 51 (4.6%) |
| $35,000 to $39,999 | 83 (6.9%) | 41 (3.7%) |
| $40,000 to $44,999 | 42 (3.5%) | 69 (6.3%) |
| $45,000 to $49,999 | 71 (5.9%) | 15 (1.4%) |
| $50,000 to $54,999 | 14 (1.2%) | 151 (13.8%) |
| $55,000 to $64,999 | 81 (6.7%) | 79 (7.2%) |
| $65,000 to $74,999 | 136 (11.3%) | 128 (11.7%) |
| $75,000 to $99,999 | 221 (18.3%) | 117 (10.7%) |
| $100,000+ | 175 (14.5%) | 43 (3.9%) |
| Total | 1,208 (100.0%) | 1,097 (100.0%) |
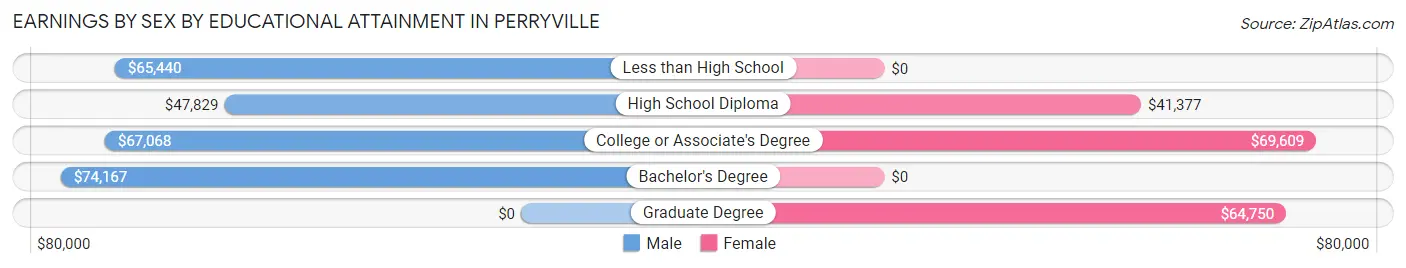
Earnings by Sex by Educational Attainment in Perryville
Average earnings in Perryville are $65,195 for men and $50,422 for women, a difference of 22.7%. Men with an educational attainment of bachelor's degree enjoy the highest average annual earnings of $74,167, while those with high school diploma education earn the least with $47,829. Women with an educational attainment of college or associate's degree earn the most with the average annual earnings of $69,609, while those with high school diploma education have the smallest earnings of $41,377.
| Educational Attainment | Male Income | Female Income |
| Less than High School | $65,440 | $0 |
| High School Diploma | $47,829 | $41,377 |
| College or Associate's Degree | $67,068 | $69,609 |
| Bachelor's Degree | $74,167 | $0 |
| Graduate Degree | - | - |
| Total | $65,195 | $50,422 |
Family Income in Perryville
Family Income Brackets in Perryville
According to the Perryville family income data, there are 252 families falling into the $100,000 to $149,999 income range, which is the most common income bracket and makes up 23.1% of all families. Conversely, the $10,000 to $14,999 income bracket is the least frequent group with only 5 families (0.5%) belonging to this category.
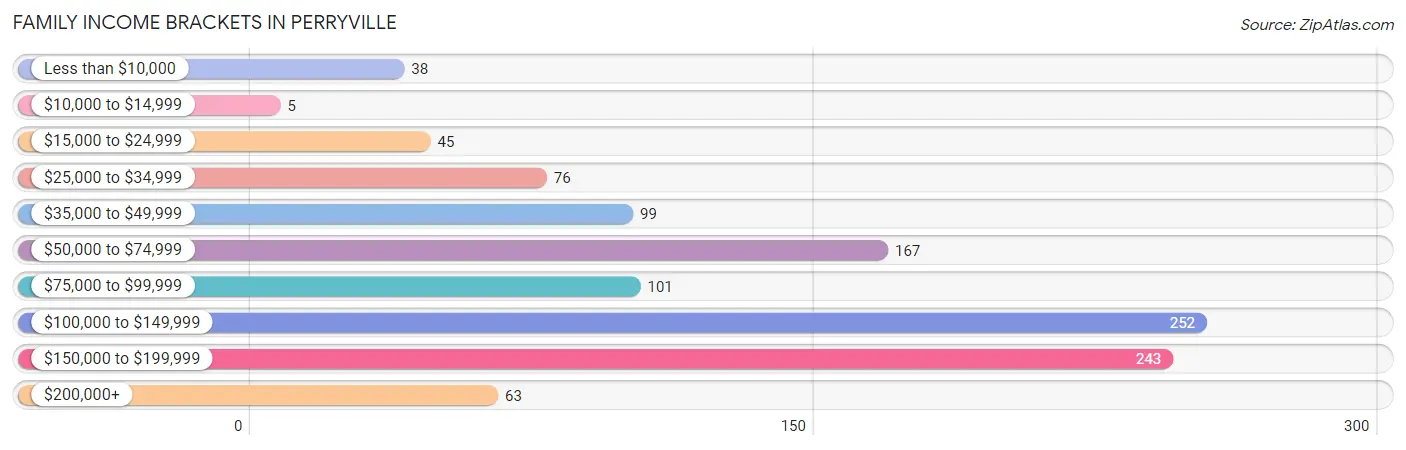
| Income Bracket | # Families | % Families |
| Less than $10,000 | 38 | 3.5% |
| $10,000 to $14,999 | 5 | 0.5% |
| $15,000 to $24,999 | 45 | 4.1% |
| $25,000 to $34,999 | 76 | 7.0% |
| $35,000 to $49,999 | 99 | 9.1% |
| $50,000 to $74,999 | 167 | 15.3% |
| $75,000 to $99,999 | 101 | 9.3% |
| $100,000 to $149,999 | 252 | 23.1% |
| $150,000 to $199,999 | 243 | 22.3% |
| $200,000+ | 63 | 5.8% |
Family Income by Famaliy Size in Perryville
5-person families (83 | 7.6%) account for the highest median family income in Perryville with $185,339 per family, while 4-person families (159 | 14.6%) have the highest median income of $43,819 per family member.
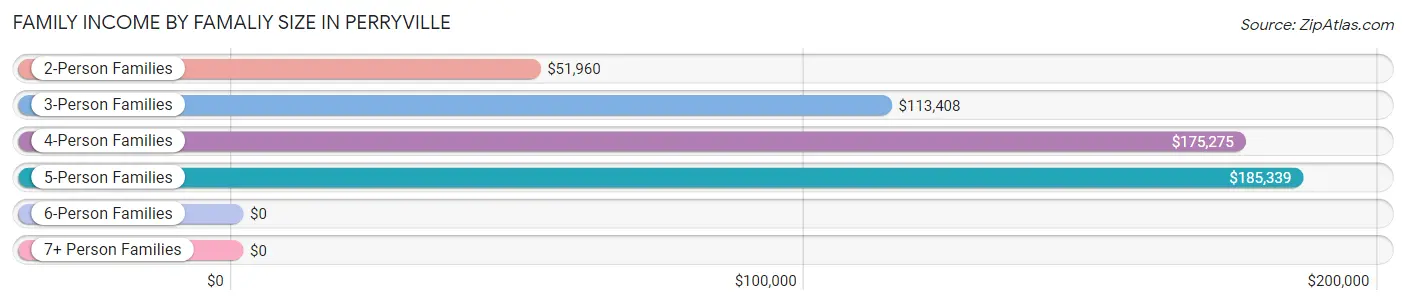
| Income Bracket | # Families | Median Income |
| 2-Person Families | 463 (42.4%) | $51,960 |
| 3-Person Families | 299 (27.4%) | $113,408 |
| 4-Person Families | 159 (14.6%) | $175,275 |
| 5-Person Families | 83 (7.6%) | $185,339 |
| 6-Person Families | 41 (3.8%) | $0 |
| 7+ Person Families | 46 (4.2%) | $0 |
| Total | 1,091 (100.0%) | $101,488 |
Family Income by Number of Earners in Perryville
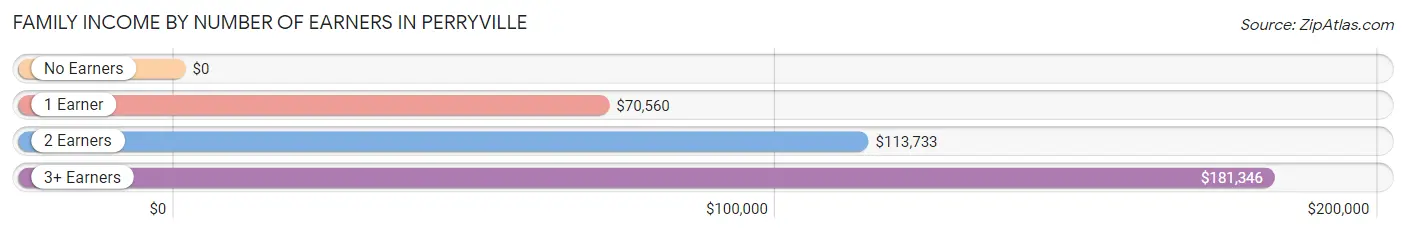
| Number of Earners | # Families | Median Income |
| No Earners | 134 (12.3%) | $0 |
| 1 Earner | 323 (29.6%) | $70,560 |
| 2 Earners | 514 (47.1%) | $113,733 |
| 3+ Earners | 120 (11.0%) | $181,346 |
| Total | 1,091 (100.0%) | $101,488 |
Household Income in Perryville
Household Income Brackets in Perryville
With 345 households falling in the category, the $50,000 to $74,999 income range is the most frequent in Perryville, accounting for 20.9% of all households. In contrast, only 20 households (1.2%) fall into the $10,000 to $14,999 income bracket, making it the least populous group.
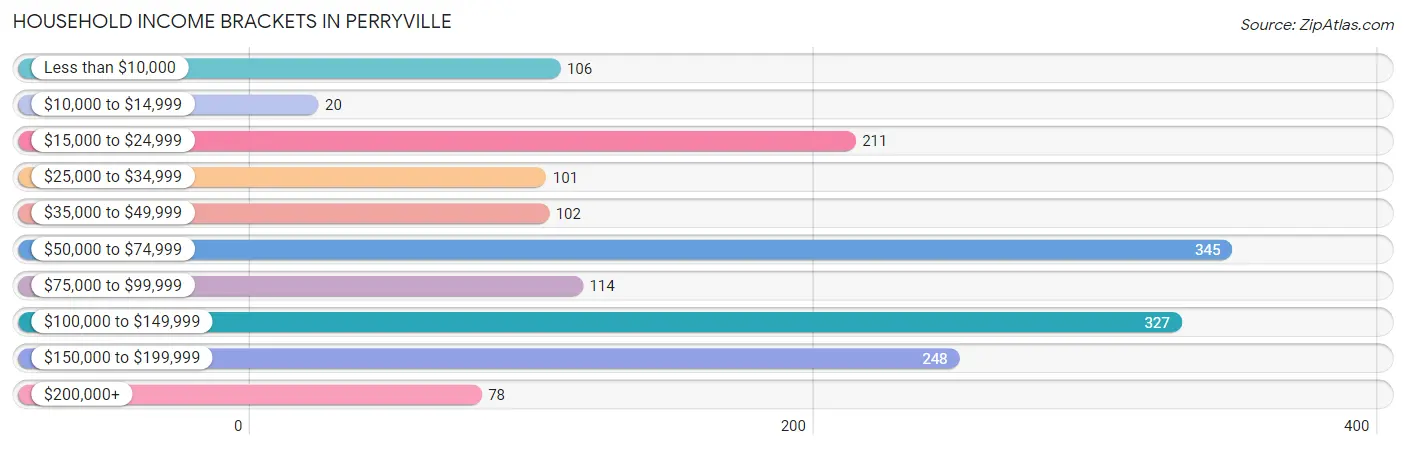
| Income Bracket | # Households | % Households |
| Less than $10,000 | 106 | 6.4% |
| $10,000 to $14,999 | 20 | 1.2% |
| $15,000 to $24,999 | 211 | 12.8% |
| $25,000 to $34,999 | 101 | 6.1% |
| $35,000 to $49,999 | 102 | 6.2% |
| $50,000 to $74,999 | 345 | 20.9% |
| $75,000 to $99,999 | 114 | 6.9% |
| $100,000 to $149,999 | 327 | 19.8% |
| $150,000 to $199,999 | 248 | 15.0% |
| $200,000+ | 78 | 4.7% |
Household Income by Householder Age in Perryville
The median household income in Perryville is $71,579, with the highest median household income of $101,925 found in the 25 to 44 years age bracket for the primary householder. A total of 497 households (30.1%) fall into this category. Meanwhile, the 15 to 24 years age bracket for the primary householder has the lowest median household income of $0, with 42 households (2.5%) in this group.
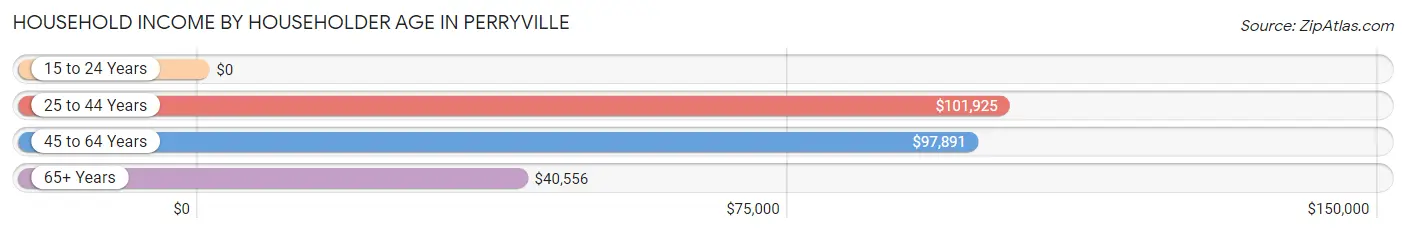
| Income Bracket | # Households | Median Income |
| 15 to 24 Years | 42 (2.5%) | $0 |
| 25 to 44 Years | 497 (30.1%) | $101,925 |
| 45 to 64 Years | 665 (40.3%) | $97,891 |
| 65+ Years | 448 (27.1%) | $40,556 |
| Total | 1,652 (100.0%) | $71,579 |
Poverty in Perryville
Income Below Poverty by Sex and Age in Perryville
With 9.7% poverty level for males and 8.2% for females among the residents of Perryville, 75 year old and over males and under 5 year old females are the most vulnerable to poverty, with 29 males (43.3%) and 95 females (49.0%) in their respective age groups living below the poverty level.
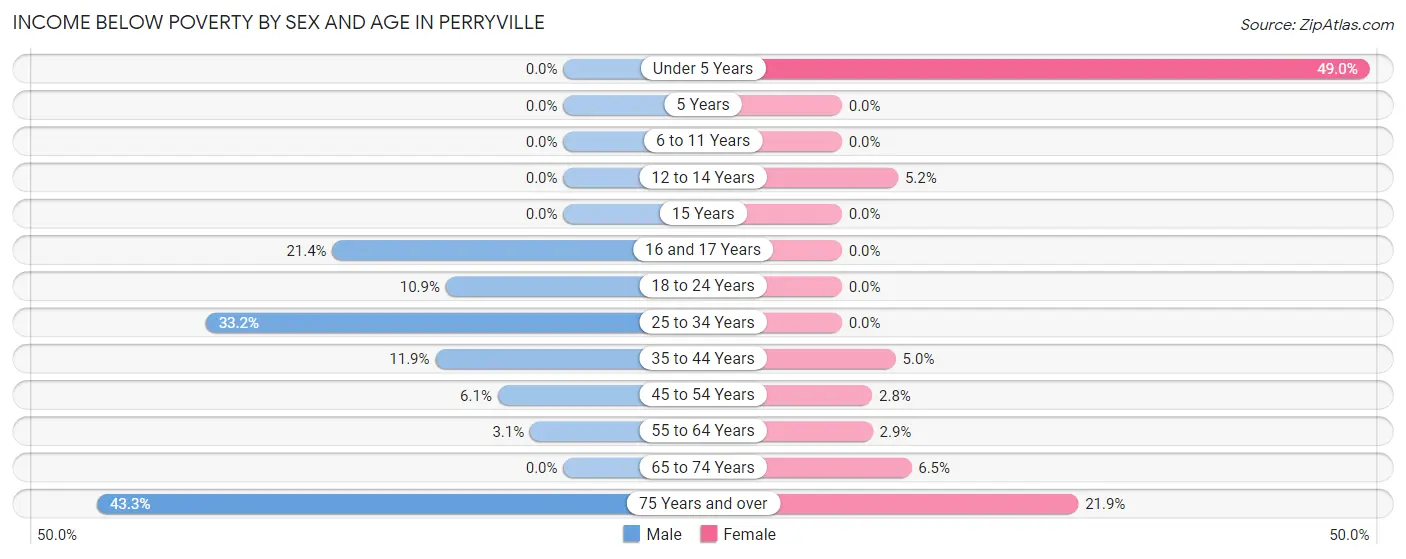
| Age Bracket | Male | Female |
| Under 5 Years | 0 (0.0%) | 95 (49.0%) |
| 5 Years | 0 (0.0%) | 0 (0.0%) |
| 6 to 11 Years | 0 (0.0%) | 0 (0.0%) |
| 12 to 14 Years | 0 (0.0%) | 5 (5.2%) |
| 15 Years | 0 (0.0%) | 0 (0.0%) |
| 16 and 17 Years | 6 (21.4%) | 0 (0.0%) |
| 18 to 24 Years | 24 (10.9%) | 0 (0.0%) |
| 25 to 34 Years | 76 (33.2%) | 0 (0.0%) |
| 35 to 44 Years | 38 (11.9%) | 17 (5.0%) |
| 45 to 54 Years | 17 (6.1%) | 5 (2.8%) |
| 55 to 64 Years | 12 (3.1%) | 13 (2.9%) |
| 65 to 74 Years | 0 (0.0%) | 18 (6.5%) |
| 75 Years and over | 29 (43.3%) | 34 (21.9%) |
| Total | 202 (9.7%) | 187 (8.2%) |
Income Above Poverty by Sex and Age in Perryville
According to the poverty statistics in Perryville, males aged under 5 years and females aged 5 years are the age groups that are most secure financially, with 100.0% of males and 100.0% of females in these age groups living above the poverty line.
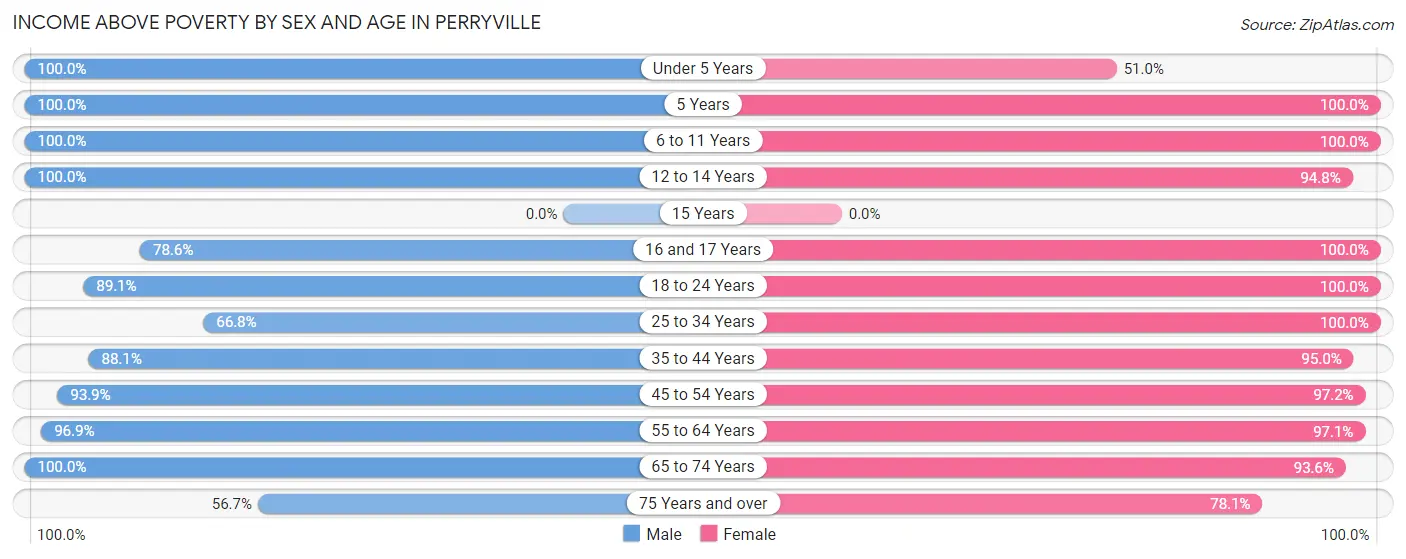
| Age Bracket | Male | Female |
| Under 5 Years | 121 (100.0%) | 99 (51.0%) |
| 5 Years | 30 (100.0%) | 120 (100.0%) |
| 6 to 11 Years | 190 (100.0%) | 77 (100.0%) |
| 12 to 14 Years | 40 (100.0%) | 91 (94.8%) |
| 15 Years | 0 (0.0%) | 0 (0.0%) |
| 16 and 17 Years | 22 (78.6%) | 32 (100.0%) |
| 18 to 24 Years | 196 (89.1%) | 136 (100.0%) |
| 25 to 34 Years | 153 (66.8%) | 214 (100.0%) |
| 35 to 44 Years | 282 (88.1%) | 323 (95.0%) |
| 45 to 54 Years | 262 (93.9%) | 173 (97.2%) |
| 55 to 64 Years | 376 (96.9%) | 442 (97.1%) |
| 65 to 74 Years | 173 (100.0%) | 261 (93.5%) |
| 75 Years and over | 38 (56.7%) | 121 (78.1%) |
| Total | 1,883 (90.3%) | 2,089 (91.8%) |
Income Below Poverty Among Married-Couple Families in Perryville
The poverty statistics for married-couple families in Perryville show that 4.9% or 37 of the total 751 families live below the poverty line. Families with no children have the highest poverty rate of 7.7%, comprising of 32 families. On the other hand, families with 3 or 4 children have the lowest poverty rate of 0.0%, which includes 0 families.
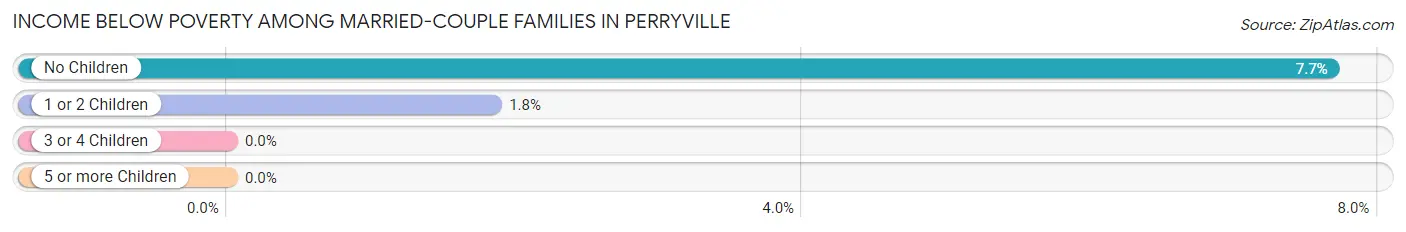
| Children | Above Poverty | Below Poverty |
| No Children | 385 (92.3%) | 32 (7.7%) |
| 1 or 2 Children | 267 (98.2%) | 5 (1.8%) |
| 3 or 4 Children | 62 (100.0%) | 0 (0.0%) |
| 5 or more Children | 0 (0.0%) | 0 (0.0%) |
| Total | 714 (95.1%) | 37 (4.9%) |
Income Below Poverty Among Single-Parent Households in Perryville
According to the poverty data in Perryville, 23.6% or 38 single-father households and 3.4% or 6 single-mother households are living below the poverty line. Among single-father households, those with no children have the highest poverty rate, with 38 households (36.2%) experiencing poverty. Likewise, among single-mother households, those with 1 or 2 children have the highest poverty rate, with 6 households (8.3%) falling below the poverty line.
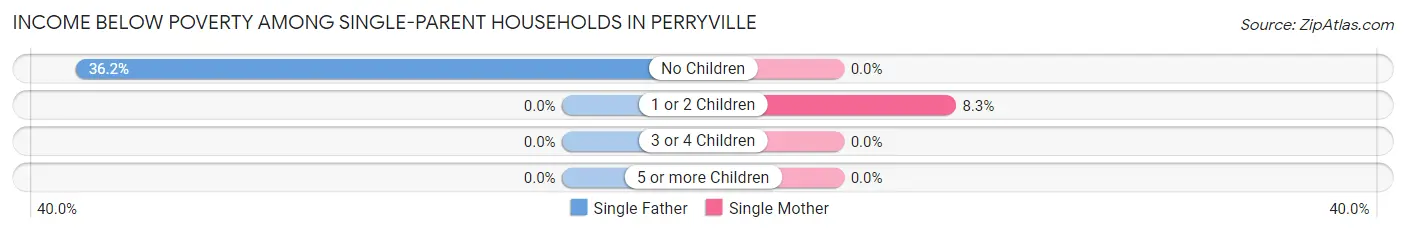
| Children | Single Father | Single Mother |
| No Children | 38 (36.2%) | 0 (0.0%) |
| 1 or 2 Children | 0 (0.0%) | 6 (8.3%) |
| 3 or 4 Children | 0 (0.0%) | 0 (0.0%) |
| 5 or more Children | 0 (0.0%) | 0 (0.0%) |
| Total | 38 (23.6%) | 6 (3.4%) |
Income Below Poverty Among Married-Couple vs Single-Parent Households in Perryville
The poverty data for Perryville shows that 37 of the married-couple family households (4.9%) and 44 of the single-parent households (12.9%) are living below the poverty level. Within the married-couple family households, those with no children have the highest poverty rate, with 32 households (7.7%) falling below the poverty line. Among the single-parent households, those with no children have the highest poverty rate, with 38 household (22.2%) living below poverty.
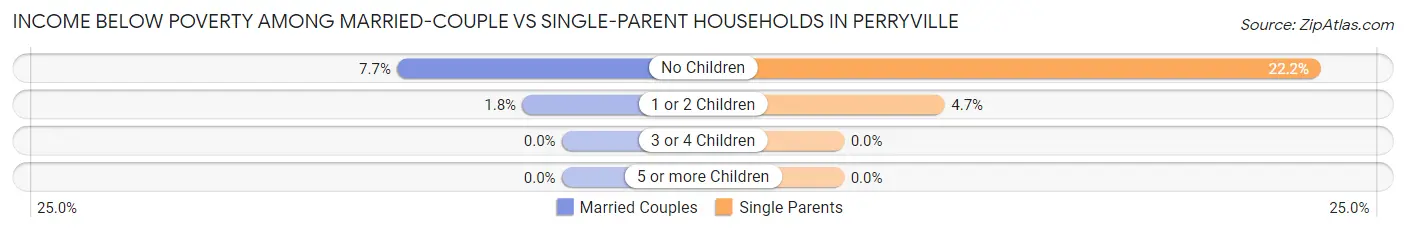
| Children | Married-Couple Families | Single-Parent Households |
| No Children | 32 (7.7%) | 38 (22.2%) |
| 1 or 2 Children | 5 (1.8%) | 6 (4.7%) |
| 3 or 4 Children | 0 (0.0%) | 0 (0.0%) |
| 5 or more Children | 0 (0.0%) | 0 (0.0%) |
| Total | 37 (4.9%) | 44 (12.9%) |
Race in Perryville
The most populous races in Perryville are White / Caucasian (3,608 | 82.0%), Black / African American (509 | 11.6%), and Two or more Races (213 | 4.8%).
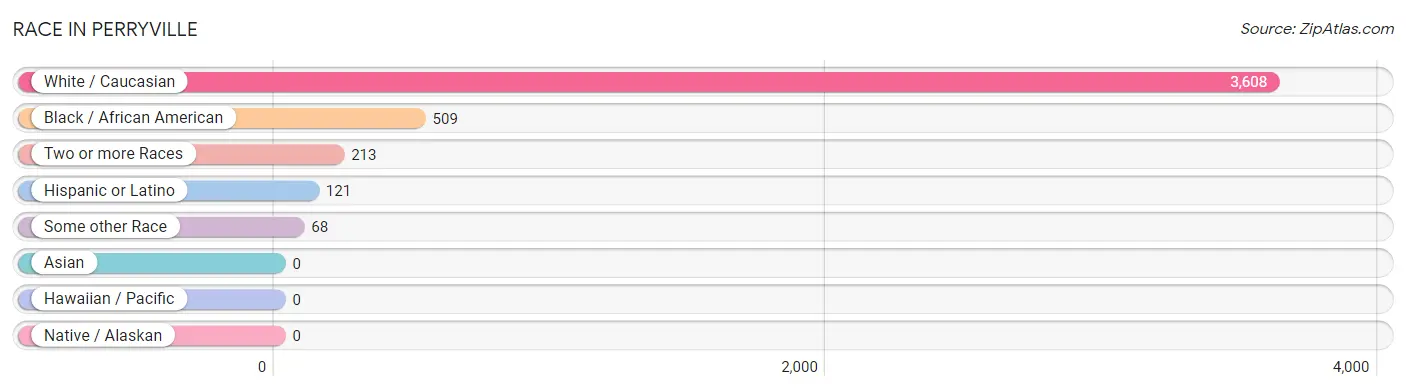
| Race | # Population | % Population |
| Asian | 0 | 0.0% |
| Black / African American | 509 | 11.6% |
| Hawaiian / Pacific | 0 | 0.0% |
| Hispanic or Latino | 121 | 2.8% |
| Native / Alaskan | 0 | 0.0% |
| White / Caucasian | 3,608 | 82.0% |
| Two or more Races | 213 | 4.8% |
| Some other Race | 68 | 1.5% |
| Total | 4,398 | 100.0% |
Ancestry in Perryville
The most populous ancestries reported in Perryville are English (882 | 20.1%), Irish (755 | 17.2%), German (752 | 17.1%), American (360 | 8.2%), and Italian (307 | 7.0%), together accounting for 69.5% of all Perryville residents.
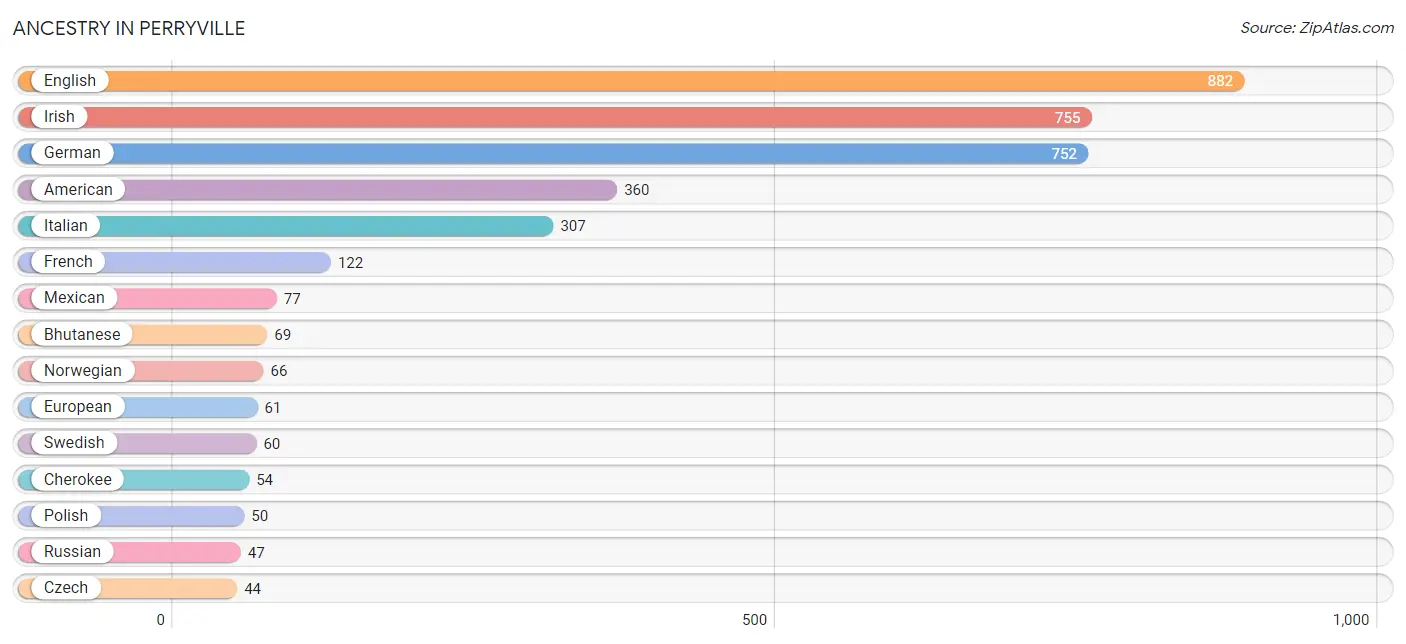
| Ancestry | # Population | % Population |
| African | 8 | 0.2% |
| American | 360 | 8.2% |
| Bhutanese | 69 | 1.6% |
| Brazilian | 14 | 0.3% |
| Cherokee | 54 | 1.2% |
| Czech | 44 | 1.0% |
| Dominican | 33 | 0.7% |
| Dutch | 15 | 0.3% |
| Eastern European | 12 | 0.3% |
| English | 882 | 20.1% |
| European | 61 | 1.4% |
| French | 122 | 2.8% |
| French Canadian | 25 | 0.6% |
| German | 752 | 17.1% |
| Hungarian | 29 | 0.7% |
| Irish | 755 | 17.2% |
| Italian | 307 | 7.0% |
| Lithuanian | 16 | 0.4% |
| Mexican | 77 | 1.8% |
| Norwegian | 66 | 1.5% |
| Polish | 50 | 1.1% |
| Puerto Rican | 11 | 0.3% |
| Russian | 47 | 1.1% |
| Scotch-Irish | 20 | 0.4% |
| Scottish | 20 | 0.4% |
| Slavic | 24 | 0.5% |
| Subsaharan African | 8 | 0.2% |
| Swedish | 60 | 1.4% |
| Welsh | 29 | 0.7% | View All 29 Rows |
Immigrants in Perryville
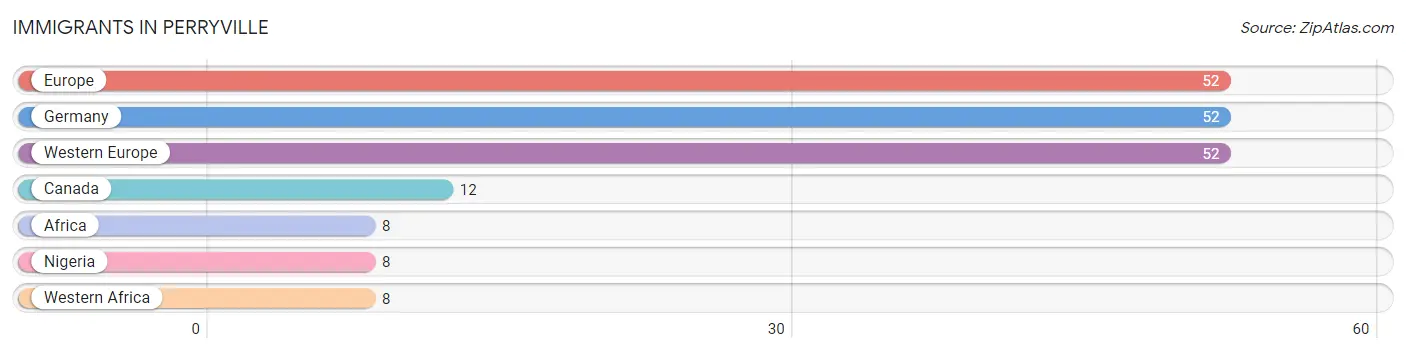
The most numerous immigrant groups reported in Perryville came from Europe (52 | 1.2%), Germany (52 | 1.2%), Western Europe (52 | 1.2%), Canada (12 | 0.3%), and Africa (8 | 0.2%), together accounting for 4.0% of all Perryville residents.
| Immigration Origin | # Population | % Population |
| Africa | 8 | 0.2% |
| Canada | 12 | 0.3% |
| Europe | 52 | 1.2% |
| Germany | 52 | 1.2% |
| Nigeria | 8 | 0.2% |
| Western Africa | 8 | 0.2% |
| Western Europe | 52 | 1.2% | View All 7 Rows |
Sex and Age in Perryville
Sex and Age in Perryville
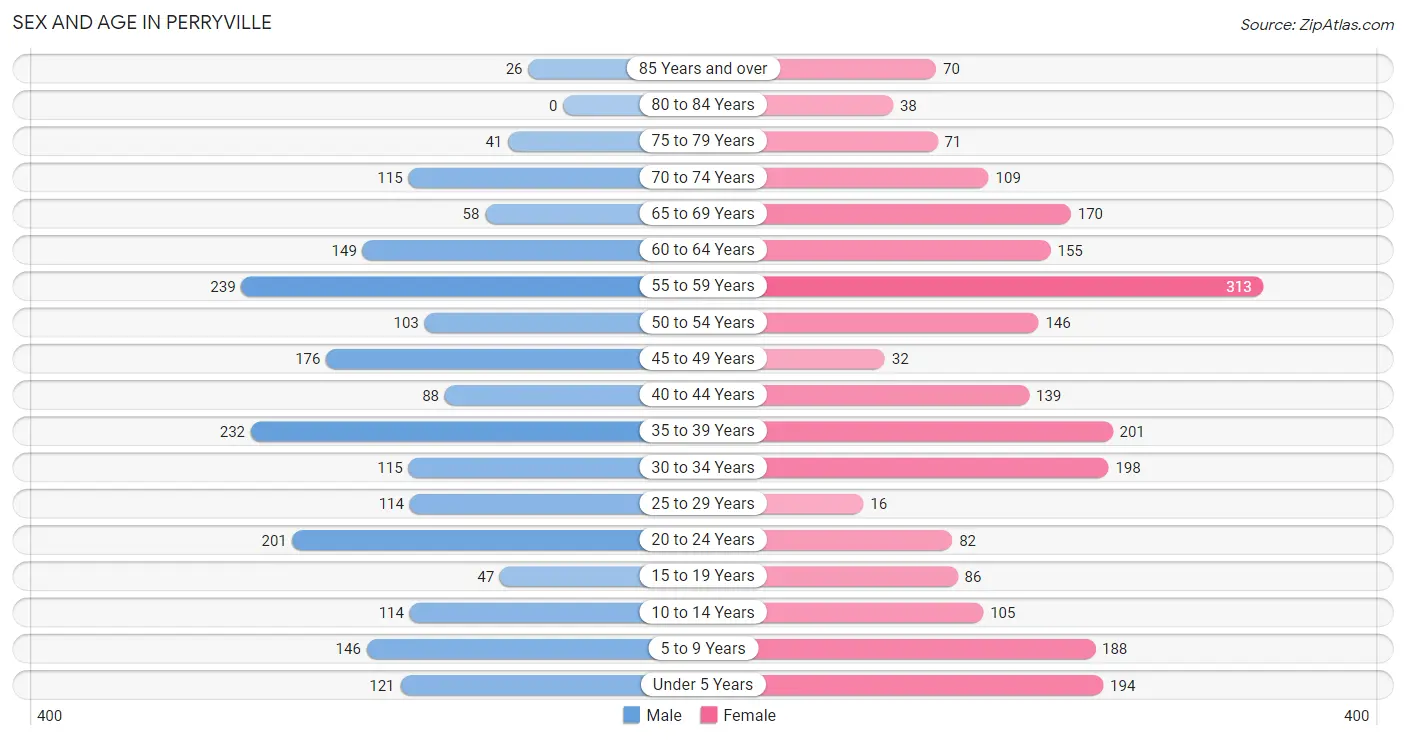
The most populous age groups in Perryville are 55 to 59 Years (239 | 11.5%) for men and 55 to 59 Years (313 | 13.5%) for women.
| Age Bracket | Male | Female |
| Under 5 Years | 121 (5.8%) | 194 (8.4%) |
| 5 to 9 Years | 146 (7.0%) | 188 (8.1%) |
| 10 to 14 Years | 114 (5.5%) | 105 (4.5%) |
| 15 to 19 Years | 47 (2.2%) | 86 (3.7%) |
| 20 to 24 Years | 201 (9.6%) | 82 (3.5%) |
| 25 to 29 Years | 114 (5.5%) | 16 (0.7%) |
| 30 to 34 Years | 115 (5.5%) | 198 (8.6%) |
| 35 to 39 Years | 232 (11.1%) | 201 (8.7%) |
| 40 to 44 Years | 88 (4.2%) | 139 (6.0%) |
| 45 to 49 Years | 176 (8.4%) | 32 (1.4%) |
| 50 to 54 Years | 103 (4.9%) | 146 (6.3%) |
| 55 to 59 Years | 239 (11.5%) | 313 (13.5%) |
| 60 to 64 Years | 149 (7.1%) | 155 (6.7%) |
| 65 to 69 Years | 58 (2.8%) | 170 (7.3%) |
| 70 to 74 Years | 115 (5.5%) | 109 (4.7%) |
| 75 to 79 Years | 41 (2.0%) | 71 (3.1%) |
| 80 to 84 Years | 0 (0.0%) | 38 (1.6%) |
| 85 Years and over | 26 (1.3%) | 70 (3.0%) |
| Total | 2,085 (100.0%) | 2,313 (100.0%) |
Families and Households in Perryville
Median Family Size in Perryville
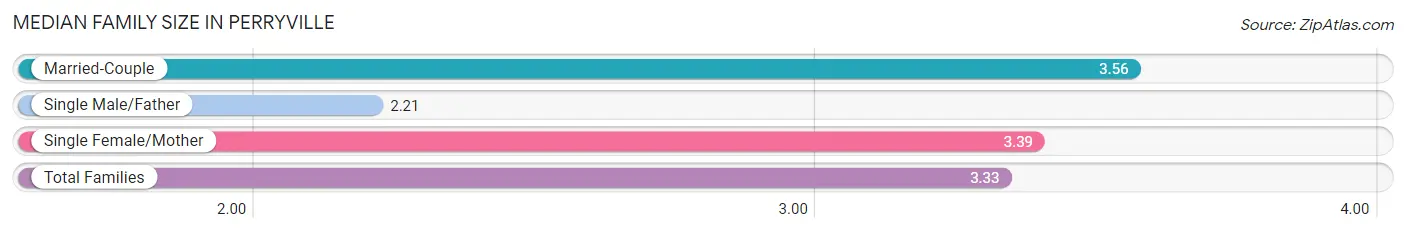
The median family size in Perryville is 3.33 persons per family, with married-couple families (751 | 68.8%) accounting for the largest median family size of 3.56 persons per family. On the other hand, single male/father families (161 | 14.8%) represent the smallest median family size with 2.21 persons per family.
| Family Type | # Families | Family Size |
| Married-Couple | 751 (68.8%) | 3.56 |
| Single Male/Father | 161 (14.8%) | 2.21 |
| Single Female/Mother | 179 (16.4%) | 3.39 |
| Total Families | 1,091 (100.0%) | 3.33 |
Median Household Size in Perryville
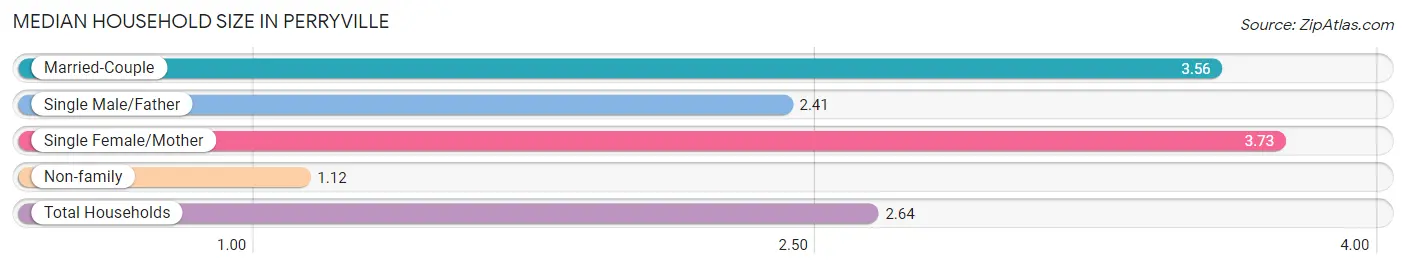
The median household size in Perryville is 2.64 persons per household, with single female/mother households (179 | 10.8%) accounting for the largest median household size of 3.73 persons per household. non-family households (561 | 34.0%) represent the smallest median household size with 1.12 persons per household.
| Household Type | # Households | Household Size |
| Married-Couple | 751 (45.5%) | 3.56 |
| Single Male/Father | 161 (9.8%) | 2.41 |
| Single Female/Mother | 179 (10.8%) | 3.73 |
| Non-family | 561 (34.0%) | 1.12 |
| Total Households | 1,652 (100.0%) | 2.64 |
Household Size by Marriage Status in Perryville
Out of a total of 1,652 households in Perryville, 1,091 (66.0%) are family households, while 561 (34.0%) are nonfamily households. The most numerous type of family households are 2-person households, comprising 395, and the most common type of nonfamily households are 1-person households, comprising 482.
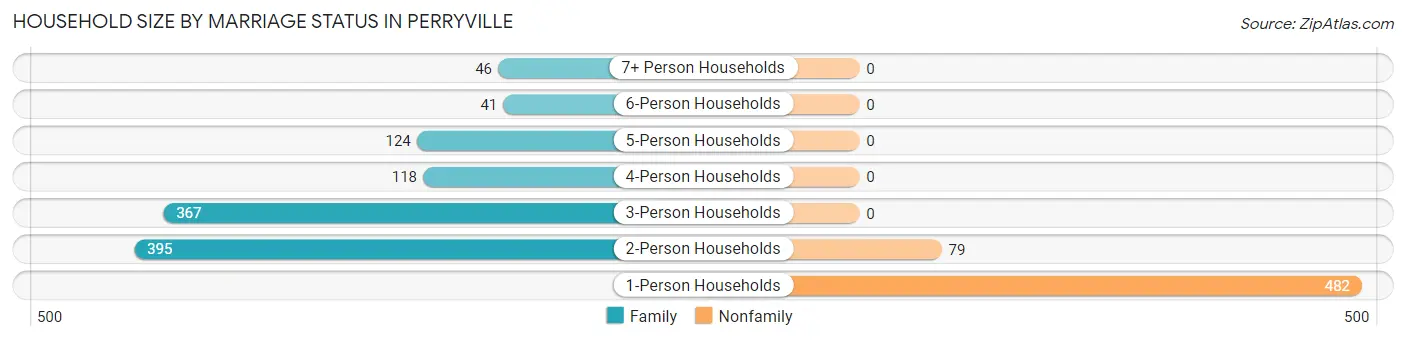
| Household Size | Family Households | Nonfamily Households |
| 1-Person Households | - | 482 (29.2%) |
| 2-Person Households | 395 (23.9%) | 79 (4.8%) |
| 3-Person Households | 367 (22.2%) | 0 (0.0%) |
| 4-Person Households | 118 (7.1%) | 0 (0.0%) |
| 5-Person Households | 124 (7.5%) | 0 (0.0%) |
| 6-Person Households | 41 (2.5%) | 0 (0.0%) |
| 7+ Person Households | 46 (2.8%) | 0 (0.0%) |
| Total | 1,091 (66.0%) | 561 (34.0%) |
Female Fertility in Perryville
Fertility by Age in Perryville
Average fertility rate in Perryville is 23.0 births per 1,000 women. Women in the age bracket of 20 to 34 years have the highest fertility rate with 57.0 births per 1,000 women. Women in the age bracket of 20 to 34 years acount for 100.0% of all women with births.
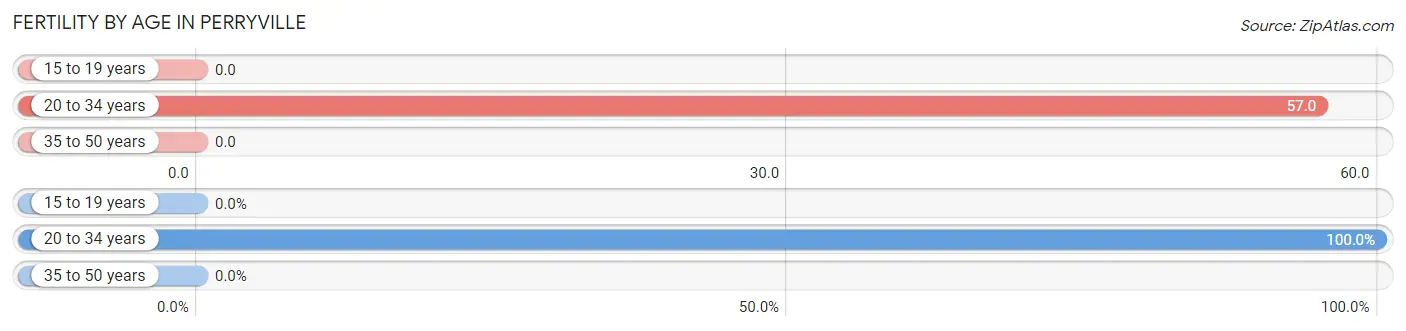
| Age Bracket | Women with Births | Births / 1,000 Women |
| 15 to 19 years | 0 (0.0%) | 0.0 |
| 20 to 34 years | 17 (100.0%) | 57.0 |
| 35 to 50 years | 0 (0.0%) | 0.0 |
| Total | 17 (100.0%) | 23.0 |
Fertility by Age by Marriage Status in Perryville
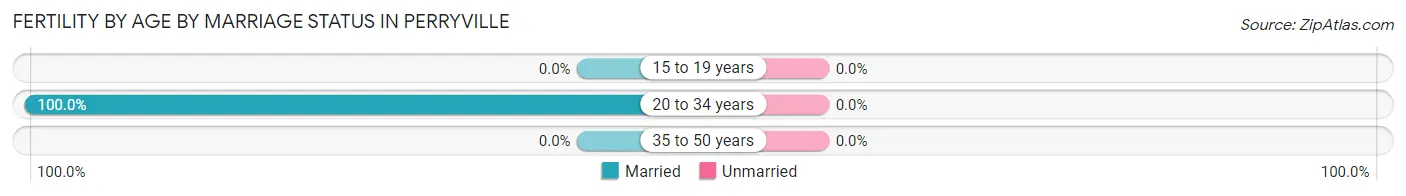
| Age Bracket | Married | Unmarried |
| 15 to 19 years | 0 (0.0%) | 0 (0.0%) |
| 20 to 34 years | 17 (100.0%) | 0 (0.0%) |
| 35 to 50 years | 0 (0.0%) | 0 (0.0%) |
| Total | 17 (100.0%) | 0 (0.0%) |
Fertility by Education in Perryville
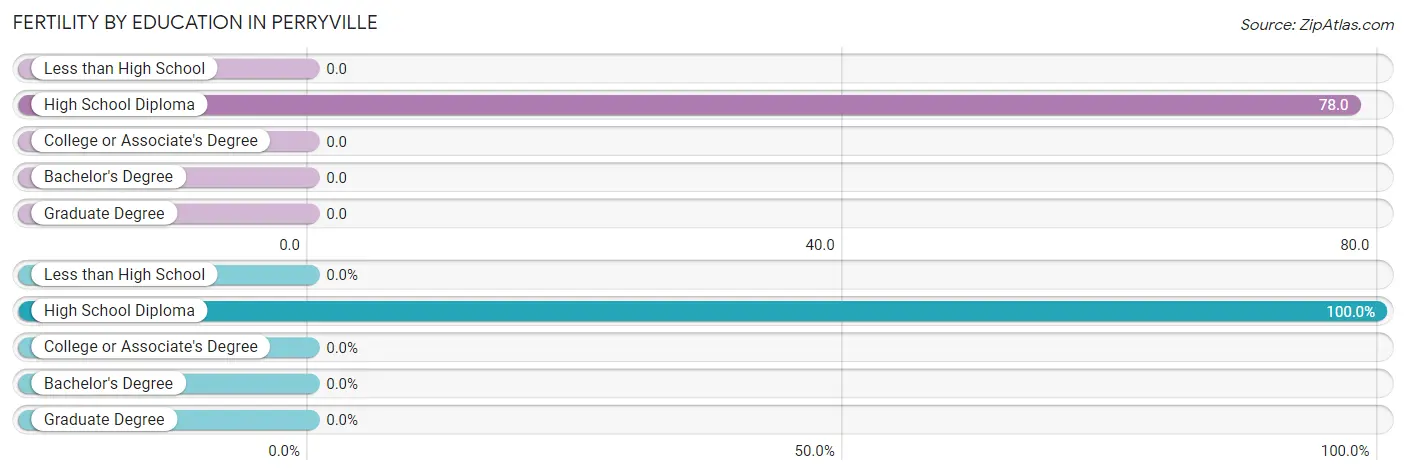
| Educational Attainment | Women with Births | Births / 1,000 Women |
| Less than High School | 0 (0.0%) | 0.0 |
| High School Diploma | 17 (100.0%) | 78.0 |
| College or Associate's Degree | 0 (0.0%) | 0.0 |
| Bachelor's Degree | 0 (0.0%) | 0.0 |
| Graduate Degree | 0 (0.0%) | 0.0 |
| Total | 17 (100.0%) | 23.0 |
Fertility by Education by Marriage Status in Perryville
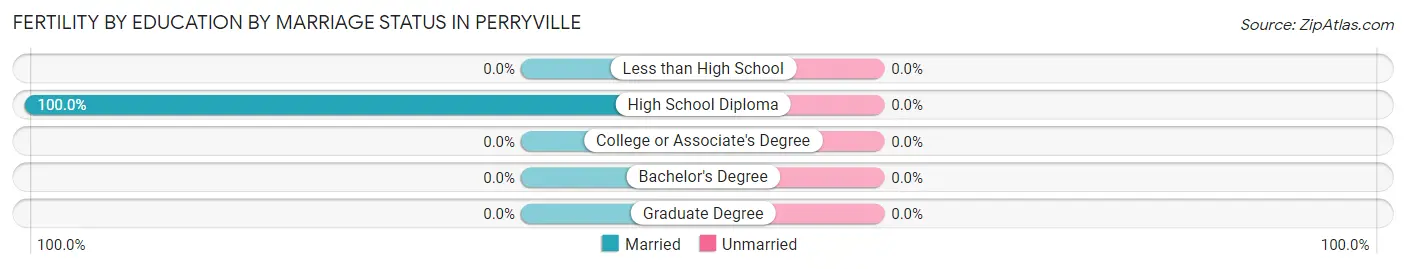
| Educational Attainment | Married | Unmarried |
| Less than High School | 0 (0.0%) | 0 (0.0%) |
| High School Diploma | 17 (100.0%) | 0 (0.0%) |
| College or Associate's Degree | 0 (0.0%) | 0 (0.0%) |
| Bachelor's Degree | 0 (0.0%) | 0 (0.0%) |
| Graduate Degree | 0 (0.0%) | 0 (0.0%) |
| Total | 17 (100.0%) | 0 (0.0%) |
Employment Characteristics in Perryville
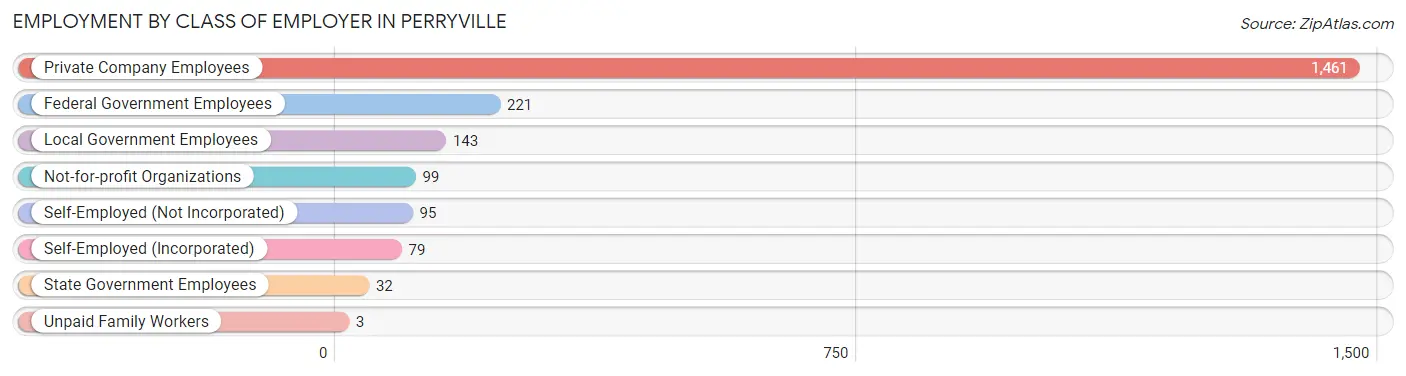
Employment by Class of Employer in Perryville
Among the 2,133 employed individuals in Perryville, private company employees (1,461 | 68.5%), federal government employees (221 | 10.4%), and local government employees (143 | 6.7%) make up the most common classes of employment.
| Employer Class | # Employees | % Employees |
| Private Company Employees | 1,461 | 68.5% |
| Self-Employed (Incorporated) | 79 | 3.7% |
| Self-Employed (Not Incorporated) | 95 | 4.4% |
| Not-for-profit Organizations | 99 | 4.6% |
| Local Government Employees | 143 | 6.7% |
| State Government Employees | 32 | 1.5% |
| Federal Government Employees | 221 | 10.4% |
| Unpaid Family Workers | 3 | 0.1% |
| Total | 2,133 | 100.0% |
Employment Status by Age in Perryville
According to the labor force statistics for Perryville, out of the total population over 16 years of age (3,530), 64.8% or 2,287 individuals are in the labor force, with 5.3% or 121 of them unemployed. The age group with the highest labor force participation rate is 25 to 29 years, with 85.4% or 111 individuals in the labor force. Within the labor force, the 30 to 34 years age range has the highest percentage of unemployed individuals, with 16.3% or 38 of them being unemployed.
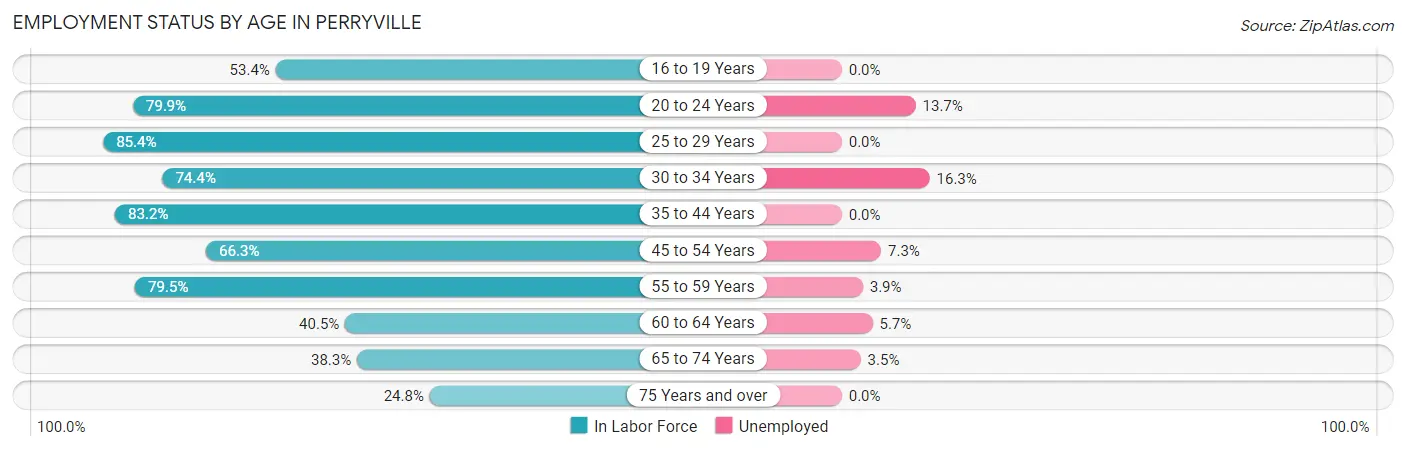
| Age Bracket | In Labor Force | Unemployed |
| 16 to 19 Years | 71 (53.4%) | 0 (0.0%) |
| 20 to 24 Years | 226 (79.9%) | 31 (13.7%) |
| 25 to 29 Years | 111 (85.4%) | 0 (0.0%) |
| 30 to 34 Years | 233 (74.4%) | 38 (16.3%) |
| 35 to 44 Years | 549 (83.2%) | 0 (0.0%) |
| 45 to 54 Years | 303 (66.3%) | 22 (7.3%) |
| 55 to 59 Years | 439 (79.5%) | 17 (3.9%) |
| 60 to 64 Years | 123 (40.5%) | 7 (5.7%) |
| 65 to 74 Years | 173 (38.3%) | 6 (3.5%) |
| 75 Years and over | 61 (24.8%) | 0 (0.0%) |
| Total | 2,287 (64.8%) | 121 (5.3%) |
Employment Status by Educational Attainment in Perryville
According to labor force statistics for Perryville, 72.8% of individuals (1,759) out of the total population between 25 and 64 years of age (2,416) are in the labor force, with 4.8% or 84 of them being unemployed. The group with the highest labor force participation rate are those with the educational attainment of less than high school, with 89.4% or 143 individuals in the labor force. Within the labor force, individuals with high school diploma education have the highest percentage of unemployment, with 8.6% or 46 of them being unemployed.
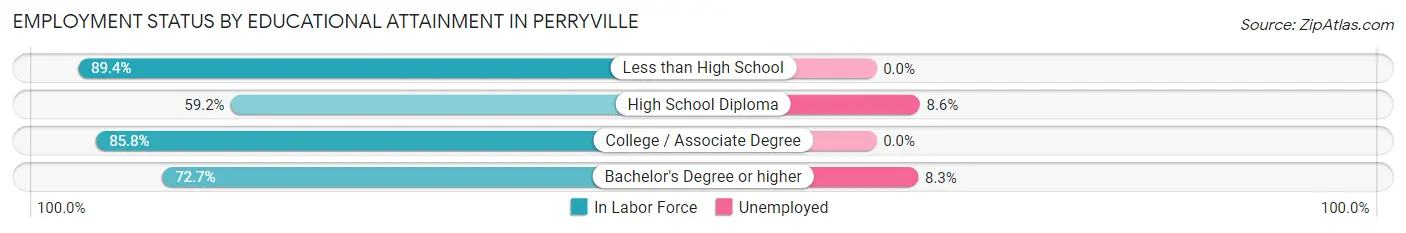
| Educational Attainment | In Labor Force | Unemployed |
| Less than High School | 143 (89.4%) | 0 (0.0%) |
| High School Diploma | 532 (59.2%) | 77 (8.6%) |
| College / Associate Degree | 627 (85.8%) | 0 (0.0%) |
| Bachelor's Degree or higher | 456 (72.7%) | 52 (8.3%) |
| Total | 1,759 (72.8%) | 116 (4.8%) |
Employment Occupations by Sex in Perryville
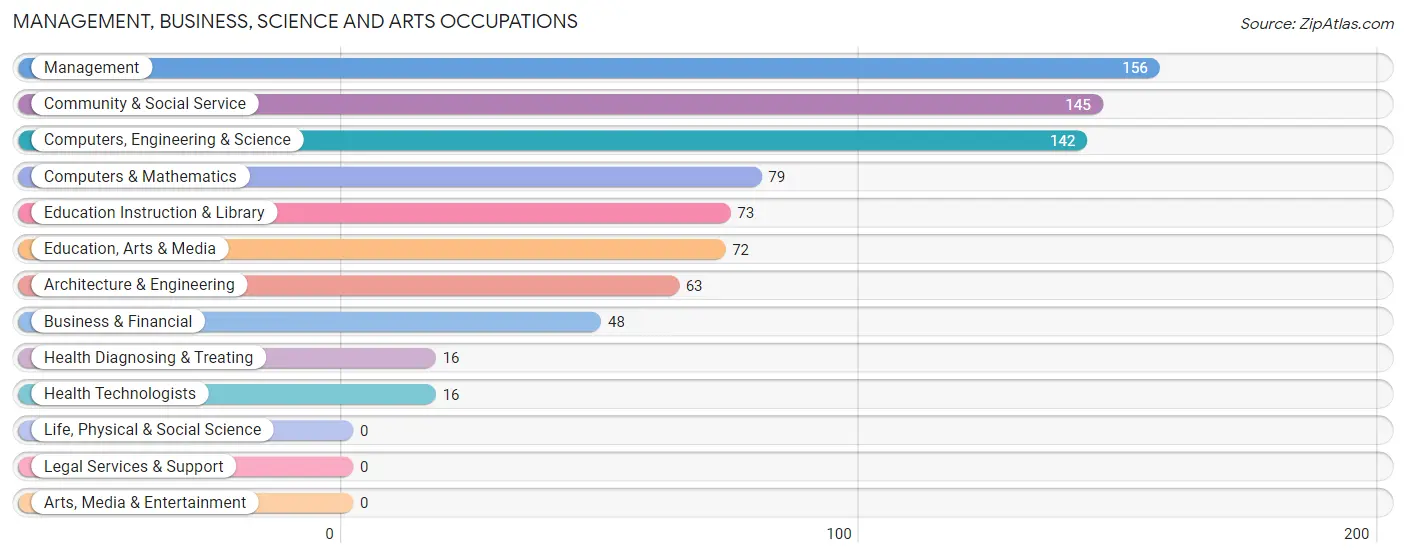
Management, Business, Science and Arts Occupations
The most common Management, Business, Science and Arts occupations in Perryville are Management (156 | 7.2%), Community & Social Service (145 | 6.7%), Computers, Engineering & Science (142 | 6.6%), Computers & Mathematics (79 | 3.6%), and Education Instruction & Library (73 | 3.4%).
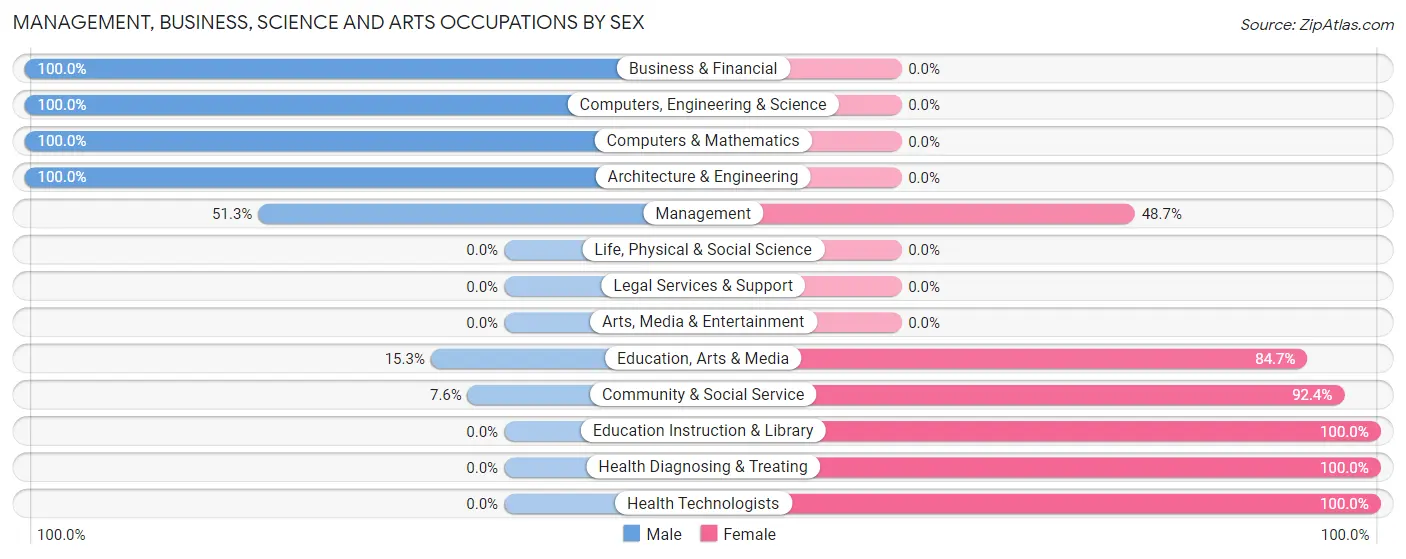
Management, Business, Science and Arts Occupations by Sex
Within the Management, Business, Science and Arts occupations in Perryville, the most male-oriented occupations are Business & Financial (100.0%), Computers, Engineering & Science (100.0%), and Computers & Mathematics (100.0%), while the most female-oriented occupations are Education Instruction & Library (100.0%), Health Diagnosing & Treating (100.0%), and Health Technologists (100.0%).
| Occupation | Male | Female |
| Management | 80 (51.3%) | 76 (48.7%) |
| Business & Financial | 48 (100.0%) | 0 (0.0%) |
| Computers, Engineering & Science | 142 (100.0%) | 0 (0.0%) |
| Computers & Mathematics | 79 (100.0%) | 0 (0.0%) |
| Architecture & Engineering | 63 (100.0%) | 0 (0.0%) |
| Life, Physical & Social Science | 0 (0.0%) | 0 (0.0%) |
| Community & Social Service | 11 (7.6%) | 134 (92.4%) |
| Education, Arts & Media | 11 (15.3%) | 61 (84.7%) |
| Legal Services & Support | 0 (0.0%) | 0 (0.0%) |
| Education Instruction & Library | 0 (0.0%) | 73 (100.0%) |
| Arts, Media & Entertainment | 0 (0.0%) | 0 (0.0%) |
| Health Diagnosing & Treating | 0 (0.0%) | 16 (100.0%) |
| Health Technologists | 0 (0.0%) | 16 (100.0%) |
| Total (Category) | 281 (55.4%) | 226 (44.6%) |
| Total (Overall) | 1,177 (54.3%) | 991 (45.7%) |
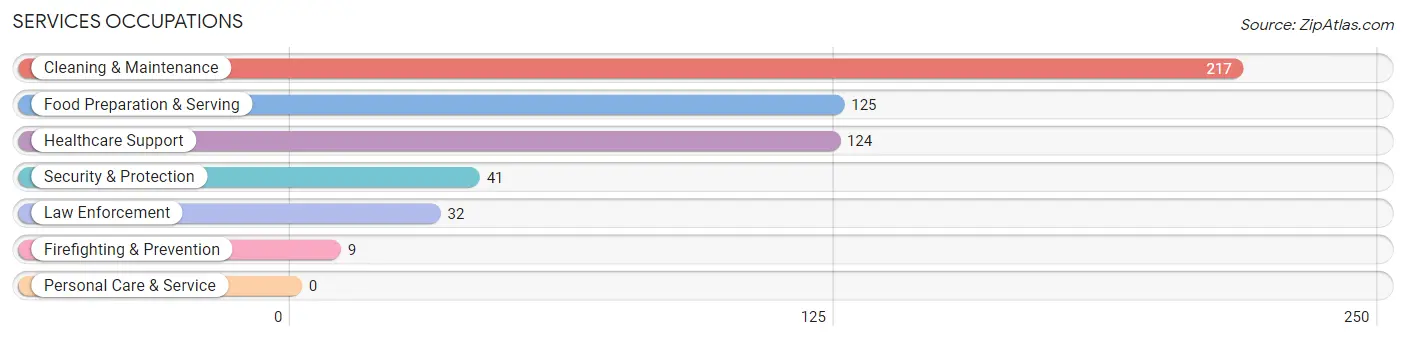
Services Occupations
The most common Services occupations in Perryville are Cleaning & Maintenance (217 | 10.0%), Food Preparation & Serving (125 | 5.8%), Healthcare Support (124 | 5.7%), Security & Protection (41 | 1.9%), and Law Enforcement (32 | 1.5%).
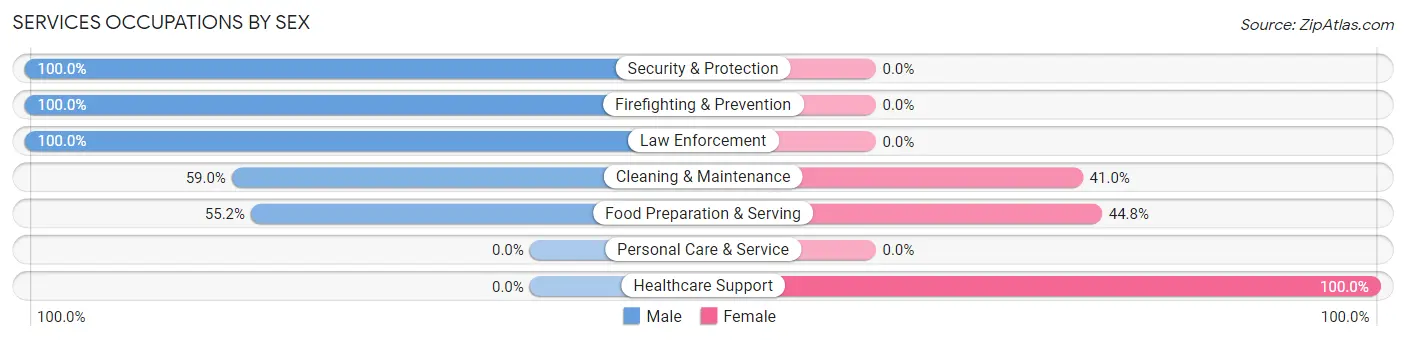
Services Occupations by Sex
Within the Services occupations in Perryville, the most male-oriented occupations are Security & Protection (100.0%), Firefighting & Prevention (100.0%), and Law Enforcement (100.0%), while the most female-oriented occupations are Healthcare Support (100.0%), Food Preparation & Serving (44.8%), and Cleaning & Maintenance (41.0%).
| Occupation | Male | Female |
| Healthcare Support | 0 (0.0%) | 124 (100.0%) |
| Security & Protection | 41 (100.0%) | 0 (0.0%) |
| Firefighting & Prevention | 9 (100.0%) | 0 (0.0%) |
| Law Enforcement | 32 (100.0%) | 0 (0.0%) |
| Food Preparation & Serving | 69 (55.2%) | 56 (44.8%) |
| Cleaning & Maintenance | 128 (59.0%) | 89 (41.0%) |
| Personal Care & Service | 0 (0.0%) | 0 (0.0%) |
| Total (Category) | 238 (46.9%) | 269 (53.1%) |
| Total (Overall) | 1,177 (54.3%) | 991 (45.7%) |
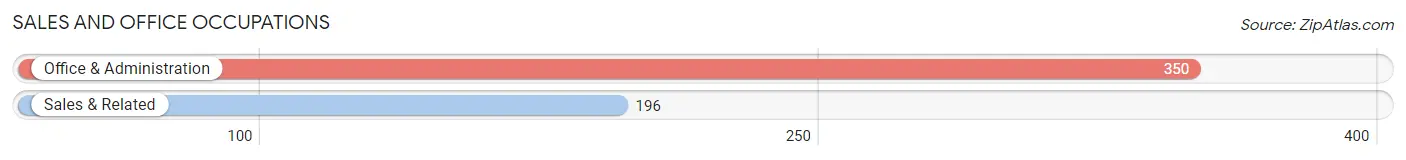
Sales and Office Occupations
The most common Sales and Office occupations in Perryville are Office & Administration (350 | 16.1%), and Sales & Related (196 | 9.0%).
Sales and Office Occupations by Sex
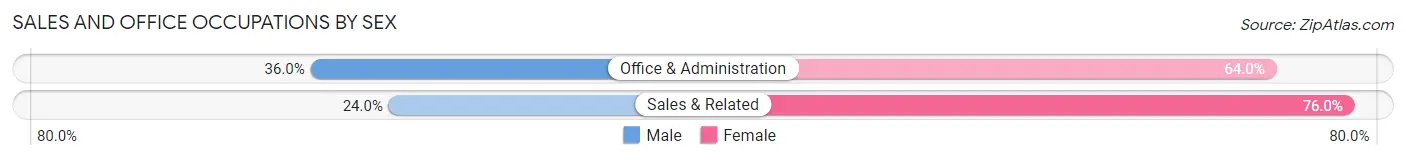
| Occupation | Male | Female |
| Sales & Related | 47 (24.0%) | 149 (76.0%) |
| Office & Administration | 126 (36.0%) | 224 (64.0%) |
| Total (Category) | 173 (31.7%) | 373 (68.3%) |
| Total (Overall) | 1,177 (54.3%) | 991 (45.7%) |
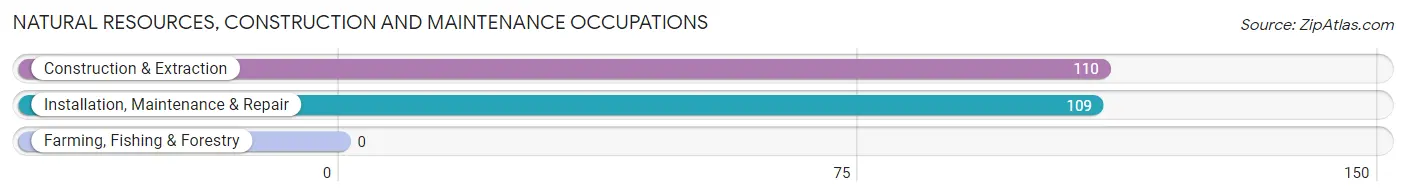
Natural Resources, Construction and Maintenance Occupations
The most common Natural Resources, Construction and Maintenance occupations in Perryville are Construction & Extraction (110 | 5.1%), and Installation, Maintenance & Repair (109 | 5.0%).
Natural Resources, Construction and Maintenance Occupations by Sex
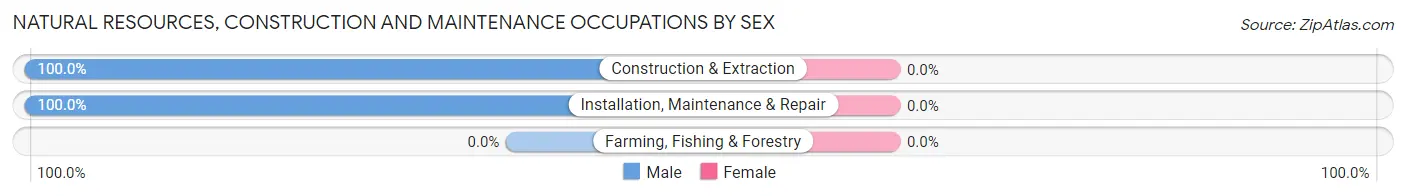
| Occupation | Male | Female |
| Farming, Fishing & Forestry | 0 (0.0%) | 0 (0.0%) |
| Construction & Extraction | 110 (100.0%) | 0 (0.0%) |
| Installation, Maintenance & Repair | 109 (100.0%) | 0 (0.0%) |
| Total (Category) | 219 (100.0%) | 0 (0.0%) |
| Total (Overall) | 1,177 (54.3%) | 991 (45.7%) |
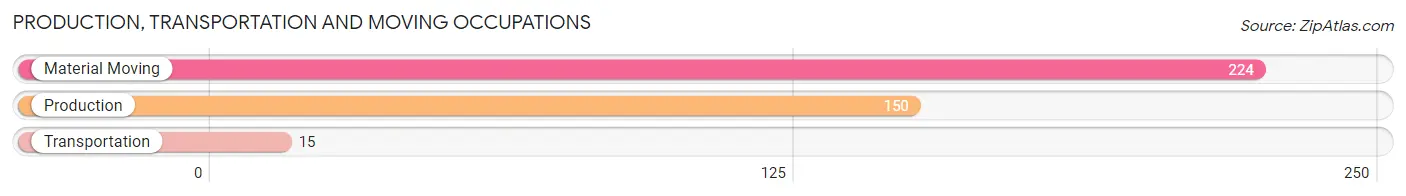
Production, Transportation and Moving Occupations
The most common Production, Transportation and Moving occupations in Perryville are Material Moving (224 | 10.3%), Production (150 | 6.9%), and Transportation (15 | 0.7%).
Production, Transportation and Moving Occupations by Sex
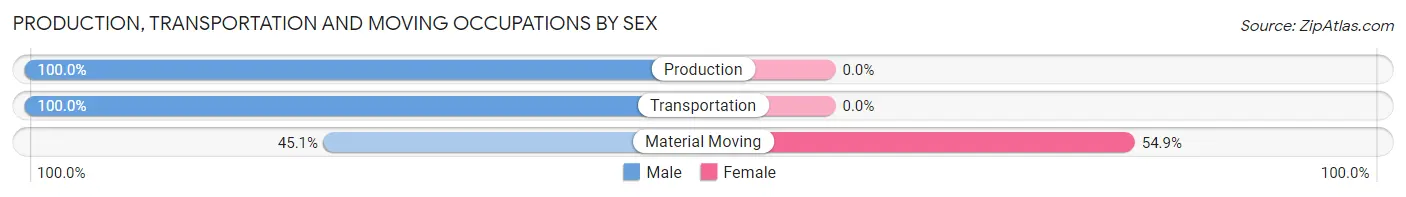
| Occupation | Male | Female |
| Production | 150 (100.0%) | 0 (0.0%) |
| Transportation | 15 (100.0%) | 0 (0.0%) |
| Material Moving | 101 (45.1%) | 123 (54.9%) |
| Total (Category) | 266 (68.4%) | 123 (31.6%) |
| Total (Overall) | 1,177 (54.3%) | 991 (45.7%) |
Employment Industries by Sex in Perryville
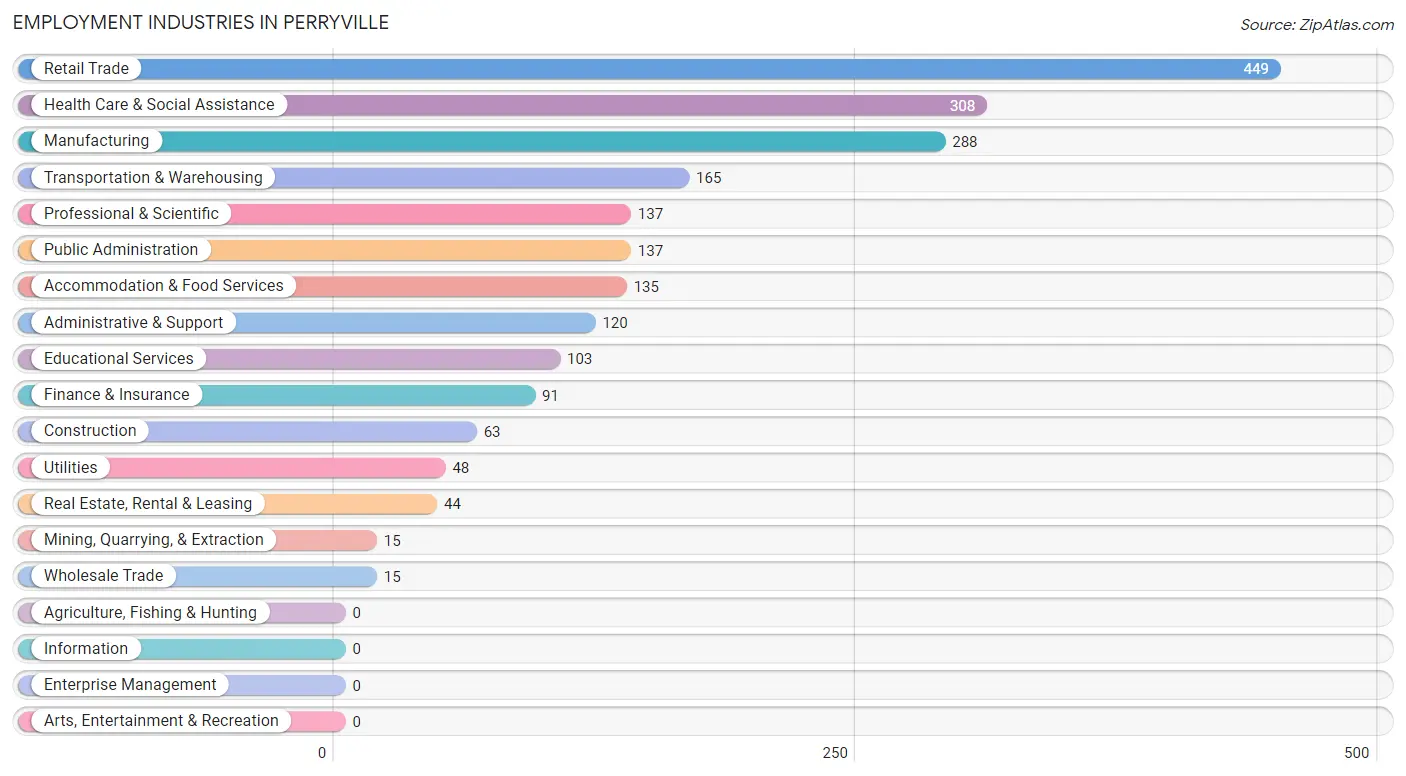
Employment Industries in Perryville
The major employment industries in Perryville include Retail Trade (449 | 20.7%), Health Care & Social Assistance (308 | 14.2%), Manufacturing (288 | 13.3%), Transportation & Warehousing (165 | 7.6%), and Professional & Scientific (137 | 6.3%).
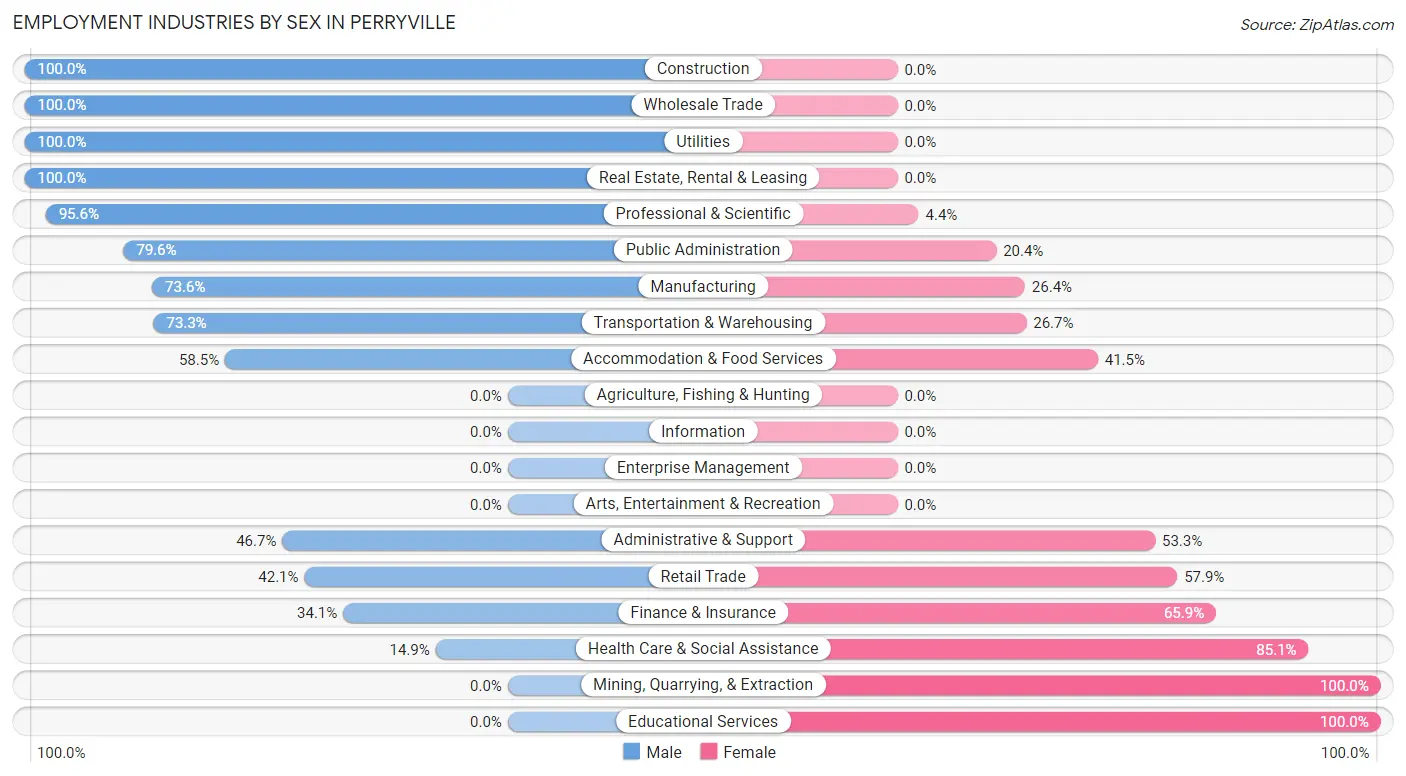
Employment Industries by Sex in Perryville
The Perryville industries that see more men than women are Construction (100.0%), Wholesale Trade (100.0%), and Utilities (100.0%), whereas the industries that tend to have a higher number of women are Mining, Quarrying, & Extraction (100.0%), Educational Services (100.0%), and Health Care & Social Assistance (85.1%).
| Industry | Male | Female |
| Agriculture, Fishing & Hunting | 0 (0.0%) | 0 (0.0%) |
| Mining, Quarrying, & Extraction | 0 (0.0%) | 15 (100.0%) |
| Construction | 63 (100.0%) | 0 (0.0%) |
| Manufacturing | 212 (73.6%) | 76 (26.4%) |
| Wholesale Trade | 15 (100.0%) | 0 (0.0%) |
| Retail Trade | 189 (42.1%) | 260 (57.9%) |
| Transportation & Warehousing | 121 (73.3%) | 44 (26.7%) |
| Utilities | 48 (100.0%) | 0 (0.0%) |
| Information | 0 (0.0%) | 0 (0.0%) |
| Finance & Insurance | 31 (34.1%) | 60 (65.9%) |
| Real Estate, Rental & Leasing | 44 (100.0%) | 0 (0.0%) |
| Professional & Scientific | 131 (95.6%) | 6 (4.4%) |
| Enterprise Management | 0 (0.0%) | 0 (0.0%) |
| Administrative & Support | 56 (46.7%) | 64 (53.3%) |
| Educational Services | 0 (0.0%) | 103 (100.0%) |
| Health Care & Social Assistance | 46 (14.9%) | 262 (85.1%) |
| Arts, Entertainment & Recreation | 0 (0.0%) | 0 (0.0%) |
| Accommodation & Food Services | 79 (58.5%) | 56 (41.5%) |
| Public Administration | 109 (79.6%) | 28 (20.4%) |
| Total | 1,177 (54.3%) | 991 (45.7%) |
Education in Perryville
School Enrollment in Perryville
The most common levels of schooling among the 564 students in Perryville are elementary school (190 | 33.7%), middle school (167 | 29.6%), and high school (77 | 13.7%).
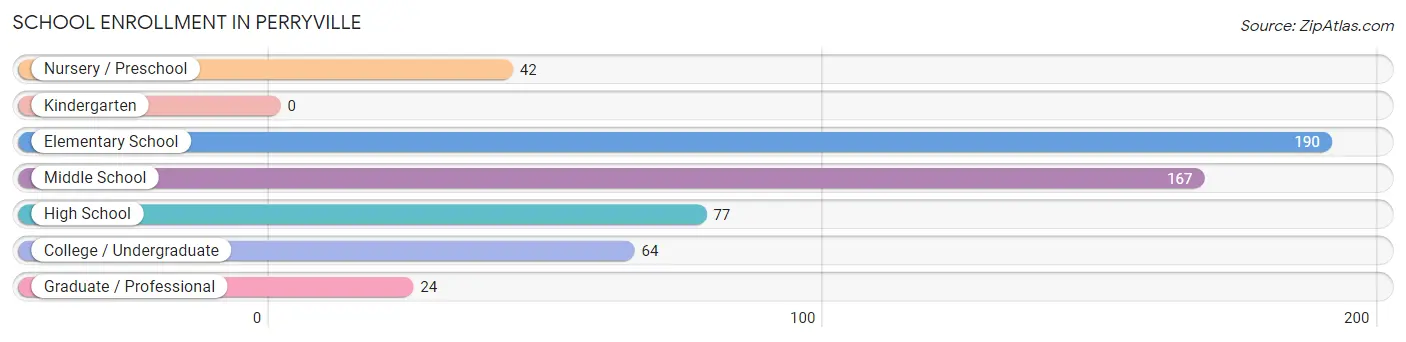
| School Level | # Students | % Students |
| Nursery / Preschool | 42 | 7.4% |
| Kindergarten | 0 | 0.0% |
| Elementary School | 190 | 33.7% |
| Middle School | 167 | 29.6% |
| High School | 77 | 13.7% |
| College / Undergraduate | 64 | 11.4% |
| Graduate / Professional | 24 | 4.3% |
| Total | 564 | 100.0% |
School Enrollment by Age by Funding Source in Perryville
Out of a total of 564 students who are enrolled in schools in Perryville, 27 (4.8%) attend a private institution, while the remaining 537 (95.2%) are enrolled in public schools. The age group of 25 to 34 year olds has the highest likelihood of being enrolled in private schools, with 11 (100.0% in the age bracket) enrolled. Conversely, the age group of 3 to 4 year olds has the lowest likelihood of being enrolled in a private school, with 42 (100.0% in the age bracket) attending a public institution.
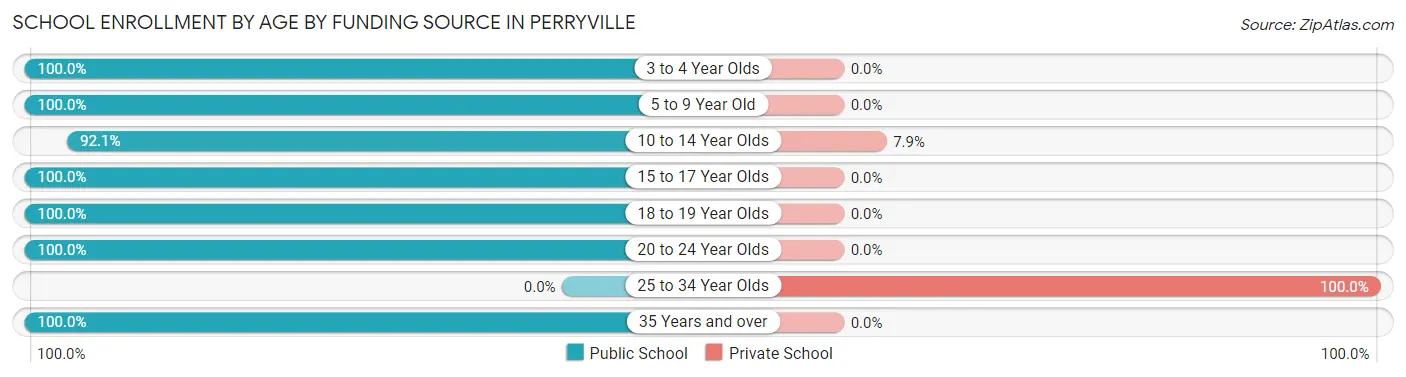
| Age Bracket | Public School | Private School |
| 3 to 4 Year Olds | 42 (100.0%) | 0 (0.0%) |
| 5 to 9 Year Old | 164 (100.0%) | 0 (0.0%) |
| 10 to 14 Year Olds | 186 (92.1%) | 16 (7.9%) |
| 15 to 17 Year Olds | 60 (100.0%) | 0 (0.0%) |
| 18 to 19 Year Olds | 19 (100.0%) | 0 (0.0%) |
| 20 to 24 Year Olds | 53 (100.0%) | 0 (0.0%) |
| 25 to 34 Year Olds | 0 (0.0%) | 11 (100.0%) |
| 35 Years and over | 13 (100.0%) | 0 (0.0%) |
| Total | 537 (95.2%) | 27 (4.8%) |
Educational Attainment by Field of Study in Perryville
Business (142 | 17.9%), education (116 | 14.6%), science & technology (85 | 10.7%), literature & languages (83 | 10.5%), and computers & mathematics (76 | 9.6%) are the most common fields of study among 793 individuals in Perryville who have obtained a bachelor's degree or higher.
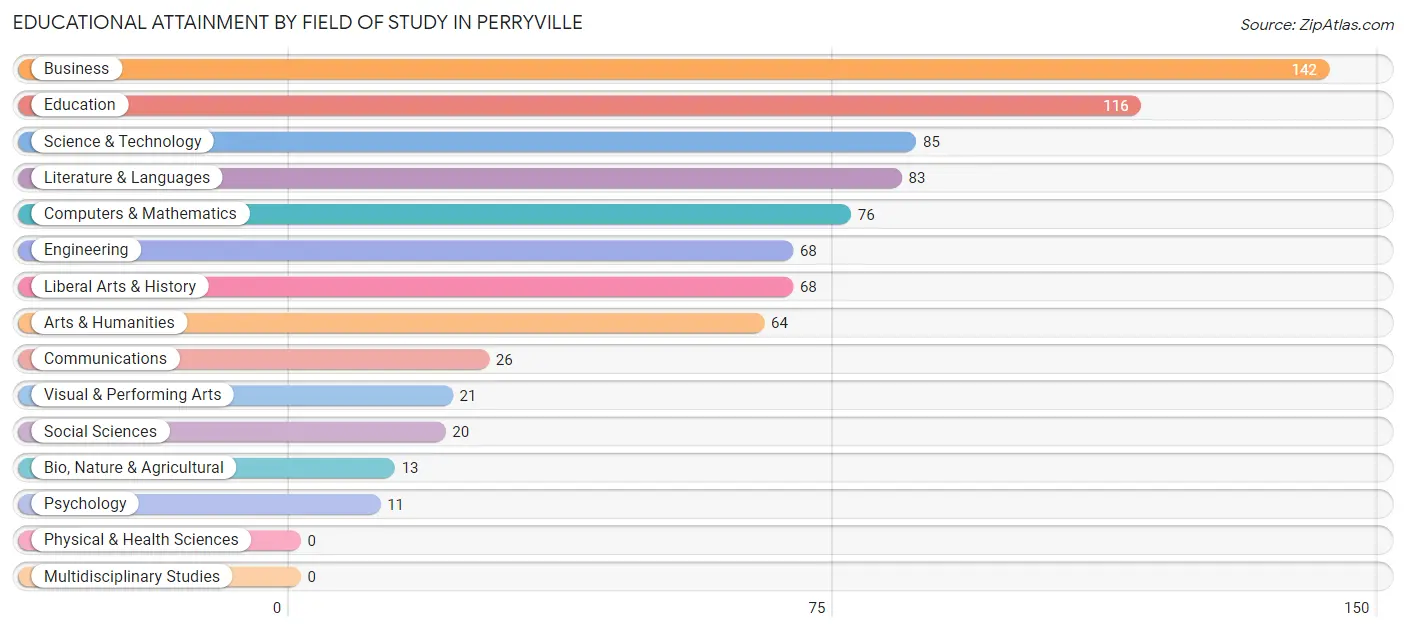
| Field of Study | # Graduates | % Graduates |
| Computers & Mathematics | 76 | 9.6% |
| Bio, Nature & Agricultural | 13 | 1.6% |
| Physical & Health Sciences | 0 | 0.0% |
| Psychology | 11 | 1.4% |
| Social Sciences | 20 | 2.5% |
| Engineering | 68 | 8.6% |
| Multidisciplinary Studies | 0 | 0.0% |
| Science & Technology | 85 | 10.7% |
| Business | 142 | 17.9% |
| Education | 116 | 14.6% |
| Literature & Languages | 83 | 10.5% |
| Liberal Arts & History | 68 | 8.6% |
| Visual & Performing Arts | 21 | 2.6% |
| Communications | 26 | 3.3% |
| Arts & Humanities | 64 | 8.1% |
| Total | 793 | 100.0% |
Transportation & Commute in Perryville
Vehicle Availability by Sex in Perryville
The most prevalent vehicle ownership categories in Perryville are males with 2 vehicles (547, accounting for 46.5%) and females with 2 vehicles (369, making up 57.2%).
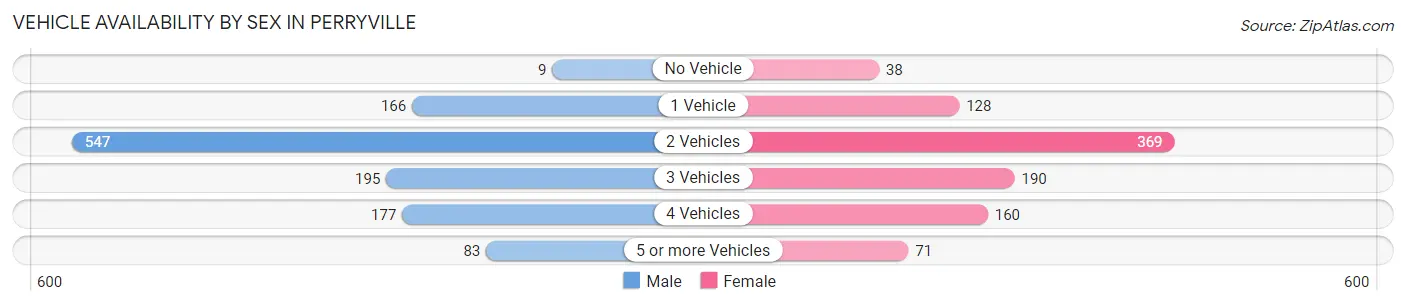
| Vehicles Available | Male | Female |
| No Vehicle | 9 (0.8%) | 38 (4.0%) |
| 1 Vehicle | 166 (14.1%) | 128 (13.4%) |
| 2 Vehicles | 547 (46.5%) | 369 (38.6%) |
| 3 Vehicles | 195 (16.6%) | 190 (19.9%) |
| 4 Vehicles | 177 (15.0%) | 160 (16.7%) |
| 5 or more Vehicles | 83 (7.0%) | 71 (7.4%) |
| Total | 1,177 (100.0%) | 956 (100.0%) |
Commute Time in Perryville
The most frequently occuring commute durations in Perryville are 20 to 24 minutes (526 commuters, 26.1%), 45 to 59 minutes (331 commuters, 16.4%), and 30 to 34 minutes (260 commuters, 12.9%).
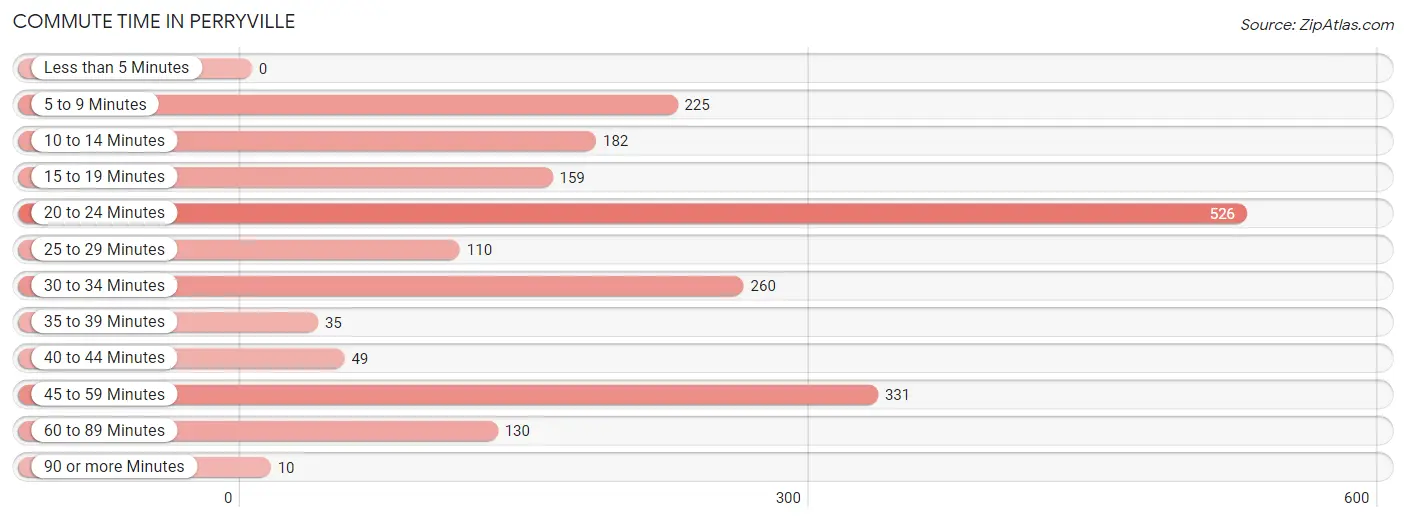
| Commute Time | # Commuters | % Commuters |
| Less than 5 Minutes | 0 | 0.0% |
| 5 to 9 Minutes | 225 | 11.2% |
| 10 to 14 Minutes | 182 | 9.0% |
| 15 to 19 Minutes | 159 | 7.9% |
| 20 to 24 Minutes | 526 | 26.1% |
| 25 to 29 Minutes | 110 | 5.4% |
| 30 to 34 Minutes | 260 | 12.9% |
| 35 to 39 Minutes | 35 | 1.7% |
| 40 to 44 Minutes | 49 | 2.4% |
| 45 to 59 Minutes | 331 | 16.4% |
| 60 to 89 Minutes | 130 | 6.5% |
| 90 or more Minutes | 10 | 0.5% |
Commute Time by Sex in Perryville
The most common commute times in Perryville are 20 to 24 minutes (362 commuters, 32.9%) for males and 45 to 59 minutes (206 commuters, 22.5%) for females.
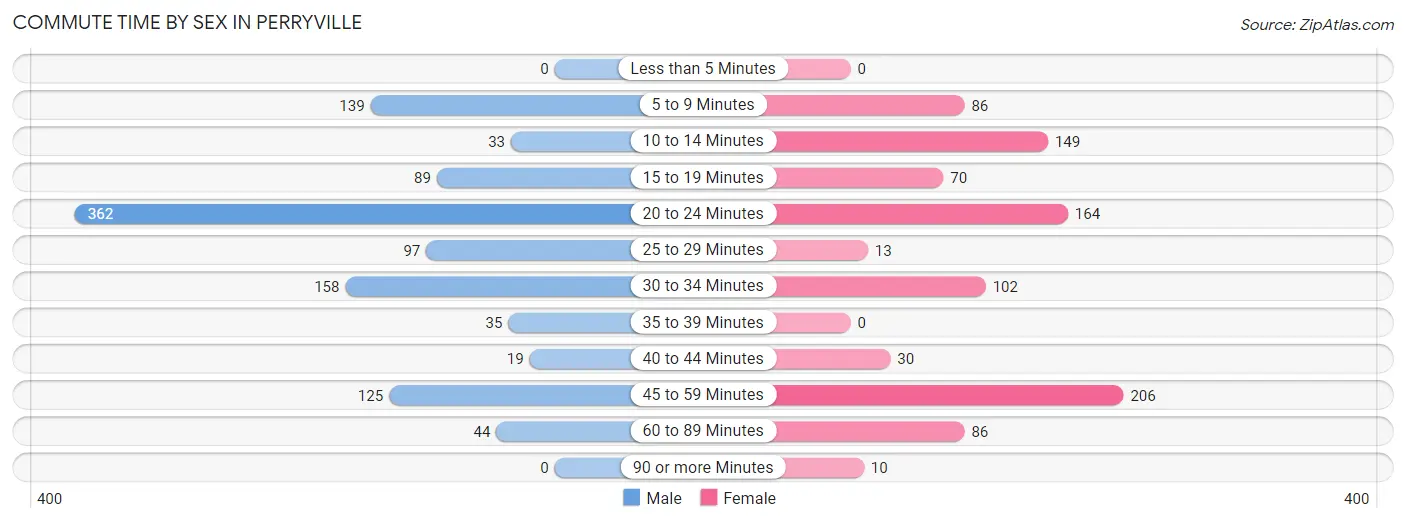
| Commute Time | Male | Female |
| Less than 5 Minutes | 0 (0.0%) | 0 (0.0%) |
| 5 to 9 Minutes | 139 (12.6%) | 86 (9.4%) |
| 10 to 14 Minutes | 33 (3.0%) | 149 (16.3%) |
| 15 to 19 Minutes | 89 (8.1%) | 70 (7.6%) |
| 20 to 24 Minutes | 362 (32.9%) | 164 (17.9%) |
| 25 to 29 Minutes | 97 (8.8%) | 13 (1.4%) |
| 30 to 34 Minutes | 158 (14.3%) | 102 (11.1%) |
| 35 to 39 Minutes | 35 (3.2%) | 0 (0.0%) |
| 40 to 44 Minutes | 19 (1.7%) | 30 (3.3%) |
| 45 to 59 Minutes | 125 (11.4%) | 206 (22.5%) |
| 60 to 89 Minutes | 44 (4.0%) | 86 (9.4%) |
| 90 or more Minutes | 0 (0.0%) | 10 (1.1%) |
Time of Departure to Work by Sex in Perryville
The most frequent times of departure to work in Perryville are 12:00 AM to 4:59 AM (177, 16.1%) for males and 6:00 AM to 6:29 AM (212, 23.1%) for females.
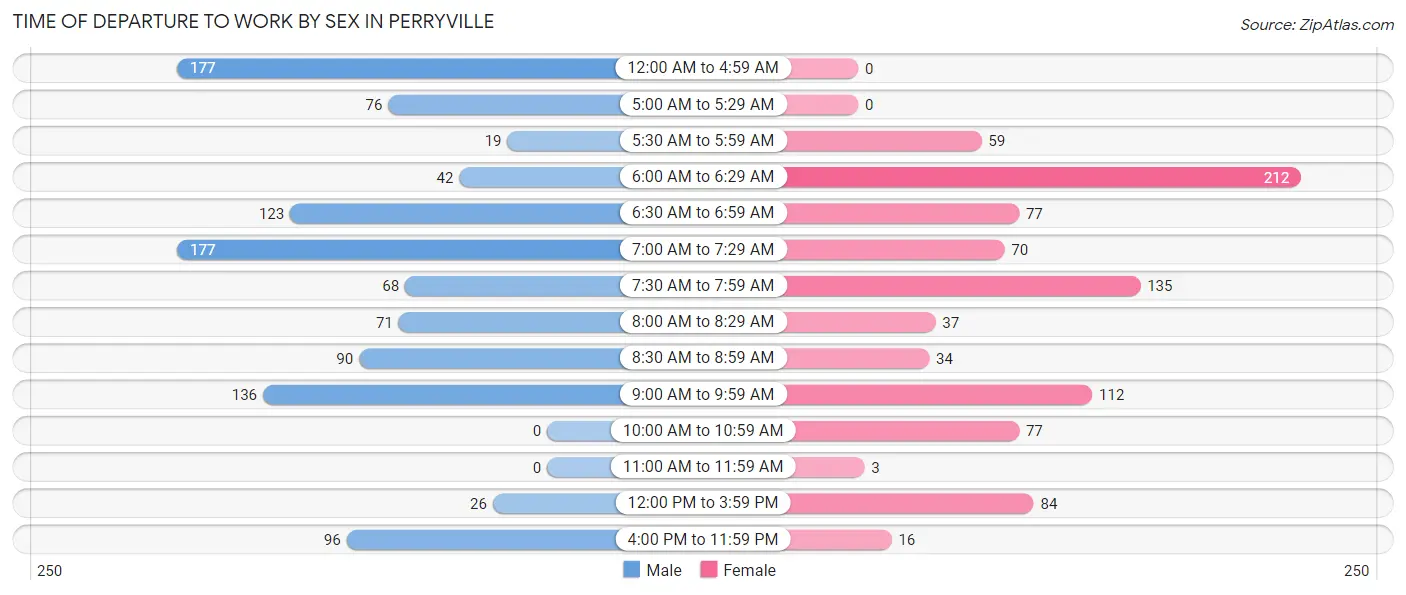
| Time of Departure | Male | Female |
| 12:00 AM to 4:59 AM | 177 (16.1%) | 0 (0.0%) |
| 5:00 AM to 5:29 AM | 76 (6.9%) | 0 (0.0%) |
| 5:30 AM to 5:59 AM | 19 (1.7%) | 59 (6.4%) |
| 6:00 AM to 6:29 AM | 42 (3.8%) | 212 (23.1%) |
| 6:30 AM to 6:59 AM | 123 (11.2%) | 77 (8.4%) |
| 7:00 AM to 7:29 AM | 177 (16.1%) | 70 (7.6%) |
| 7:30 AM to 7:59 AM | 68 (6.2%) | 135 (14.7%) |
| 8:00 AM to 8:29 AM | 71 (6.5%) | 37 (4.0%) |
| 8:30 AM to 8:59 AM | 90 (8.2%) | 34 (3.7%) |
| 9:00 AM to 9:59 AM | 136 (12.3%) | 112 (12.2%) |
| 10:00 AM to 10:59 AM | 0 (0.0%) | 77 (8.4%) |
| 11:00 AM to 11:59 AM | 0 (0.0%) | 3 (0.3%) |
| 12:00 PM to 3:59 PM | 26 (2.4%) | 84 (9.2%) |
| 4:00 PM to 11:59 PM | 96 (8.7%) | 16 (1.8%) |
| Total | 1,101 (100.0%) | 916 (100.0%) |
Housing Occupancy in Perryville
Occupancy by Ownership in Perryville
Of the total 1,652 dwellings in Perryville, owner-occupied units account for 1,109 (67.1%), while renter-occupied units make up 543 (32.9%).
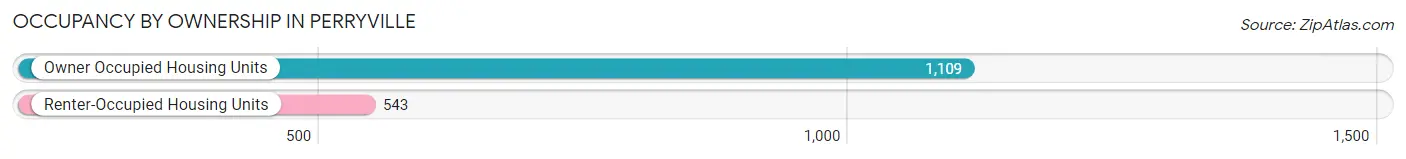
| Occupancy | # Housing Units | % Housing Units |
| Owner Occupied Housing Units | 1,109 | 67.1% |
| Renter-Occupied Housing Units | 543 | 32.9% |
| Total Occupied Housing Units | 1,652 | 100.0% |
Occupancy by Household Size in Perryville
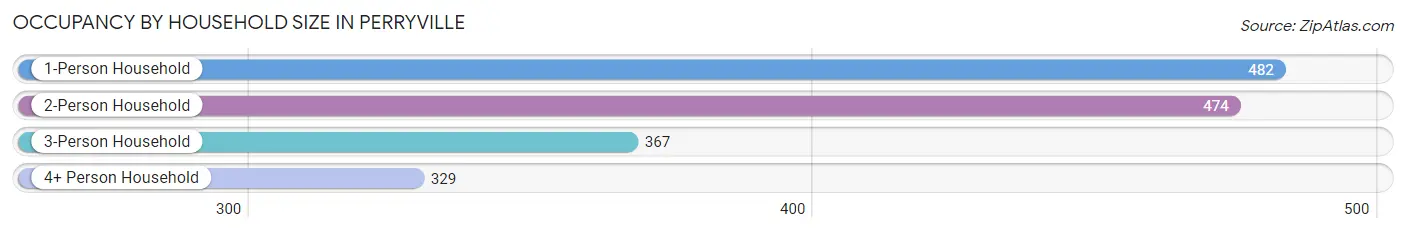
| Household Size | # Housing Units | % Housing Units |
| 1-Person Household | 482 | 29.2% |
| 2-Person Household | 474 | 28.7% |
| 3-Person Household | 367 | 22.2% |
| 4+ Person Household | 329 | 19.9% |
| Total Housing Units | 1,652 | 100.0% |
Occupancy by Ownership by Household Size in Perryville
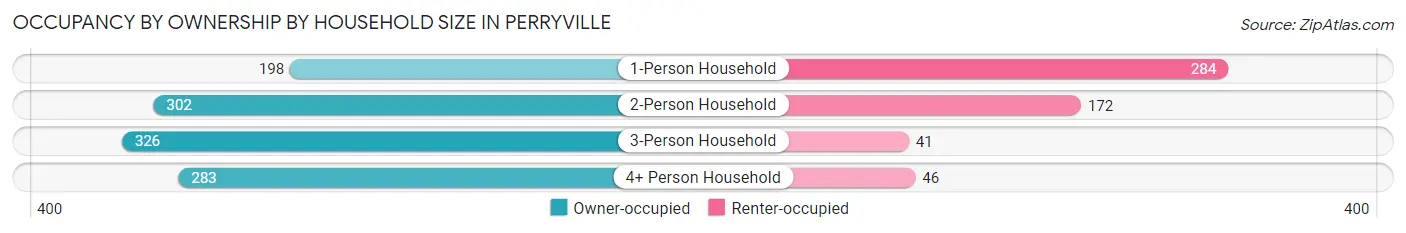
| Household Size | Owner-occupied | Renter-occupied |
| 1-Person Household | 198 (41.1%) | 284 (58.9%) |
| 2-Person Household | 302 (63.7%) | 172 (36.3%) |
| 3-Person Household | 326 (88.8%) | 41 (11.2%) |
| 4+ Person Household | 283 (86.0%) | 46 (14.0%) |
| Total Housing Units | 1,109 (67.1%) | 543 (32.9%) |
Occupancy by Educational Attainment in Perryville
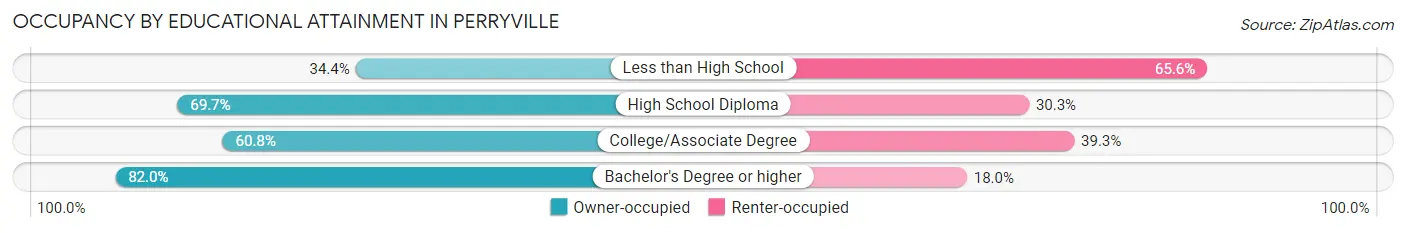
| Household Size | Owner-occupied | Renter-occupied |
| Less than High School | 54 (34.4%) | 103 (65.6%) |
| High School Diploma | 359 (69.7%) | 156 (30.3%) |
| College/Associate Degree | 308 (60.8%) | 199 (39.3%) |
| Bachelor's Degree or higher | 388 (82.0%) | 85 (18.0%) |
Occupancy by Age of Householder in Perryville
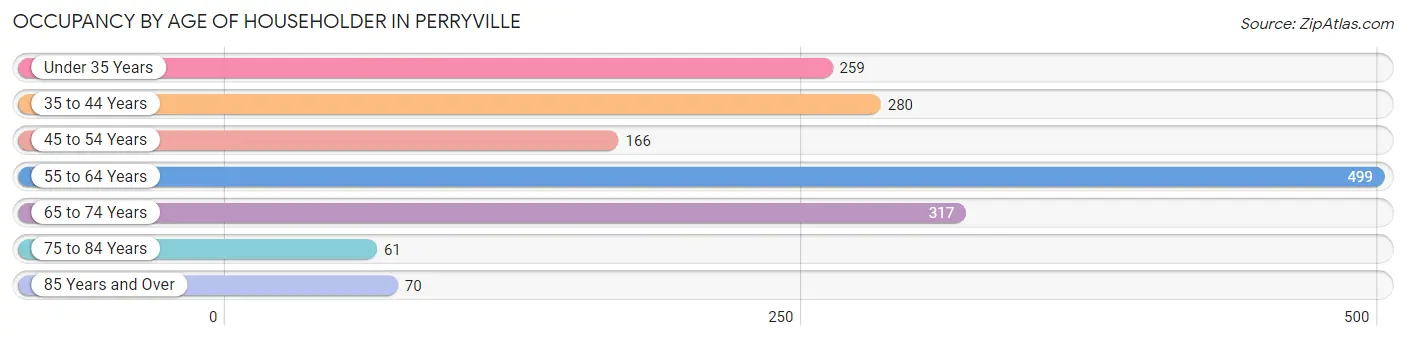
| Age Bracket | # Households | % Households |
| Under 35 Years | 259 | 15.7% |
| 35 to 44 Years | 280 | 17.0% |
| 45 to 54 Years | 166 | 10.1% |
| 55 to 64 Years | 499 | 30.2% |
| 65 to 74 Years | 317 | 19.2% |
| 75 to 84 Years | 61 | 3.7% |
| 85 Years and Over | 70 | 4.2% |
| Total | 1,652 | 100.0% |
Housing Finances in Perryville
Median Income by Occupancy in Perryville
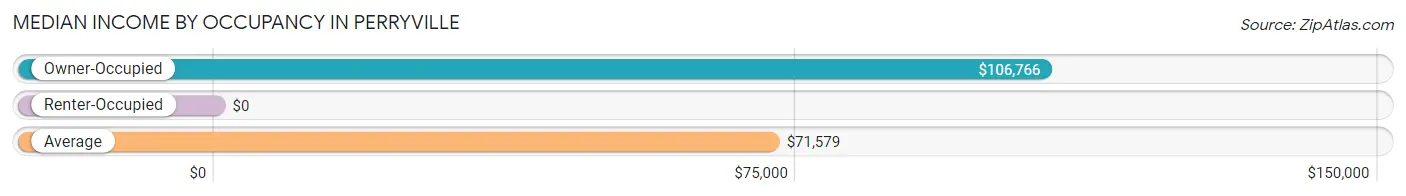
| Occupancy Type | # Households | Median Income |
| Owner-Occupied | 1,109 (67.1%) | $106,766 |
| Renter-Occupied | 543 (32.9%) | $0 |
| Average | 1,652 (100.0%) | $71,579 |
Occupancy by Householder Income Bracket in Perryville
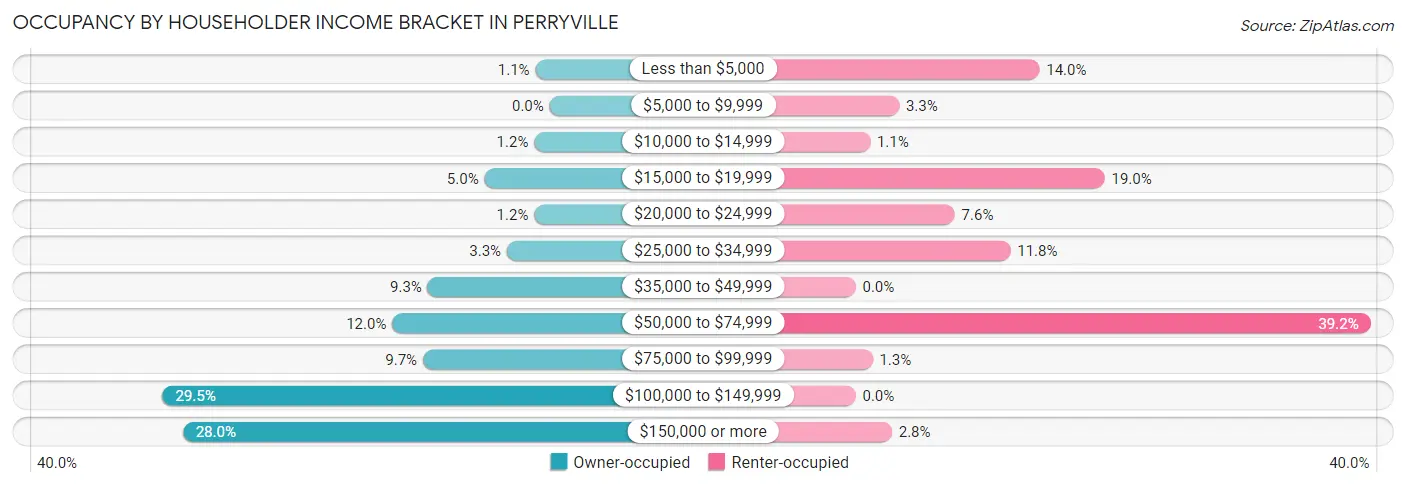
| Income Bracket | Owner-occupied | Renter-occupied |
| Less than $5,000 | 12 (1.1%) | 76 (14.0%) |
| $5,000 to $9,999 | 0 (0.0%) | 18 (3.3%) |
| $10,000 to $14,999 | 13 (1.2%) | 6 (1.1%) |
| $15,000 to $19,999 | 55 (5.0%) | 103 (19.0%) |
| $20,000 to $24,999 | 13 (1.2%) | 41 (7.5%) |
| $25,000 to $34,999 | 36 (3.3%) | 64 (11.8%) |
| $35,000 to $49,999 | 103 (9.3%) | 0 (0.0%) |
| $50,000 to $74,999 | 133 (12.0%) | 213 (39.2%) |
| $75,000 to $99,999 | 107 (9.7%) | 7 (1.3%) |
| $100,000 to $149,999 | 327 (29.5%) | 0 (0.0%) |
| $150,000 or more | 310 (28.0%) | 15 (2.8%) |
| Total | 1,109 (100.0%) | 543 (100.0%) |
Monthly Housing Cost Tiers in Perryville
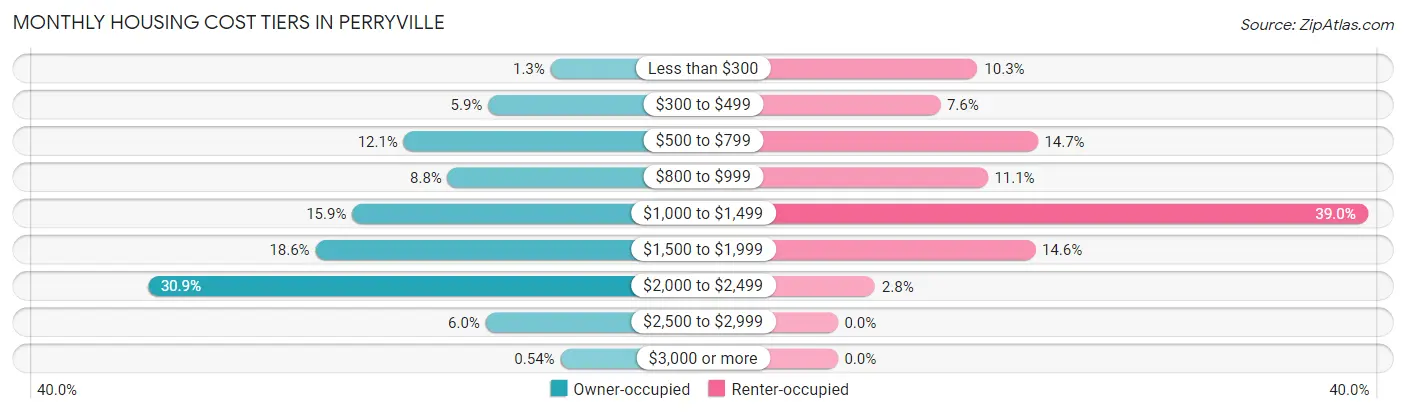
| Monthly Cost | Owner-occupied | Renter-occupied |
| Less than $300 | 14 (1.3%) | 56 (10.3%) |
| $300 to $499 | 65 (5.9%) | 41 (7.5%) |
| $500 to $799 | 134 (12.1%) | 80 (14.7%) |
| $800 to $999 | 98 (8.8%) | 60 (11.1%) |
| $1,000 to $1,499 | 176 (15.9%) | 212 (39.0%) |
| $1,500 to $1,999 | 206 (18.6%) | 79 (14.5%) |
| $2,000 to $2,499 | 343 (30.9%) | 15 (2.8%) |
| $2,500 to $2,999 | 67 (6.0%) | 0 (0.0%) |
| $3,000 or more | 6 (0.5%) | 0 (0.0%) |
| Total | 1,109 (100.0%) | 543 (100.0%) |
Physical Housing Characteristics in Perryville
Housing Structures in Perryville
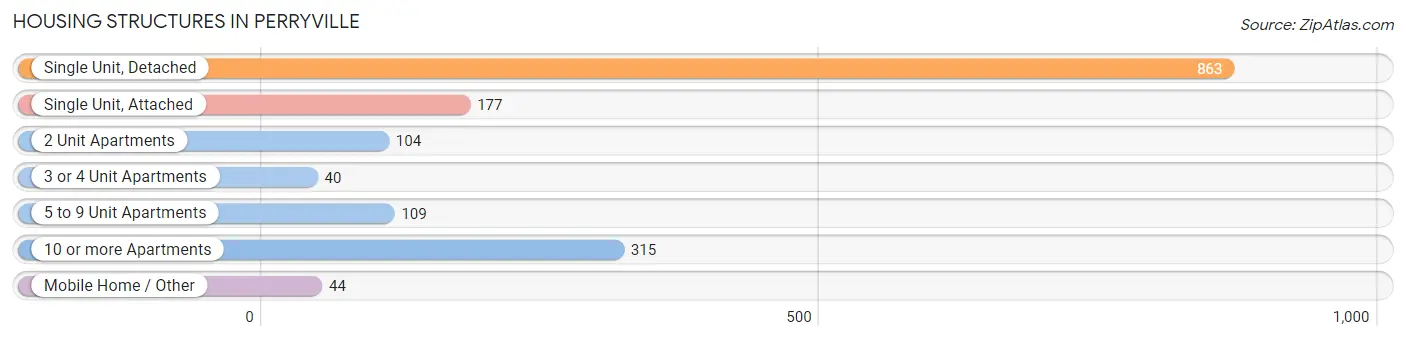
| Structure Type | # Housing Units | % Housing Units |
| Single Unit, Detached | 863 | 52.2% |
| Single Unit, Attached | 177 | 10.7% |
| 2 Unit Apartments | 104 | 6.3% |
| 3 or 4 Unit Apartments | 40 | 2.4% |
| 5 to 9 Unit Apartments | 109 | 6.6% |
| 10 or more Apartments | 315 | 19.1% |
| Mobile Home / Other | 44 | 2.7% |
| Total | 1,652 | 100.0% |
Housing Structures by Occupancy in Perryville
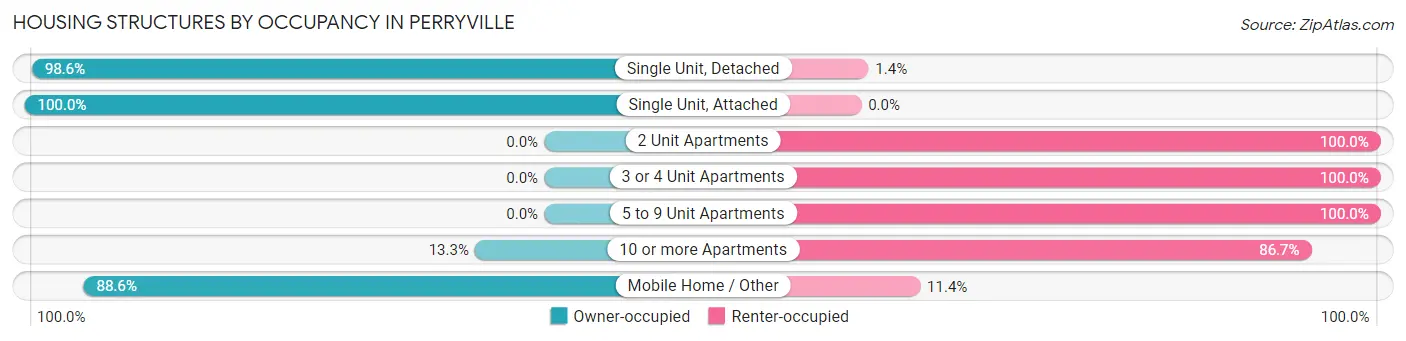
| Structure Type | Owner-occupied | Renter-occupied |
| Single Unit, Detached | 851 (98.6%) | 12 (1.4%) |
| Single Unit, Attached | 177 (100.0%) | 0 (0.0%) |
| 2 Unit Apartments | 0 (0.0%) | 104 (100.0%) |
| 3 or 4 Unit Apartments | 0 (0.0%) | 40 (100.0%) |
| 5 to 9 Unit Apartments | 0 (0.0%) | 109 (100.0%) |
| 10 or more Apartments | 42 (13.3%) | 273 (86.7%) |
| Mobile Home / Other | 39 (88.6%) | 5 (11.4%) |
| Total | 1,109 (67.1%) | 543 (32.9%) |
Housing Structures by Number of Rooms in Perryville
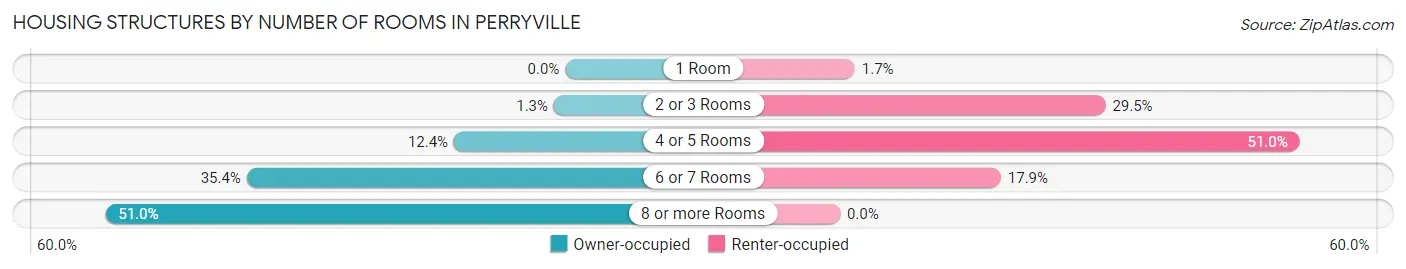
| Number of Rooms | Owner-occupied | Renter-occupied |
| 1 Room | 0 (0.0%) | 9 (1.7%) |
| 2 or 3 Rooms | 14 (1.3%) | 160 (29.5%) |
| 4 or 5 Rooms | 137 (12.3%) | 277 (51.0%) |
| 6 or 7 Rooms | 392 (35.3%) | 97 (17.9%) |
| 8 or more Rooms | 566 (51.0%) | 0 (0.0%) |
| Total | 1,109 (100.0%) | 543 (100.0%) |
Housing Structure by Heating Type in Perryville
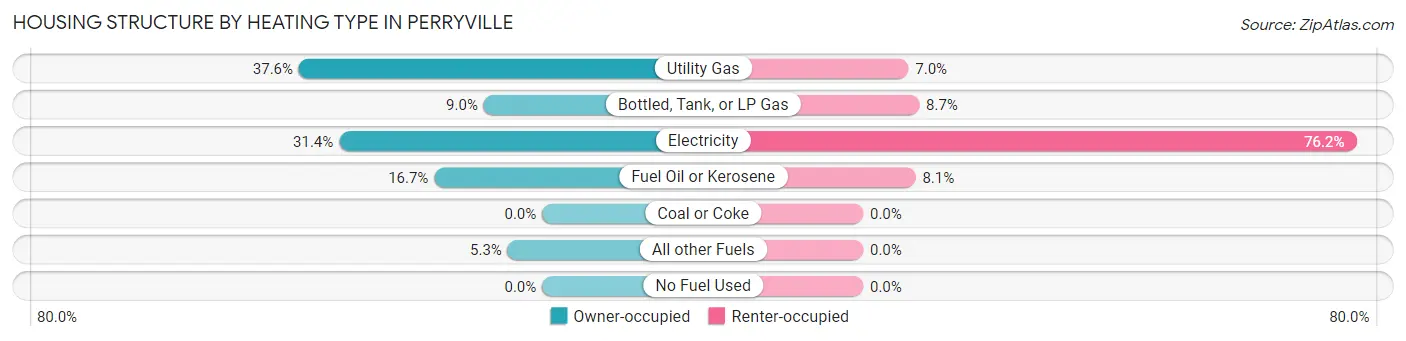
| Heating Type | Owner-occupied | Renter-occupied |
| Utility Gas | 417 (37.6%) | 38 (7.0%) |
| Bottled, Tank, or LP Gas | 100 (9.0%) | 47 (8.7%) |
| Electricity | 348 (31.4%) | 414 (76.2%) |
| Fuel Oil or Kerosene | 185 (16.7%) | 44 (8.1%) |
| Coal or Coke | 0 (0.0%) | 0 (0.0%) |
| All other Fuels | 59 (5.3%) | 0 (0.0%) |
| No Fuel Used | 0 (0.0%) | 0 (0.0%) |
| Total | 1,109 (100.0%) | 543 (100.0%) |
Household Vehicle Usage in Perryville
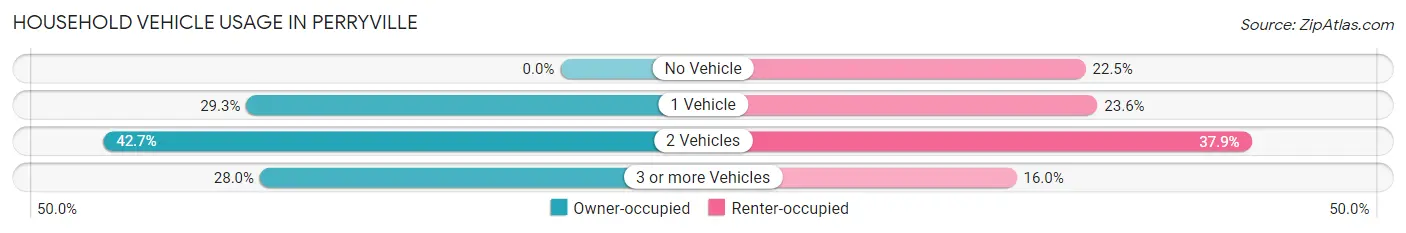
| Vehicles per Household | Owner-occupied | Renter-occupied |
| No Vehicle | 0 (0.0%) | 122 (22.5%) |
| 1 Vehicle | 325 (29.3%) | 128 (23.6%) |
| 2 Vehicles | 473 (42.6%) | 206 (37.9%) |
| 3 or more Vehicles | 311 (28.0%) | 87 (16.0%) |
| Total | 1,109 (100.0%) | 543 (100.0%) |
Real Estate & Mortgages in Perryville
Real Estate and Mortgage Overview in Perryville
| Characteristic | Without Mortgage | With Mortgage |
| Housing Units | 325 | 784 |
| Median Property Value | $343,300 | $267,200 |
| Median Household Income | $99,153 | $210 |
| Monthly Housing Costs | $672 | $6 |
| Real Estate Taxes | $2,732 | $0 |
Property Value by Mortgage Status in Perryville
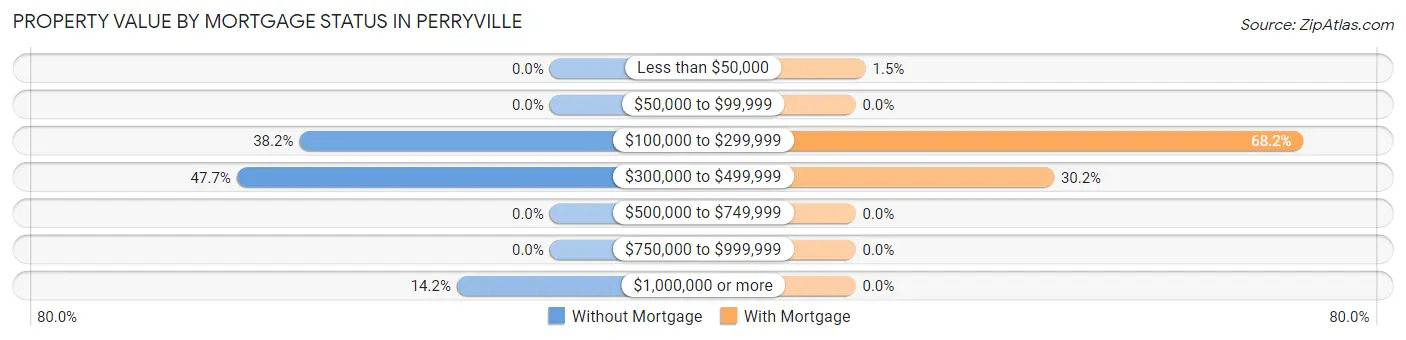
| Property Value | Without Mortgage | With Mortgage |
| Less than $50,000 | 0 (0.0%) | 12 (1.5%) |
| $50,000 to $99,999 | 0 (0.0%) | 0 (0.0%) |
| $100,000 to $299,999 | 124 (38.2%) | 535 (68.2%) |
| $300,000 to $499,999 | 155 (47.7%) | 237 (30.2%) |
| $500,000 to $749,999 | 0 (0.0%) | 0 (0.0%) |
| $750,000 to $999,999 | 0 (0.0%) | 0 (0.0%) |
| $1,000,000 or more | 46 (14.1%) | 0 (0.0%) |
| Total | 325 (100.0%) | 784 (100.0%) |
Household Income by Mortgage Status in Perryville
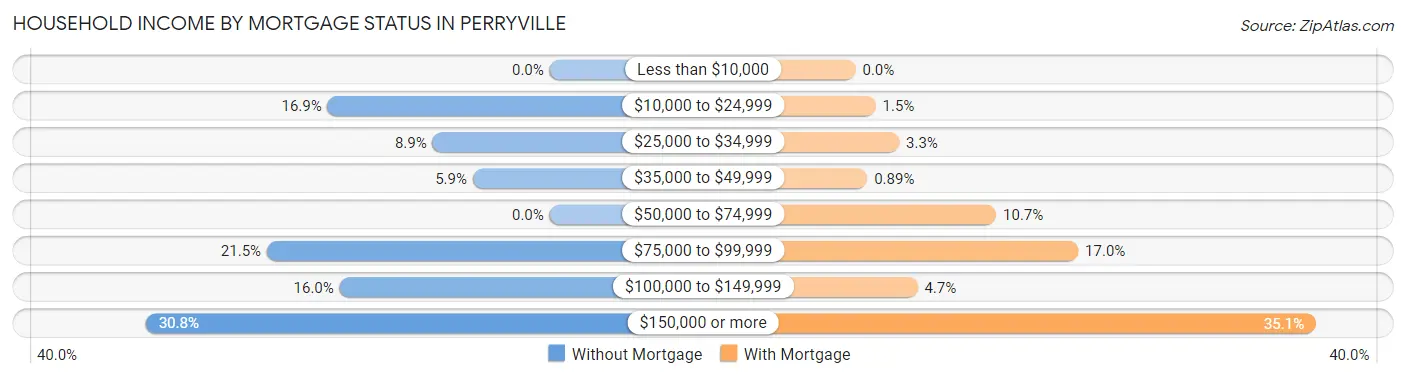
| Household Income | Without Mortgage | With Mortgage |
| Less than $10,000 | 0 (0.0%) | 0 (0.0%) |
| $10,000 to $24,999 | 55 (16.9%) | 12 (1.5%) |
| $25,000 to $34,999 | 29 (8.9%) | 26 (3.3%) |
| $35,000 to $49,999 | 19 (5.9%) | 7 (0.9%) |
| $50,000 to $74,999 | 0 (0.0%) | 84 (10.7%) |
| $75,000 to $99,999 | 70 (21.5%) | 133 (17.0%) |
| $100,000 to $149,999 | 52 (16.0%) | 37 (4.7%) |
| $150,000 or more | 100 (30.8%) | 275 (35.1%) |
| Total | 325 (100.0%) | 784 (100.0%) |
Property Value to Household Income Ratio in Perryville
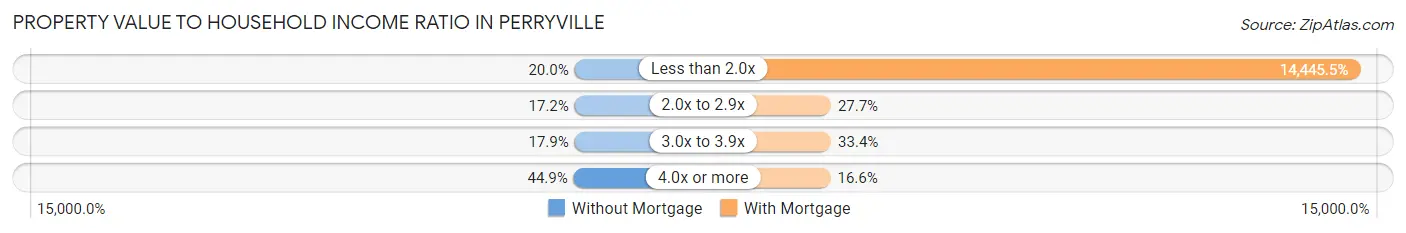
| Value-to-Income Ratio | Without Mortgage | With Mortgage |
| Less than 2.0x | 65 (20.0%) | 113,253 (14,445.5%) |
| 2.0x to 2.9x | 56 (17.2%) | 217 (27.7%) |
| 3.0x to 3.9x | 58 (17.8%) | 262 (33.4%) |
| 4.0x or more | 146 (44.9%) | 130 (16.6%) |
| Total | 325 (100.0%) | 784 (100.0%) |
Real Estate Taxes by Mortgage Status in Perryville
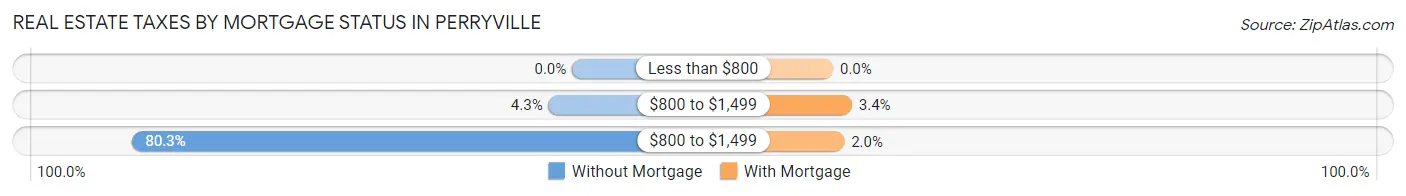
| Property Taxes | Without Mortgage | With Mortgage |
| Less than $800 | 0 (0.0%) | 0 (0.0%) |
| $800 to $1,499 | 14 (4.3%) | 27 (3.4%) |
| $800 to $1,499 | 261 (80.3%) | 16 (2.0%) |
| Total | 325 (100.0%) | 784 (100.0%) |
Health & Disability in Perryville
Health Insurance Coverage by Age in Perryville
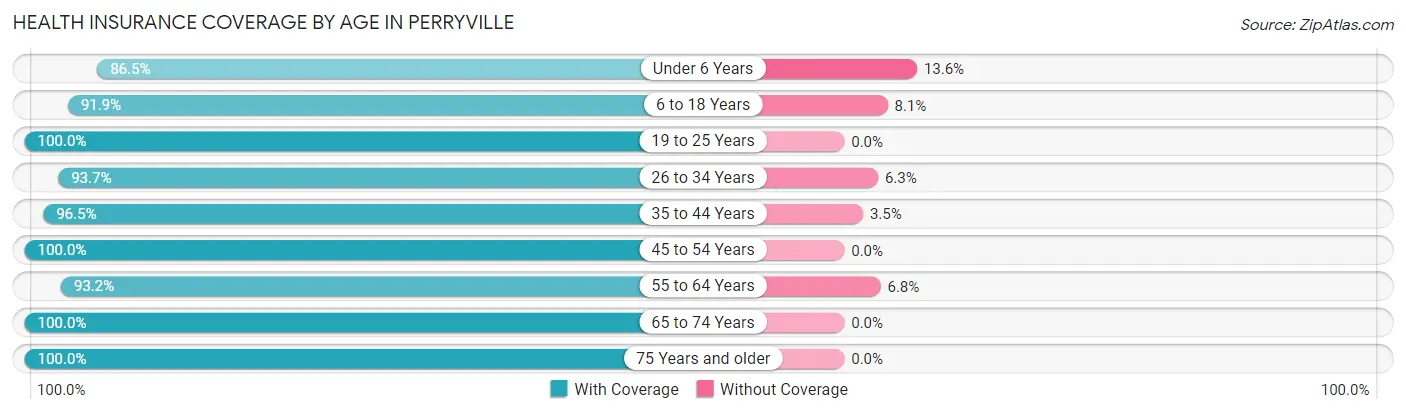
| Age Bracket | With Coverage | Without Coverage |
| Under 6 Years | 402 (86.5%) | 63 (13.6%) |
| 6 to 18 Years | 433 (91.9%) | 38 (8.1%) |
| 19 to 25 Years | 393 (100.0%) | 0 (0.0%) |
| 26 to 34 Years | 373 (93.7%) | 25 (6.3%) |
| 35 to 44 Years | 637 (96.5%) | 23 (3.5%) |
| 45 to 54 Years | 457 (100.0%) | 0 (0.0%) |
| 55 to 64 Years | 786 (93.2%) | 57 (6.8%) |
| 65 to 74 Years | 452 (100.0%) | 0 (0.0%) |
| 75 Years and older | 222 (100.0%) | 0 (0.0%) |
| Total | 4,155 (95.3%) | 206 (4.7%) |
Health Insurance Coverage by Citizenship Status in Perryville
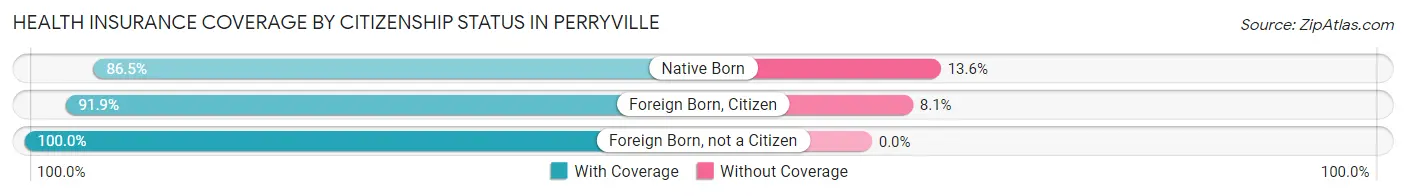
| Citizenship Status | With Coverage | Without Coverage |
| Native Born | 402 (86.5%) | 63 (13.6%) |
| Foreign Born, Citizen | 433 (91.9%) | 38 (8.1%) |
| Foreign Born, not a Citizen | 393 (100.0%) | 0 (0.0%) |
Health Insurance Coverage by Household Income in Perryville

| Household Income | With Coverage | Without Coverage |
| Under $25,000 | 539 (100.0%) | 0 (0.0%) |
| $25,000 to $49,999 | 342 (100.0%) | 0 (0.0%) |
| $50,000 to $74,999 | 732 (95.6%) | 34 (4.4%) |
| $75,000 to $99,999 | 259 (79.9%) | 65 (20.1%) |
| $100,000 and over | 2,283 (95.5%) | 107 (4.5%) |
Public vs Private Health Insurance Coverage by Age in Perryville
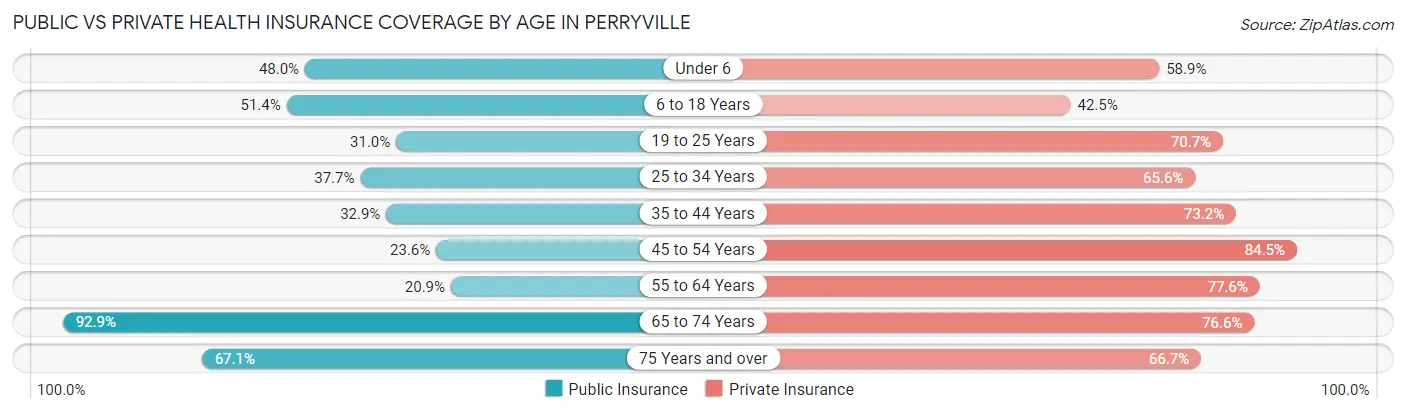
| Age Bracket | Public Insurance | Private Insurance |
| Under 6 | 223 (48.0%) | 274 (58.9%) |
| 6 to 18 Years | 242 (51.4%) | 200 (42.5%) |
| 19 to 25 Years | 122 (31.0%) | 278 (70.7%) |
| 25 to 34 Years | 150 (37.7%) | 261 (65.6%) |
| 35 to 44 Years | 217 (32.9%) | 483 (73.2%) |
| 45 to 54 Years | 108 (23.6%) | 386 (84.5%) |
| 55 to 64 Years | 176 (20.9%) | 654 (77.6%) |
| 65 to 74 Years | 420 (92.9%) | 346 (76.5%) |
| 75 Years and over | 149 (67.1%) | 148 (66.7%) |
| Total | 1,807 (41.4%) | 3,030 (69.5%) |
Disability Status by Sex by Age in Perryville
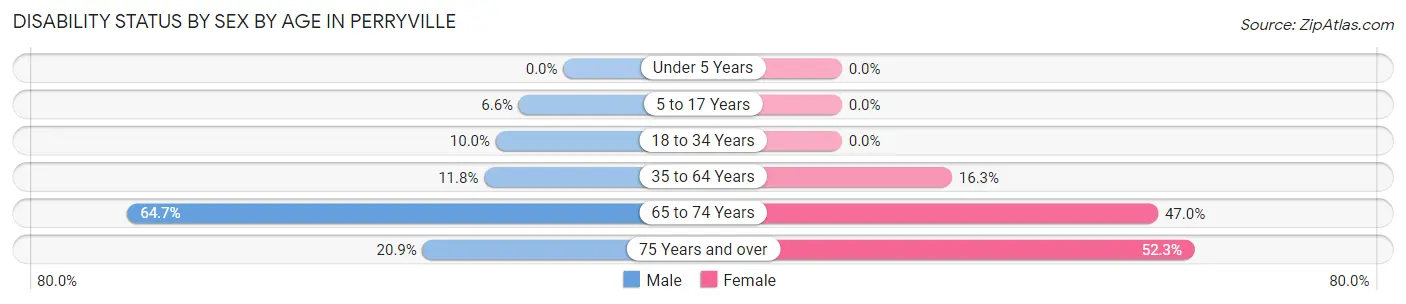
| Age Bracket | Male | Female |
| Under 5 Years | 0 (0.0%) | 0 (0.0%) |
| 5 to 17 Years | 19 (6.6%) | 0 (0.0%) |
| 18 to 34 Years | 45 (10.0%) | 0 (0.0%) |
| 35 to 64 Years | 116 (11.7%) | 159 (16.3%) |
| 65 to 74 Years | 112 (64.7%) | 131 (46.9%) |
| 75 Years and over | 14 (20.9%) | 81 (52.3%) |
Disability Class by Sex by Age in Perryville
Disability Class: Hearing Difficulty
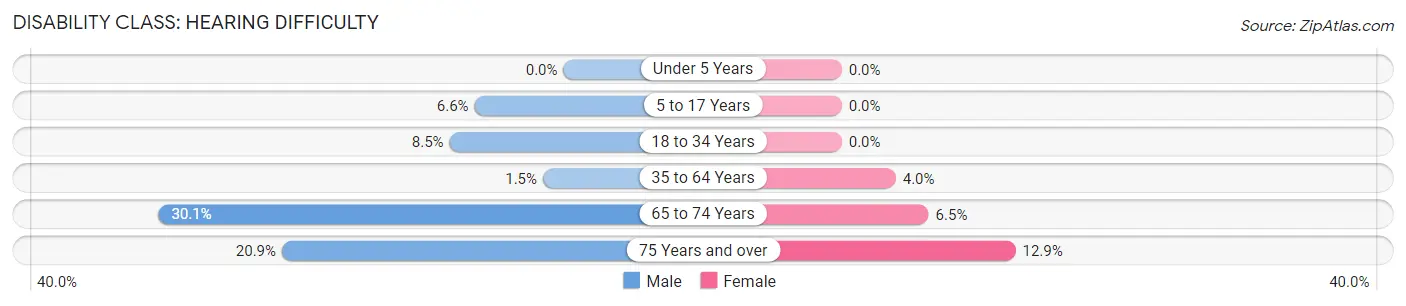
| Age Bracket | Male | Female |
| Under 5 Years | 0 (0.0%) | 0 (0.0%) |
| 5 to 17 Years | 19 (6.6%) | 0 (0.0%) |
| 18 to 34 Years | 38 (8.5%) | 0 (0.0%) |
| 35 to 64 Years | 15 (1.5%) | 39 (4.0%) |
| 65 to 74 Years | 52 (30.1%) | 18 (6.5%) |
| 75 Years and over | 14 (20.9%) | 20 (12.9%) |
Disability Class: Vision Difficulty
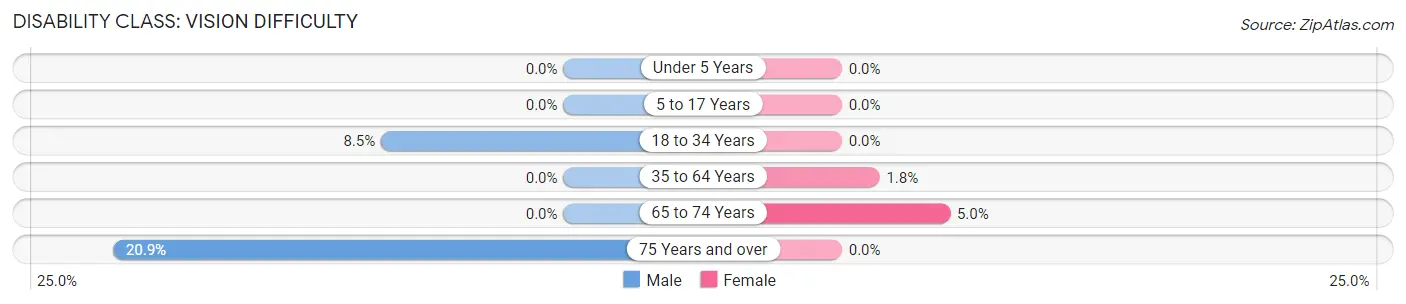
| Age Bracket | Male | Female |
| Under 5 Years | 0 (0.0%) | 0 (0.0%) |
| 5 to 17 Years | 0 (0.0%) | 0 (0.0%) |
| 18 to 34 Years | 38 (8.5%) | 0 (0.0%) |
| 35 to 64 Years | 0 (0.0%) | 17 (1.8%) |
| 65 to 74 Years | 0 (0.0%) | 14 (5.0%) |
| 75 Years and over | 14 (20.9%) | 0 (0.0%) |
Disability Class: Cognitive Difficulty
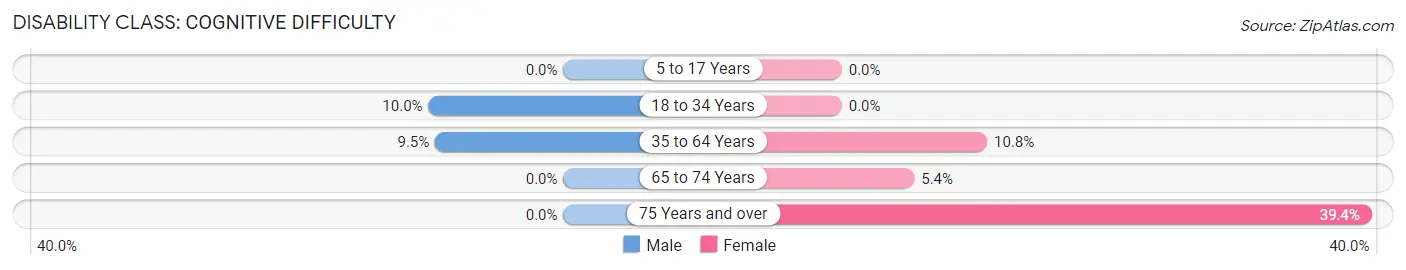
| Age Bracket | Male | Female |
| 5 to 17 Years | 0 (0.0%) | 0 (0.0%) |
| 18 to 34 Years | 45 (10.0%) | 0 (0.0%) |
| 35 to 64 Years | 94 (9.5%) | 105 (10.8%) |
| 65 to 74 Years | 0 (0.0%) | 15 (5.4%) |
| 75 Years and over | 0 (0.0%) | 61 (39.4%) |
Disability Class: Ambulatory Difficulty
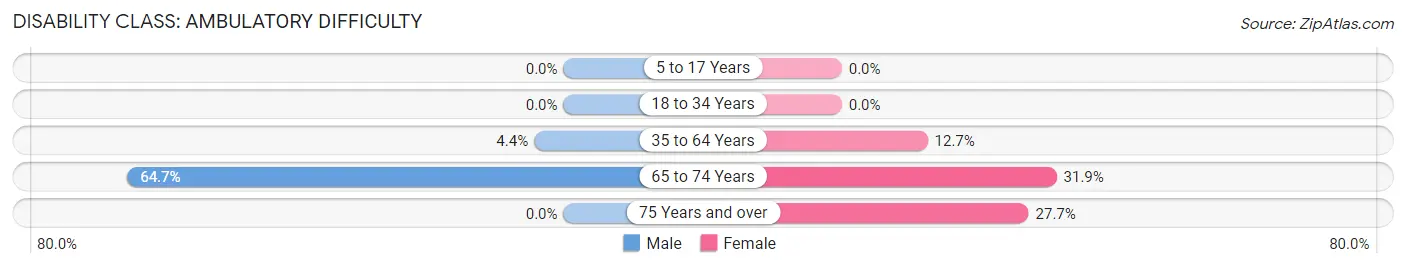
| Age Bracket | Male | Female |
| 5 to 17 Years | 0 (0.0%) | 0 (0.0%) |
| 18 to 34 Years | 0 (0.0%) | 0 (0.0%) |
| 35 to 64 Years | 43 (4.4%) | 124 (12.7%) |
| 65 to 74 Years | 112 (64.7%) | 89 (31.9%) |
| 75 Years and over | 0 (0.0%) | 43 (27.7%) |
Disability Class: Self-Care Difficulty
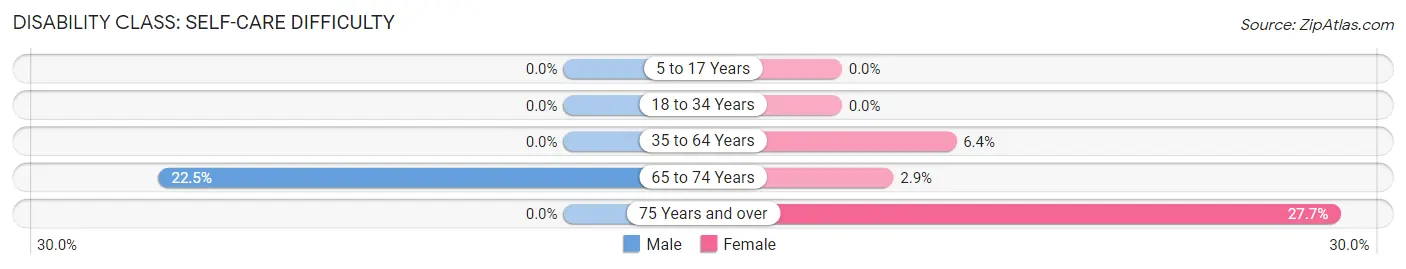
| Age Bracket | Male | Female |
| 5 to 17 Years | 0 (0.0%) | 0 (0.0%) |
| 18 to 34 Years | 0 (0.0%) | 0 (0.0%) |
| 35 to 64 Years | 0 (0.0%) | 62 (6.4%) |
| 65 to 74 Years | 39 (22.5%) | 8 (2.9%) |
| 75 Years and over | 0 (0.0%) | 43 (27.7%) |
Technology Access in Perryville
Computing Device Access in Perryville
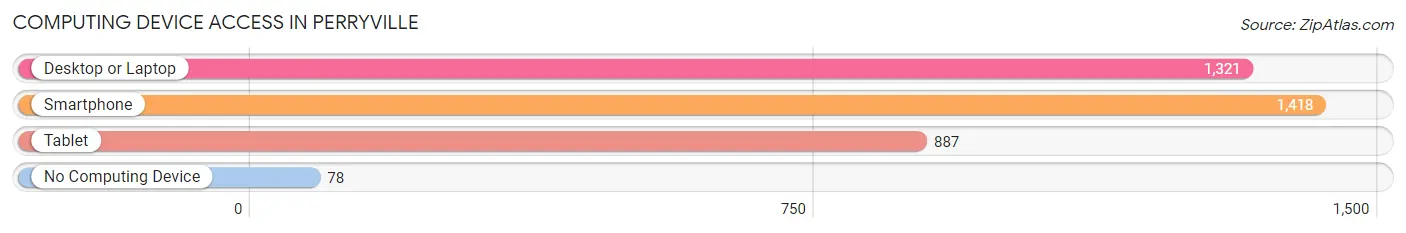
| Device Type | # Households | % Households |
| Desktop or Laptop | 1,321 | 80.0% |
| Smartphone | 1,418 | 85.8% |
| Tablet | 887 | 53.7% |
| No Computing Device | 78 | 4.7% |
| Total | 1,652 | 100.0% |
Internet Access in Perryville
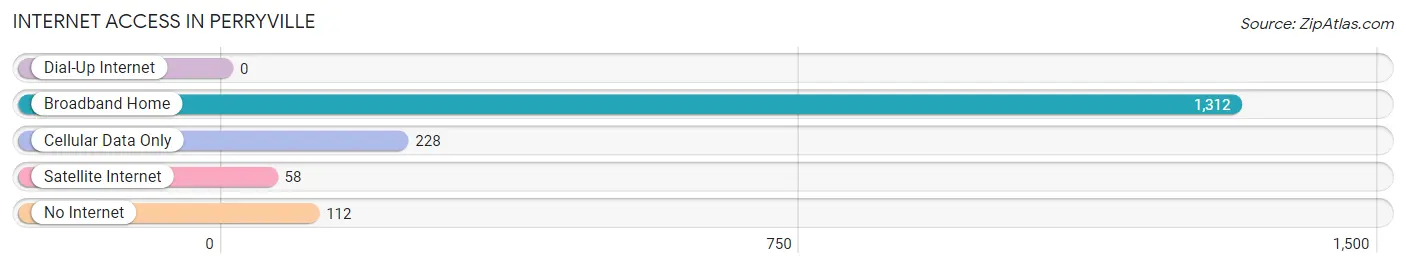
| Internet Type | # Households | % Households |
| Dial-Up Internet | 0 | 0.0% |
| Broadband Home | 1,312 | 79.4% |
| Cellular Data Only | 228 | 13.8% |
| Satellite Internet | 58 | 3.5% |
| No Internet | 112 | 6.8% |
| Total | 1,652 | 100.0% |
Perryville Summary
Perryville, Maryland is a small town located in Cecil County, Maryland, United States. It is situated on the banks of the Susquehanna River, approximately 40 miles northeast of Baltimore. The town was founded in 1744 and is named after Commodore Oliver Hazard Perry, a hero of the War of 1812. Perryville is home to a population of approximately 3,000 people and is the largest town in Cecil County.
History
Perryville was founded in 1744 by a group of settlers from Pennsylvania. The town was named after Commodore Oliver Hazard Perry, a hero of the War of 1812. Perryville was an important port town during the 19th century, as it was located at the head of navigation on the Susquehanna River. The town was also a major stop on the Underground Railroad, as it was a safe haven for escaped slaves.
In the early 20th century, Perryville was a major hub for the Chesapeake and Delaware Canal. The canal was built to connect the Chesapeake Bay to the Delaware River and was a major shipping route for goods and passengers. The canal was eventually replaced by the Chesapeake Bay Bridge in 1952.
Geography
Perryville is located in Cecil County, Maryland, approximately 40 miles northeast of Baltimore. The town is situated on the banks of the Susquehanna River and is bordered by the towns of Port Deposit and Rising Sun. Perryville is located in a rural area and is surrounded by farmland and woodlands. The town is also located near the Susquehanna State Park, which offers a variety of outdoor activities such as hiking, camping, fishing, and boating.
Economy
Perryville’s economy is largely based on tourism and agriculture. The town is home to several tourist attractions, such as the Susquehanna State Park, the Perryville Historic District, and the Perryville Battlefield. The town is also home to several wineries, breweries, and distilleries, which attract visitors from all over the region.
Agriculture is also an important part of the local economy. The town is home to several farms, which produce a variety of crops, including corn, soybeans, wheat, and hay. The town is also home to several livestock farms, which produce beef, pork, and poultry.
Demographics
As of the 2010 census, Perryville had a population of 3,039 people. The town is predominantly white (90.2%), with a small African American population (4.2%) and a small Hispanic population (2.2%). The median household income in Perryville is $50,945, and the median home value is $179,400. The town has a poverty rate of 8.3%.
Perryville is served by the Cecil County Public Schools system. The town is home to Perryville High School, which serves students in grades 9-12. The town is also home to several private schools, including Perryville Christian Academy and Perryville Montessori School.
Conclusion
Perryville, Maryland is a small town located in Cecil County, Maryland, United States. It is situated on the banks of the Susquehanna River, approximately 40 miles northeast of Baltimore. The town was founded in 1744 and is named after Commodore Oliver Hazard Perry, a hero of the War of 1812. Perryville is home to a population of approximately 3,000 people and is the largest town in Cecil County. The town’s economy is largely based on tourism and agriculture, and the town is home to several tourist attractions, wineries, breweries, and distilleries. Perryville is predominantly white (90.2%), with a small African American population (4.2%) and a small Hispanic population (2.2%). The town is served by the Cecil County Public Schools system and is home to several private schools.
Common Questions
What is Per Capita Income in Perryville?
Per Capita income in Perryville is $34,000.
What is the Median Family Income in Perryville?
Median Family Income in Perryville is $101,488.
What is the Median Household income in Perryville?
Median Household Income in Perryville is $71,579.
What is Income or Wage Gap in Perryville?
Income or Wage Gap in Perryville is 24.6%.
Women in Perryville earn 75.4 cents for every dollar earned by a man.
What is Inequality or Gini Index in Perryville?
Inequality or Gini Index in Perryville is 0.41.
What is the Total Population of Perryville?
Total Population of Perryville is 4,398.
What is the Total Male Population of Perryville?
Total Male Population of Perryville is 2,085.
What is the Total Female Population of Perryville?
Total Female Population of Perryville is 2,313.
What is the Ratio of Males per 100 Females in Perryville?
There are 90.14 Males per 100 Females in Perryville.
What is the Ratio of Females per 100 Males in Perryville?
There are 110.94 Females per 100 Males in Perryville.
What is the Median Population Age in Perryville?
Median Population Age in Perryville is 40.8 Years.
What is the Average Family Size in Perryville
Average Family Size in Perryville is 3.3 People.
What is the Average Household Size in Perryville
Average Household Size in Perryville is 2.6 People.
How Large is the Labor Force in Perryville?
There are 2,287 People in the Labor Forcein in Perryville.
What is the Percentage of People in the Labor Force in Perryville?
64.8% of People are in the Labor Force in Perryville.
What is the Unemployment Rate in Perryville?
Unemployment Rate in Perryville is 5.3%.