Jonesboro, IL Map & Demographics
Jonesboro Map
Jonesboro Overview
$26,541
PER CAPITA INCOME
$86,375
AVG FAMILY INCOME
$52,604
AVG HOUSEHOLD INCOME
1.1%
WAGE / INCOME GAP [ % ]
98.9¢/ $1
WAGE / INCOME GAP [ $ ]
0.43
INEQUALITY / GINI INDEX
1,817
TOTAL POPULATION
894
MALE POPULATION
923
FEMALE POPULATION
96.86
MALES / 100 FEMALES
103.24
FEMALES / 100 MALES
40.6
MEDIAN AGE
3.3
AVG FAMILY SIZE
2.4
AVG HOUSEHOLD SIZE
754
LABOR FORCE [ PEOPLE ]
51.6%
PERCENT IN LABOR FORCE
5.0%
UNEMPLOYMENT RATE
Jonesboro Zip Codes
Jonesboro Area Codes
Income in Jonesboro
Income Overview in Jonesboro
Per Capita Income in Jonesboro is $26,541, while median incomes of families and households are $86,375 and $52,604 respectively.
| Characteristic | Number | Measure |
| Per Capita Income | 1,817 | $26,541 |
| Median Family Income | 385 | $86,375 |
| Mean Family Income | 385 | $85,284 |
| Median Household Income | 733 | $52,604 |
| Mean Household Income | 733 | $63,649 |
| Income Deficit | 385 | $0 |
| Wage / Income Gap (%) | 1,817 | 1.08% |
| Wage / Income Gap ($) | 1,817 | 98.92¢ per $1 |
| Gini / Inequality Index | 1,817 | 0.43 |
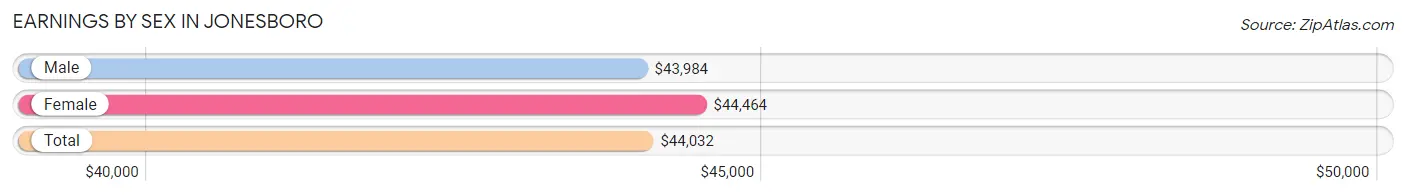
Earnings by Sex in Jonesboro
Average Earnings in Jonesboro are $44,032, $43,984 for men and $44,464 for women, a difference of 1.1%.
| Sex | Number | Average Earnings |
| Male | 392 (51.6%) | $43,984 |
| Female | 367 (48.3%) | $44,464 |
| Total | 759 (100.0%) | $44,032 |
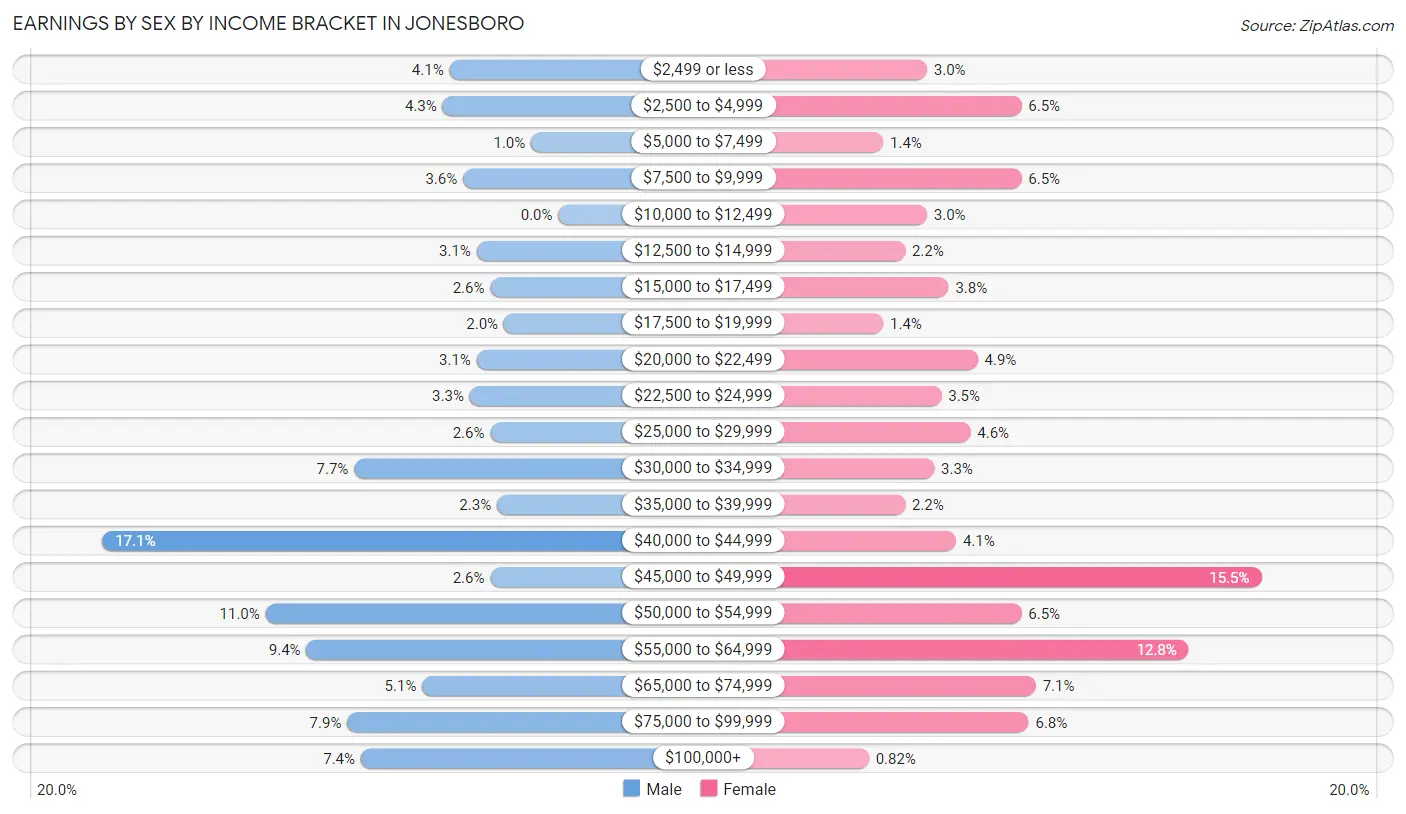
Earnings by Sex by Income Bracket in Jonesboro
The most common earnings brackets in Jonesboro are $40,000 to $44,999 for men (67 | 17.1%) and $45,000 to $49,999 for women (57 | 15.5%).
| Income | Male | Female |
| $2,499 or less | 16 (4.1%) | 11 (3.0%) |
| $2,500 to $4,999 | 17 (4.3%) | 24 (6.5%) |
| $5,000 to $7,499 | 4 (1.0%) | 5 (1.4%) |
| $7,500 to $9,999 | 14 (3.6%) | 24 (6.5%) |
| $10,000 to $12,499 | 0 (0.0%) | 11 (3.0%) |
| $12,500 to $14,999 | 12 (3.1%) | 8 (2.2%) |
| $15,000 to $17,499 | 10 (2.5%) | 14 (3.8%) |
| $17,500 to $19,999 | 8 (2.0%) | 5 (1.4%) |
| $20,000 to $22,499 | 12 (3.1%) | 18 (4.9%) |
| $22,500 to $24,999 | 13 (3.3%) | 13 (3.5%) |
| $25,000 to $29,999 | 10 (2.5%) | 17 (4.6%) |
| $30,000 to $34,999 | 30 (7.6%) | 12 (3.3%) |
| $35,000 to $39,999 | 9 (2.3%) | 8 (2.2%) |
| $40,000 to $44,999 | 67 (17.1%) | 15 (4.1%) |
| $45,000 to $49,999 | 10 (2.5%) | 57 (15.5%) |
| $50,000 to $54,999 | 43 (11.0%) | 24 (6.5%) |
| $55,000 to $64,999 | 37 (9.4%) | 47 (12.8%) |
| $65,000 to $74,999 | 20 (5.1%) | 26 (7.1%) |
| $75,000 to $99,999 | 31 (7.9%) | 25 (6.8%) |
| $100,000+ | 29 (7.4%) | 3 (0.8%) |
| Total | 392 (100.0%) | 367 (100.0%) |
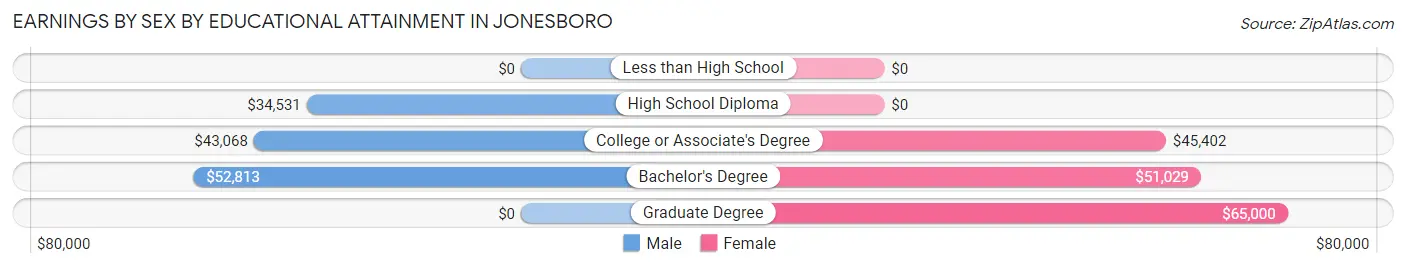
Earnings by Sex by Educational Attainment in Jonesboro
Average earnings in Jonesboro are $44,746 for men and $46,712 for women, a difference of 4.2%. Men with an educational attainment of bachelor's degree enjoy the highest average annual earnings of $52,813, while those with high school diploma education earn the least with $34,531. Women with an educational attainment of graduate degree earn the most with the average annual earnings of $65,000, while those with college or associate's degree education have the smallest earnings of $45,402.
| Educational Attainment | Male Income | Female Income |
| Less than High School | - | - |
| High School Diploma | $34,531 | $0 |
| College or Associate's Degree | $43,068 | $45,402 |
| Bachelor's Degree | $52,813 | $51,029 |
| Graduate Degree | - | - |
| Total | $44,746 | $46,712 |
Family Income in Jonesboro
Family Income Brackets in Jonesboro
According to the Jonesboro family income data, there are 132 families falling into the $100,000 to $149,999 income range, which is the most common income bracket and makes up 34.3% of all families. Conversely, the $10,000 to $14,999 income bracket is the least frequent group with only 2 families (0.5%) belonging to this category.
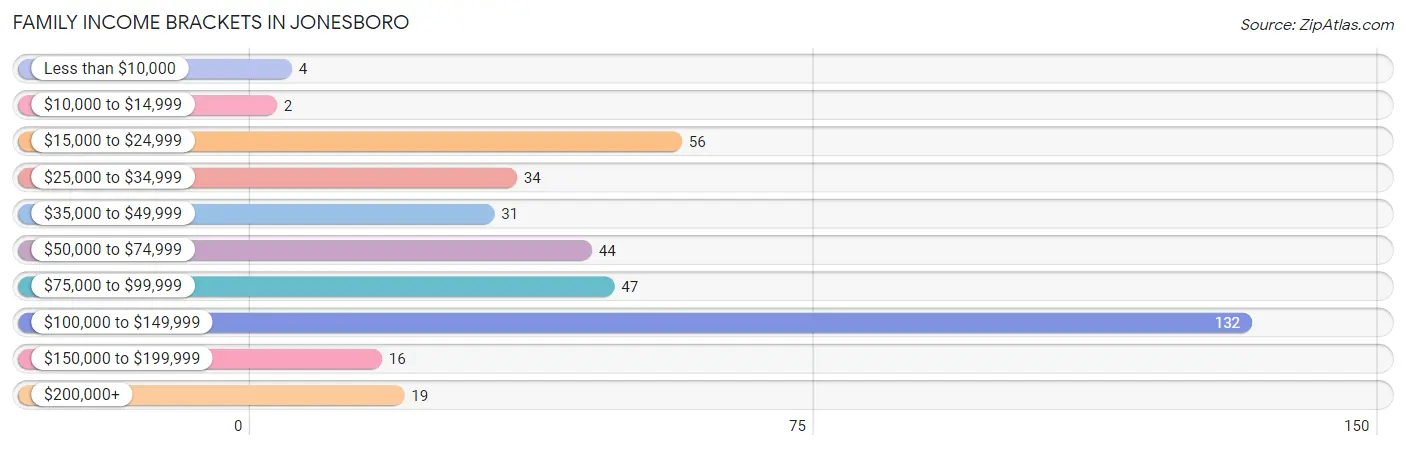
| Income Bracket | # Families | % Families |
| Less than $10,000 | 4 | 1.0% |
| $10,000 to $14,999 | 2 | 0.5% |
| $15,000 to $24,999 | 56 | 14.5% |
| $25,000 to $34,999 | 34 | 8.8% |
| $35,000 to $49,999 | 31 | 8.1% |
| $50,000 to $74,999 | 44 | 11.4% |
| $75,000 to $99,999 | 47 | 12.2% |
| $100,000 to $149,999 | 132 | 34.3% |
| $150,000 to $199,999 | 16 | 4.2% |
| $200,000+ | 19 | 4.9% |
Family Income by Famaliy Size in Jonesboro
5-person families (43 | 11.2%) account for the highest median family income in Jonesboro with $113,021 per family, while 3-person families (73 | 19.0%) have the highest median income of $33,472 per family member.
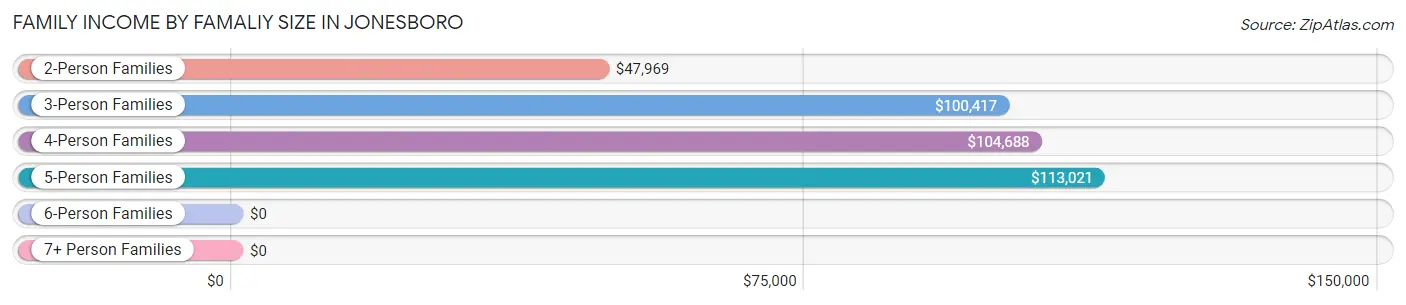
| Income Bracket | # Families | Median Income |
| 2-Person Families | 135 (35.1%) | $47,969 |
| 3-Person Families | 73 (19.0%) | $100,417 |
| 4-Person Families | 129 (33.5%) | $104,688 |
| 5-Person Families | 43 (11.2%) | $113,021 |
| 6-Person Families | 2 (0.5%) | $0 |
| 7+ Person Families | 3 (0.8%) | $0 |
| Total | 385 (100.0%) | $86,375 |
Family Income by Number of Earners in Jonesboro
The median family income in Jonesboro is $86,375, with families comprising 3+ earners (42) having the highest median family income of $143,125, while families with no earners (89) have the lowest median family income of $32,417, accounting for 10.9% and 23.1% of families, respectively.
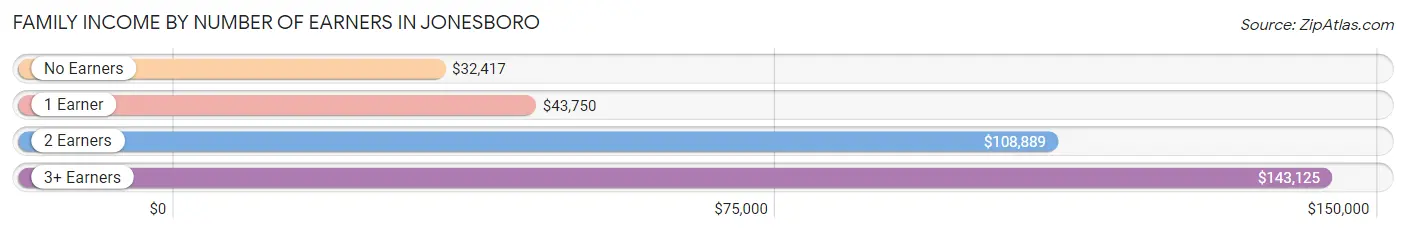
| Number of Earners | # Families | Median Income |
| No Earners | 89 (23.1%) | $32,417 |
| 1 Earner | 90 (23.4%) | $43,750 |
| 2 Earners | 164 (42.6%) | $108,889 |
| 3+ Earners | 42 (10.9%) | $143,125 |
| Total | 385 (100.0%) | $86,375 |
Household Income in Jonesboro
Household Income Brackets in Jonesboro
With 153 households falling in the category, the $100,000 to $149,999 income range is the most frequent in Jonesboro, accounting for 20.9% of all households. In contrast, only 13 households (1.8%) fall into the $150,000 to $199,999 income bracket, making it the least populous group.
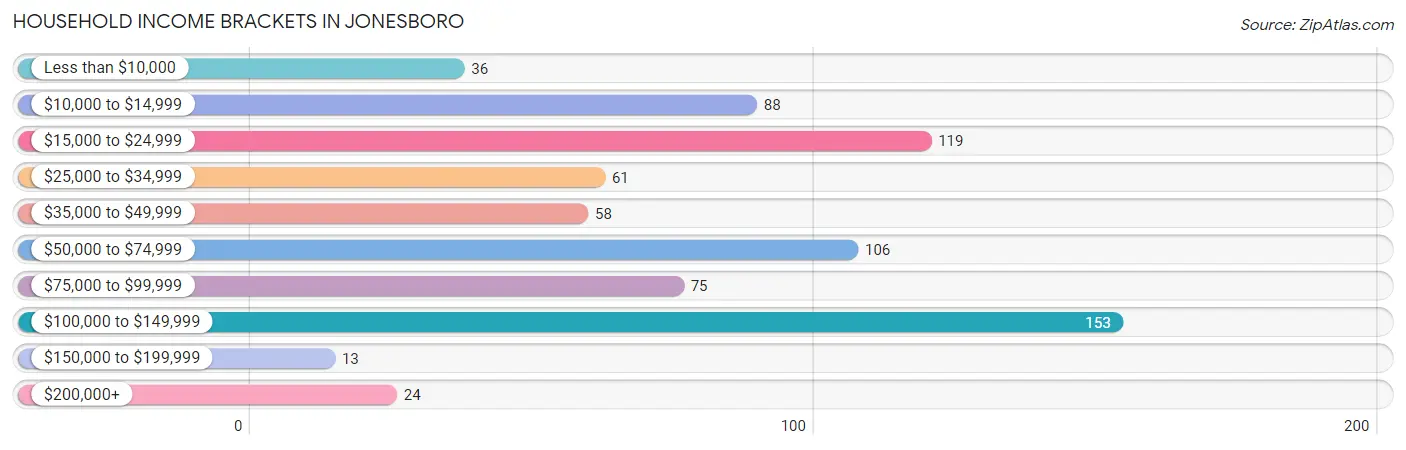
| Income Bracket | # Households | % Households |
| Less than $10,000 | 36 | 4.9% |
| $10,000 to $14,999 | 88 | 12.0% |
| $15,000 to $24,999 | 119 | 16.2% |
| $25,000 to $34,999 | 61 | 8.3% |
| $35,000 to $49,999 | 58 | 7.9% |
| $50,000 to $74,999 | 106 | 14.5% |
| $75,000 to $99,999 | 75 | 10.2% |
| $100,000 to $149,999 | 153 | 20.9% |
| $150,000 to $199,999 | 13 | 1.8% |
| $200,000+ | 24 | 3.3% |
Household Income by Householder Age in Jonesboro
The median household income in Jonesboro is $52,604, with the highest median household income of $91,458 found in the 25 to 44 years age bracket for the primary householder. A total of 204 households (27.8%) fall into this category. Meanwhile, the 15 to 24 years age bracket for the primary householder has the lowest median household income of $0, with 17 households (2.3%) in this group.
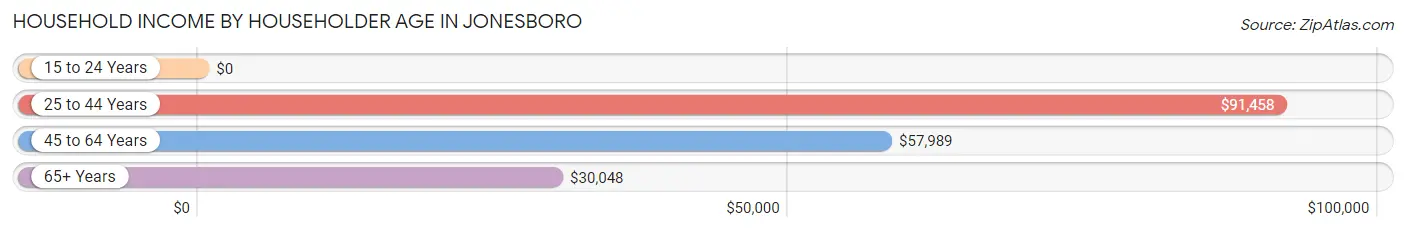
| Income Bracket | # Households | Median Income |
| 15 to 24 Years | 17 (2.3%) | $0 |
| 25 to 44 Years | 204 (27.8%) | $91,458 |
| 45 to 64 Years | 223 (30.4%) | $57,989 |
| 65+ Years | 289 (39.4%) | $30,048 |
| Total | 733 (100.0%) | $52,604 |
Poverty in Jonesboro
Income Below Poverty by Sex and Age in Jonesboro
With 19.2% poverty level for males and 18.9% for females among the residents of Jonesboro, 15 year old males and 18 to 24 year old females are the most vulnerable to poverty, with 16 males (41.0%) and 25 females (35.7%) in their respective age groups living below the poverty level.
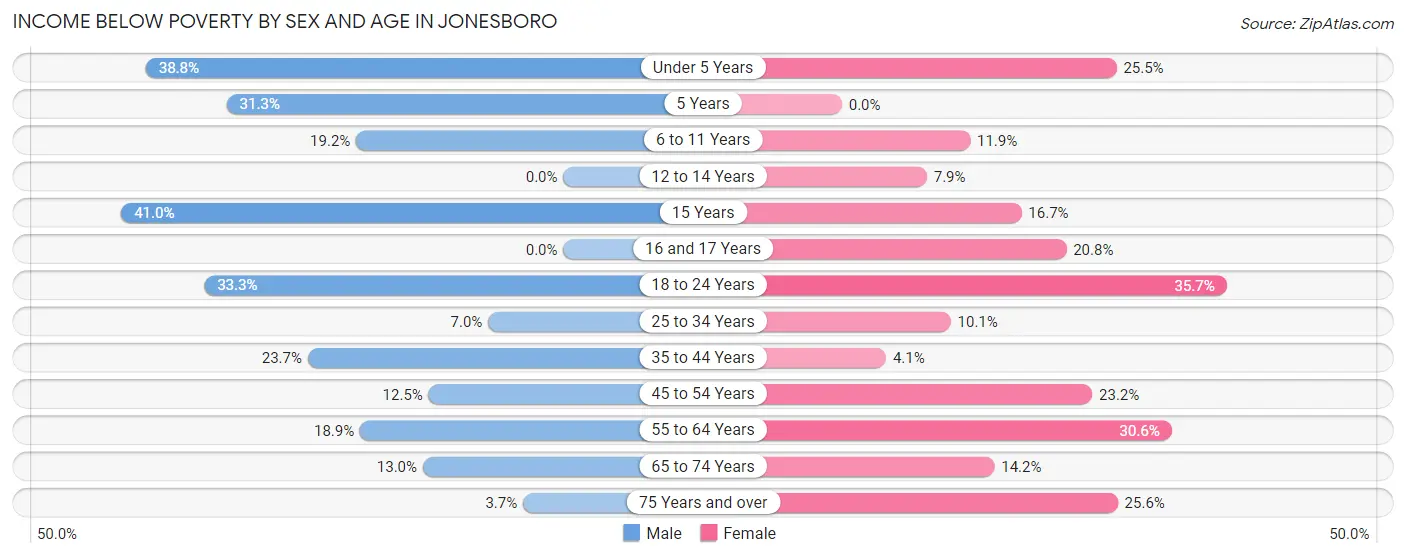
| Age Bracket | Male | Female |
| Under 5 Years | 31 (38.8%) | 13 (25.5%) |
| 5 Years | 5 (31.2%) | 0 (0.0%) |
| 6 to 11 Years | 10 (19.2%) | 5 (11.9%) |
| 12 to 14 Years | 0 (0.0%) | 3 (7.9%) |
| 15 Years | 16 (41.0%) | 3 (16.7%) |
| 16 and 17 Years | 0 (0.0%) | 10 (20.8%) |
| 18 to 24 Years | 16 (33.3%) | 25 (35.7%) |
| 25 to 34 Years | 6 (7.0%) | 10 (10.1%) |
| 35 to 44 Years | 37 (23.7%) | 5 (4.1%) |
| 45 to 54 Years | 9 (12.5%) | 23 (23.2%) |
| 55 to 64 Years | 30 (18.9%) | 30 (30.6%) |
| 65 to 74 Years | 6 (13.0%) | 15 (14.1%) |
| 75 Years and over | 4 (3.7%) | 32 (25.6%) |
| Total | 170 (19.2%) | 174 (18.9%) |
Income Above Poverty by Sex and Age in Jonesboro
According to the poverty statistics in Jonesboro, males aged 12 to 14 years and females aged 5 years are the age groups that are most secure financially, with 100.0% of males and 100.0% of females in these age groups living above the poverty line.
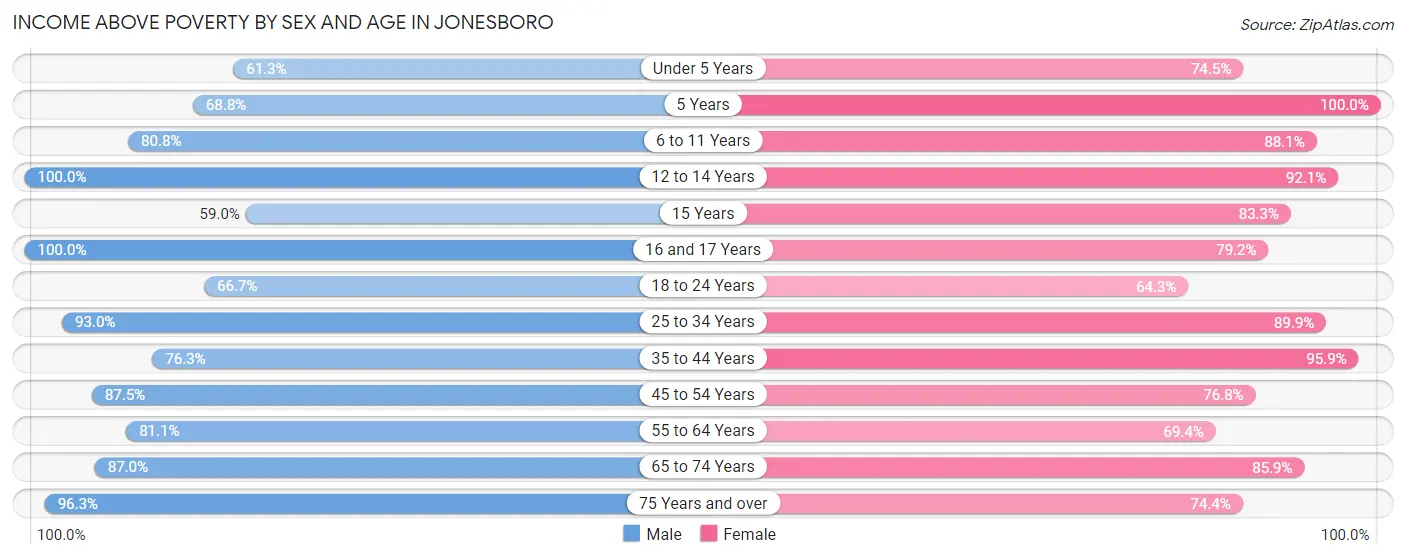
| Age Bracket | Male | Female |
| Under 5 Years | 49 (61.3%) | 38 (74.5%) |
| 5 Years | 11 (68.8%) | 4 (100.0%) |
| 6 to 11 Years | 42 (80.8%) | 37 (88.1%) |
| 12 to 14 Years | 4 (100.0%) | 35 (92.1%) |
| 15 Years | 23 (59.0%) | 15 (83.3%) |
| 16 and 17 Years | 21 (100.0%) | 38 (79.2%) |
| 18 to 24 Years | 32 (66.7%) | 45 (64.3%) |
| 25 to 34 Years | 80 (93.0%) | 89 (89.9%) |
| 35 to 44 Years | 119 (76.3%) | 117 (95.9%) |
| 45 to 54 Years | 63 (87.5%) | 76 (76.8%) |
| 55 to 64 Years | 129 (81.1%) | 68 (69.4%) |
| 65 to 74 Years | 40 (87.0%) | 91 (85.9%) |
| 75 Years and over | 103 (96.3%) | 93 (74.4%) |
| Total | 716 (80.8%) | 746 (81.1%) |
Income Below Poverty Among Married-Couple Families in Jonesboro
The poverty statistics for married-couple families in Jonesboro show that 8.9% or 26 of the total 293 families live below the poverty line. Families with 5 or more children have the highest poverty rate of 100.0%, comprising of 3 families. On the other hand, families with 3 or 4 children have the lowest poverty rate of 0.0%, which includes 0 families.
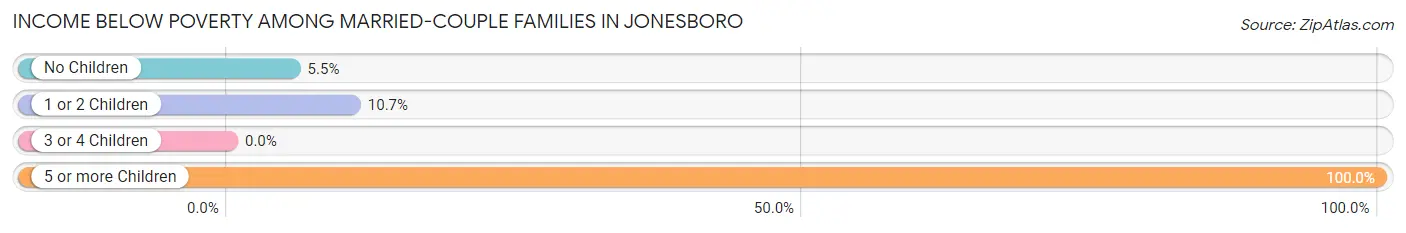
| Children | Above Poverty | Below Poverty |
| No Children | 104 (94.6%) | 6 (5.4%) |
| 1 or 2 Children | 142 (89.3%) | 17 (10.7%) |
| 3 or 4 Children | 21 (100.0%) | 0 (0.0%) |
| 5 or more Children | 0 (0.0%) | 3 (100.0%) |
| Total | 267 (91.1%) | 26 (8.9%) |
Income Below Poverty Among Single-Parent Households in Jonesboro
According to the poverty data in Jonesboro, 14.3% or 5 single-father households and 24.6% or 14 single-mother households are living below the poverty line. Among single-father households, those with 1 or 2 children have the highest poverty rate, with 5 households (20.8%) experiencing poverty. Likewise, among single-mother households, those with 1 or 2 children have the highest poverty rate, with 14 households (40.0%) falling below the poverty line.
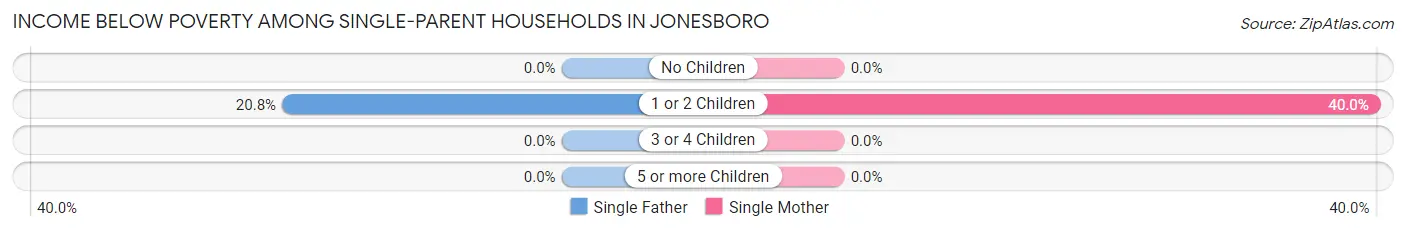
| Children | Single Father | Single Mother |
| No Children | 0 (0.0%) | 0 (0.0%) |
| 1 or 2 Children | 5 (20.8%) | 14 (40.0%) |
| 3 or 4 Children | 0 (0.0%) | 0 (0.0%) |
| 5 or more Children | 0 (0.0%) | 0 (0.0%) |
| Total | 5 (14.3%) | 14 (24.6%) |
Income Below Poverty Among Married-Couple vs Single-Parent Households in Jonesboro
The poverty data for Jonesboro shows that 26 of the married-couple family households (8.9%) and 19 of the single-parent households (20.6%) are living below the poverty level. Within the married-couple family households, those with 5 or more children have the highest poverty rate, with 3 households (100.0%) falling below the poverty line. Among the single-parent households, those with 1 or 2 children have the highest poverty rate, with 19 household (32.2%) living below poverty.
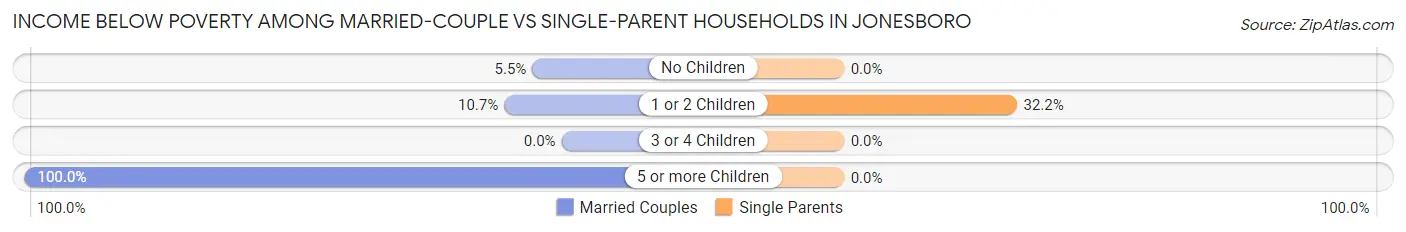
| Children | Married-Couple Families | Single-Parent Households |
| No Children | 6 (5.4%) | 0 (0.0%) |
| 1 or 2 Children | 17 (10.7%) | 19 (32.2%) |
| 3 or 4 Children | 0 (0.0%) | 0 (0.0%) |
| 5 or more Children | 3 (100.0%) | 0 (0.0%) |
| Total | 26 (8.9%) | 19 (20.6%) |
Race in Jonesboro
The most populous races in Jonesboro are White / Caucasian (1,676 | 92.2%), Two or more Races (107 | 5.9%), and Hispanic or Latino (34 | 1.9%).
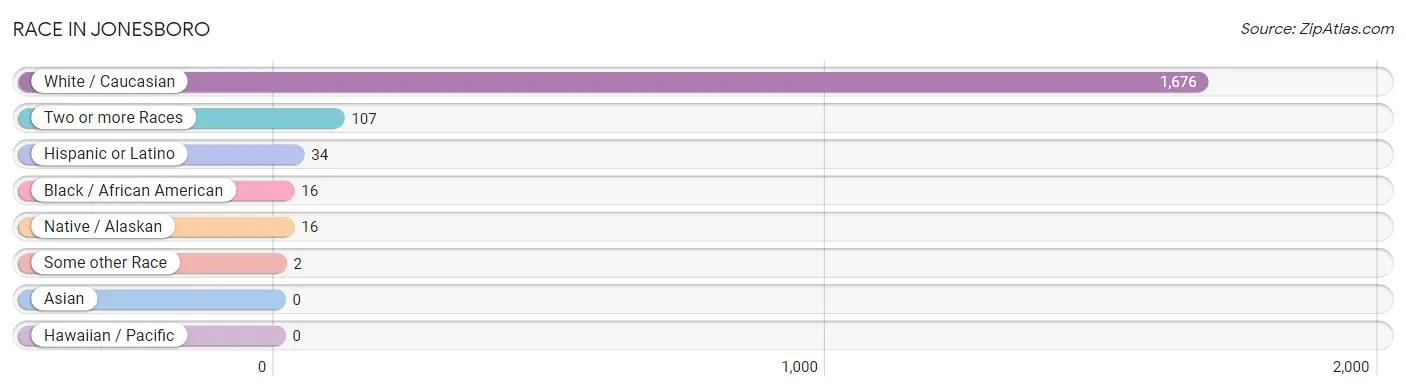
| Race | # Population | % Population |
| Asian | 0 | 0.0% |
| Black / African American | 16 | 0.9% |
| Hawaiian / Pacific | 0 | 0.0% |
| Hispanic or Latino | 34 | 1.9% |
| Native / Alaskan | 16 | 0.9% |
| White / Caucasian | 1,676 | 92.2% |
| Two or more Races | 107 | 5.9% |
| Some other Race | 2 | 0.1% |
| Total | 1,817 | 100.0% |
Ancestry in Jonesboro
The most populous ancestries reported in Jonesboro are German (352 | 19.4%), English (171 | 9.4%), American (149 | 8.2%), Irish (85 | 4.7%), and Italian (38 | 2.1%), together accounting for 43.8% of all Jonesboro residents.
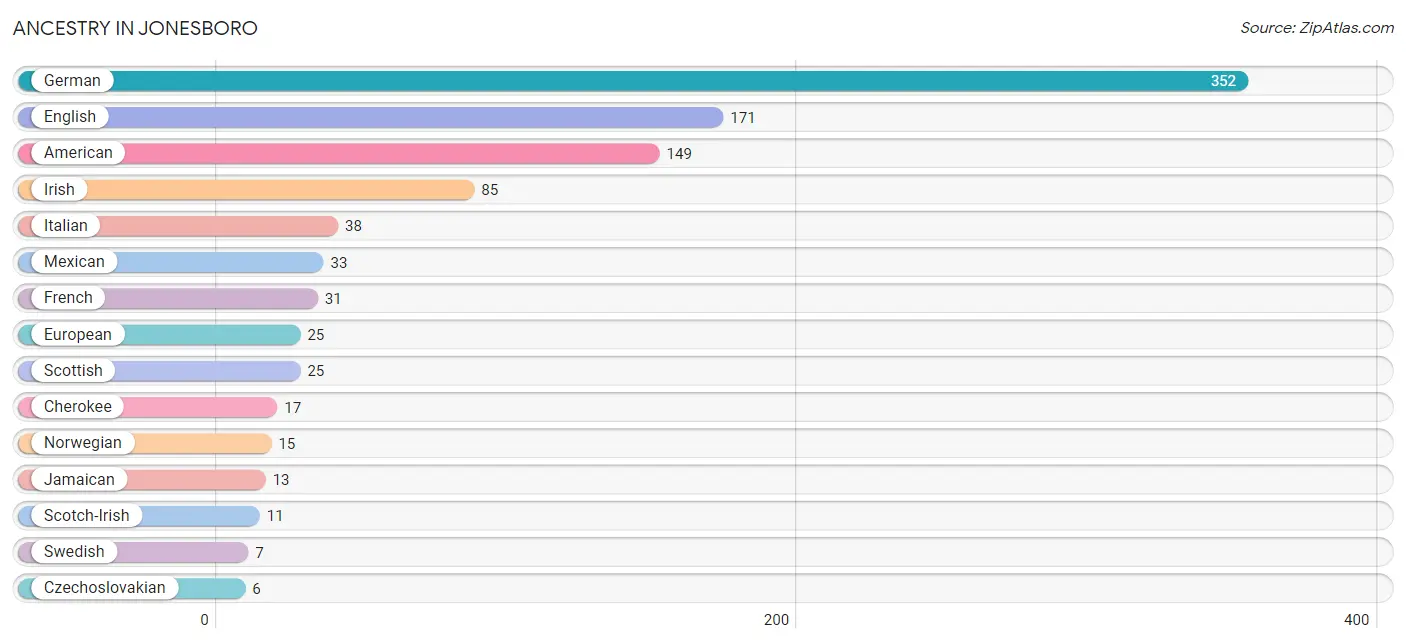
| Ancestry | # Population | % Population |
| American | 149 | 8.2% |
| British | 4 | 0.2% |
| Cherokee | 17 | 0.9% |
| Czechoslovakian | 6 | 0.3% |
| Danish | 6 | 0.3% |
| Dutch | 3 | 0.2% |
| English | 171 | 9.4% |
| European | 25 | 1.4% |
| French | 31 | 1.7% |
| German | 352 | 19.4% |
| Irish | 85 | 4.7% |
| Italian | 38 | 2.1% |
| Jamaican | 13 | 0.7% |
| Mexican | 33 | 1.8% |
| Northern European | 2 | 0.1% |
| Norwegian | 15 | 0.8% |
| Peruvian | 1 | 0.1% |
| Polish | 6 | 0.3% |
| Scandinavian | 5 | 0.3% |
| Scotch-Irish | 11 | 0.6% |
| Scottish | 25 | 1.4% |
| Sioux | 5 | 0.3% |
| South American | 1 | 0.1% |
| Swedish | 7 | 0.4% | View All 24 Rows |
Immigrants in Jonesboro
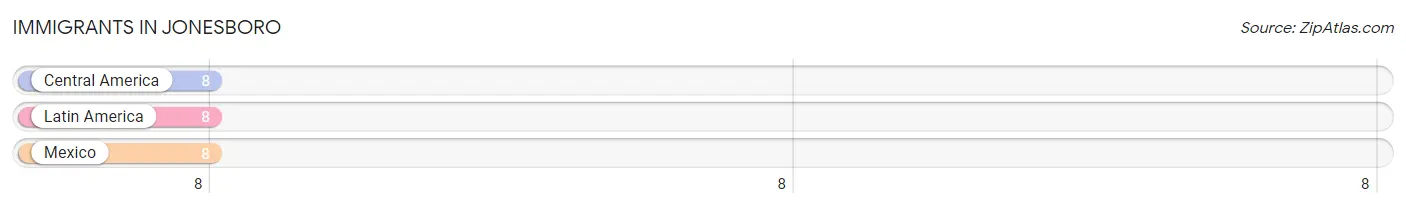
The most numerous immigrant groups reported in Jonesboro came from Central America (8 | 0.4%), Latin America (8 | 0.4%), and Mexico (8 | 0.4%), together accounting for 1.3% of all Jonesboro residents.
| Immigration Origin | # Population | % Population |
| Central America | 8 | 0.4% |
| Latin America | 8 | 0.4% |
| Mexico | 8 | 0.4% | View All 3 Rows |
Sex and Age in Jonesboro
Sex and Age in Jonesboro
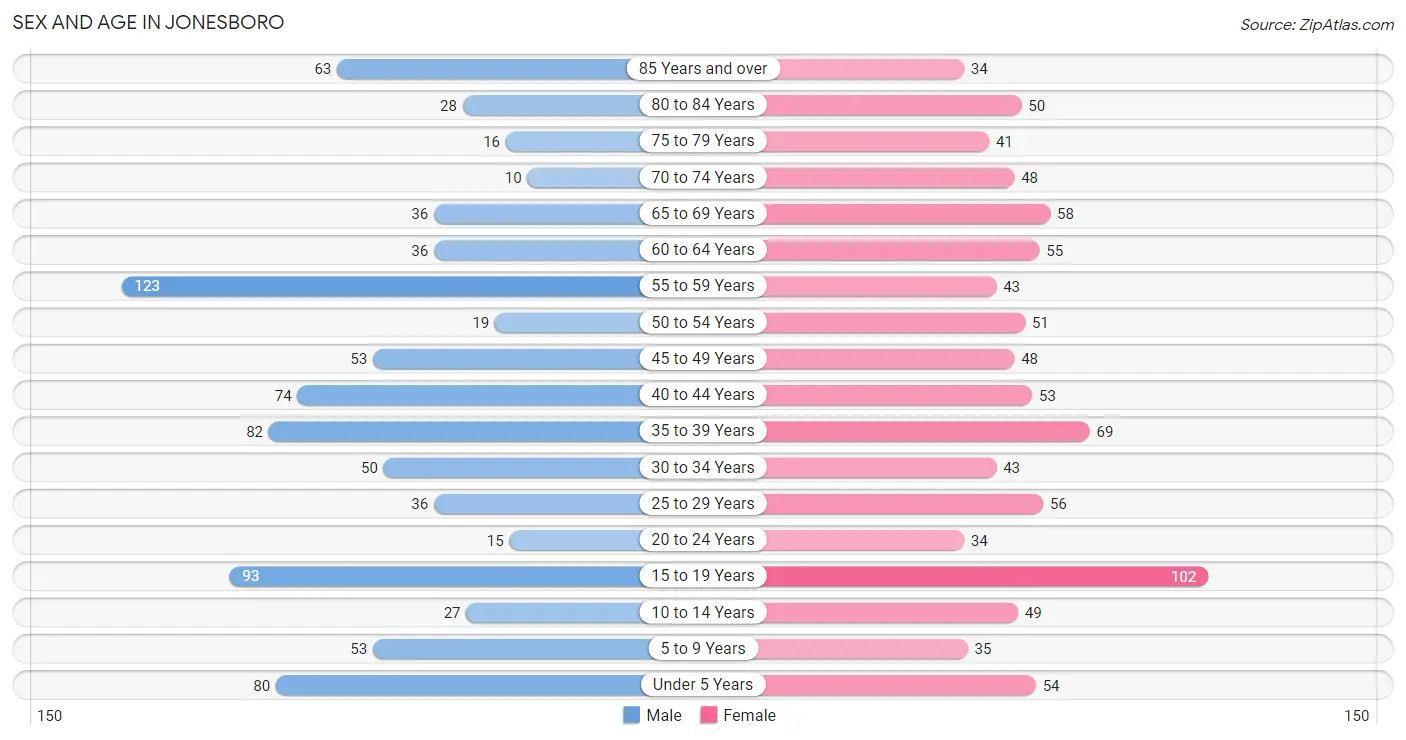
The most populous age groups in Jonesboro are 55 to 59 Years (123 | 13.8%) for men and 15 to 19 Years (102 | 11.1%) for women.
| Age Bracket | Male | Female |
| Under 5 Years | 80 (8.9%) | 54 (5.9%) |
| 5 to 9 Years | 53 (5.9%) | 35 (3.8%) |
| 10 to 14 Years | 27 (3.0%) | 49 (5.3%) |
| 15 to 19 Years | 93 (10.4%) | 102 (11.1%) |
| 20 to 24 Years | 15 (1.7%) | 34 (3.7%) |
| 25 to 29 Years | 36 (4.0%) | 56 (6.1%) |
| 30 to 34 Years | 50 (5.6%) | 43 (4.7%) |
| 35 to 39 Years | 82 (9.2%) | 69 (7.5%) |
| 40 to 44 Years | 74 (8.3%) | 53 (5.7%) |
| 45 to 49 Years | 53 (5.9%) | 48 (5.2%) |
| 50 to 54 Years | 19 (2.1%) | 51 (5.5%) |
| 55 to 59 Years | 123 (13.8%) | 43 (4.7%) |
| 60 to 64 Years | 36 (4.0%) | 55 (6.0%) |
| 65 to 69 Years | 36 (4.0%) | 58 (6.3%) |
| 70 to 74 Years | 10 (1.1%) | 48 (5.2%) |
| 75 to 79 Years | 16 (1.8%) | 41 (4.4%) |
| 80 to 84 Years | 28 (3.1%) | 50 (5.4%) |
| 85 Years and over | 63 (7.0%) | 34 (3.7%) |
| Total | 894 (100.0%) | 923 (100.0%) |
Families and Households in Jonesboro
Median Family Size in Jonesboro
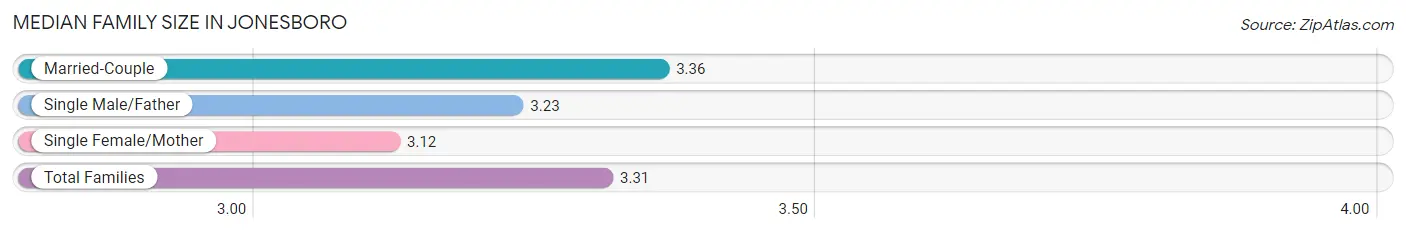
The median family size in Jonesboro is 3.31 persons per family, with married-couple families (293 | 76.1%) accounting for the largest median family size of 3.36 persons per family. On the other hand, single female/mother families (57 | 14.8%) represent the smallest median family size with 3.12 persons per family.
| Family Type | # Families | Family Size |
| Married-Couple | 293 (76.1%) | 3.36 |
| Single Male/Father | 35 (9.1%) | 3.23 |
| Single Female/Mother | 57 (14.8%) | 3.12 |
| Total Families | 385 (100.0%) | 3.31 |
Median Household Size in Jonesboro
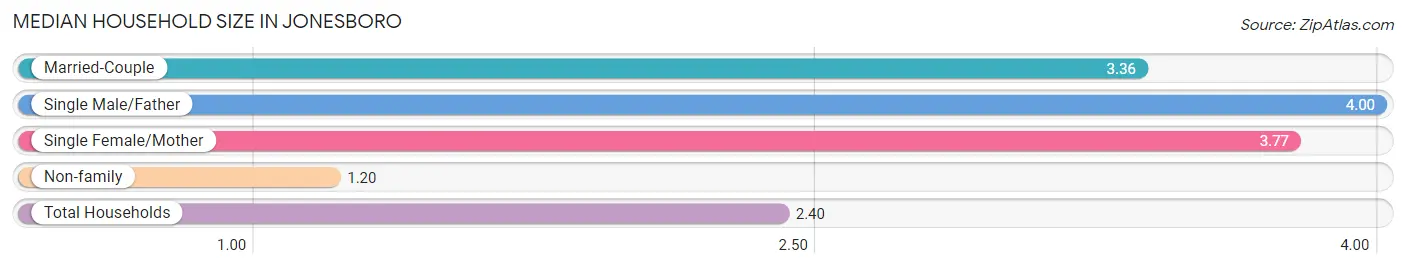
The median household size in Jonesboro is 2.40 persons per household, with single male/father households (35 | 4.8%) accounting for the largest median household size of 4 persons per household. non-family households (348 | 47.5%) represent the smallest median household size with 1.20 persons per household.
| Household Type | # Households | Household Size |
| Married-Couple | 293 (40.0%) | 3.36 |
| Single Male/Father | 35 (4.8%) | 4.00 |
| Single Female/Mother | 57 (7.8%) | 3.77 |
| Non-family | 348 (47.5%) | 1.20 |
| Total Households | 733 (100.0%) | 2.40 |
Household Size by Marriage Status in Jonesboro
Out of a total of 733 households in Jonesboro, 385 (52.5%) are family households, while 348 (47.5%) are nonfamily households. The most numerous type of family households are 4-person households, comprising 145, and the most common type of nonfamily households are 1-person households, comprising 302.
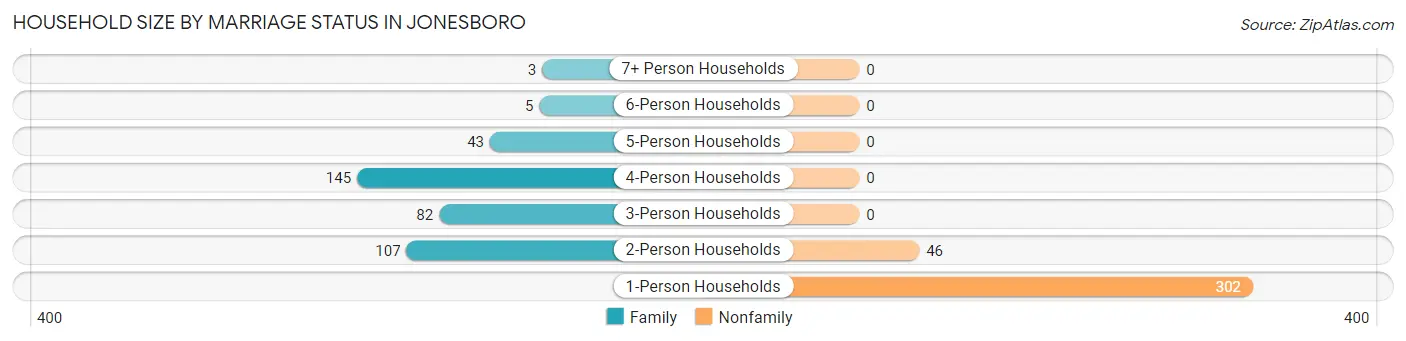
| Household Size | Family Households | Nonfamily Households |
| 1-Person Households | - | 302 (41.2%) |
| 2-Person Households | 107 (14.6%) | 46 (6.3%) |
| 3-Person Households | 82 (11.2%) | 0 (0.0%) |
| 4-Person Households | 145 (19.8%) | 0 (0.0%) |
| 5-Person Households | 43 (5.9%) | 0 (0.0%) |
| 6-Person Households | 5 (0.7%) | 0 (0.0%) |
| 7+ Person Households | 3 (0.4%) | 0 (0.0%) |
| Total | 385 (52.5%) | 348 (47.5%) |
Female Fertility in Jonesboro
Fertility by Age in Jonesboro
Average fertility rate in Jonesboro is 99.0 births per 1,000 women. Women in the age bracket of 20 to 34 years have the highest fertility rate with 165.0 births per 1,000 women. Women in the age bracket of 20 to 34 years acount for 52.4% of all women with births.
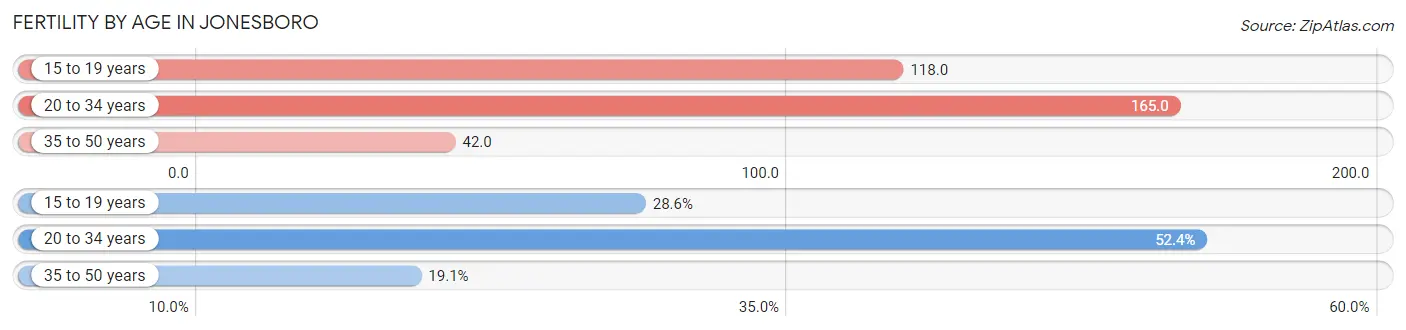
| Age Bracket | Women with Births | Births / 1,000 Women |
| 15 to 19 years | 12 (28.6%) | 118.0 |
| 20 to 34 years | 22 (52.4%) | 165.0 |
| 35 to 50 years | 8 (19.1%) | 42.0 |
| Total | 42 (100.0%) | 99.0 |
Fertility by Age by Marriage Status in Jonesboro
21.4% of women with births (42) in Jonesboro are married. The highest percentage of unmarried women with births falls into 15 to 19 years age bracket with 100.0% of them unmarried at the time of birth, while the lowest percentage of unmarried women with births belong to 35 to 50 years age bracket with 0.0% of them unmarried.
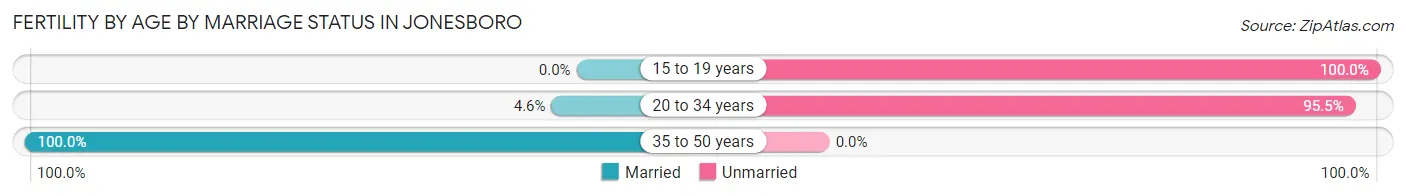
| Age Bracket | Married | Unmarried |
| 15 to 19 years | 0 (0.0%) | 12 (100.0%) |
| 20 to 34 years | 1 (4.5%) | 21 (95.5%) |
| 35 to 50 years | 8 (100.0%) | 0 (0.0%) |
| Total | 9 (21.4%) | 33 (78.6%) |
Fertility by Education in Jonesboro
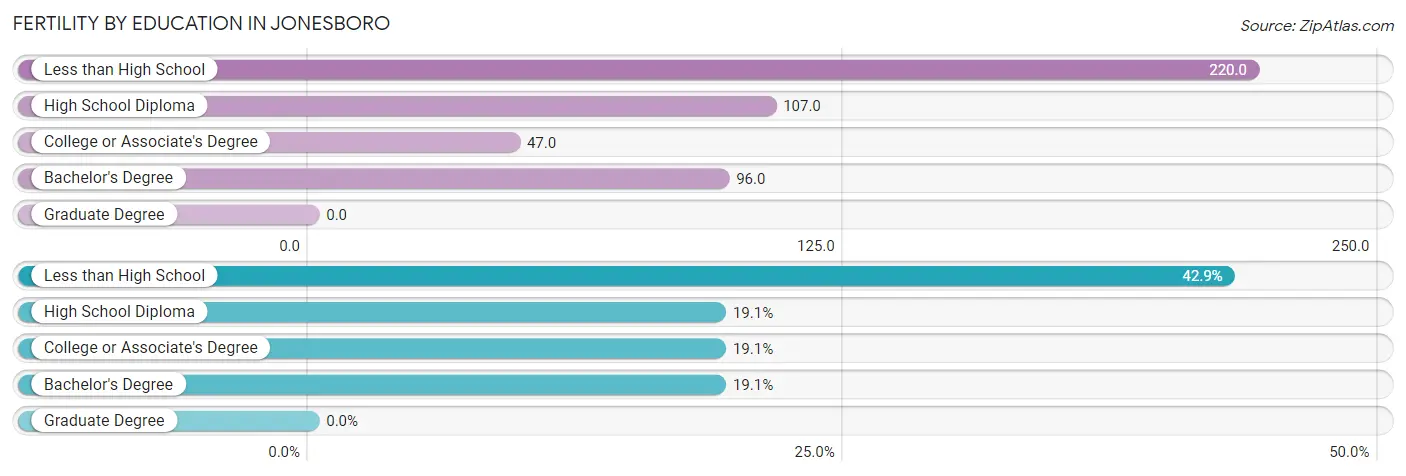
| Educational Attainment | Women with Births | Births / 1,000 Women |
| Less than High School | 18 (42.9%) | 220.0 |
| High School Diploma | 8 (19.1%) | 107.0 |
| College or Associate's Degree | 8 (19.1%) | 47.0 |
| Bachelor's Degree | 8 (19.1%) | 96.0 |
| Graduate Degree | 0 (0.0%) | 0.0 |
| Total | 42 (100.0%) | 99.0 |
Fertility by Education by Marriage Status in Jonesboro
78.6% of women with births in Jonesboro are unmarried. Women with the educational attainment of bachelor's degree are most likely to be married with 100.0% of them married at childbirth, while women with the educational attainment of less than high school are least likely to be married with 100.0% of them unmarried at childbirth.
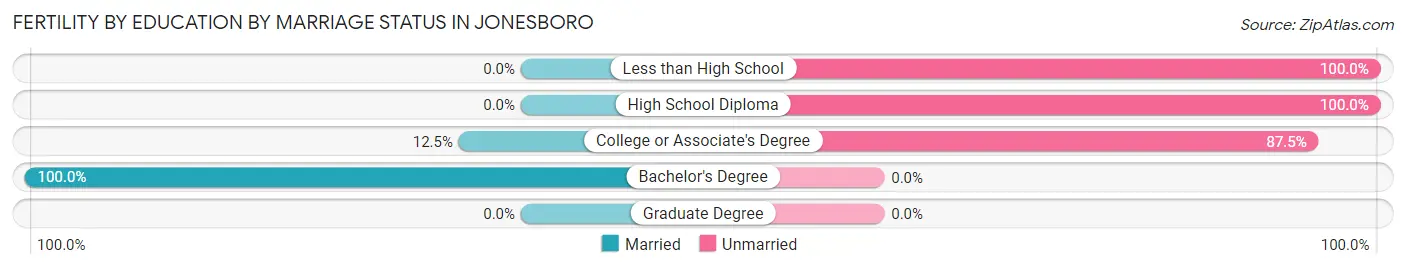
| Educational Attainment | Married | Unmarried |
| Less than High School | 0 (0.0%) | 18 (100.0%) |
| High School Diploma | 0 (0.0%) | 8 (100.0%) |
| College or Associate's Degree | 1 (12.5%) | 7 (87.5%) |
| Bachelor's Degree | 8 (100.0%) | 0 (0.0%) |
| Graduate Degree | 0 (0.0%) | 0 (0.0%) |
| Total | 9 (21.4%) | 33 (78.6%) |
Employment Characteristics in Jonesboro
Employment by Class of Employer in Jonesboro
Among the 711 employed individuals in Jonesboro, private company employees (406 | 57.1%), state government employees (105 | 14.8%), and local government employees (84 | 11.8%) make up the most common classes of employment.
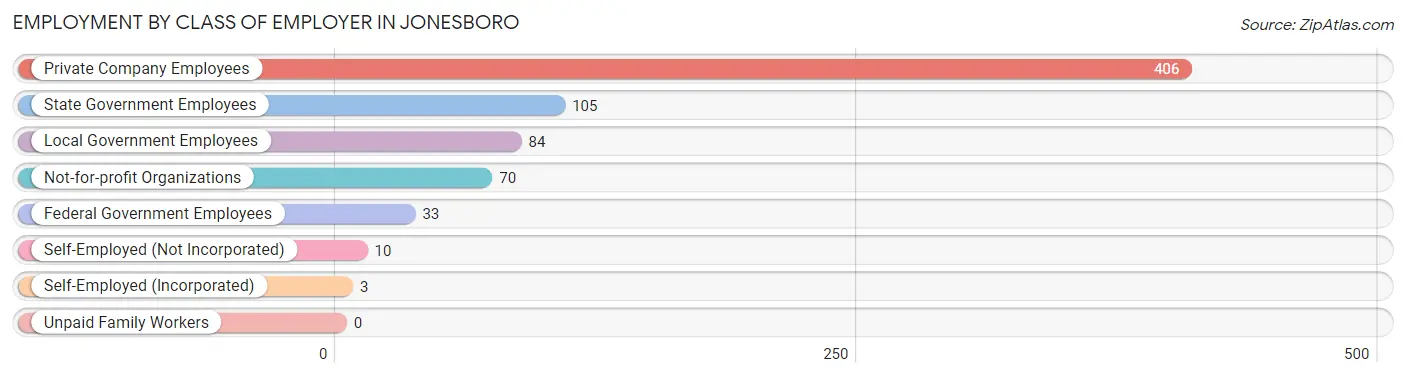
| Employer Class | # Employees | % Employees |
| Private Company Employees | 406 | 57.1% |
| Self-Employed (Incorporated) | 3 | 0.4% |
| Self-Employed (Not Incorporated) | 10 | 1.4% |
| Not-for-profit Organizations | 70 | 9.9% |
| Local Government Employees | 84 | 11.8% |
| State Government Employees | 105 | 14.8% |
| Federal Government Employees | 33 | 4.6% |
| Unpaid Family Workers | 0 | 0.0% |
| Total | 711 | 100.0% |
Employment Status by Age in Jonesboro
According to the labor force statistics for Jonesboro, out of the total population over 16 years of age (1,462), 51.6% or 754 individuals are in the labor force, with 5.0% or 38 of them unemployed. The age group with the highest labor force participation rate is 30 to 34 years, with 89.2% or 83 individuals in the labor force. Within the labor force, the 16 to 19 years age range has the highest percentage of unemployed individuals, with 24.7% or 20 of them being unemployed.
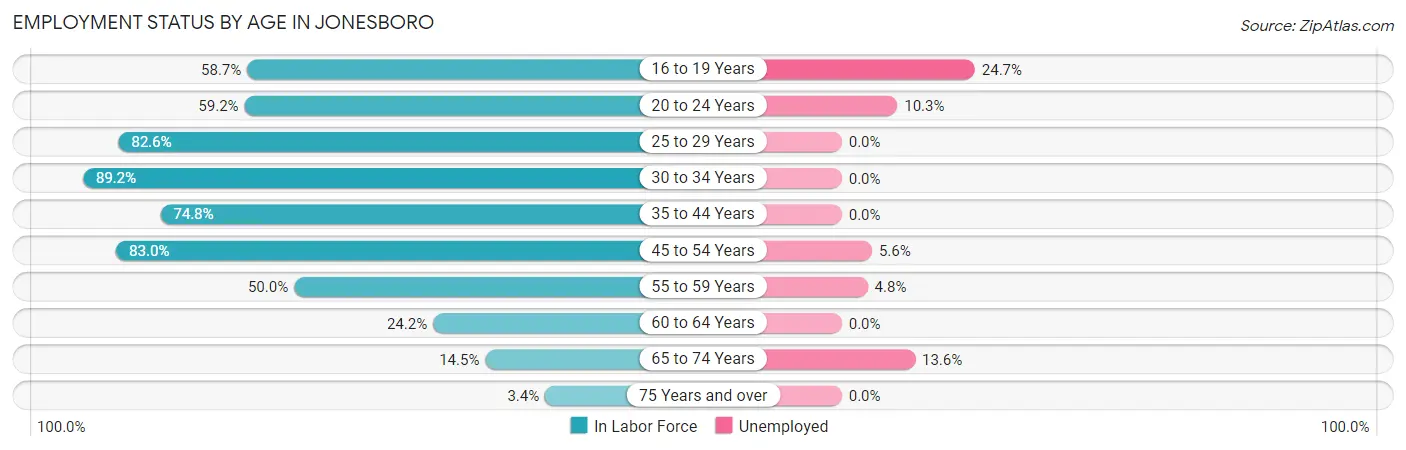
| Age Bracket | In Labor Force | Unemployed |
| 16 to 19 Years | 81 (58.7%) | 20 (24.7%) |
| 20 to 24 Years | 29 (59.2%) | 3 (10.3%) |
| 25 to 29 Years | 76 (82.6%) | 0 (0.0%) |
| 30 to 34 Years | 83 (89.2%) | 0 (0.0%) |
| 35 to 44 Years | 208 (74.8%) | 0 (0.0%) |
| 45 to 54 Years | 142 (83.0%) | 8 (5.6%) |
| 55 to 59 Years | 83 (50.0%) | 4 (4.8%) |
| 60 to 64 Years | 22 (24.2%) | 0 (0.0%) |
| 65 to 74 Years | 22 (14.5%) | 3 (13.6%) |
| 75 Years and over | 8 (3.4%) | 0 (0.0%) |
| Total | 754 (51.6%) | 38 (5.0%) |
Employment Status by Educational Attainment in Jonesboro
According to labor force statistics for Jonesboro, 68.9% of individuals (614) out of the total population between 25 and 64 years of age (891) are in the labor force, with 2.0% or 12 of them being unemployed. The group with the highest labor force participation rate are those with the educational attainment of bachelor's degree or higher, with 86.3% or 253 individuals in the labor force. Within the labor force, individuals with less than high school education have the highest percentage of unemployment, with 36.4% or 4 of them being unemployed.
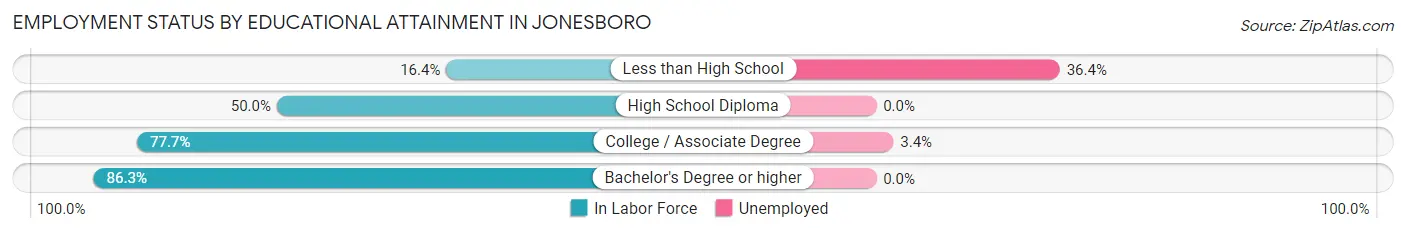
| Educational Attainment | In Labor Force | Unemployed |
| Less than High School | 11 (16.4%) | 24 (36.4%) |
| High School Diploma | 113 (50.0%) | 0 (0.0%) |
| College / Associate Degree | 237 (77.7%) | 10 (3.4%) |
| Bachelor's Degree or higher | 253 (86.3%) | 0 (0.0%) |
| Total | 614 (68.9%) | 18 (2.0%) |
Employment Occupations by Sex in Jonesboro
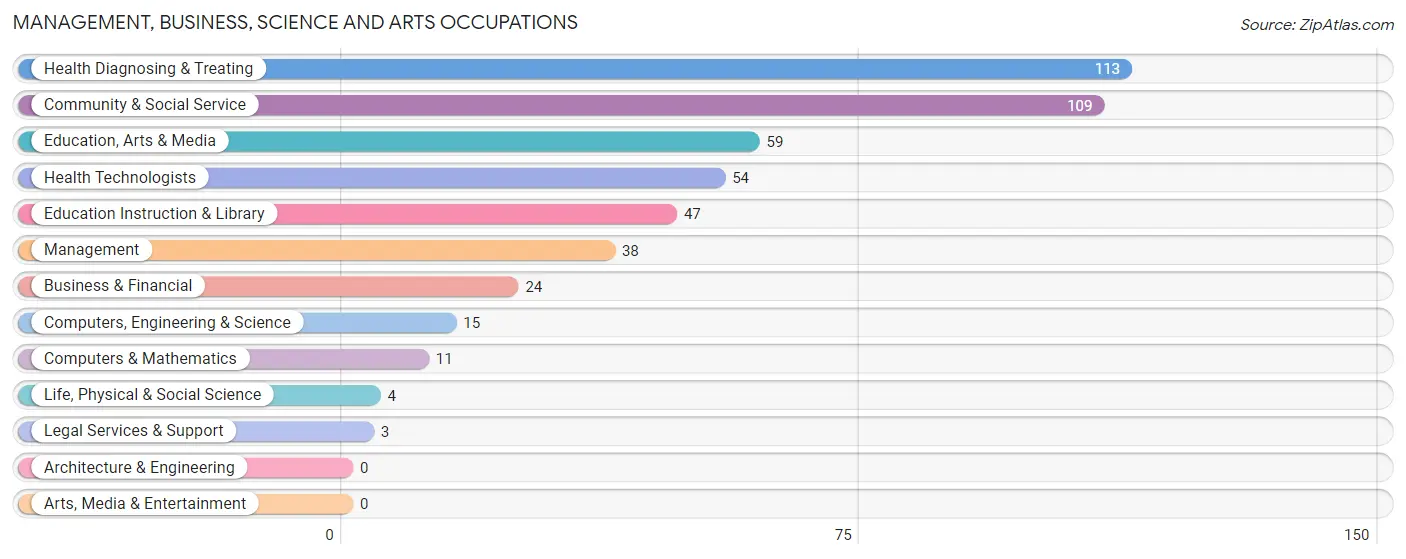
Management, Business, Science and Arts Occupations
The most common Management, Business, Science and Arts occupations in Jonesboro are Health Diagnosing & Treating (113 | 15.8%), Community & Social Service (109 | 15.2%), Education, Arts & Media (59 | 8.2%), Health Technologists (54 | 7.5%), and Education Instruction & Library (47 | 6.6%).
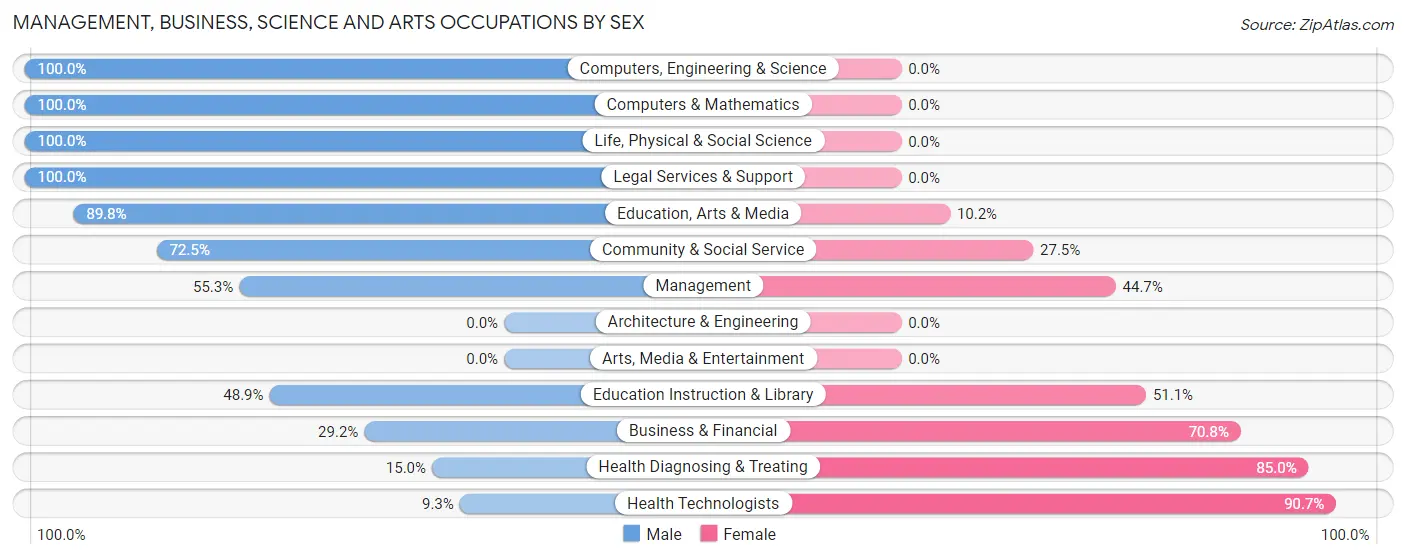
Management, Business, Science and Arts Occupations by Sex
Within the Management, Business, Science and Arts occupations in Jonesboro, the most male-oriented occupations are Computers, Engineering & Science (100.0%), Computers & Mathematics (100.0%), and Life, Physical & Social Science (100.0%), while the most female-oriented occupations are Health Technologists (90.7%), Health Diagnosing & Treating (85.0%), and Business & Financial (70.8%).
| Occupation | Male | Female |
| Management | 21 (55.3%) | 17 (44.7%) |
| Business & Financial | 7 (29.2%) | 17 (70.8%) |
| Computers, Engineering & Science | 15 (100.0%) | 0 (0.0%) |
| Computers & Mathematics | 11 (100.0%) | 0 (0.0%) |
| Architecture & Engineering | 0 (0.0%) | 0 (0.0%) |
| Life, Physical & Social Science | 4 (100.0%) | 0 (0.0%) |
| Community & Social Service | 79 (72.5%) | 30 (27.5%) |
| Education, Arts & Media | 53 (89.8%) | 6 (10.2%) |
| Legal Services & Support | 3 (100.0%) | 0 (0.0%) |
| Education Instruction & Library | 23 (48.9%) | 24 (51.1%) |
| Arts, Media & Entertainment | 0 (0.0%) | 0 (0.0%) |
| Health Diagnosing & Treating | 17 (15.0%) | 96 (85.0%) |
| Health Technologists | 5 (9.3%) | 49 (90.7%) |
| Total (Category) | 139 (46.5%) | 160 (53.5%) |
| Total (Overall) | 378 (52.8%) | 338 (47.2%) |
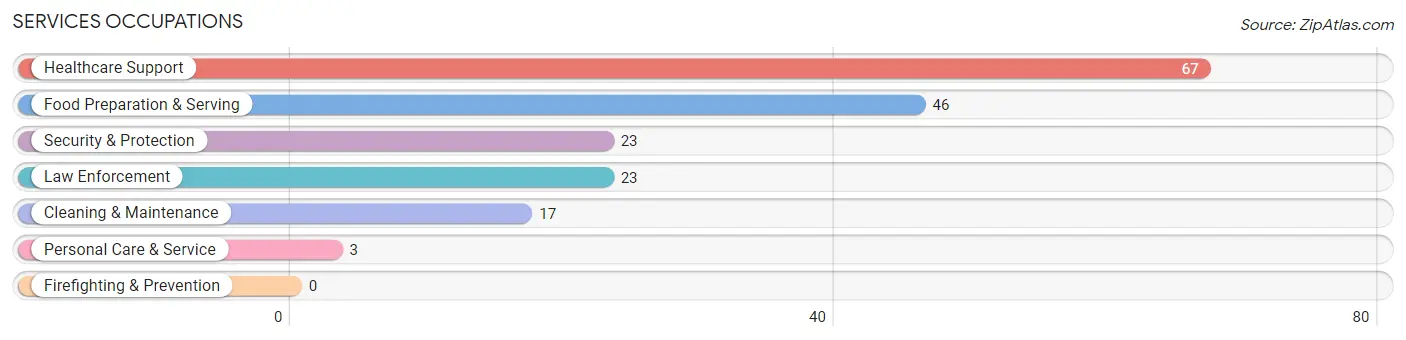
Services Occupations
The most common Services occupations in Jonesboro are Healthcare Support (67 | 9.4%), Food Preparation & Serving (46 | 6.4%), Security & Protection (23 | 3.2%), Law Enforcement (23 | 3.2%), and Cleaning & Maintenance (17 | 2.4%).
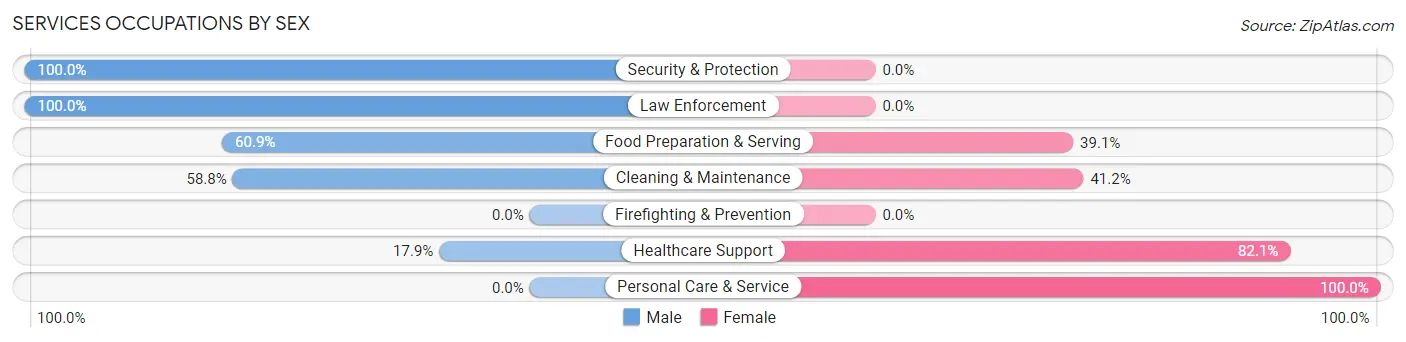
Services Occupations by Sex
Within the Services occupations in Jonesboro, the most male-oriented occupations are Security & Protection (100.0%), Law Enforcement (100.0%), and Food Preparation & Serving (60.9%), while the most female-oriented occupations are Personal Care & Service (100.0%), Healthcare Support (82.1%), and Cleaning & Maintenance (41.2%).
| Occupation | Male | Female |
| Healthcare Support | 12 (17.9%) | 55 (82.1%) |
| Security & Protection | 23 (100.0%) | 0 (0.0%) |
| Firefighting & Prevention | 0 (0.0%) | 0 (0.0%) |
| Law Enforcement | 23 (100.0%) | 0 (0.0%) |
| Food Preparation & Serving | 28 (60.9%) | 18 (39.1%) |
| Cleaning & Maintenance | 10 (58.8%) | 7 (41.2%) |
| Personal Care & Service | 0 (0.0%) | 3 (100.0%) |
| Total (Category) | 73 (46.8%) | 83 (53.2%) |
| Total (Overall) | 378 (52.8%) | 338 (47.2%) |
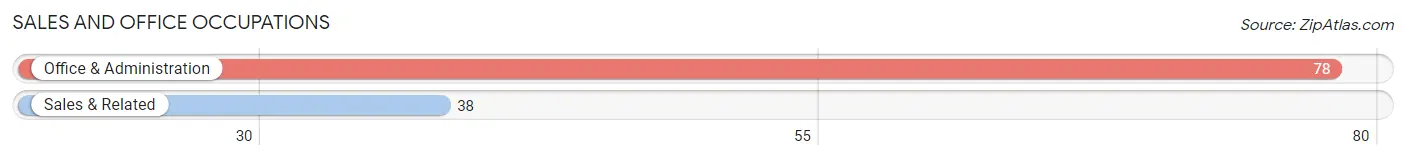
Sales and Office Occupations
The most common Sales and Office occupations in Jonesboro are Office & Administration (78 | 10.9%), and Sales & Related (38 | 5.3%).
Sales and Office Occupations by Sex
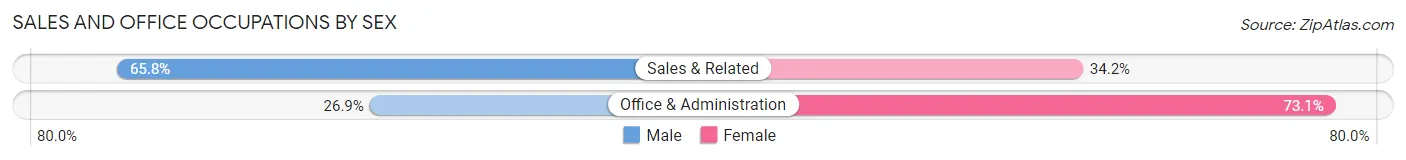
| Occupation | Male | Female |
| Sales & Related | 25 (65.8%) | 13 (34.2%) |
| Office & Administration | 21 (26.9%) | 57 (73.1%) |
| Total (Category) | 46 (39.7%) | 70 (60.3%) |
| Total (Overall) | 378 (52.8%) | 338 (47.2%) |
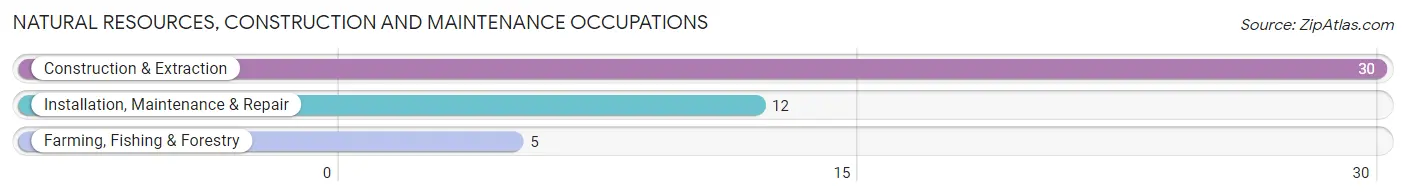
Natural Resources, Construction and Maintenance Occupations
The most common Natural Resources, Construction and Maintenance occupations in Jonesboro are Construction & Extraction (30 | 4.2%), Installation, Maintenance & Repair (12 | 1.7%), and Farming, Fishing & Forestry (5 | 0.7%).
Natural Resources, Construction and Maintenance Occupations by Sex
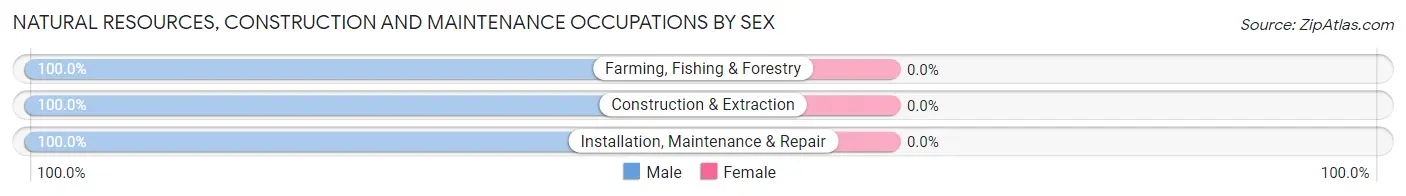
| Occupation | Male | Female |
| Farming, Fishing & Forestry | 5 (100.0%) | 0 (0.0%) |
| Construction & Extraction | 30 (100.0%) | 0 (0.0%) |
| Installation, Maintenance & Repair | 12 (100.0%) | 0 (0.0%) |
| Total (Category) | 47 (100.0%) | 0 (0.0%) |
| Total (Overall) | 378 (52.8%) | 338 (47.2%) |
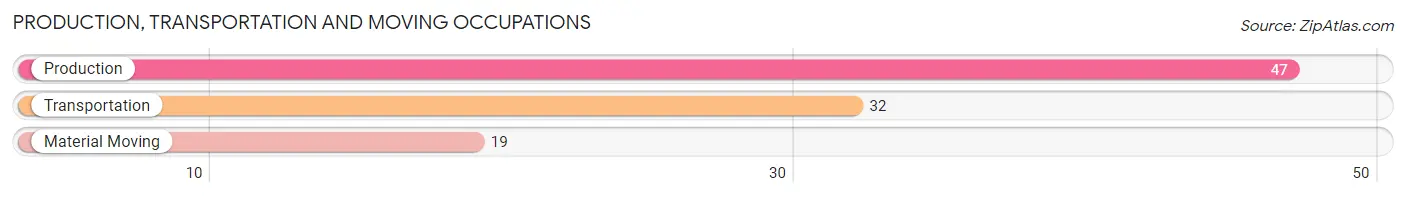
Production, Transportation and Moving Occupations
The most common Production, Transportation and Moving occupations in Jonesboro are Production (47 | 6.6%), Transportation (32 | 4.5%), and Material Moving (19 | 2.6%).
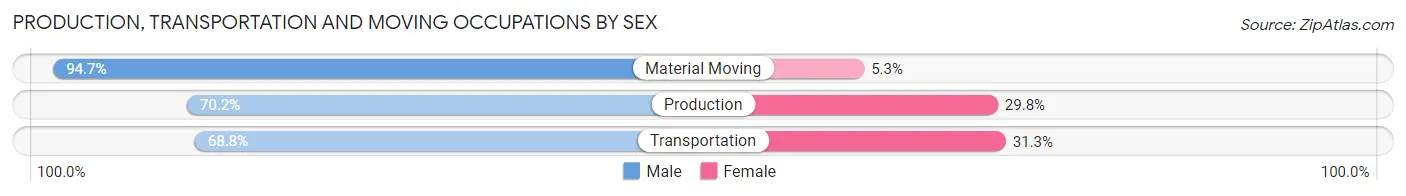
Production, Transportation and Moving Occupations by Sex
| Occupation | Male | Female |
| Production | 33 (70.2%) | 14 (29.8%) |
| Transportation | 22 (68.8%) | 10 (31.2%) |
| Material Moving | 18 (94.7%) | 1 (5.3%) |
| Total (Category) | 73 (74.5%) | 25 (25.5%) |
| Total (Overall) | 378 (52.8%) | 338 (47.2%) |
Employment Industries by Sex in Jonesboro
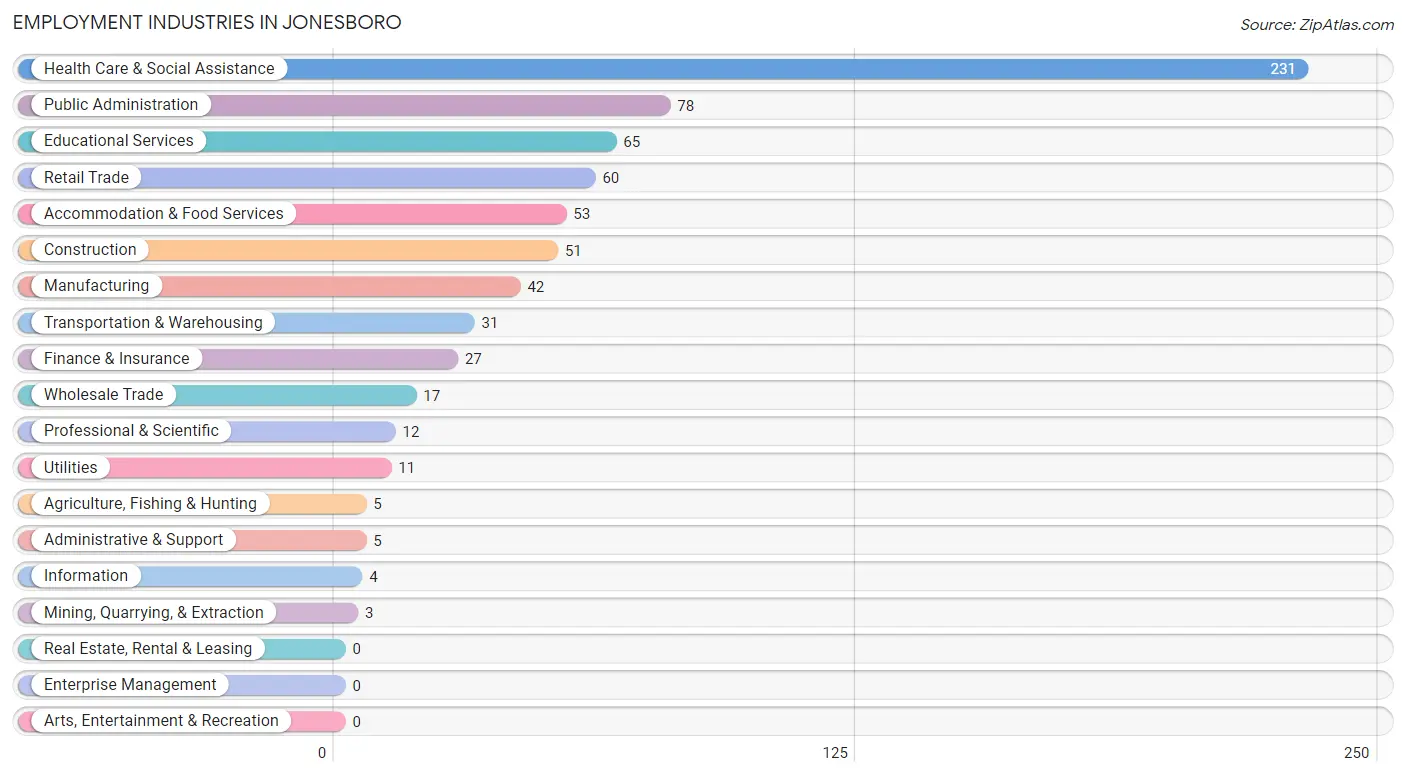
Employment Industries in Jonesboro
The major employment industries in Jonesboro include Health Care & Social Assistance (231 | 32.3%), Public Administration (78 | 10.9%), Educational Services (65 | 9.1%), Retail Trade (60 | 8.4%), and Accommodation & Food Services (53 | 7.4%).
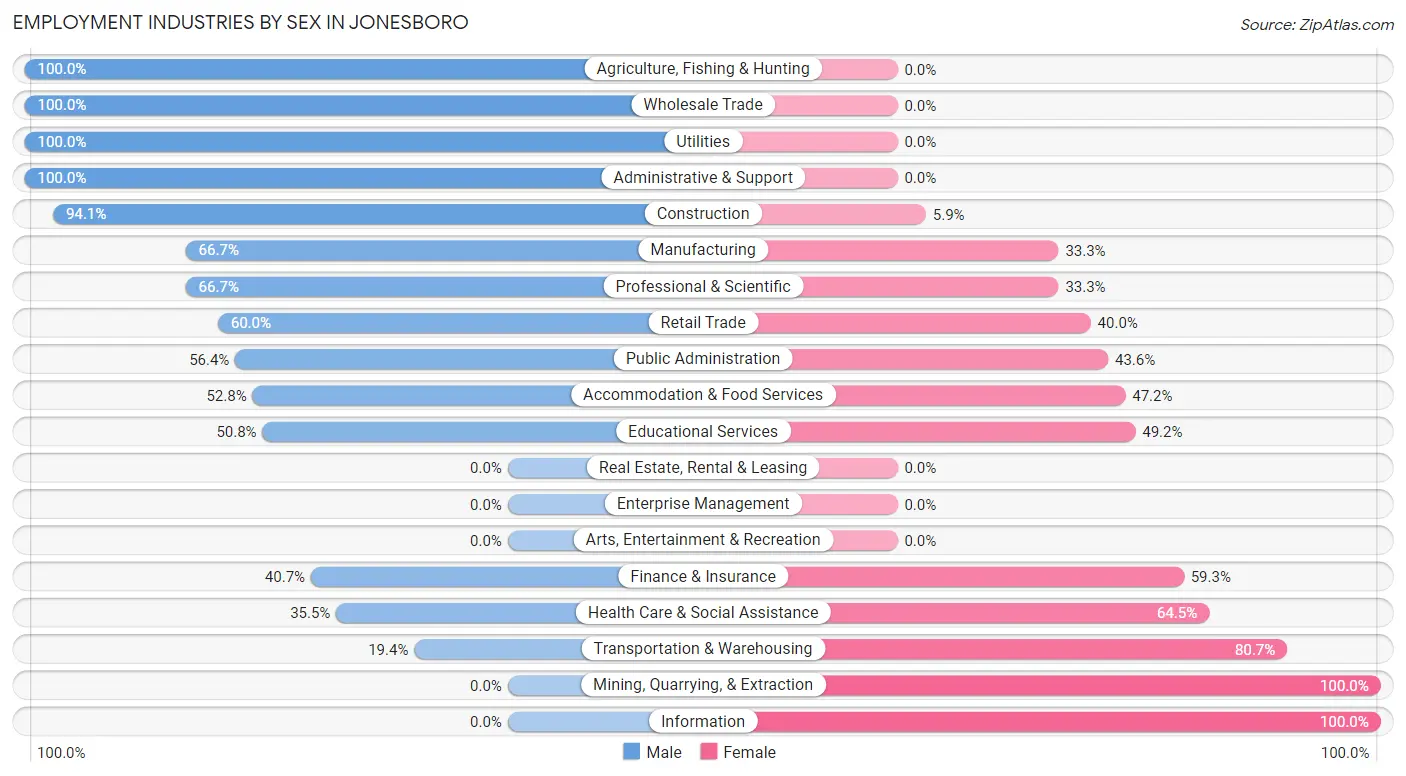
Employment Industries by Sex in Jonesboro
The Jonesboro industries that see more men than women are Agriculture, Fishing & Hunting (100.0%), Wholesale Trade (100.0%), and Utilities (100.0%), whereas the industries that tend to have a higher number of women are Mining, Quarrying, & Extraction (100.0%), Information (100.0%), and Transportation & Warehousing (80.6%).
| Industry | Male | Female |
| Agriculture, Fishing & Hunting | 5 (100.0%) | 0 (0.0%) |
| Mining, Quarrying, & Extraction | 0 (0.0%) | 3 (100.0%) |
| Construction | 48 (94.1%) | 3 (5.9%) |
| Manufacturing | 28 (66.7%) | 14 (33.3%) |
| Wholesale Trade | 17 (100.0%) | 0 (0.0%) |
| Retail Trade | 36 (60.0%) | 24 (40.0%) |
| Transportation & Warehousing | 6 (19.4%) | 25 (80.6%) |
| Utilities | 11 (100.0%) | 0 (0.0%) |
| Information | 0 (0.0%) | 4 (100.0%) |
| Finance & Insurance | 11 (40.7%) | 16 (59.3%) |
| Real Estate, Rental & Leasing | 0 (0.0%) | 0 (0.0%) |
| Professional & Scientific | 8 (66.7%) | 4 (33.3%) |
| Enterprise Management | 0 (0.0%) | 0 (0.0%) |
| Administrative & Support | 5 (100.0%) | 0 (0.0%) |
| Educational Services | 33 (50.8%) | 32 (49.2%) |
| Health Care & Social Assistance | 82 (35.5%) | 149 (64.5%) |
| Arts, Entertainment & Recreation | 0 (0.0%) | 0 (0.0%) |
| Accommodation & Food Services | 28 (52.8%) | 25 (47.2%) |
| Public Administration | 44 (56.4%) | 34 (43.6%) |
| Total | 378 (52.8%) | 338 (47.2%) |
Education in Jonesboro
School Enrollment in Jonesboro
The most common levels of schooling among the 385 students in Jonesboro are high school (163 | 42.3%), elementary school (55 | 14.3%), and college / undergraduate (55 | 14.3%).
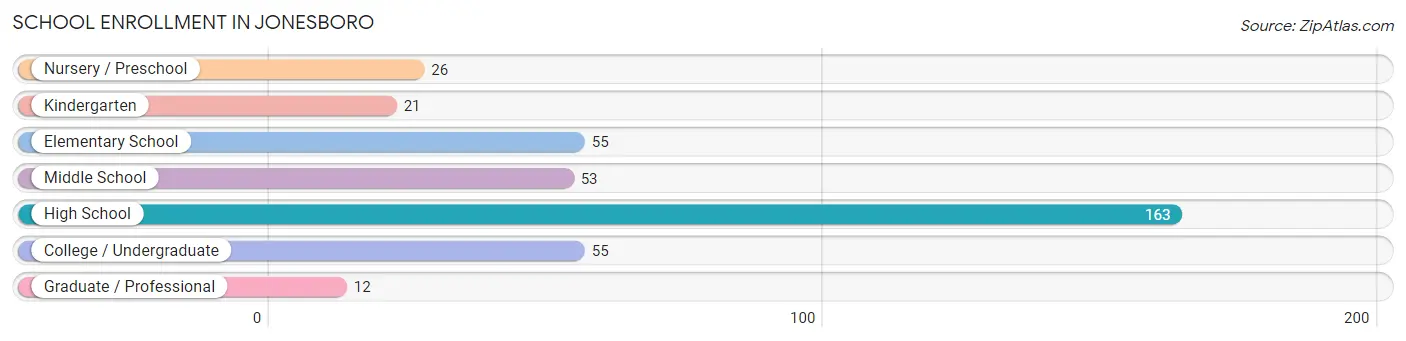
| School Level | # Students | % Students |
| Nursery / Preschool | 26 | 6.8% |
| Kindergarten | 21 | 5.4% |
| Elementary School | 55 | 14.3% |
| Middle School | 53 | 13.8% |
| High School | 163 | 42.3% |
| College / Undergraduate | 55 | 14.3% |
| Graduate / Professional | 12 | 3.1% |
| Total | 385 | 100.0% |
School Enrollment by Age by Funding Source in Jonesboro
Out of a total of 385 students who are enrolled in schools in Jonesboro, 17 (4.4%) attend a private institution, while the remaining 368 (95.6%) are enrolled in public schools. The age group of 20 to 24 year olds has the highest likelihood of being enrolled in private schools, with 13 (86.7% in the age bracket) enrolled. Conversely, the age group of 3 to 4 year olds has the lowest likelihood of being enrolled in a private school, with 25 (100.0% in the age bracket) attending a public institution.
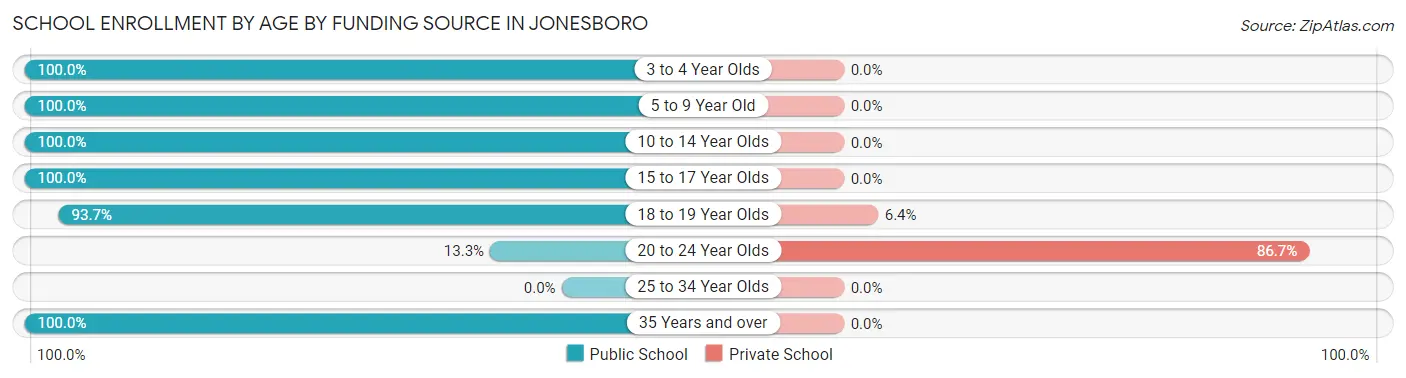
| Age Bracket | Public School | Private School |
| 3 to 4 Year Olds | 25 (100.0%) | 0 (0.0%) |
| 5 to 9 Year Old | 74 (100.0%) | 0 (0.0%) |
| 10 to 14 Year Olds | 66 (100.0%) | 0 (0.0%) |
| 15 to 17 Year Olds | 126 (100.0%) | 0 (0.0%) |
| 18 to 19 Year Olds | 59 (93.6%) | 4 (6.4%) |
| 20 to 24 Year Olds | 2 (13.3%) | 13 (86.7%) |
| 25 to 34 Year Olds | 0 (0.0%) | 0 (0.0%) |
| 35 Years and over | 16 (100.0%) | 0 (0.0%) |
| Total | 368 (95.6%) | 17 (4.4%) |
Educational Attainment by Field of Study in Jonesboro
Education (102 | 28.1%), arts & humanities (57 | 15.7%), psychology (44 | 12.1%), business (44 | 12.1%), and science & technology (28 | 7.7%) are the most common fields of study among 363 individuals in Jonesboro who have obtained a bachelor's degree or higher.
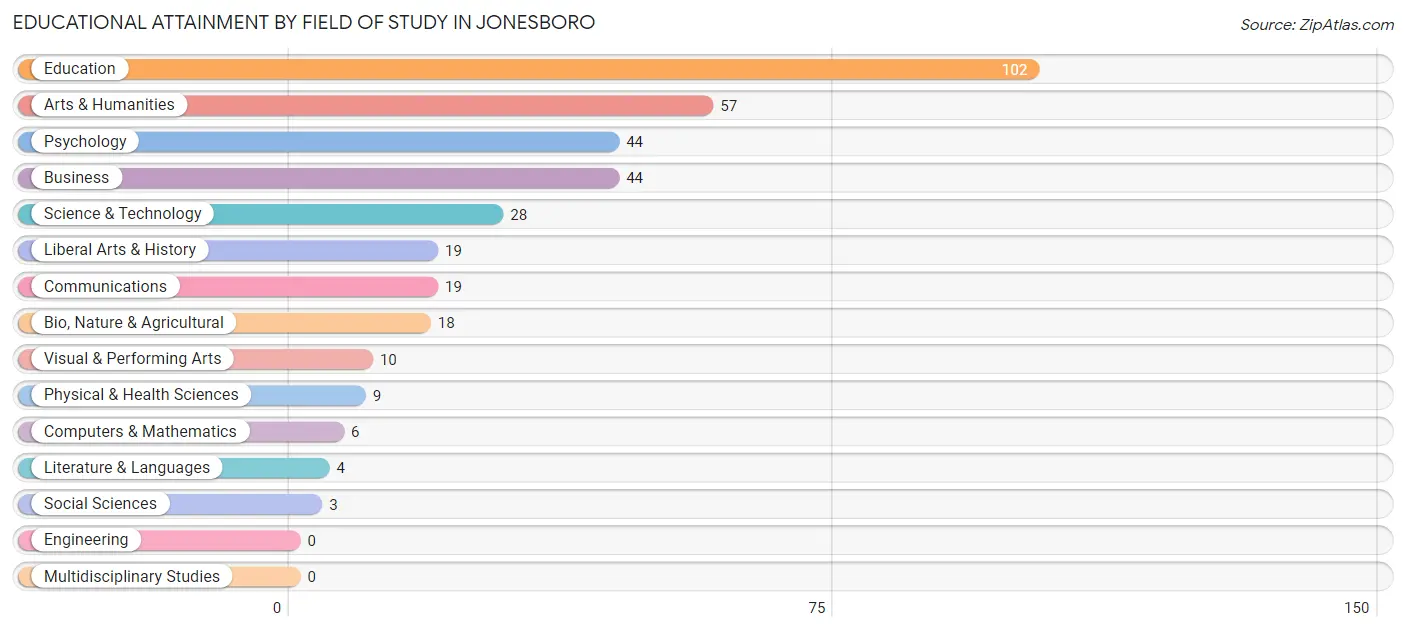
| Field of Study | # Graduates | % Graduates |
| Computers & Mathematics | 6 | 1.7% |
| Bio, Nature & Agricultural | 18 | 5.0% |
| Physical & Health Sciences | 9 | 2.5% |
| Psychology | 44 | 12.1% |
| Social Sciences | 3 | 0.8% |
| Engineering | 0 | 0.0% |
| Multidisciplinary Studies | 0 | 0.0% |
| Science & Technology | 28 | 7.7% |
| Business | 44 | 12.1% |
| Education | 102 | 28.1% |
| Literature & Languages | 4 | 1.1% |
| Liberal Arts & History | 19 | 5.2% |
| Visual & Performing Arts | 10 | 2.8% |
| Communications | 19 | 5.2% |
| Arts & Humanities | 57 | 15.7% |
| Total | 363 | 100.0% |
Transportation & Commute in Jonesboro
Vehicle Availability by Sex in Jonesboro
The most prevalent vehicle ownership categories in Jonesboro are males with 2 vehicles (215, accounting for 57.6%) and females with 2 vehicles (157, making up 63.6%).
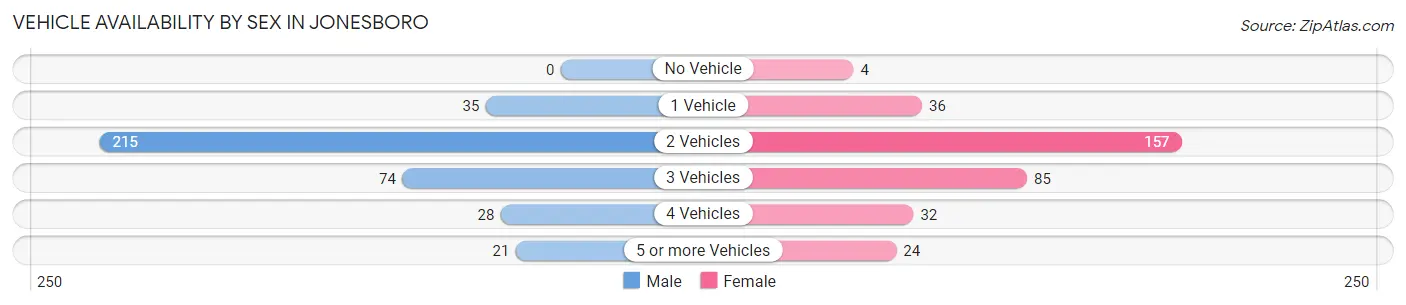
| Vehicles Available | Male | Female |
| No Vehicle | 0 (0.0%) | 4 (1.2%) |
| 1 Vehicle | 35 (9.4%) | 36 (10.6%) |
| 2 Vehicles | 215 (57.6%) | 157 (46.5%) |
| 3 Vehicles | 74 (19.8%) | 85 (25.2%) |
| 4 Vehicles | 28 (7.5%) | 32 (9.5%) |
| 5 or more Vehicles | 21 (5.6%) | 24 (7.1%) |
| Total | 373 (100.0%) | 338 (100.0%) |
Commute Time in Jonesboro
The most frequently occuring commute durations in Jonesboro are 10 to 14 minutes (164 commuters, 23.5%), 15 to 19 minutes (142 commuters, 20.4%), and 5 to 9 minutes (104 commuters, 14.9%).
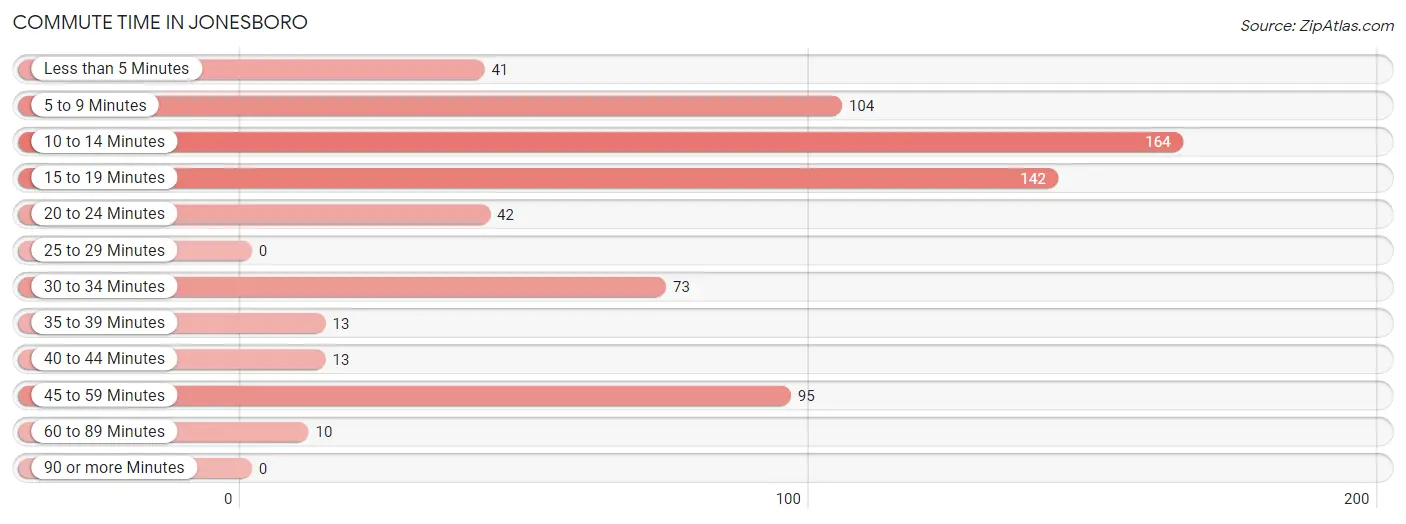
| Commute Time | # Commuters | % Commuters |
| Less than 5 Minutes | 41 | 5.9% |
| 5 to 9 Minutes | 104 | 14.9% |
| 10 to 14 Minutes | 164 | 23.5% |
| 15 to 19 Minutes | 142 | 20.4% |
| 20 to 24 Minutes | 42 | 6.0% |
| 25 to 29 Minutes | 0 | 0.0% |
| 30 to 34 Minutes | 73 | 10.5% |
| 35 to 39 Minutes | 13 | 1.9% |
| 40 to 44 Minutes | 13 | 1.9% |
| 45 to 59 Minutes | 95 | 13.6% |
| 60 to 89 Minutes | 10 | 1.4% |
| 90 or more Minutes | 0 | 0.0% |
Commute Time by Sex in Jonesboro
The most common commute times in Jonesboro are 10 to 14 minutes (94 commuters, 25.6%) for males and 10 to 14 minutes (70 commuters, 21.2%) for females.
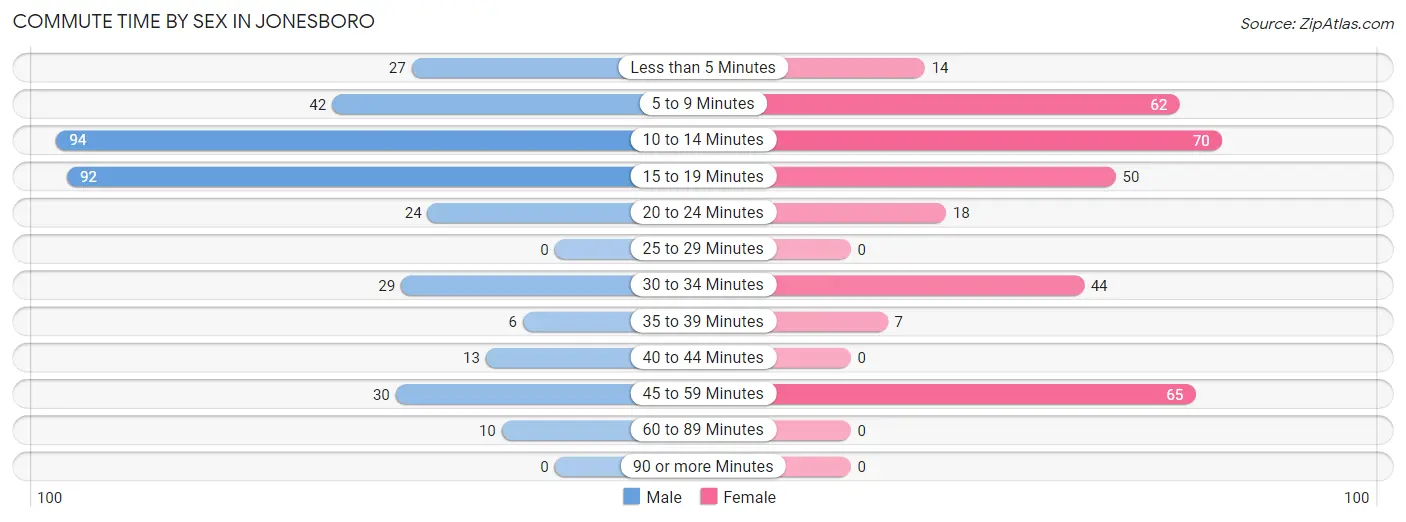
| Commute Time | Male | Female |
| Less than 5 Minutes | 27 (7.4%) | 14 (4.2%) |
| 5 to 9 Minutes | 42 (11.4%) | 62 (18.8%) |
| 10 to 14 Minutes | 94 (25.6%) | 70 (21.2%) |
| 15 to 19 Minutes | 92 (25.1%) | 50 (15.1%) |
| 20 to 24 Minutes | 24 (6.5%) | 18 (5.4%) |
| 25 to 29 Minutes | 0 (0.0%) | 0 (0.0%) |
| 30 to 34 Minutes | 29 (7.9%) | 44 (13.3%) |
| 35 to 39 Minutes | 6 (1.6%) | 7 (2.1%) |
| 40 to 44 Minutes | 13 (3.5%) | 0 (0.0%) |
| 45 to 59 Minutes | 30 (8.2%) | 65 (19.7%) |
| 60 to 89 Minutes | 10 (2.7%) | 0 (0.0%) |
| 90 or more Minutes | 0 (0.0%) | 0 (0.0%) |
Time of Departure to Work by Sex in Jonesboro
The most frequent times of departure to work in Jonesboro are 7:30 AM to 7:59 AM (84, 22.9%) for males and 7:30 AM to 7:59 AM (76, 23.0%) for females.
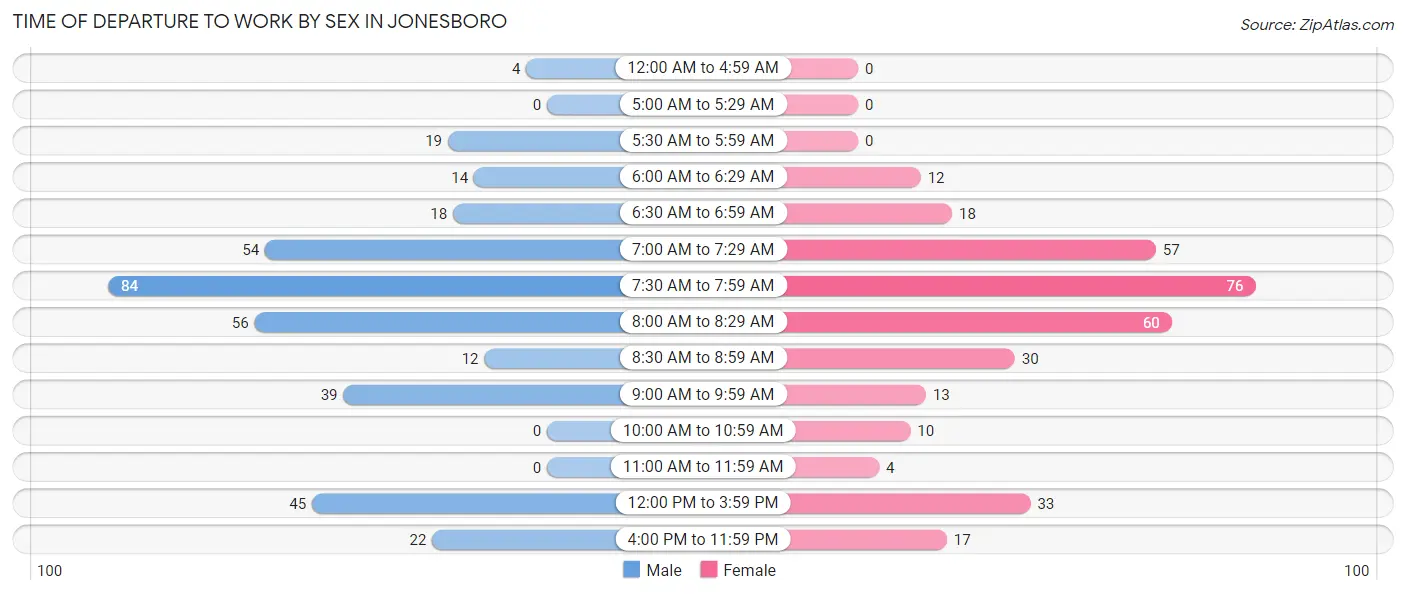
| Time of Departure | Male | Female |
| 12:00 AM to 4:59 AM | 4 (1.1%) | 0 (0.0%) |
| 5:00 AM to 5:29 AM | 0 (0.0%) | 0 (0.0%) |
| 5:30 AM to 5:59 AM | 19 (5.2%) | 0 (0.0%) |
| 6:00 AM to 6:29 AM | 14 (3.8%) | 12 (3.6%) |
| 6:30 AM to 6:59 AM | 18 (4.9%) | 18 (5.4%) |
| 7:00 AM to 7:29 AM | 54 (14.7%) | 57 (17.3%) |
| 7:30 AM to 7:59 AM | 84 (22.9%) | 76 (23.0%) |
| 8:00 AM to 8:29 AM | 56 (15.3%) | 60 (18.2%) |
| 8:30 AM to 8:59 AM | 12 (3.3%) | 30 (9.1%) |
| 9:00 AM to 9:59 AM | 39 (10.6%) | 13 (3.9%) |
| 10:00 AM to 10:59 AM | 0 (0.0%) | 10 (3.0%) |
| 11:00 AM to 11:59 AM | 0 (0.0%) | 4 (1.2%) |
| 12:00 PM to 3:59 PM | 45 (12.3%) | 33 (10.0%) |
| 4:00 PM to 11:59 PM | 22 (6.0%) | 17 (5.1%) |
| Total | 367 (100.0%) | 330 (100.0%) |
Housing Occupancy in Jonesboro
Occupancy by Ownership in Jonesboro
Of the total 733 dwellings in Jonesboro, owner-occupied units account for 551 (75.2%), while renter-occupied units make up 182 (24.8%).
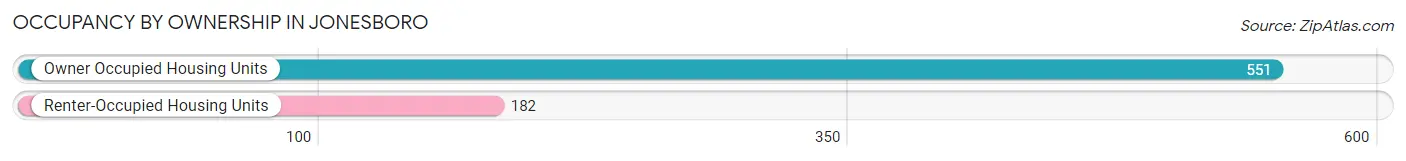
| Occupancy | # Housing Units | % Housing Units |
| Owner Occupied Housing Units | 551 | 75.2% |
| Renter-Occupied Housing Units | 182 | 24.8% |
| Total Occupied Housing Units | 733 | 100.0% |
Occupancy by Household Size in Jonesboro
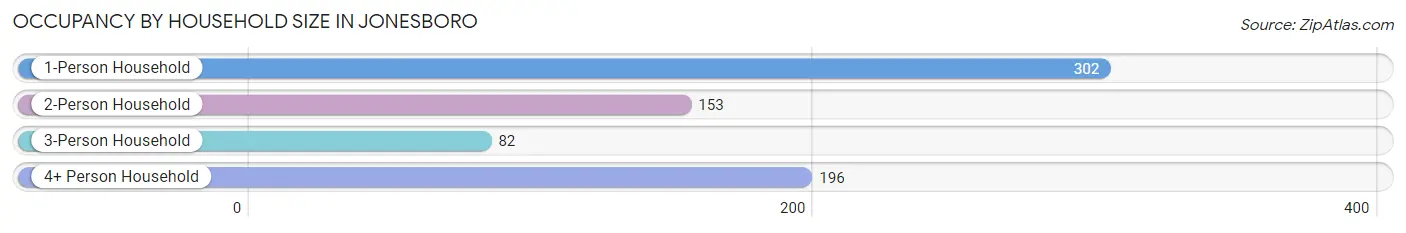
| Household Size | # Housing Units | % Housing Units |
| 1-Person Household | 302 | 41.2% |
| 2-Person Household | 153 | 20.9% |
| 3-Person Household | 82 | 11.2% |
| 4+ Person Household | 196 | 26.7% |
| Total Housing Units | 733 | 100.0% |
Occupancy by Ownership by Household Size in Jonesboro
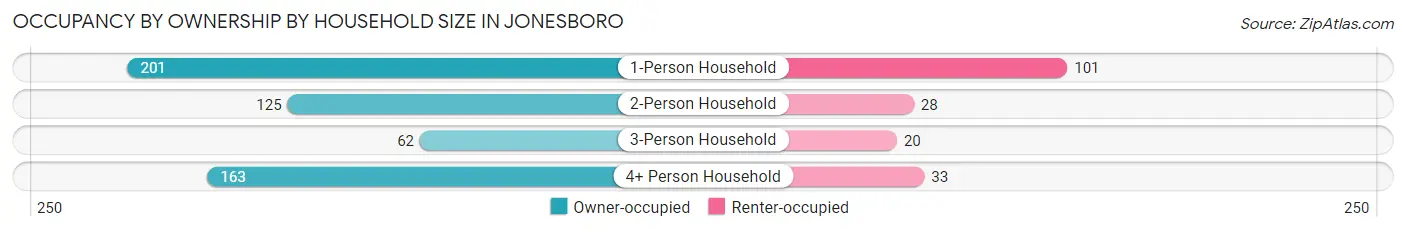
| Household Size | Owner-occupied | Renter-occupied |
| 1-Person Household | 201 (66.6%) | 101 (33.4%) |
| 2-Person Household | 125 (81.7%) | 28 (18.3%) |
| 3-Person Household | 62 (75.6%) | 20 (24.4%) |
| 4+ Person Household | 163 (83.2%) | 33 (16.8%) |
| Total Housing Units | 551 (75.2%) | 182 (24.8%) |
Occupancy by Educational Attainment in Jonesboro
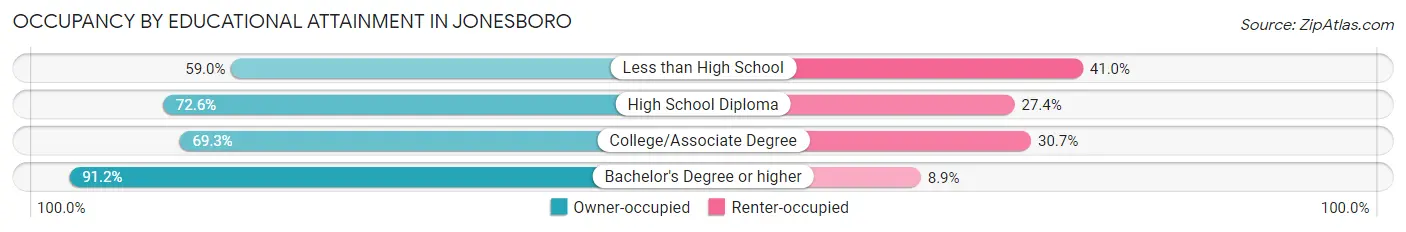
| Household Size | Owner-occupied | Renter-occupied |
| Less than High School | 36 (59.0%) | 25 (41.0%) |
| High School Diploma | 164 (72.6%) | 62 (27.4%) |
| College/Associate Degree | 176 (69.3%) | 78 (30.7%) |
| Bachelor's Degree or higher | 175 (91.1%) | 17 (8.8%) |
Occupancy by Age of Householder in Jonesboro
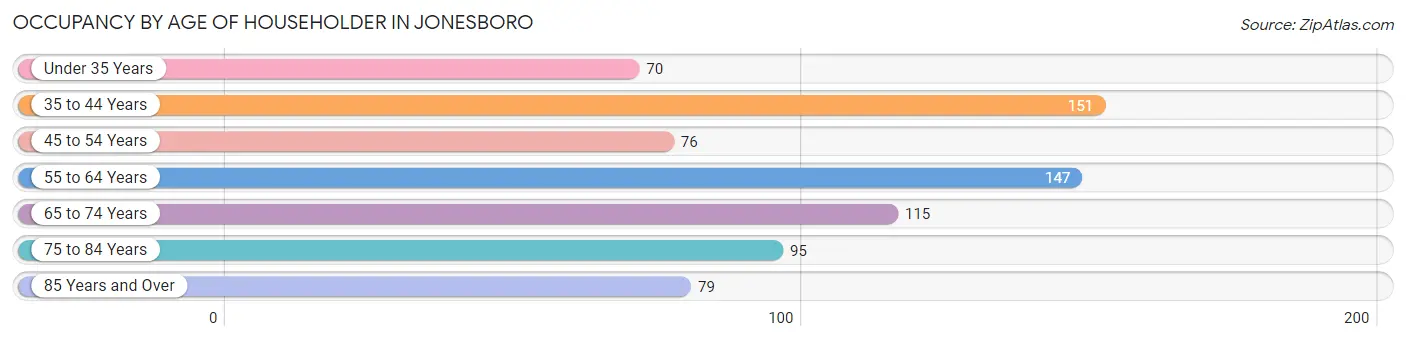
| Age Bracket | # Households | % Households |
| Under 35 Years | 70 | 9.6% |
| 35 to 44 Years | 151 | 20.6% |
| 45 to 54 Years | 76 | 10.4% |
| 55 to 64 Years | 147 | 20.1% |
| 65 to 74 Years | 115 | 15.7% |
| 75 to 84 Years | 95 | 13.0% |
| 85 Years and Over | 79 | 10.8% |
| Total | 733 | 100.0% |
Housing Finances in Jonesboro
Median Income by Occupancy in Jonesboro
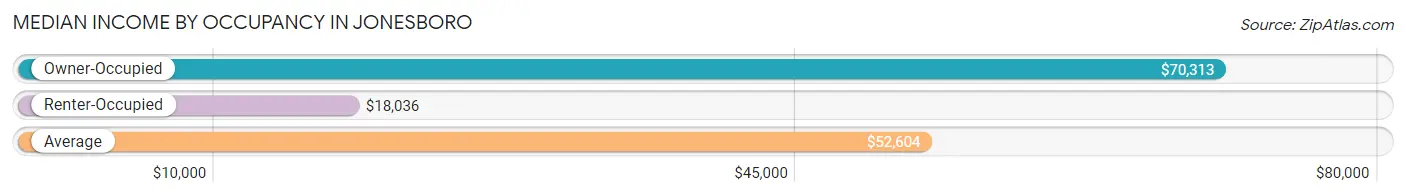
| Occupancy Type | # Households | Median Income |
| Owner-Occupied | 551 (75.2%) | $70,313 |
| Renter-Occupied | 182 (24.8%) | $18,036 |
| Average | 733 (100.0%) | $52,604 |
Occupancy by Householder Income Bracket in Jonesboro
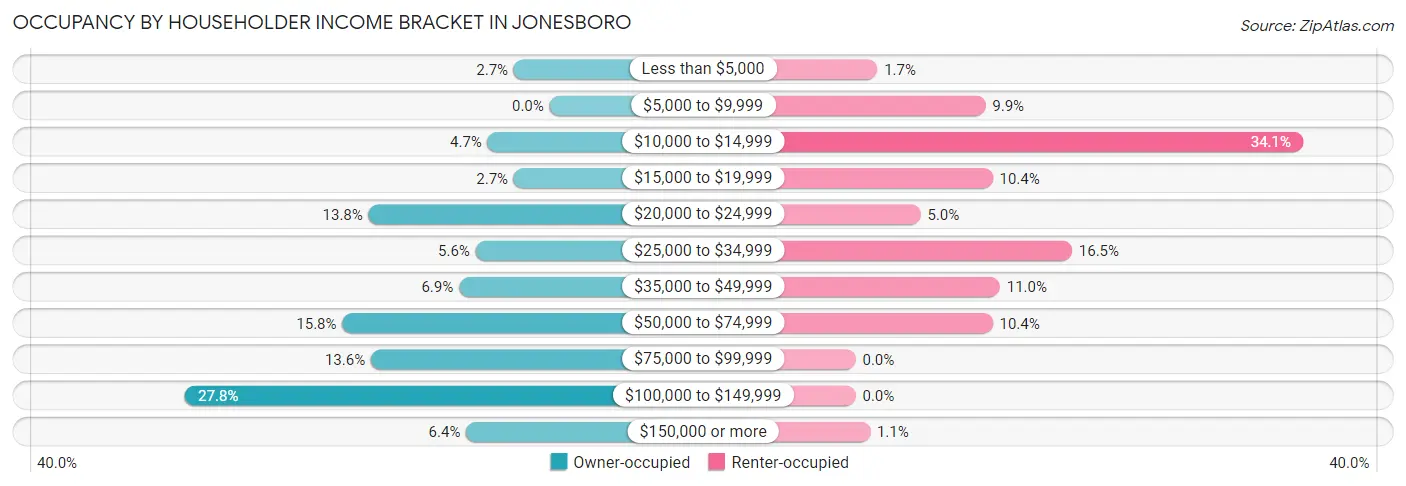
| Income Bracket | Owner-occupied | Renter-occupied |
| Less than $5,000 | 15 (2.7%) | 3 (1.7%) |
| $5,000 to $9,999 | 0 (0.0%) | 18 (9.9%) |
| $10,000 to $14,999 | 26 (4.7%) | 62 (34.1%) |
| $15,000 to $19,999 | 15 (2.7%) | 19 (10.4%) |
| $20,000 to $24,999 | 76 (13.8%) | 9 (5.0%) |
| $25,000 to $34,999 | 31 (5.6%) | 30 (16.5%) |
| $35,000 to $49,999 | 38 (6.9%) | 20 (11.0%) |
| $50,000 to $74,999 | 87 (15.8%) | 19 (10.4%) |
| $75,000 to $99,999 | 75 (13.6%) | 0 (0.0%) |
| $100,000 to $149,999 | 153 (27.8%) | 0 (0.0%) |
| $150,000 or more | 35 (6.4%) | 2 (1.1%) |
| Total | 551 (100.0%) | 182 (100.0%) |
Monthly Housing Cost Tiers in Jonesboro
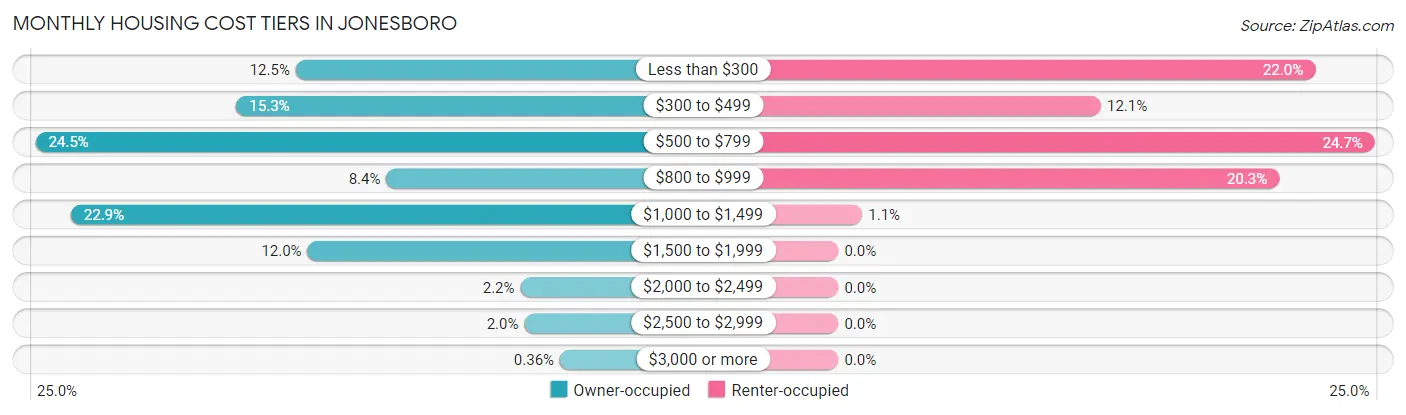
| Monthly Cost | Owner-occupied | Renter-occupied |
| Less than $300 | 69 (12.5%) | 40 (22.0%) |
| $300 to $499 | 84 (15.2%) | 22 (12.1%) |
| $500 to $799 | 135 (24.5%) | 45 (24.7%) |
| $800 to $999 | 46 (8.4%) | 37 (20.3%) |
| $1,000 to $1,499 | 126 (22.9%) | 2 (1.1%) |
| $1,500 to $1,999 | 66 (12.0%) | 0 (0.0%) |
| $2,000 to $2,499 | 12 (2.2%) | 0 (0.0%) |
| $2,500 to $2,999 | 11 (2.0%) | 0 (0.0%) |
| $3,000 or more | 2 (0.4%) | 0 (0.0%) |
| Total | 551 (100.0%) | 182 (100.0%) |
Physical Housing Characteristics in Jonesboro
Housing Structures in Jonesboro
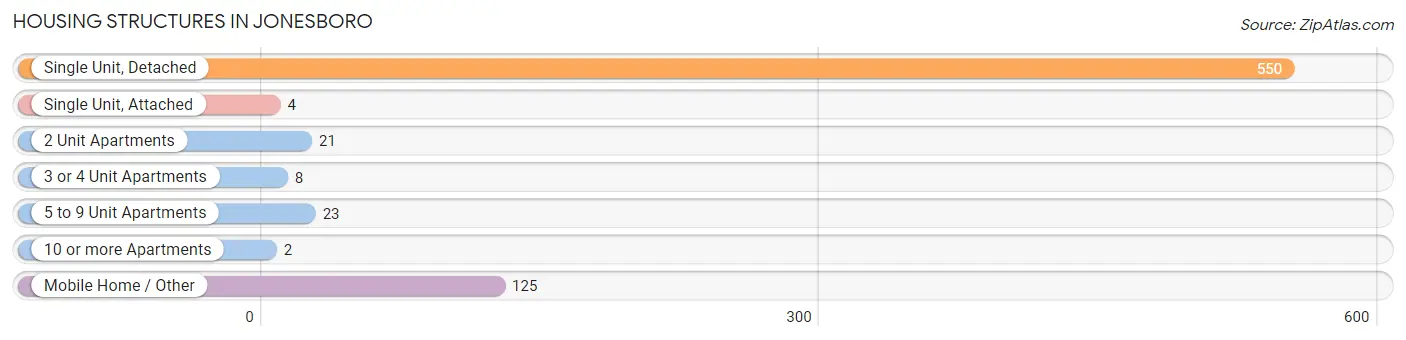
| Structure Type | # Housing Units | % Housing Units |
| Single Unit, Detached | 550 | 75.0% |
| Single Unit, Attached | 4 | 0.5% |
| 2 Unit Apartments | 21 | 2.9% |
| 3 or 4 Unit Apartments | 8 | 1.1% |
| 5 to 9 Unit Apartments | 23 | 3.1% |
| 10 or more Apartments | 2 | 0.3% |
| Mobile Home / Other | 125 | 17.1% |
| Total | 733 | 100.0% |
Housing Structures by Occupancy in Jonesboro
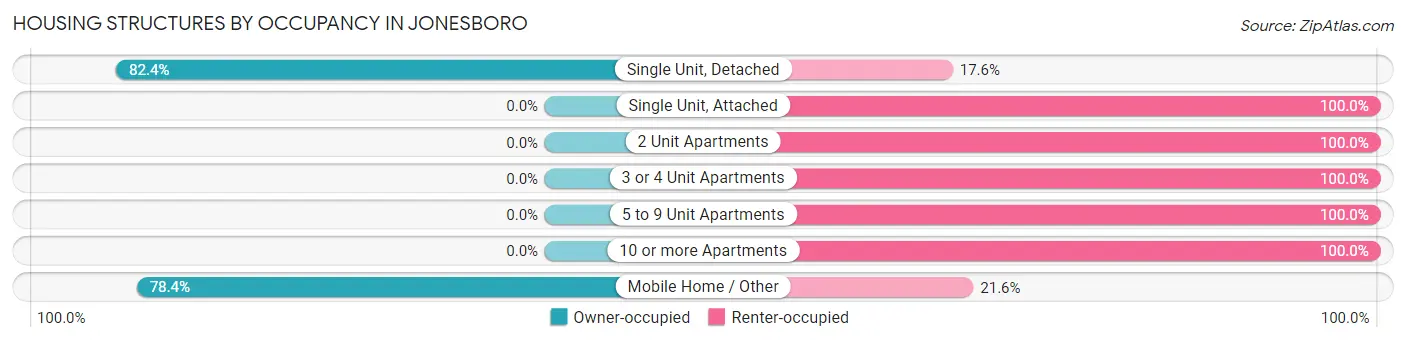
| Structure Type | Owner-occupied | Renter-occupied |
| Single Unit, Detached | 453 (82.4%) | 97 (17.6%) |
| Single Unit, Attached | 0 (0.0%) | 4 (100.0%) |
| 2 Unit Apartments | 0 (0.0%) | 21 (100.0%) |
| 3 or 4 Unit Apartments | 0 (0.0%) | 8 (100.0%) |
| 5 to 9 Unit Apartments | 0 (0.0%) | 23 (100.0%) |
| 10 or more Apartments | 0 (0.0%) | 2 (100.0%) |
| Mobile Home / Other | 98 (78.4%) | 27 (21.6%) |
| Total | 551 (75.2%) | 182 (24.8%) |
Housing Structures by Number of Rooms in Jonesboro
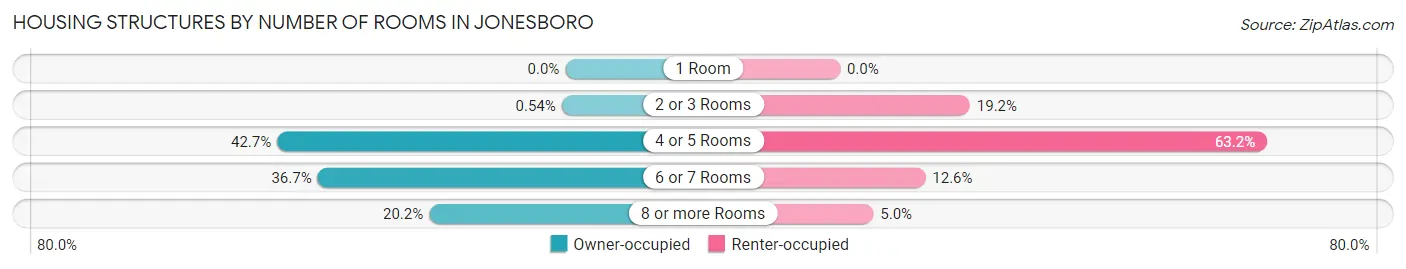
| Number of Rooms | Owner-occupied | Renter-occupied |
| 1 Room | 0 (0.0%) | 0 (0.0%) |
| 2 or 3 Rooms | 3 (0.5%) | 35 (19.2%) |
| 4 or 5 Rooms | 235 (42.6%) | 115 (63.2%) |
| 6 or 7 Rooms | 202 (36.7%) | 23 (12.6%) |
| 8 or more Rooms | 111 (20.2%) | 9 (5.0%) |
| Total | 551 (100.0%) | 182 (100.0%) |
Housing Structure by Heating Type in Jonesboro
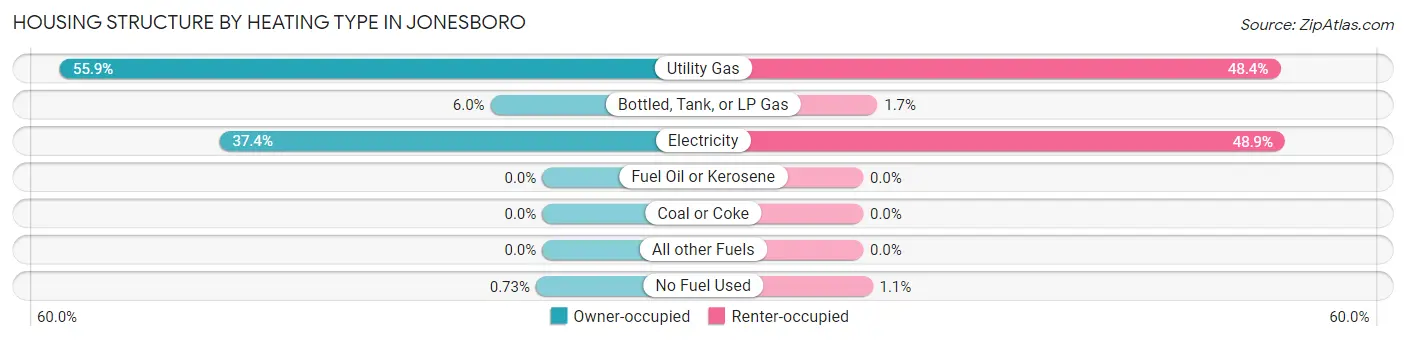
| Heating Type | Owner-occupied | Renter-occupied |
| Utility Gas | 308 (55.9%) | 88 (48.3%) |
| Bottled, Tank, or LP Gas | 33 (6.0%) | 3 (1.7%) |
| Electricity | 206 (37.4%) | 89 (48.9%) |
| Fuel Oil or Kerosene | 0 (0.0%) | 0 (0.0%) |
| Coal or Coke | 0 (0.0%) | 0 (0.0%) |
| All other Fuels | 0 (0.0%) | 0 (0.0%) |
| No Fuel Used | 4 (0.7%) | 2 (1.1%) |
| Total | 551 (100.0%) | 182 (100.0%) |
Household Vehicle Usage in Jonesboro
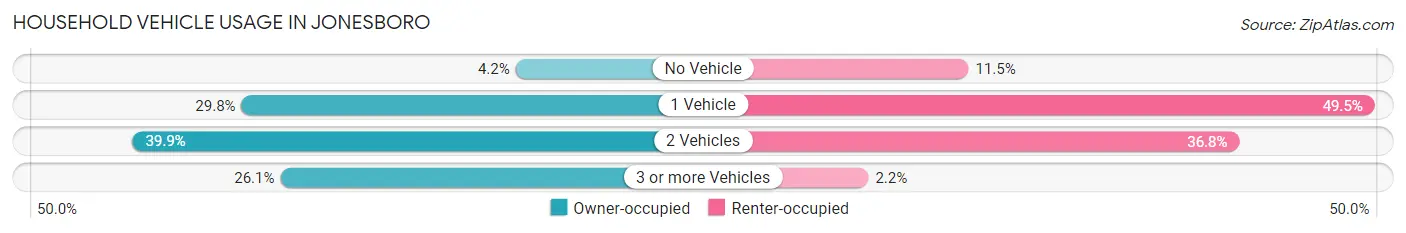
| Vehicles per Household | Owner-occupied | Renter-occupied |
| No Vehicle | 23 (4.2%) | 21 (11.5%) |
| 1 Vehicle | 164 (29.8%) | 90 (49.4%) |
| 2 Vehicles | 220 (39.9%) | 67 (36.8%) |
| 3 or more Vehicles | 144 (26.1%) | 4 (2.2%) |
| Total | 551 (100.0%) | 182 (100.0%) |
Real Estate & Mortgages in Jonesboro
Real Estate and Mortgage Overview in Jonesboro
| Characteristic | Without Mortgage | With Mortgage |
| Housing Units | 266 | 285 |
| Median Property Value | $73,800 | $113,500 |
| Median Household Income | $34,688 | $29 |
| Monthly Housing Costs | $468 | $2 |
| Real Estate Taxes | $1,278 | $5 |
Property Value by Mortgage Status in Jonesboro
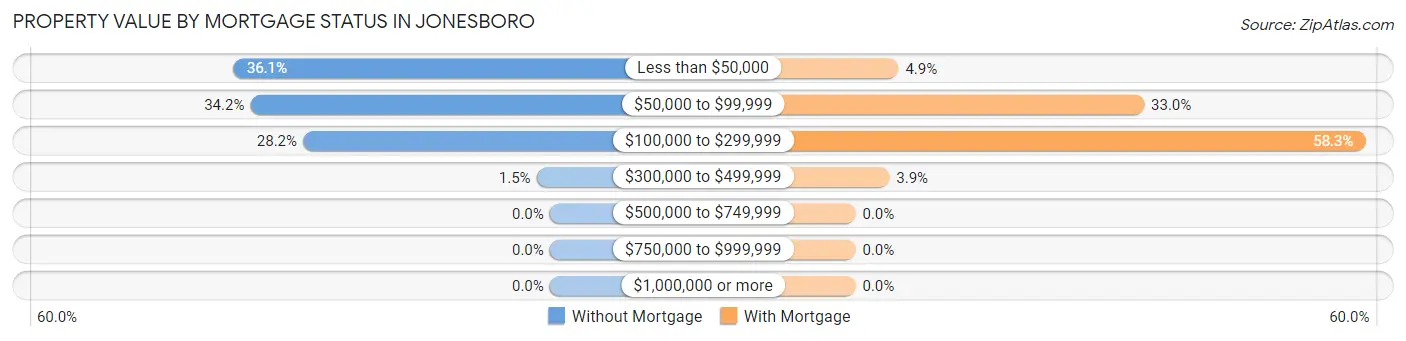
| Property Value | Without Mortgage | With Mortgage |
| Less than $50,000 | 96 (36.1%) | 14 (4.9%) |
| $50,000 to $99,999 | 91 (34.2%) | 94 (33.0%) |
| $100,000 to $299,999 | 75 (28.2%) | 166 (58.3%) |
| $300,000 to $499,999 | 4 (1.5%) | 11 (3.9%) |
| $500,000 to $749,999 | 0 (0.0%) | 0 (0.0%) |
| $750,000 to $999,999 | 0 (0.0%) | 0 (0.0%) |
| $1,000,000 or more | 0 (0.0%) | 0 (0.0%) |
| Total | 266 (100.0%) | 285 (100.0%) |
Household Income by Mortgage Status in Jonesboro
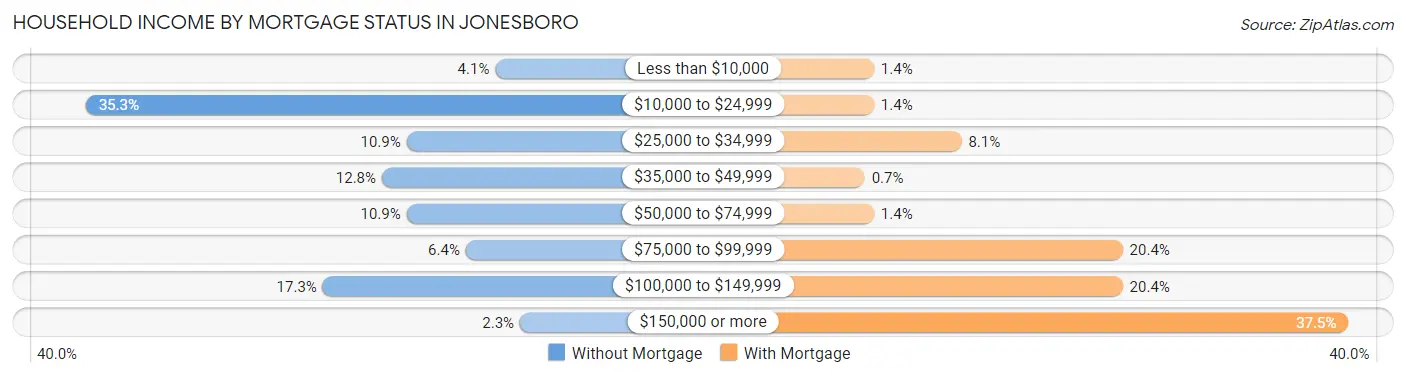
| Household Income | Without Mortgage | With Mortgage |
| Less than $10,000 | 11 (4.1%) | 4 (1.4%) |
| $10,000 to $24,999 | 94 (35.3%) | 4 (1.4%) |
| $25,000 to $34,999 | 29 (10.9%) | 23 (8.1%) |
| $35,000 to $49,999 | 34 (12.8%) | 2 (0.7%) |
| $50,000 to $74,999 | 29 (10.9%) | 4 (1.4%) |
| $75,000 to $99,999 | 17 (6.4%) | 58 (20.3%) |
| $100,000 to $149,999 | 46 (17.3%) | 58 (20.3%) |
| $150,000 or more | 6 (2.3%) | 107 (37.5%) |
| Total | 266 (100.0%) | 285 (100.0%) |
Property Value to Household Income Ratio in Jonesboro
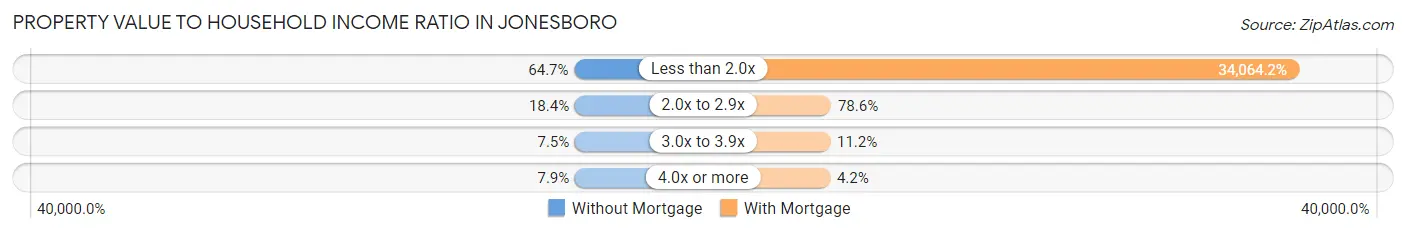
| Value-to-Income Ratio | Without Mortgage | With Mortgage |
| Less than 2.0x | 172 (64.7%) | 97,083 (34,064.2%) |
| 2.0x to 2.9x | 49 (18.4%) | 224 (78.6%) |
| 3.0x to 3.9x | 20 (7.5%) | 32 (11.2%) |
| 4.0x or more | 21 (7.9%) | 12 (4.2%) |
| Total | 266 (100.0%) | 285 (100.0%) |
Real Estate Taxes by Mortgage Status in Jonesboro
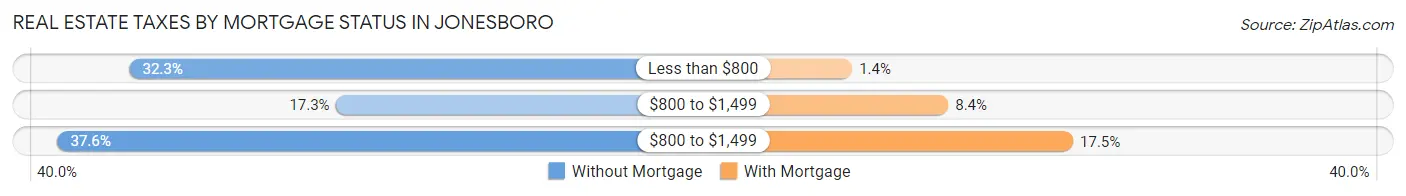
| Property Taxes | Without Mortgage | With Mortgage |
| Less than $800 | 86 (32.3%) | 4 (1.4%) |
| $800 to $1,499 | 46 (17.3%) | 24 (8.4%) |
| $800 to $1,499 | 100 (37.6%) | 50 (17.5%) |
| Total | 266 (100.0%) | 285 (100.0%) |
Health & Disability in Jonesboro
Health Insurance Coverage by Age in Jonesboro
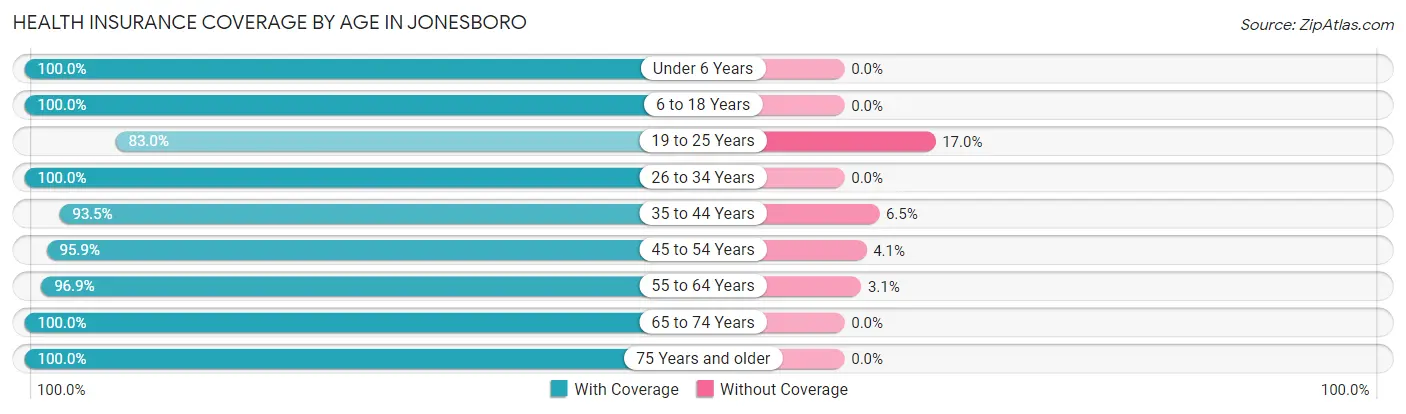
| Age Bracket | With Coverage | Without Coverage |
| Under 6 Years | 159 (100.0%) | 0 (0.0%) |
| 6 to 18 Years | 310 (100.0%) | 0 (0.0%) |
| 19 to 25 Years | 93 (83.0%) | 19 (17.0%) |
| 26 to 34 Years | 146 (100.0%) | 0 (0.0%) |
| 35 to 44 Years | 260 (93.5%) | 18 (6.5%) |
| 45 to 54 Years | 164 (95.9%) | 7 (4.1%) |
| 55 to 64 Years | 249 (96.9%) | 8 (3.1%) |
| 65 to 74 Years | 152 (100.0%) | 0 (0.0%) |
| 75 Years and older | 232 (100.0%) | 0 (0.0%) |
| Total | 1,765 (97.1%) | 52 (2.9%) |
Health Insurance Coverage by Citizenship Status in Jonesboro
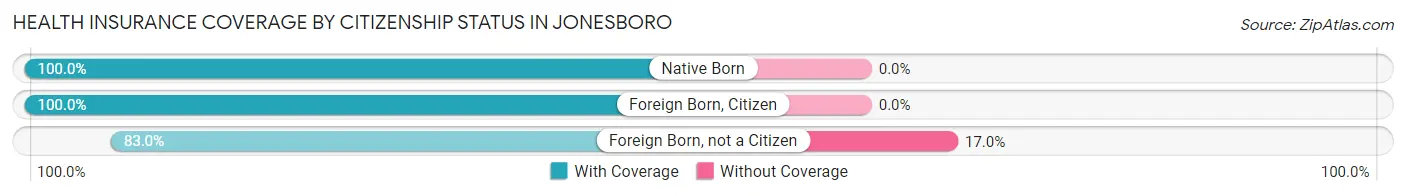
| Citizenship Status | With Coverage | Without Coverage |
| Native Born | 159 (100.0%) | 0 (0.0%) |
| Foreign Born, Citizen | 310 (100.0%) | 0 (0.0%) |
| Foreign Born, not a Citizen | 93 (83.0%) | 19 (17.0%) |
Health Insurance Coverage by Household Income in Jonesboro
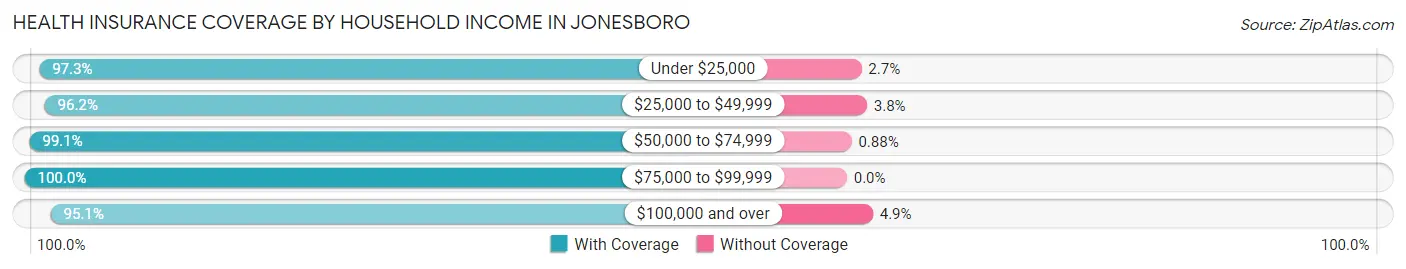
| Household Income | With Coverage | Without Coverage |
| Under $25,000 | 390 (97.3%) | 11 (2.7%) |
| $25,000 to $49,999 | 256 (96.2%) | 10 (3.8%) |
| $50,000 to $74,999 | 225 (99.1%) | 2 (0.9%) |
| $75,000 to $99,999 | 269 (100.0%) | 0 (0.0%) |
| $100,000 and over | 566 (95.1%) | 29 (4.9%) |
Public vs Private Health Insurance Coverage by Age in Jonesboro
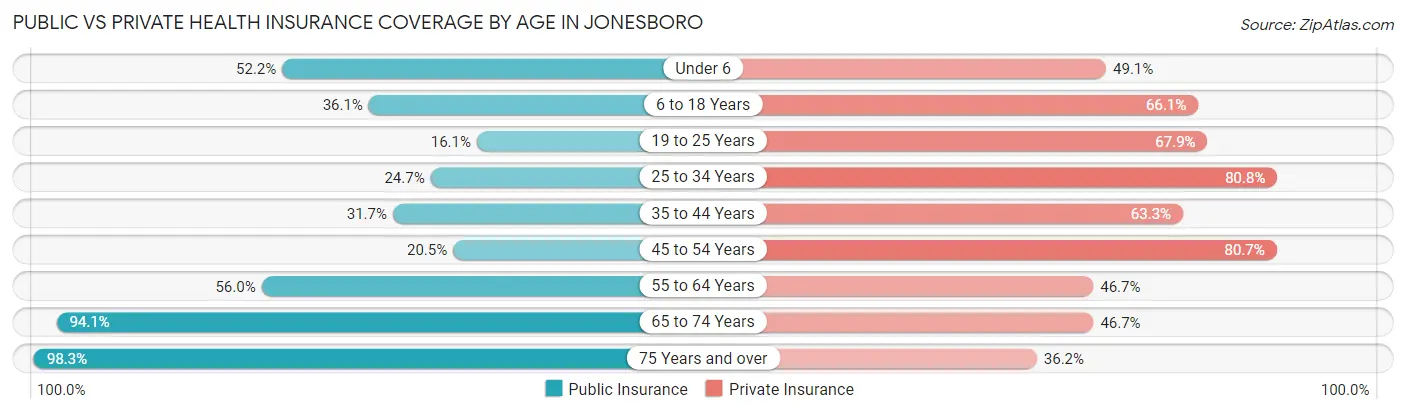
| Age Bracket | Public Insurance | Private Insurance |
| Under 6 | 83 (52.2%) | 78 (49.1%) |
| 6 to 18 Years | 112 (36.1%) | 205 (66.1%) |
| 19 to 25 Years | 18 (16.1%) | 76 (67.9%) |
| 25 to 34 Years | 36 (24.7%) | 118 (80.8%) |
| 35 to 44 Years | 88 (31.7%) | 176 (63.3%) |
| 45 to 54 Years | 35 (20.5%) | 138 (80.7%) |
| 55 to 64 Years | 144 (56.0%) | 120 (46.7%) |
| 65 to 74 Years | 143 (94.1%) | 71 (46.7%) |
| 75 Years and over | 228 (98.3%) | 84 (36.2%) |
| Total | 887 (48.8%) | 1,066 (58.7%) |
Disability Status by Sex by Age in Jonesboro
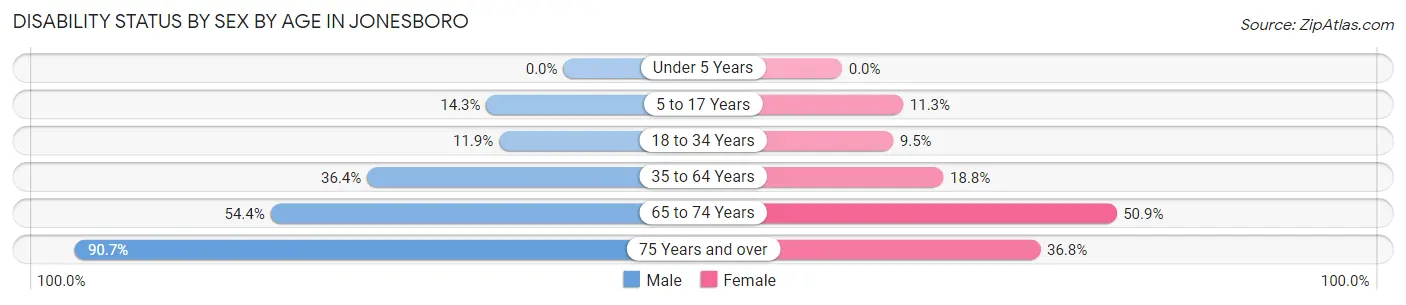
| Age Bracket | Male | Female |
| Under 5 Years | 0 (0.0%) | 0 (0.0%) |
| 5 to 17 Years | 20 (14.3%) | 17 (11.3%) |
| 18 to 34 Years | 16 (11.9%) | 16 (9.5%) |
| 35 to 64 Years | 141 (36.4%) | 60 (18.8%) |
| 65 to 74 Years | 25 (54.3%) | 54 (50.9%) |
| 75 Years and over | 97 (90.6%) | 46 (36.8%) |
Disability Class by Sex by Age in Jonesboro
Disability Class: Hearing Difficulty
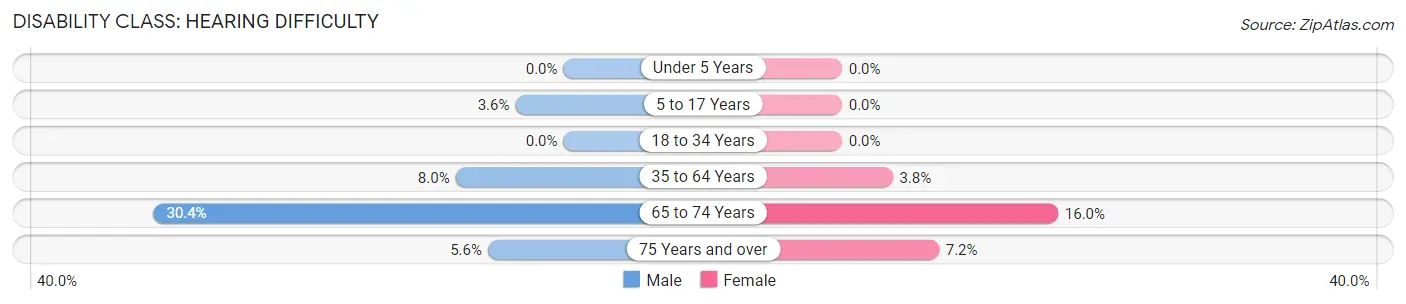
| Age Bracket | Male | Female |
| Under 5 Years | 0 (0.0%) | 0 (0.0%) |
| 5 to 17 Years | 5 (3.6%) | 0 (0.0%) |
| 18 to 34 Years | 0 (0.0%) | 0 (0.0%) |
| 35 to 64 Years | 31 (8.0%) | 12 (3.8%) |
| 65 to 74 Years | 14 (30.4%) | 17 (16.0%) |
| 75 Years and over | 6 (5.6%) | 9 (7.2%) |
Disability Class: Vision Difficulty
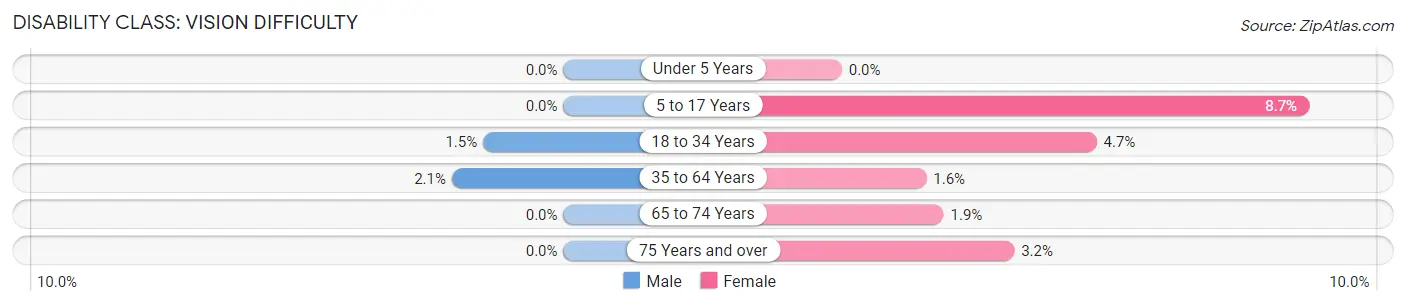
| Age Bracket | Male | Female |
| Under 5 Years | 0 (0.0%) | 0 (0.0%) |
| 5 to 17 Years | 0 (0.0%) | 13 (8.7%) |
| 18 to 34 Years | 2 (1.5%) | 8 (4.7%) |
| 35 to 64 Years | 8 (2.1%) | 5 (1.6%) |
| 65 to 74 Years | 0 (0.0%) | 2 (1.9%) |
| 75 Years and over | 0 (0.0%) | 4 (3.2%) |
Disability Class: Cognitive Difficulty
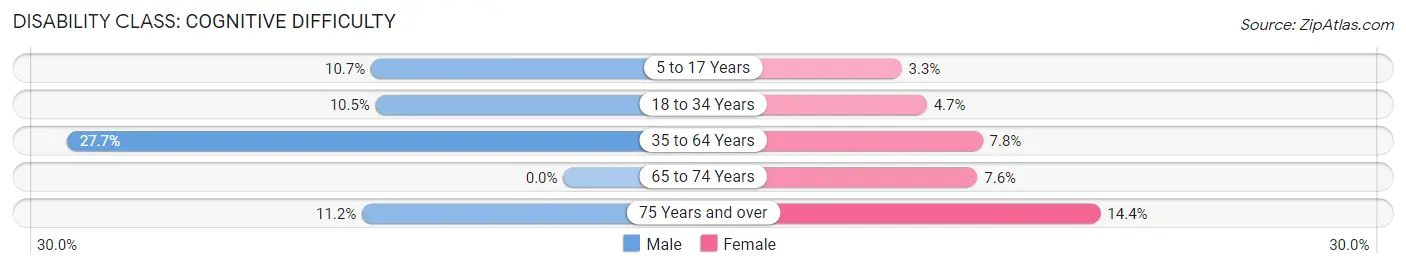
| Age Bracket | Male | Female |
| 5 to 17 Years | 15 (10.7%) | 5 (3.3%) |
| 18 to 34 Years | 14 (10.4%) | 8 (4.7%) |
| 35 to 64 Years | 107 (27.7%) | 25 (7.8%) |
| 65 to 74 Years | 0 (0.0%) | 8 (7.5%) |
| 75 Years and over | 12 (11.2%) | 18 (14.4%) |
Disability Class: Ambulatory Difficulty
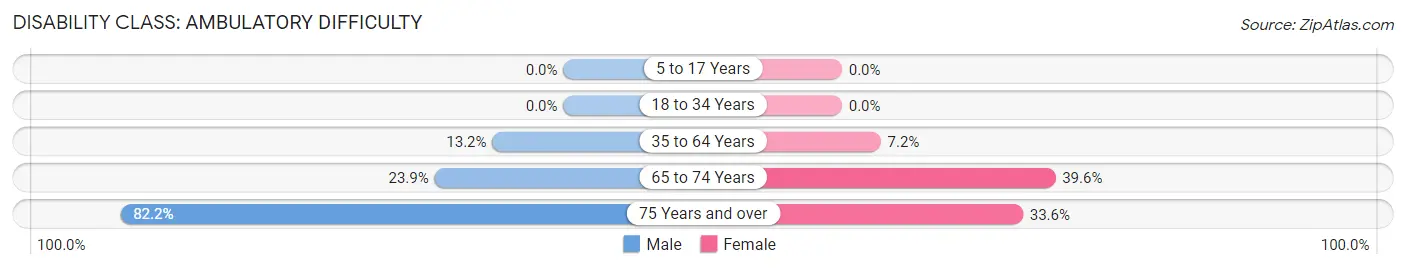
| Age Bracket | Male | Female |
| 5 to 17 Years | 0 (0.0%) | 0 (0.0%) |
| 18 to 34 Years | 0 (0.0%) | 0 (0.0%) |
| 35 to 64 Years | 51 (13.2%) | 23 (7.2%) |
| 65 to 74 Years | 11 (23.9%) | 42 (39.6%) |
| 75 Years and over | 88 (82.2%) | 42 (33.6%) |
Disability Class: Self-Care Difficulty
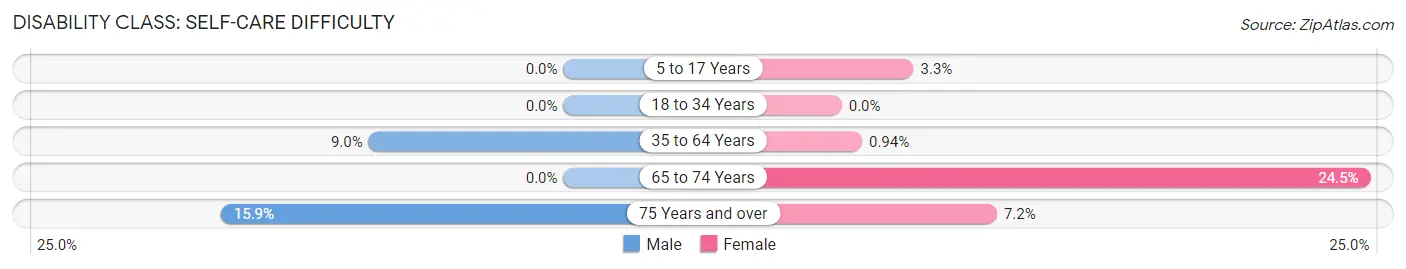
| Age Bracket | Male | Female |
| 5 to 17 Years | 0 (0.0%) | 5 (3.3%) |
| 18 to 34 Years | 0 (0.0%) | 0 (0.0%) |
| 35 to 64 Years | 35 (9.0%) | 3 (0.9%) |
| 65 to 74 Years | 0 (0.0%) | 26 (24.5%) |
| 75 Years and over | 17 (15.9%) | 9 (7.2%) |
Technology Access in Jonesboro
Computing Device Access in Jonesboro
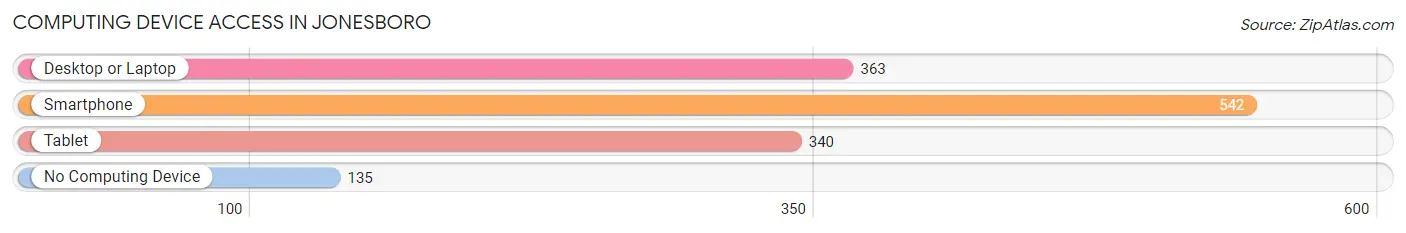
| Device Type | # Households | % Households |
| Desktop or Laptop | 363 | 49.5% |
| Smartphone | 542 | 73.9% |
| Tablet | 340 | 46.4% |
| No Computing Device | 135 | 18.4% |
| Total | 733 | 100.0% |
Internet Access in Jonesboro
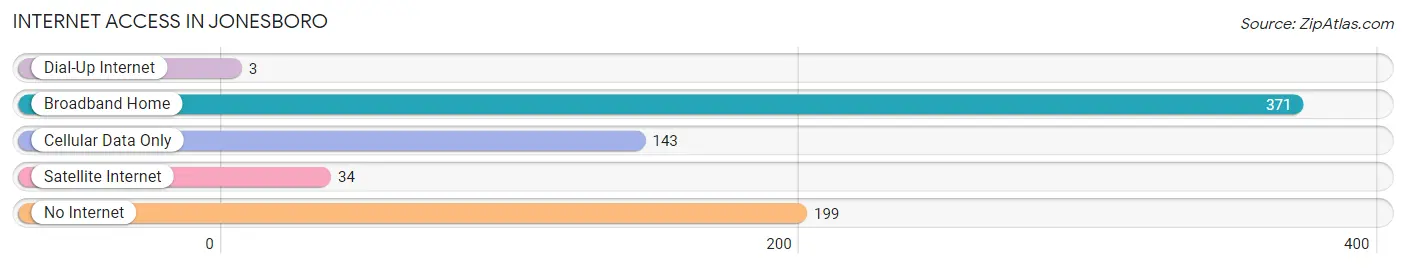
| Internet Type | # Households | % Households |
| Dial-Up Internet | 3 | 0.4% |
| Broadband Home | 371 | 50.6% |
| Cellular Data Only | 143 | 19.5% |
| Satellite Internet | 34 | 4.6% |
| No Internet | 199 | 27.2% |
| Total | 733 | 100.0% |
Jonesboro Summary
Jonesboro is a small town located in Union County, Illinois, United States. It is situated in the southern part of the state, about 25 miles east of Carbondale. The population of Jonesboro was 1,845 at the 2010 census.
History
Jonesboro was founded in 1818 by William Jones, a Revolutionary War veteran. He named the town after himself and it was incorporated in 1854. The town was originally a farming community, but it soon became a center for the timber industry. The town was also known for its coal mining operations.
In the late 19th century, Jonesboro was a major stop on the Cairo and Vincennes Railroad. The railroad brought many new people to the area, and the town grew rapidly. By the early 20th century, Jonesboro had become a bustling commercial center.
Geography
Jonesboro is located at 37°45'N 89°17'W (37.75, -89.28). It is situated in the southern part of the state, about 25 miles east of Carbondale. The town is located in the Shawnee National Forest, and is surrounded by rolling hills and wooded areas.
The climate in Jonesboro is humid subtropical, with hot, humid summers and mild winters. The average annual temperature is 57°F (14°C). The average annual precipitation is 44 inches (112 cm).
Economy
The economy of Jonesboro is largely based on agriculture and timber. The town is home to several farms, and the surrounding area is known for its timber production. The town is also home to several small businesses, including a grocery store, a hardware store, and a restaurant.
The town is also home to a number of manufacturing companies, including a furniture factory, a plastics factory, and a metal fabrication plant. The town is also home to a number of service-based businesses, including a bank, a post office, and a medical clinic.
Demographics
As of the 2010 census, the population of Jonesboro was 1,845. The racial makeup of the town was 97.3% White, 0.7% African American, 0.2% Native American, 0.2% Asian, 0.2% from other races, and 1.6% from two or more races. Hispanic or Latino of any race were 1.2% of the population.
The median income for a household in Jonesboro was $37,500, and the median income for a family was $45,000. The per capita income for the town was $18,000. About 11.2% of families and 14.2% of the population were below the poverty line, including 18.2% of those under age 18 and 8.3% of those age 65 or over.
Common Questions
What is Per Capita Income in Jonesboro?
Per Capita income in Jonesboro is $26,541.
What is the Median Family Income in Jonesboro?
Median Family Income in Jonesboro is $86,375.
What is the Median Household income in Jonesboro?
Median Household Income in Jonesboro is $52,604.
What is Income or Wage Gap in Jonesboro?
Income or Wage Gap in Jonesboro is 1.1%.
Women in Jonesboro earn 98.9 cents for every dollar earned by a man.
What is Inequality or Gini Index in Jonesboro?
Inequality or Gini Index in Jonesboro is 0.43.
What is the Total Population of Jonesboro?
Total Population of Jonesboro is 1,817.
What is the Total Male Population of Jonesboro?
Total Male Population of Jonesboro is 894.
What is the Total Female Population of Jonesboro?
Total Female Population of Jonesboro is 923.
What is the Ratio of Males per 100 Females in Jonesboro?
There are 96.86 Males per 100 Females in Jonesboro.
What is the Ratio of Females per 100 Males in Jonesboro?
There are 103.24 Females per 100 Males in Jonesboro.
What is the Median Population Age in Jonesboro?
Median Population Age in Jonesboro is 40.6 Years.
What is the Average Family Size in Jonesboro
Average Family Size in Jonesboro is 3.3 People.
What is the Average Household Size in Jonesboro
Average Household Size in Jonesboro is 2.4 People.
How Large is the Labor Force in Jonesboro?
There are 754 People in the Labor Forcein in Jonesboro.
What is the Percentage of People in the Labor Force in Jonesboro?
51.6% of People are in the Labor Force in Jonesboro.
What is the Unemployment Rate in Jonesboro?
Unemployment Rate in Jonesboro is 5.0%.