South Holland, IL Map & Demographics
South Holland Map
South Holland Overview
$32,999
PER CAPITA INCOME
$89,587
AVG FAMILY INCOME
$79,567
AVG HOUSEHOLD INCOME
31.2%
WAGE / INCOME GAP [ % ]
68.8¢/ $1
WAGE / INCOME GAP [ $ ]
$16,619
FAMILY INCOME DEFICIT
0.40
INEQUALITY / GINI INDEX
21,287
TOTAL POPULATION
9,766
MALE POPULATION
11,521
FEMALE POPULATION
84.77
MALES / 100 FEMALES
117.97
FEMALES / 100 MALES
42.6
MEDIAN AGE
3.3
AVG FAMILY SIZE
2.7
AVG HOUSEHOLD SIZE
10,332
LABOR FORCE [ PEOPLE ]
60.2%
PERCENT IN LABOR FORCE
14.1%
UNEMPLOYMENT RATE
South Holland Zip Codes
South Holland Area Codes
Income in South Holland
Income Overview in South Holland
Per Capita Income in South Holland is $32,999, while median incomes of families and households are $89,587 and $79,567 respectively.
| Characteristic | Number | Measure |
| Per Capita Income | 21,287 | $32,999 |
| Median Family Income | 5,487 | $89,587 |
| Mean Family Income | 5,487 | $99,592 |
| Median Household Income | 7,638 | $79,567 |
| Mean Household Income | 7,638 | $89,194 |
| Income Deficit | 5,487 | $16,619 |
| Wage / Income Gap (%) | 21,287 | 31.16% |
| Wage / Income Gap ($) | 21,287 | 68.84¢ per $1 |
| Gini / Inequality Index | 21,287 | 0.40 |
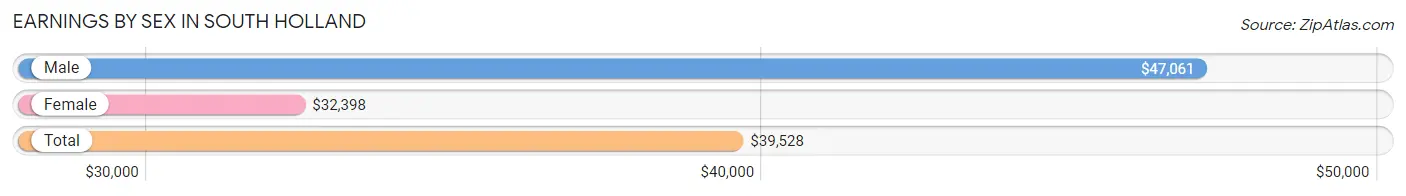
Earnings by Sex in South Holland
Average Earnings in South Holland are $39,528, $47,061 for men and $32,398 for women, a difference of 31.2%.
| Sex | Number | Average Earnings |
| Male | 4,640 (44.7%) | $47,061 |
| Female | 5,752 (55.3%) | $32,398 |
| Total | 10,392 (100.0%) | $39,528 |
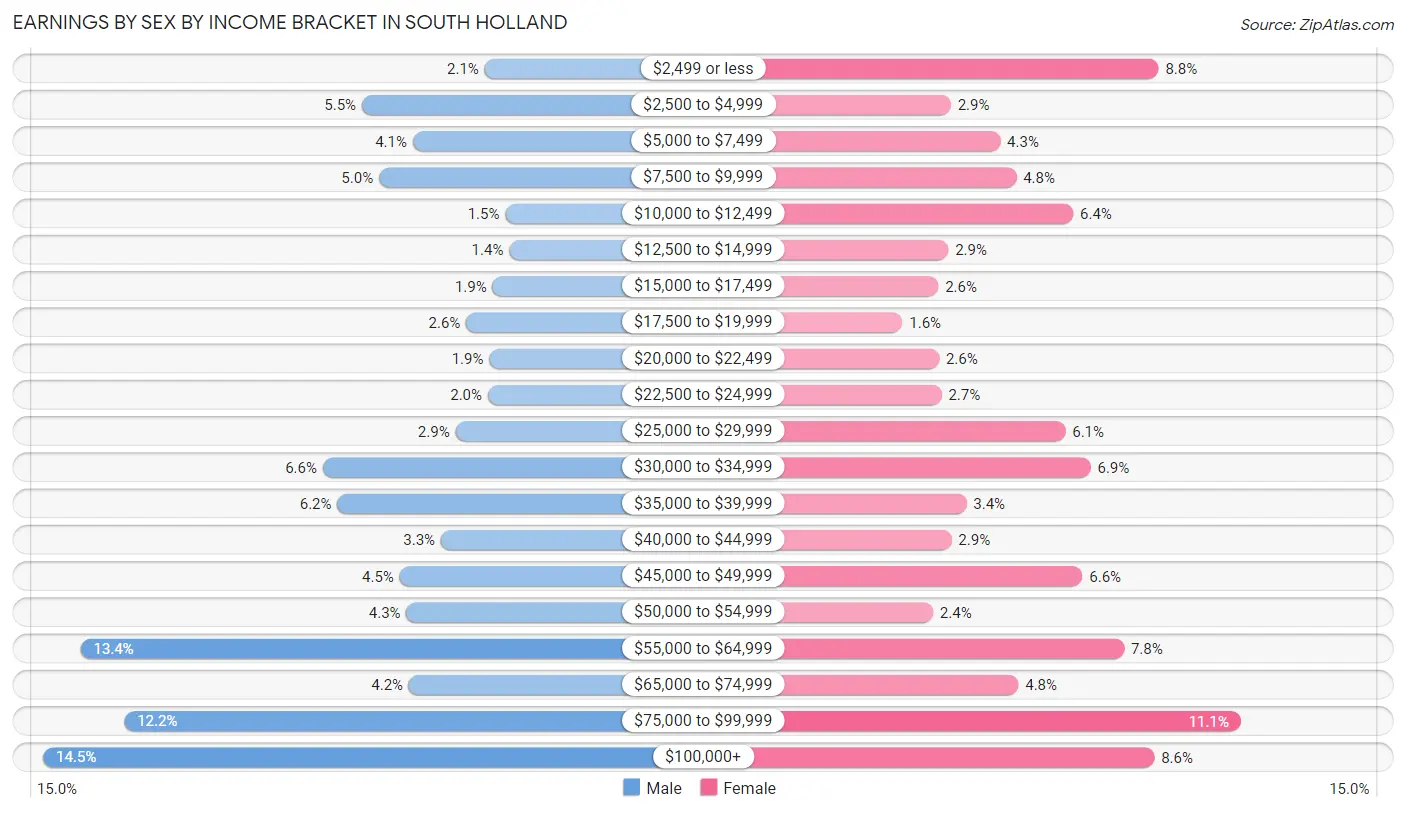
Earnings by Sex by Income Bracket in South Holland
The most common earnings brackets in South Holland are $100,000+ for men (672 | 14.5%) and $75,000 to $99,999 for women (637 | 11.1%).
| Income | Male | Female |
| $2,499 or less | 96 (2.1%) | 504 (8.8%) |
| $2,500 to $4,999 | 256 (5.5%) | 168 (2.9%) |
| $5,000 to $7,499 | 190 (4.1%) | 248 (4.3%) |
| $7,500 to $9,999 | 234 (5.0%) | 274 (4.8%) |
| $10,000 to $12,499 | 69 (1.5%) | 366 (6.4%) |
| $12,500 to $14,999 | 64 (1.4%) | 164 (2.9%) |
| $15,000 to $17,499 | 86 (1.8%) | 148 (2.6%) |
| $17,500 to $19,999 | 120 (2.6%) | 90 (1.6%) |
| $20,000 to $22,499 | 90 (1.9%) | 149 (2.6%) |
| $22,500 to $24,999 | 92 (2.0%) | 153 (2.7%) |
| $25,000 to $29,999 | 134 (2.9%) | 353 (6.1%) |
| $30,000 to $34,999 | 307 (6.6%) | 394 (6.9%) |
| $35,000 to $39,999 | 288 (6.2%) | 193 (3.4%) |
| $40,000 to $44,999 | 153 (3.3%) | 169 (2.9%) |
| $45,000 to $49,999 | 207 (4.5%) | 381 (6.6%) |
| $50,000 to $54,999 | 198 (4.3%) | 139 (2.4%) |
| $55,000 to $64,999 | 623 (13.4%) | 448 (7.8%) |
| $65,000 to $74,999 | 195 (4.2%) | 277 (4.8%) |
| $75,000 to $99,999 | 566 (12.2%) | 637 (11.1%) |
| $100,000+ | 672 (14.5%) | 497 (8.6%) |
| Total | 4,640 (100.0%) | 5,752 (100.0%) |
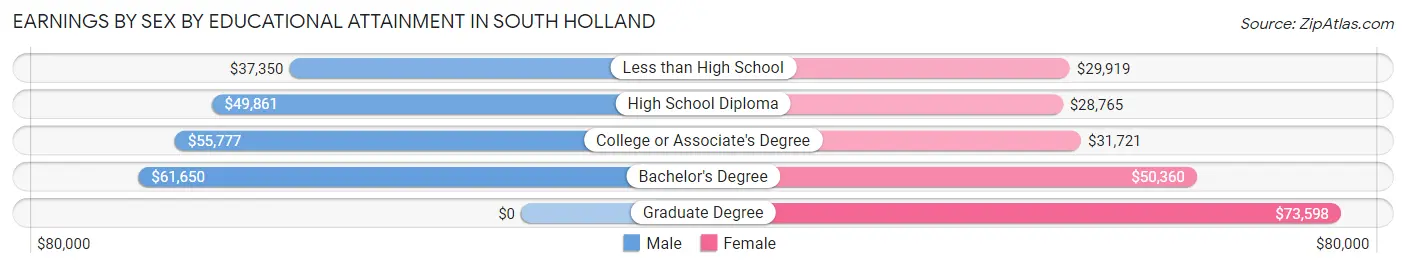
Earnings by Sex by Educational Attainment in South Holland
Average earnings in South Holland are $53,393 for men and $41,120 for women, a difference of 23.0%. Men with an educational attainment of bachelor's degree enjoy the highest average annual earnings of $61,650, while those with less than high school education earn the least with $37,350. Women with an educational attainment of graduate degree earn the most with the average annual earnings of $73,598, while those with high school diploma education have the smallest earnings of $28,765.
| Educational Attainment | Male Income | Female Income |
| Less than High School | $37,350 | $29,919 |
| High School Diploma | $49,861 | $28,765 |
| College or Associate's Degree | $55,777 | $31,721 |
| Bachelor's Degree | $61,650 | $50,360 |
| Graduate Degree | - | - |
| Total | $53,393 | $41,120 |
Family Income in South Holland
Family Income Brackets in South Holland
According to the South Holland family income data, there are 1,416 families falling into the $100,000 to $149,999 income range, which is the most common income bracket and makes up 25.8% of all families. Conversely, the $10,000 to $14,999 income bracket is the least frequent group with only 121 families (2.2%) belonging to this category.
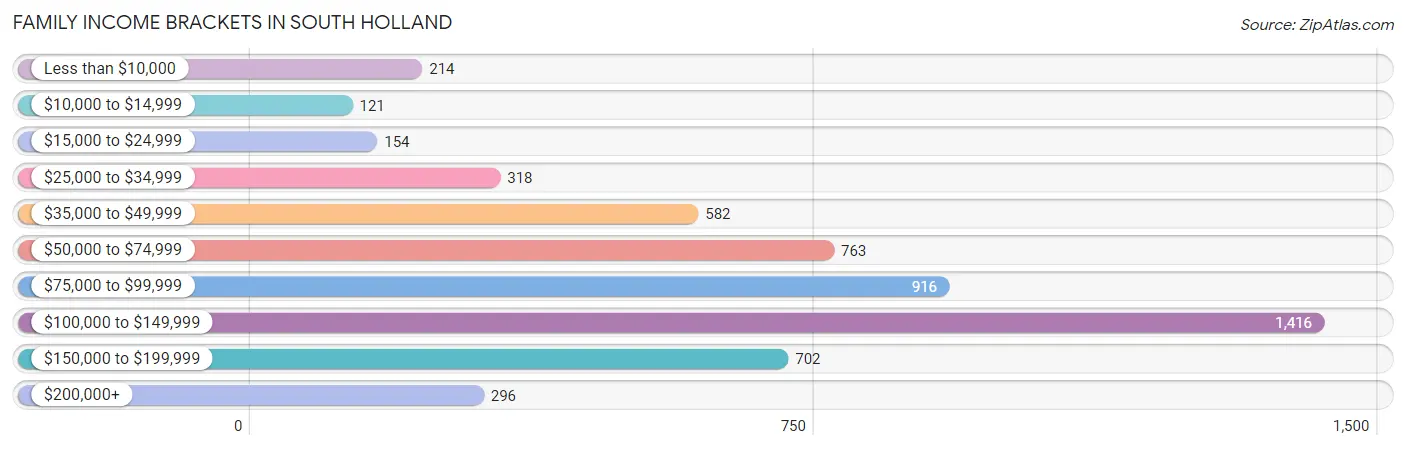
| Income Bracket | # Families | % Families |
| Less than $10,000 | 214 | 3.9% |
| $10,000 to $14,999 | 121 | 2.2% |
| $15,000 to $24,999 | 154 | 2.8% |
| $25,000 to $34,999 | 318 | 5.8% |
| $35,000 to $49,999 | 582 | 10.6% |
| $50,000 to $74,999 | 763 | 13.9% |
| $75,000 to $99,999 | 916 | 16.7% |
| $100,000 to $149,999 | 1,416 | 25.8% |
| $150,000 to $199,999 | 702 | 12.8% |
| $200,000+ | 296 | 5.4% |
Family Income by Famaliy Size in South Holland
5-person families (366 | 6.7%) account for the highest median family income in South Holland with $130,242 per family, while 2-person families (2,638 | 48.1%) have the highest median income of $42,981 per family member.
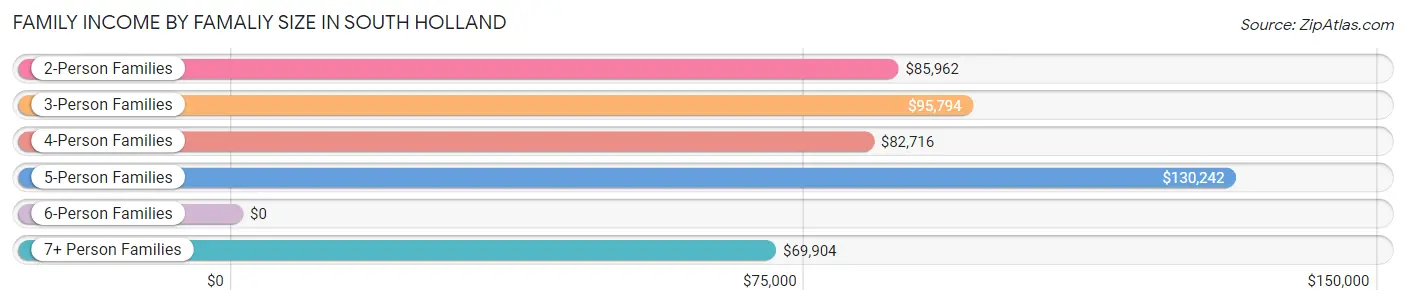
| Income Bracket | # Families | Median Income |
| 2-Person Families | 2,638 (48.1%) | $85,962 |
| 3-Person Families | 1,327 (24.2%) | $95,794 |
| 4-Person Families | 861 (15.7%) | $82,716 |
| 5-Person Families | 366 (6.7%) | $130,242 |
| 6-Person Families | 154 (2.8%) | $0 |
| 7+ Person Families | 141 (2.6%) | $69,904 |
| Total | 5,487 (100.0%) | $89,587 |
Family Income by Number of Earners in South Holland
The median family income in South Holland is $89,587, with families comprising 3+ earners (914) having the highest median family income of $130,273, while families with no earners (817) have the lowest median family income of $66,150, accounting for 16.7% and 14.9% of families, respectively.
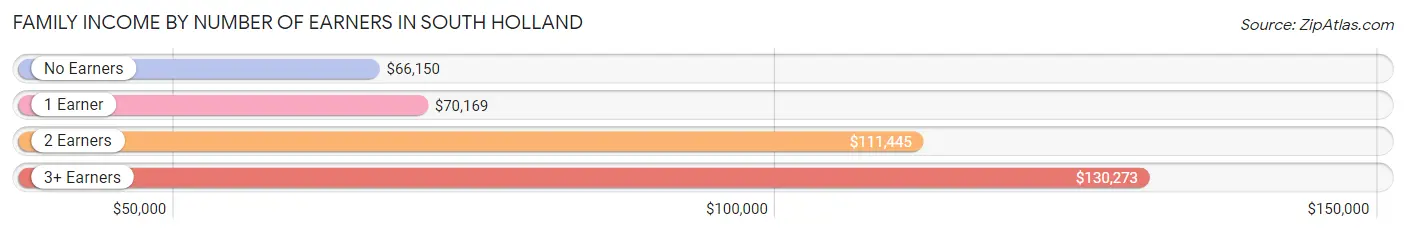
| Number of Earners | # Families | Median Income |
| No Earners | 817 (14.9%) | $66,150 |
| 1 Earner | 2,081 (37.9%) | $70,169 |
| 2 Earners | 1,675 (30.5%) | $111,445 |
| 3+ Earners | 914 (16.7%) | $130,273 |
| Total | 5,487 (100.0%) | $89,587 |
Household Income in South Holland
Household Income Brackets in South Holland
With 1,696 households falling in the category, the $100,000 to $149,999 income range is the most frequent in South Holland, accounting for 22.2% of all households. In contrast, only 267 households (3.5%) fall into the $10,000 to $14,999 income bracket, making it the least populous group.
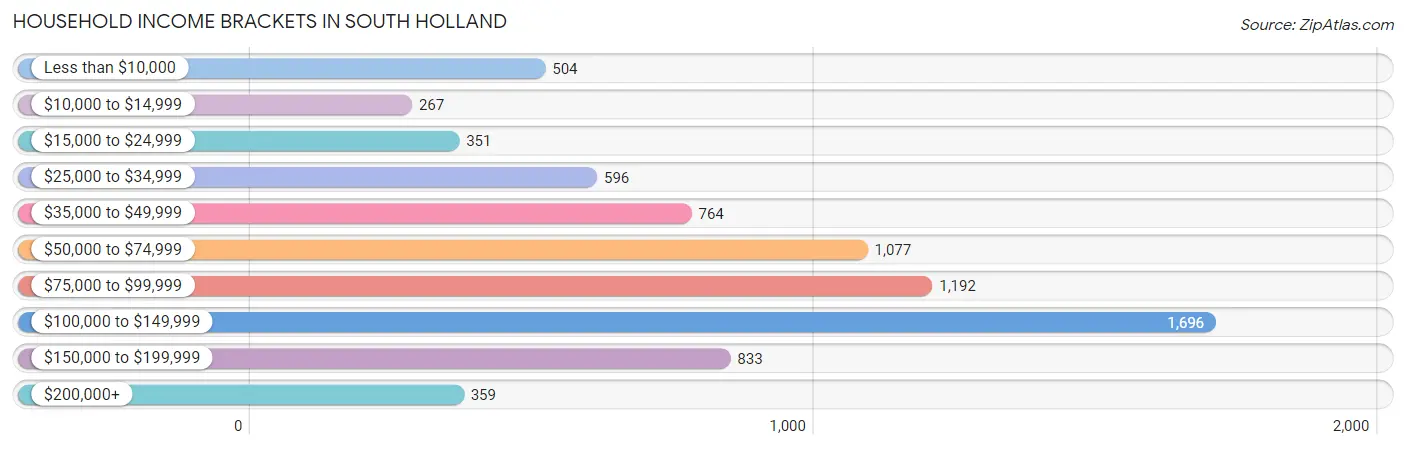
| Income Bracket | # Households | % Households |
| Less than $10,000 | 504 | 6.6% |
| $10,000 to $14,999 | 267 | 3.5% |
| $15,000 to $24,999 | 351 | 4.6% |
| $25,000 to $34,999 | 596 | 7.8% |
| $35,000 to $49,999 | 764 | 10.0% |
| $50,000 to $74,999 | 1,077 | 14.1% |
| $75,000 to $99,999 | 1,192 | 15.6% |
| $100,000 to $149,999 | 1,696 | 22.2% |
| $150,000 to $199,999 | 833 | 10.9% |
| $200,000+ | 359 | 4.7% |
Household Income by Householder Age in South Holland
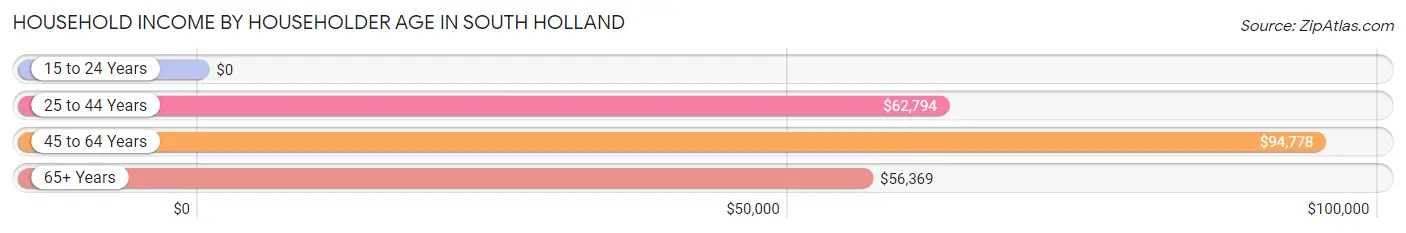
The median household income in South Holland is $79,567, with the highest median household income of $94,778 found in the 45 to 64 years age bracket for the primary householder. A total of 3,392 households (44.4%) fall into this category. Meanwhile, the 15 to 24 years age bracket for the primary householder has the lowest median household income of $0, with 41 households (0.5%) in this group.
| Income Bracket | # Households | Median Income |
| 15 to 24 Years | 41 (0.5%) | $0 |
| 25 to 44 Years | 1,790 (23.4%) | $62,794 |
| 45 to 64 Years | 3,392 (44.4%) | $94,778 |
| 65+ Years | 2,415 (31.6%) | $56,369 |
| Total | 7,638 (100.0%) | $79,567 |
Poverty in South Holland
Income Below Poverty by Sex and Age in South Holland
With 11.0% poverty level for males and 16.7% for females among the residents of South Holland, 16 and 17 year old males and 15 year old females are the most vulnerable to poverty, with 90 males (44.8%) and 78 females (61.4%) in their respective age groups living below the poverty level.
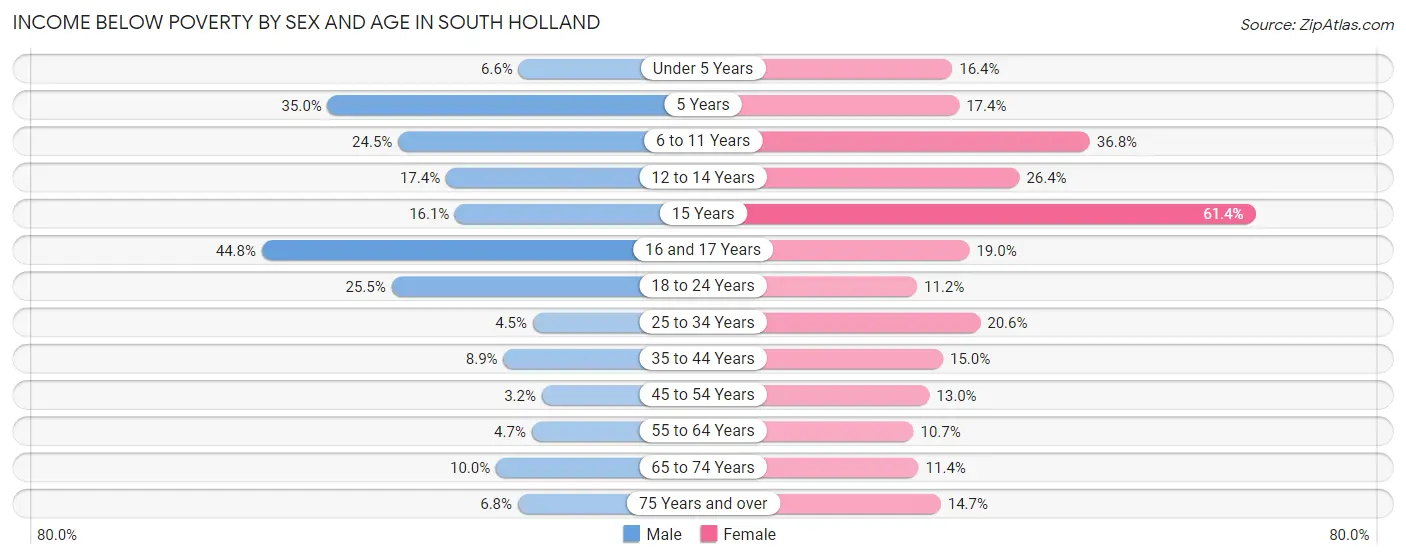
| Age Bracket | Male | Female |
| Under 5 Years | 38 (6.6%) | 74 (16.4%) |
| 5 Years | 49 (35.0%) | 30 (17.4%) |
| 6 to 11 Years | 155 (24.5%) | 294 (36.8%) |
| 12 to 14 Years | 87 (17.4%) | 110 (26.4%) |
| 15 Years | 44 (16.1%) | 78 (61.4%) |
| 16 and 17 Years | 90 (44.8%) | 73 (19.0%) |
| 18 to 24 Years | 211 (25.5%) | 99 (11.2%) |
| 25 to 34 Years | 43 (4.5%) | 245 (20.6%) |
| 35 to 44 Years | 89 (8.9%) | 254 (15.0%) |
| 45 to 54 Years | 43 (3.2%) | 218 (13.0%) |
| 55 to 64 Years | 70 (4.7%) | 171 (10.6%) |
| 65 to 74 Years | 83 (10.0%) | 128 (11.4%) |
| 75 Years and over | 56 (6.8%) | 106 (14.7%) |
| Total | 1,058 (11.0%) | 1,880 (16.7%) |
Income Above Poverty by Sex and Age in South Holland
According to the poverty statistics in South Holland, males aged 45 to 54 years and females aged 55 to 64 years are the age groups that are most secure financially, with 96.8% of males and 89.3% of females in these age groups living above the poverty line.
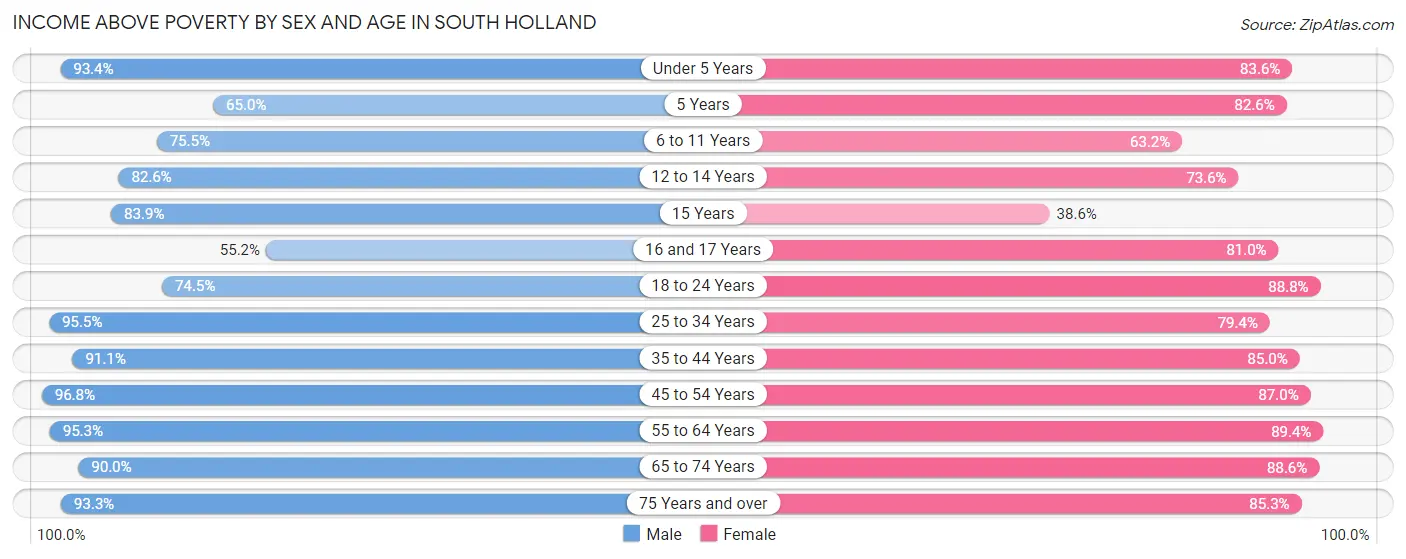
| Age Bracket | Male | Female |
| Under 5 Years | 535 (93.4%) | 377 (83.6%) |
| 5 Years | 91 (65.0%) | 142 (82.6%) |
| 6 to 11 Years | 477 (75.5%) | 504 (63.2%) |
| 12 to 14 Years | 412 (82.6%) | 307 (73.6%) |
| 15 Years | 230 (83.9%) | 49 (38.6%) |
| 16 and 17 Years | 111 (55.2%) | 312 (81.0%) |
| 18 to 24 Years | 616 (74.5%) | 787 (88.8%) |
| 25 to 34 Years | 907 (95.5%) | 946 (79.4%) |
| 35 to 44 Years | 911 (91.1%) | 1,436 (85.0%) |
| 45 to 54 Years | 1,301 (96.8%) | 1,457 (87.0%) |
| 55 to 64 Years | 1,424 (95.3%) | 1,435 (89.3%) |
| 65 to 74 Years | 748 (90.0%) | 994 (88.6%) |
| 75 Years and over | 774 (93.2%) | 615 (85.3%) |
| Total | 8,537 (89.0%) | 9,361 (83.3%) |
Income Below Poverty Among Married-Couple Families in South Holland
The poverty statistics for married-couple families in South Holland show that 3.3% or 103 of the total 3,142 families live below the poverty line. Families with 5 or more children have the highest poverty rate of 30.0%, comprising of 6 families. On the other hand, families with no children have the lowest poverty rate of 1.8%, which includes 42 families.
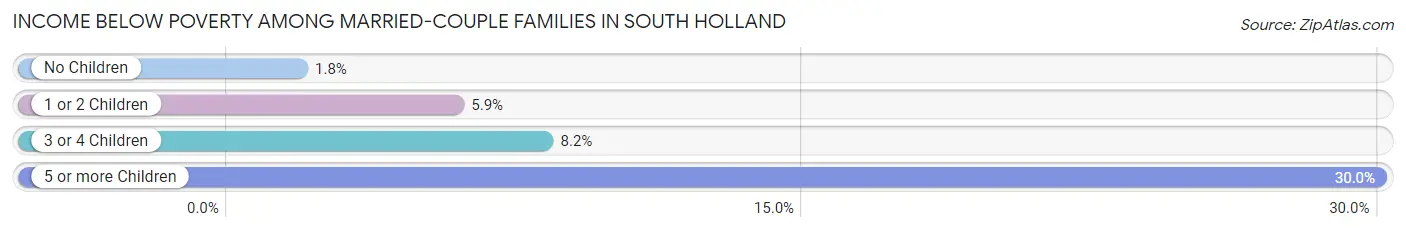
| Children | Above Poverty | Below Poverty |
| No Children | 2,250 (98.2%) | 42 (1.8%) |
| 1 or 2 Children | 541 (94.1%) | 34 (5.9%) |
| 3 or 4 Children | 234 (91.8%) | 21 (8.2%) |
| 5 or more Children | 14 (70.0%) | 6 (30.0%) |
| Total | 3,039 (96.7%) | 103 (3.3%) |
Income Below Poverty Among Single-Parent Households in South Holland
According to the poverty data in South Holland, 13.2% or 68 single-father households and 16.8% or 308 single-mother households are living below the poverty line. Among single-father households, those with 3 or 4 children have the highest poverty rate, with 22 households (100.0%) experiencing poverty. Likewise, among single-mother households, those with 5 or more children have the highest poverty rate, with 28 households (100.0%) falling below the poverty line.
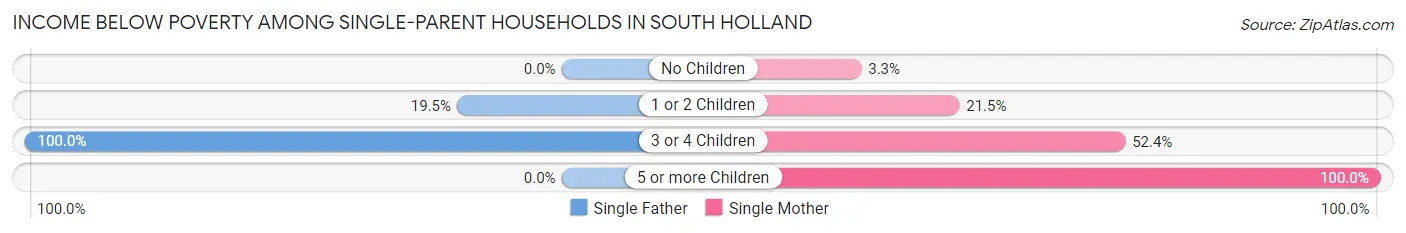
| Children | Single Father | Single Mother |
| No Children | 0 (0.0%) | 24 (3.3%) |
| 1 or 2 Children | 46 (19.5%) | 213 (21.5%) |
| 3 or 4 Children | 22 (100.0%) | 43 (52.4%) |
| 5 or more Children | 0 (0.0%) | 28 (100.0%) |
| Total | 68 (13.2%) | 308 (16.8%) |
Income Below Poverty Among Married-Couple vs Single-Parent Households in South Holland
The poverty data for South Holland shows that 103 of the married-couple family households (3.3%) and 376 of the single-parent households (16.0%) are living below the poverty level. Within the married-couple family households, those with 5 or more children have the highest poverty rate, with 6 households (30.0%) falling below the poverty line. Among the single-parent households, those with 5 or more children have the highest poverty rate, with 28 household (100.0%) living below poverty.
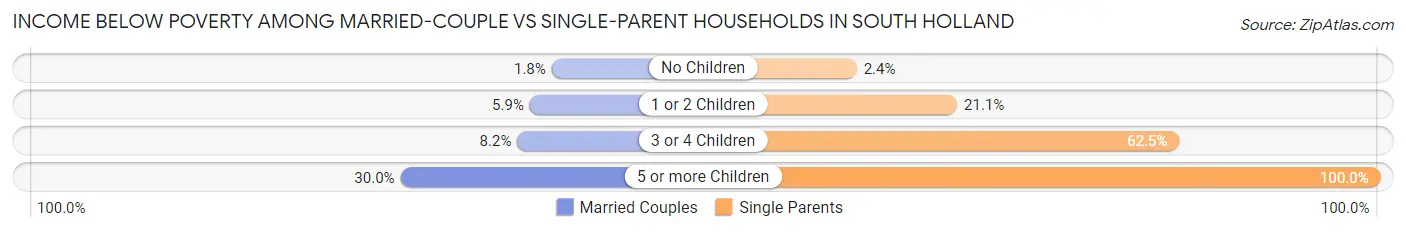
| Children | Married-Couple Families | Single-Parent Households |
| No Children | 42 (1.8%) | 24 (2.4%) |
| 1 or 2 Children | 34 (5.9%) | 259 (21.1%) |
| 3 or 4 Children | 21 (8.2%) | 65 (62.5%) |
| 5 or more Children | 6 (30.0%) | 28 (100.0%) |
| Total | 103 (3.3%) | 376 (16.0%) |
Race in South Holland
The most populous races in South Holland are Black / African American (17,097 | 80.3%), White / Caucasian (2,577 | 12.1%), and Hispanic or Latino (1,083 | 5.1%).
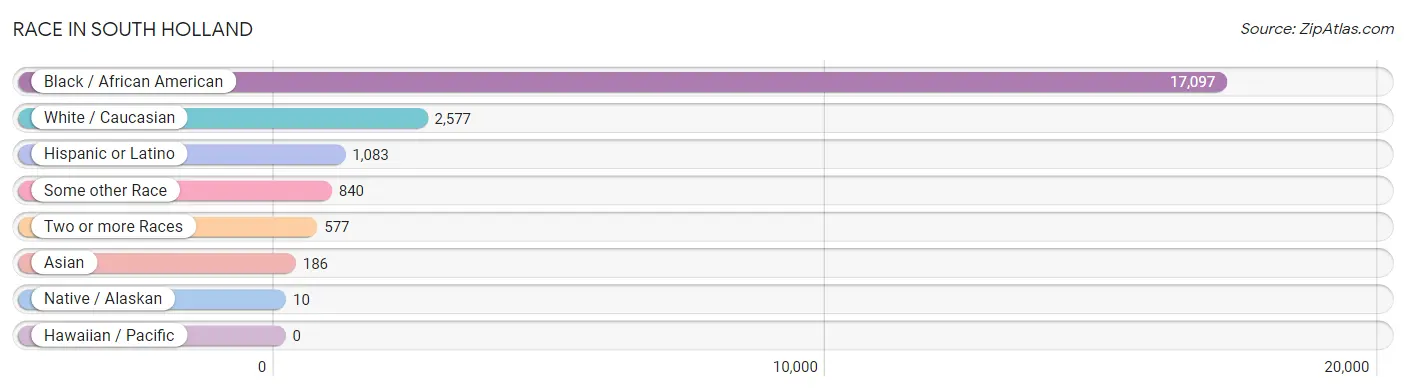
| Race | # Population | % Population |
| Asian | 186 | 0.9% |
| Black / African American | 17,097 | 80.3% |
| Hawaiian / Pacific | 0 | 0.0% |
| Hispanic or Latino | 1,083 | 5.1% |
| Native / Alaskan | 10 | 0.1% |
| White / Caucasian | 2,577 | 12.1% |
| Two or more Races | 577 | 2.7% |
| Some other Race | 840 | 4.0% |
| Total | 21,287 | 100.0% |
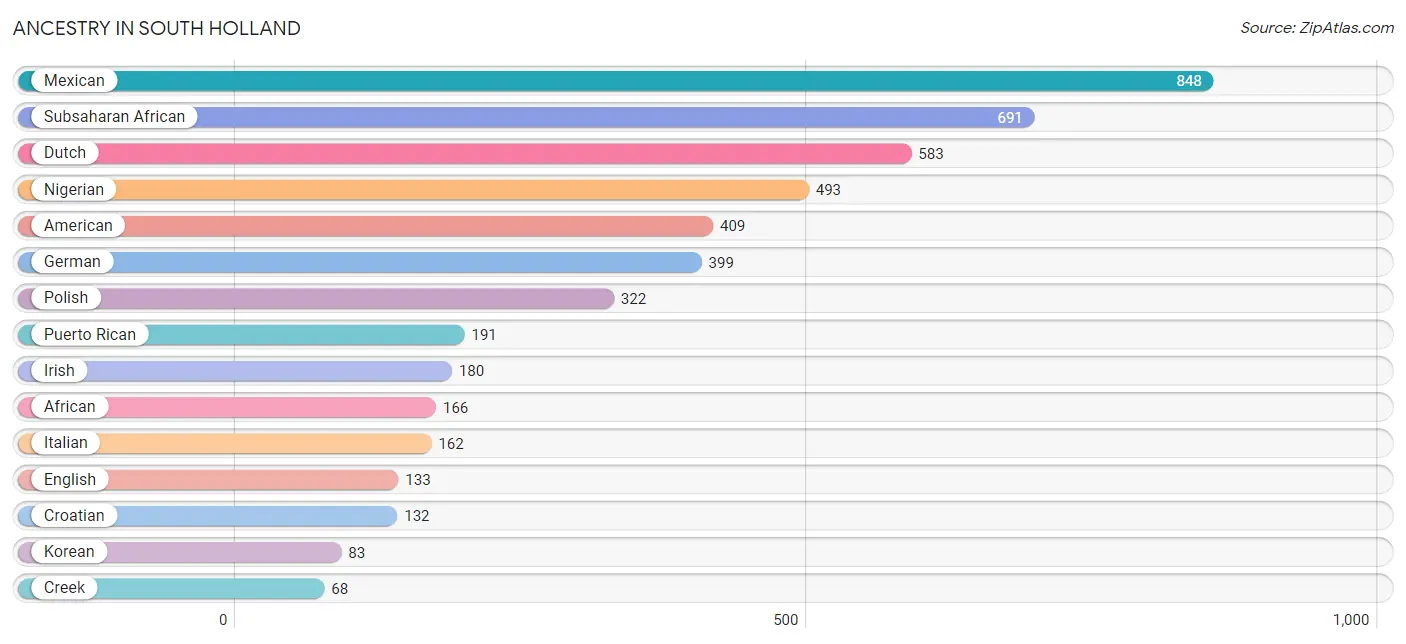
Ancestry in South Holland
The most populous ancestries reported in South Holland are Mexican (848 | 4.0%), Subsaharan African (691 | 3.3%), Dutch (583 | 2.7%), Nigerian (493 | 2.3%), and American (409 | 1.9%), together accounting for 14.2% of all South Holland residents.
| Ancestry | # Population | % Population |
| African | 166 | 0.8% |
| American | 409 | 1.9% |
| Arab | 6 | 0.0% |
| Austrian | 20 | 0.1% |
| Bhutanese | 28 | 0.1% |
| Burmese | 16 | 0.1% |
| Central American | 12 | 0.1% |
| Colombian | 13 | 0.1% |
| Creek | 68 | 0.3% |
| Croatian | 132 | 0.6% |
| Danish | 14 | 0.1% |
| Dutch | 583 | 2.7% |
| English | 133 | 0.6% |
| European | 57 | 0.3% |
| French | 30 | 0.1% |
| French Canadian | 10 | 0.1% |
| German | 399 | 1.9% |
| Greek | 35 | 0.2% |
| Guatemalan | 7 | 0.0% |
| Haitian | 48 | 0.2% |
| Hungarian | 2 | 0.0% |
| Indian (Asian) | 66 | 0.3% |
| Irish | 180 | 0.9% |
| Israeli | 43 | 0.2% |
| Italian | 162 | 0.8% |
| Jamaican | 64 | 0.3% |
| Japanese | 21 | 0.1% |
| Korean | 83 | 0.4% |
| Lebanese | 4 | 0.0% |
| Lithuanian | 17 | 0.1% |
| Mexican | 848 | 4.0% |
| Nigerian | 493 | 2.3% |
| Norwegian | 3 | 0.0% |
| Palestinian | 2 | 0.0% |
| Panamanian | 5 | 0.0% |
| Polish | 322 | 1.5% |
| Puerto Rican | 191 | 0.9% |
| Russian | 31 | 0.2% |
| Samoan | 20 | 0.1% |
| Scandinavian | 9 | 0.0% |
| Scotch-Irish | 12 | 0.1% |
| Scottish | 30 | 0.1% |
| Serbian | 23 | 0.1% |
| South American | 13 | 0.1% |
| Subsaharan African | 691 | 3.3% |
| Swedish | 65 | 0.3% |
| Ugandan | 13 | 0.1% |
| Ukrainian | 20 | 0.1% |
| Welsh | 6 | 0.0% | View All 49 Rows |
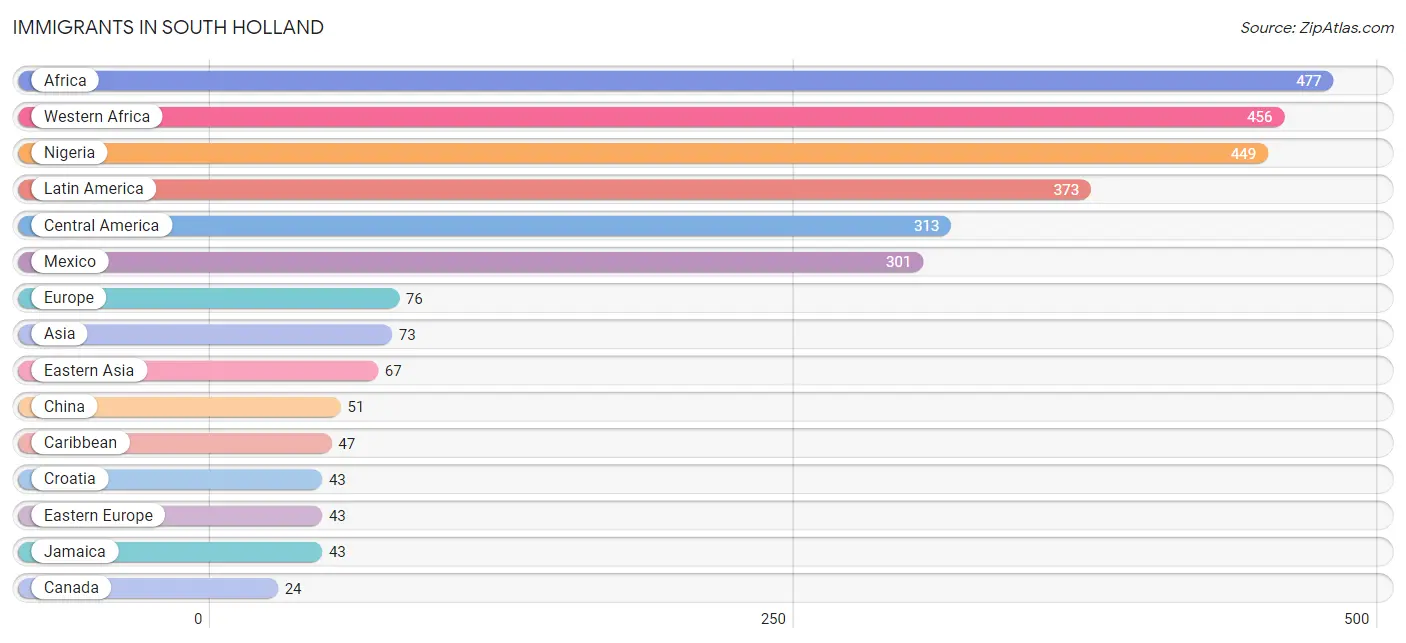
Immigrants in South Holland
The most numerous immigrant groups reported in South Holland came from Africa (477 | 2.2%), Western Africa (456 | 2.1%), Nigeria (449 | 2.1%), Latin America (373 | 1.8%), and Central America (313 | 1.5%), together accounting for 9.7% of all South Holland residents.
| Immigration Origin | # Population | % Population |
| Africa | 477 | 2.2% |
| Asia | 73 | 0.3% |
| Cameroon | 8 | 0.0% |
| Canada | 24 | 0.1% |
| Caribbean | 47 | 0.2% |
| Central America | 313 | 1.5% |
| Chile | 13 | 0.1% |
| China | 51 | 0.2% |
| Croatia | 43 | 0.2% |
| Eastern Africa | 13 | 0.1% |
| Eastern Asia | 67 | 0.3% |
| Eastern Europe | 43 | 0.2% |
| Europe | 76 | 0.4% |
| Germany | 2 | 0.0% |
| Guatemala | 7 | 0.0% |
| Haiti | 4 | 0.0% |
| Israel | 2 | 0.0% |
| Jamaica | 43 | 0.2% |
| Korea | 16 | 0.1% |
| Latin America | 373 | 1.8% |
| Lebanon | 4 | 0.0% |
| Mexico | 301 | 1.4% |
| Middle Africa | 8 | 0.0% |
| Netherlands | 22 | 0.1% |
| Nigeria | 449 | 2.1% |
| Northern Europe | 9 | 0.0% |
| Panama | 5 | 0.0% |
| South America | 13 | 0.1% |
| Sweden | 9 | 0.0% |
| Taiwan | 5 | 0.0% |
| Uganda | 13 | 0.1% |
| Western Africa | 456 | 2.1% |
| Western Asia | 6 | 0.0% |
| Western Europe | 24 | 0.1% | View All 34 Rows |
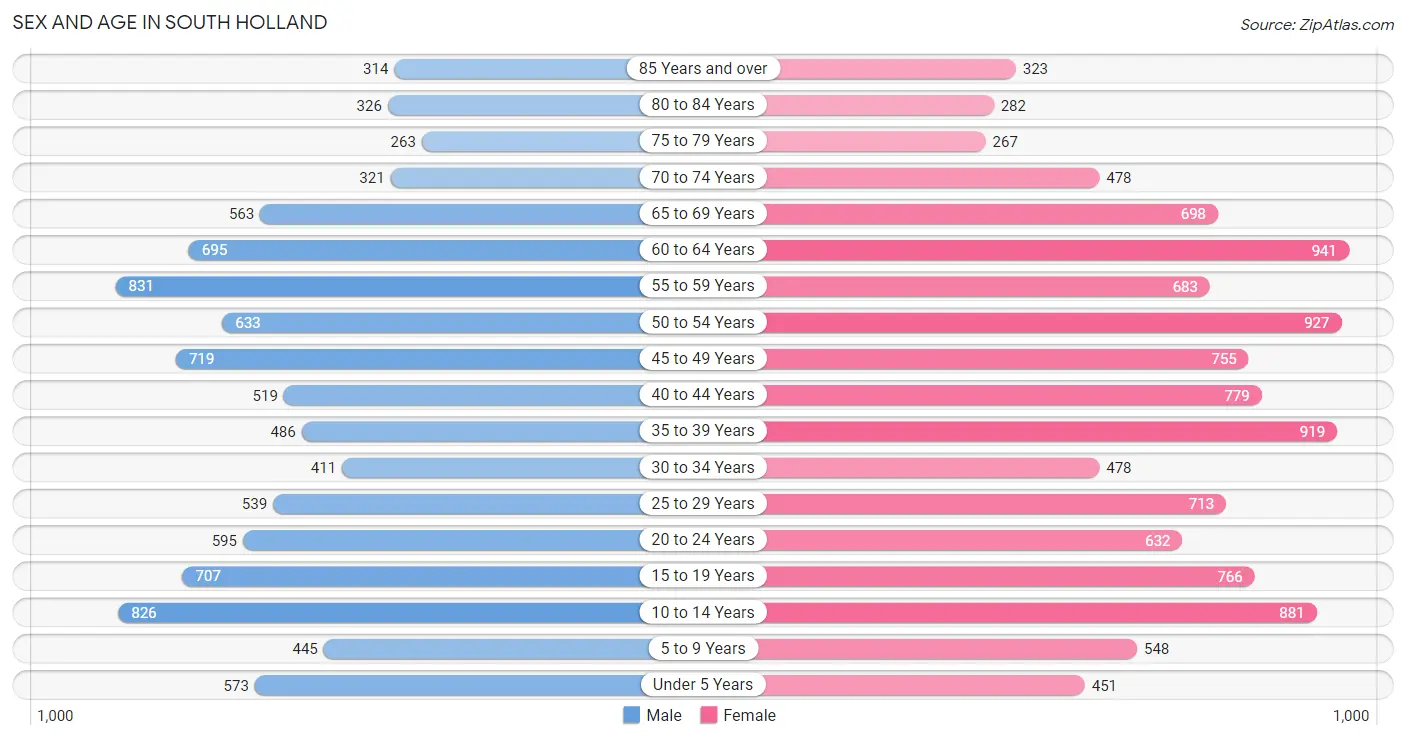
Sex and Age in South Holland
Sex and Age in South Holland
The most populous age groups in South Holland are 55 to 59 Years (831 | 8.5%) for men and 60 to 64 Years (941 | 8.2%) for women.
| Age Bracket | Male | Female |
| Under 5 Years | 573 (5.9%) | 451 (3.9%) |
| 5 to 9 Years | 445 (4.6%) | 548 (4.8%) |
| 10 to 14 Years | 826 (8.5%) | 881 (7.6%) |
| 15 to 19 Years | 707 (7.2%) | 766 (6.7%) |
| 20 to 24 Years | 595 (6.1%) | 632 (5.5%) |
| 25 to 29 Years | 539 (5.5%) | 713 (6.2%) |
| 30 to 34 Years | 411 (4.2%) | 478 (4.2%) |
| 35 to 39 Years | 486 (5.0%) | 919 (8.0%) |
| 40 to 44 Years | 519 (5.3%) | 779 (6.8%) |
| 45 to 49 Years | 719 (7.4%) | 755 (6.6%) |
| 50 to 54 Years | 633 (6.5%) | 927 (8.1%) |
| 55 to 59 Years | 831 (8.5%) | 683 (5.9%) |
| 60 to 64 Years | 695 (7.1%) | 941 (8.2%) |
| 65 to 69 Years | 563 (5.8%) | 698 (6.1%) |
| 70 to 74 Years | 321 (3.3%) | 478 (4.2%) |
| 75 to 79 Years | 263 (2.7%) | 267 (2.3%) |
| 80 to 84 Years | 326 (3.3%) | 282 (2.5%) |
| 85 Years and over | 314 (3.2%) | 323 (2.8%) |
| Total | 9,766 (100.0%) | 11,521 (100.0%) |
Families and Households in South Holland
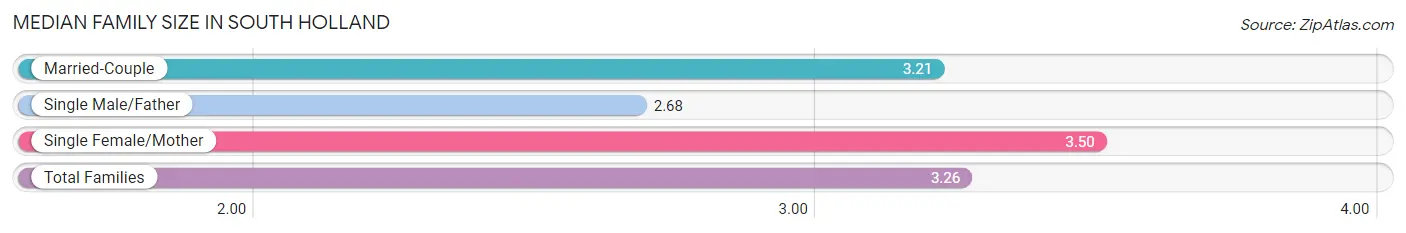
Median Family Size in South Holland
The median family size in South Holland is 3.26 persons per family, with single female/mother families (1,830 | 33.4%) accounting for the largest median family size of 3.5 persons per family. On the other hand, single male/father families (515 | 9.4%) represent the smallest median family size with 2.68 persons per family.
| Family Type | # Families | Family Size |
| Married-Couple | 3,142 (57.3%) | 3.21 |
| Single Male/Father | 515 (9.4%) | 2.68 |
| Single Female/Mother | 1,830 (33.4%) | 3.50 |
| Total Families | 5,487 (100.0%) | 3.26 |
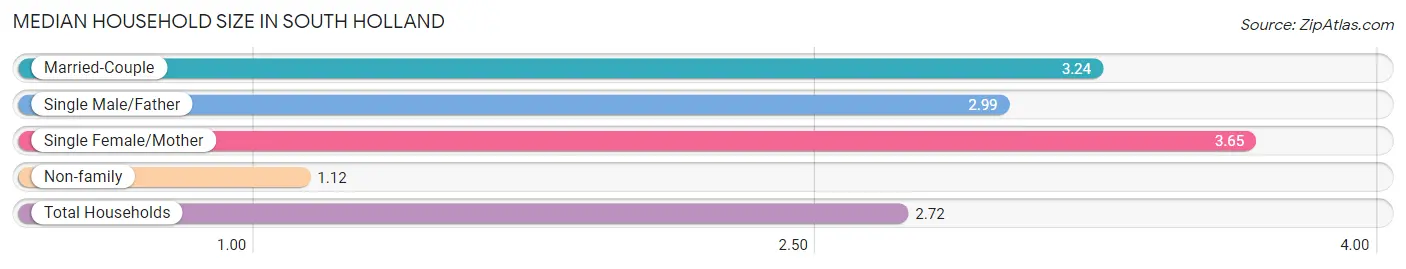
Median Household Size in South Holland
The median household size in South Holland is 2.72 persons per household, with single female/mother households (1,830 | 24.0%) accounting for the largest median household size of 3.65 persons per household. non-family households (2,151 | 28.2%) represent the smallest median household size with 1.12 persons per household.
| Household Type | # Households | Household Size |
| Married-Couple | 3,142 (41.1%) | 3.24 |
| Single Male/Father | 515 (6.7%) | 2.99 |
| Single Female/Mother | 1,830 (24.0%) | 3.65 |
| Non-family | 2,151 (28.2%) | 1.12 |
| Total Households | 7,638 (100.0%) | 2.72 |
Household Size by Marriage Status in South Holland
Out of a total of 7,638 households in South Holland, 5,487 (71.8%) are family households, while 2,151 (28.2%) are nonfamily households. The most numerous type of family households are 2-person households, comprising 2,537, and the most common type of nonfamily households are 1-person households, comprising 1,961.
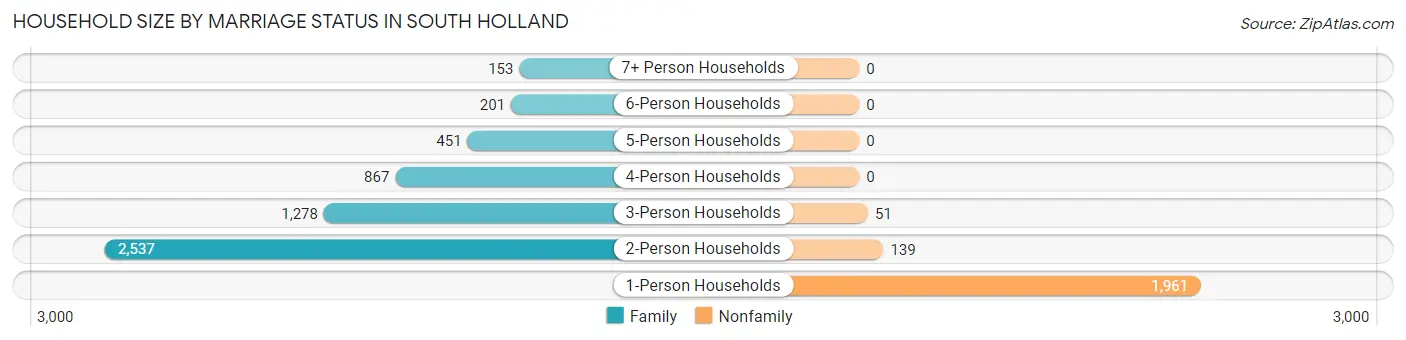
| Household Size | Family Households | Nonfamily Households |
| 1-Person Households | - | 1,961 (25.7%) |
| 2-Person Households | 2,537 (33.2%) | 139 (1.8%) |
| 3-Person Households | 1,278 (16.7%) | 51 (0.7%) |
| 4-Person Households | 867 (11.4%) | 0 (0.0%) |
| 5-Person Households | 451 (5.9%) | 0 (0.0%) |
| 6-Person Households | 201 (2.6%) | 0 (0.0%) |
| 7+ Person Households | 153 (2.0%) | 0 (0.0%) |
| Total | 5,487 (71.8%) | 2,151 (28.2%) |
Female Fertility in South Holland
Fertility by Age in South Holland
Average fertility rate in South Holland is 39.0 births per 1,000 women. Women in the age bracket of 20 to 34 years have the highest fertility rate with 88.0 births per 1,000 women. Women in the age bracket of 20 to 34 years acount for 79.7% of all women with births.
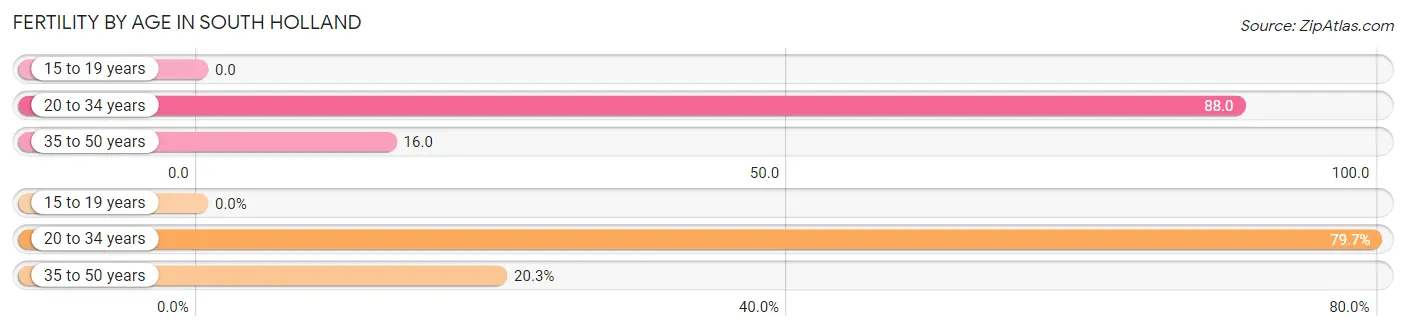
| Age Bracket | Women with Births | Births / 1,000 Women |
| 15 to 19 years | 0 (0.0%) | 0.0 |
| 20 to 34 years | 161 (79.7%) | 88.0 |
| 35 to 50 years | 41 (20.3%) | 16.0 |
| Total | 202 (100.0%) | 39.0 |
Fertility by Age by Marriage Status in South Holland
15.3% of women with births (202) in South Holland are married. The highest percentage of unmarried women with births falls into 20 to 34 years age bracket with 86.3% of them unmarried at the time of birth, while the lowest percentage of unmarried women with births belong to 35 to 50 years age bracket with 78.0% of them unmarried.
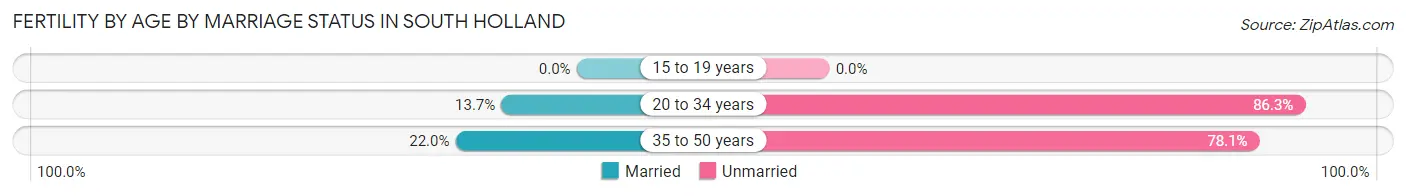
| Age Bracket | Married | Unmarried |
| 15 to 19 years | 0 (0.0%) | 0 (0.0%) |
| 20 to 34 years | 22 (13.7%) | 139 (86.3%) |
| 35 to 50 years | 9 (22.0%) | 32 (78.0%) |
| Total | 31 (15.3%) | 171 (84.7%) |
Fertility by Education in South Holland
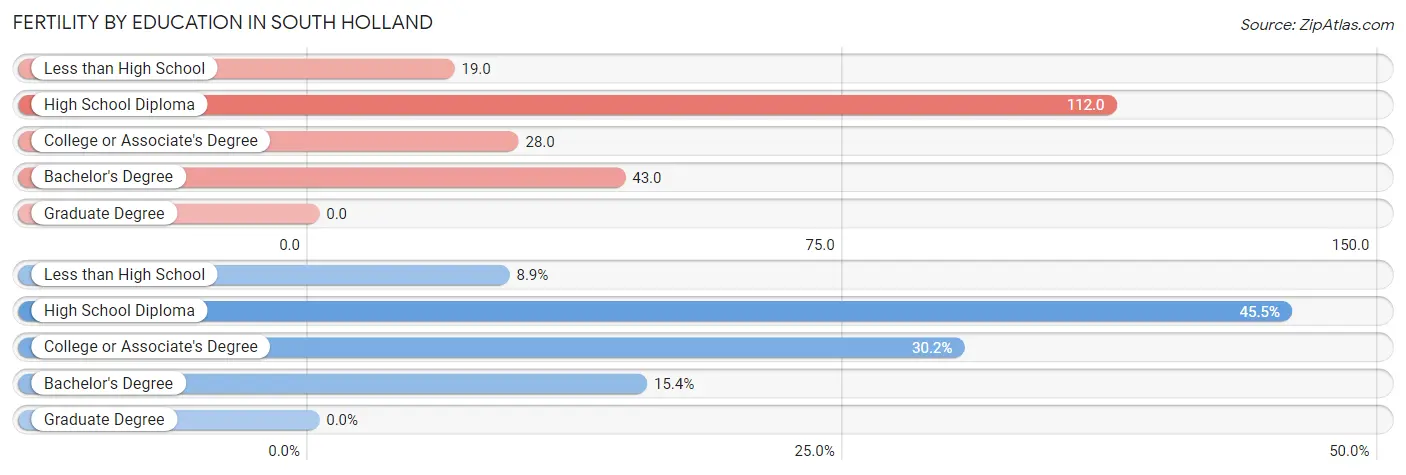
| Educational Attainment | Women with Births | Births / 1,000 Women |
| Less than High School | 18 (8.9%) | 19.0 |
| High School Diploma | 92 (45.5%) | 112.0 |
| College or Associate's Degree | 61 (30.2%) | 28.0 |
| Bachelor's Degree | 31 (15.3%) | 43.0 |
| Graduate Degree | 0 (0.0%) | 0.0 |
| Total | 202 (100.0%) | 39.0 |
Fertility by Education by Marriage Status in South Holland
84.7% of women with births in South Holland are unmarried. Women with the educational attainment of bachelor's degree are most likely to be married with 100.0% of them married at childbirth, while women with the educational attainment of less than high school are least likely to be married with 100.0% of them unmarried at childbirth.
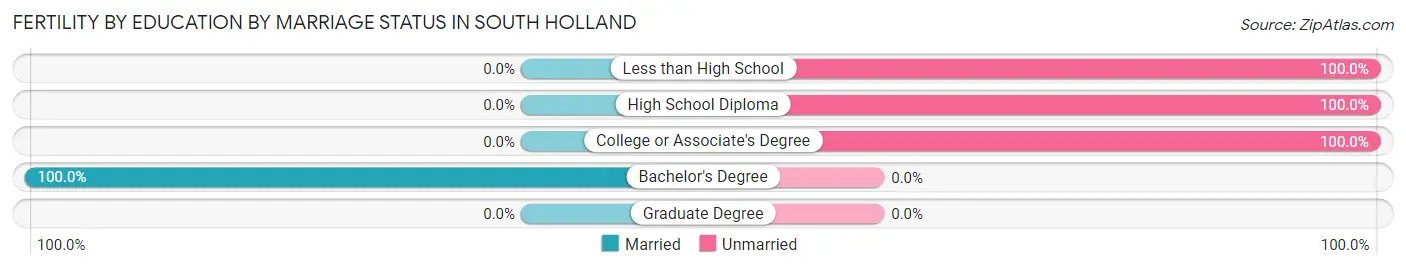
| Educational Attainment | Married | Unmarried |
| Less than High School | 0 (0.0%) | 18 (100.0%) |
| High School Diploma | 0 (0.0%) | 92 (100.0%) |
| College or Associate's Degree | 0 (0.0%) | 61 (100.0%) |
| Bachelor's Degree | 31 (100.0%) | 0 (0.0%) |
| Graduate Degree | 0 (0.0%) | 0 (0.0%) |
| Total | 31 (15.3%) | 171 (84.7%) |
Employment Characteristics in South Holland
Employment by Class of Employer in South Holland
Among the 8,458 employed individuals in South Holland, private company employees (5,044 | 59.6%), not-for-profit organizations (935 | 11.1%), and local government employees (911 | 10.8%) make up the most common classes of employment.
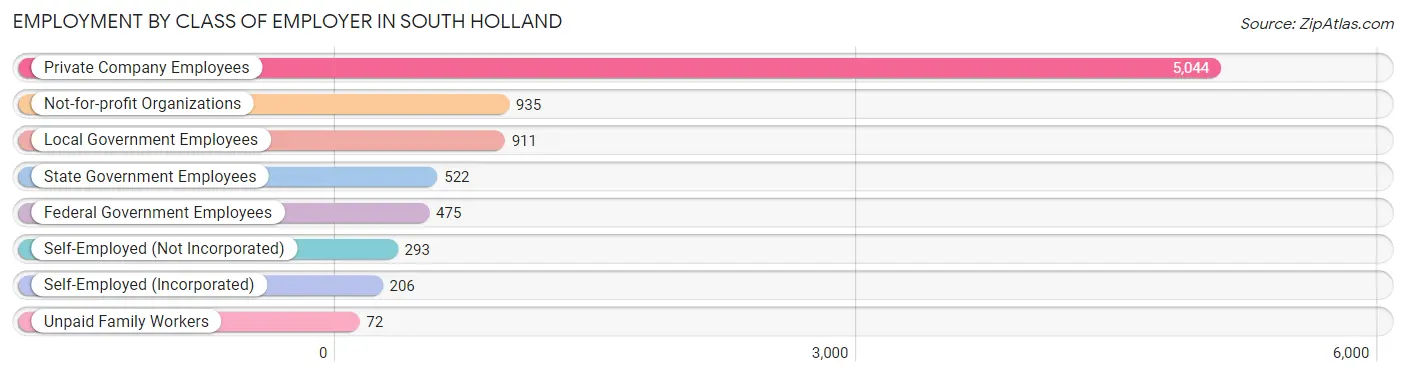
| Employer Class | # Employees | % Employees |
| Private Company Employees | 5,044 | 59.6% |
| Self-Employed (Incorporated) | 206 | 2.4% |
| Self-Employed (Not Incorporated) | 293 | 3.5% |
| Not-for-profit Organizations | 935 | 11.1% |
| Local Government Employees | 911 | 10.8% |
| State Government Employees | 522 | 6.2% |
| Federal Government Employees | 475 | 5.6% |
| Unpaid Family Workers | 72 | 0.9% |
| Total | 8,458 | 100.0% |
Employment Status by Age in South Holland
According to the labor force statistics for South Holland, out of the total population over 16 years of age (17,162), 60.2% or 10,332 individuals are in the labor force, with 14.1% or 1,457 of them unemployed. The age group with the highest labor force participation rate is 30 to 34 years, with 90.1% or 801 individuals in the labor force. Within the labor force, the 16 to 19 years age range has the highest percentage of unemployed individuals, with 51.6% or 231 of them being unemployed.
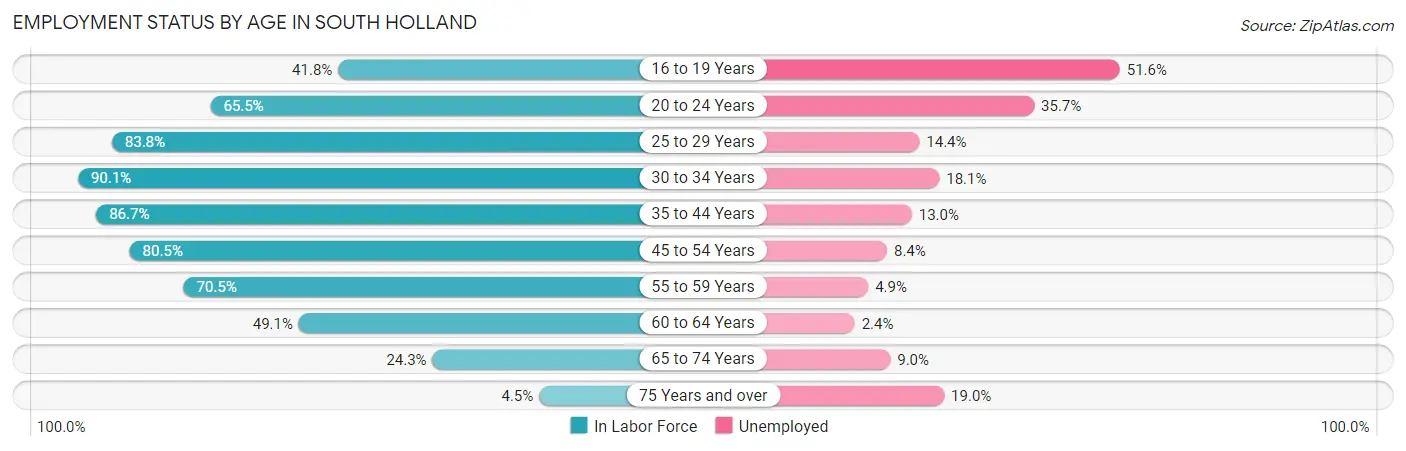
| Age Bracket | In Labor Force | Unemployed |
| 16 to 19 Years | 448 (41.8%) | 231 (51.6%) |
| 20 to 24 Years | 804 (65.5%) | 287 (35.7%) |
| 25 to 29 Years | 1,049 (83.8%) | 151 (14.4%) |
| 30 to 34 Years | 801 (90.1%) | 145 (18.1%) |
| 35 to 44 Years | 2,344 (86.7%) | 305 (13.0%) |
| 45 to 54 Years | 2,442 (80.5%) | 205 (8.4%) |
| 55 to 59 Years | 1,067 (70.5%) | 52 (4.9%) |
| 60 to 64 Years | 803 (49.1%) | 19 (2.4%) |
| 65 to 74 Years | 501 (24.3%) | 45 (9.0%) |
| 75 Years and over | 80 (4.5%) | 15 (19.0%) |
| Total | 10,332 (60.2%) | 1,457 (14.1%) |
Employment Status by Educational Attainment in South Holland
According to labor force statistics for South Holland, 77.1% of individuals (8,503) out of the total population between 25 and 64 years of age (11,028) are in the labor force, with 10.3% or 876 of them being unemployed. The group with the highest labor force participation rate are those with the educational attainment of bachelor's degree or higher, with 83.4% or 2,803 individuals in the labor force. Within the labor force, individuals with less than high school education have the highest percentage of unemployment, with 23.9% or 94 of them being unemployed.
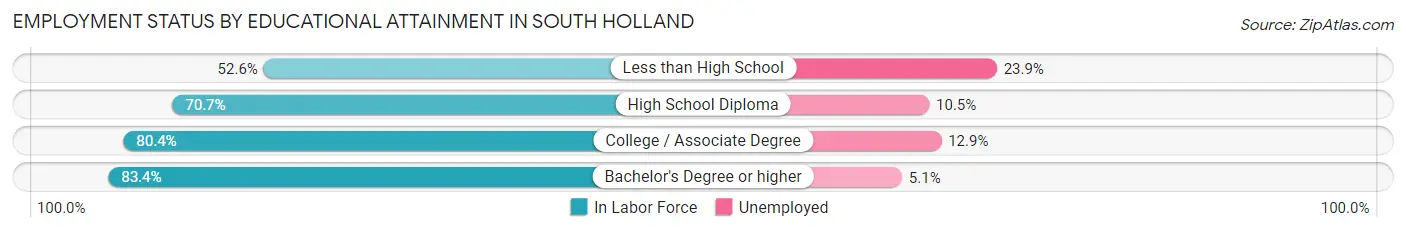
| Educational Attainment | In Labor Force | Unemployed |
| Less than High School | 393 (52.6%) | 179 (23.9%) |
| High School Diploma | 1,871 (70.7%) | 278 (10.5%) |
| College / Associate Degree | 3,436 (80.4%) | 551 (12.9%) |
| Bachelor's Degree or higher | 2,803 (83.4%) | 171 (5.1%) |
| Total | 8,503 (77.1%) | 1,136 (10.3%) |
Employment Occupations by Sex in South Holland
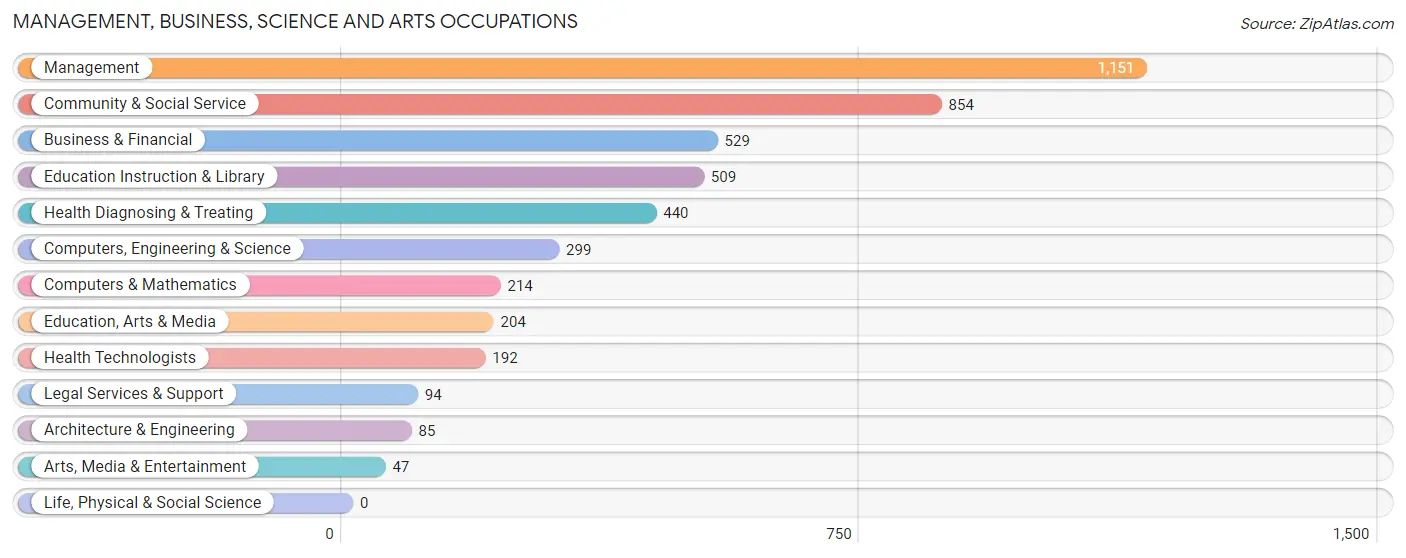
Management, Business, Science and Arts Occupations
The most common Management, Business, Science and Arts occupations in South Holland are Management (1,151 | 13.0%), Community & Social Service (854 | 9.6%), Business & Financial (529 | 6.0%), Education Instruction & Library (509 | 5.7%), and Health Diagnosing & Treating (440 | 5.0%).
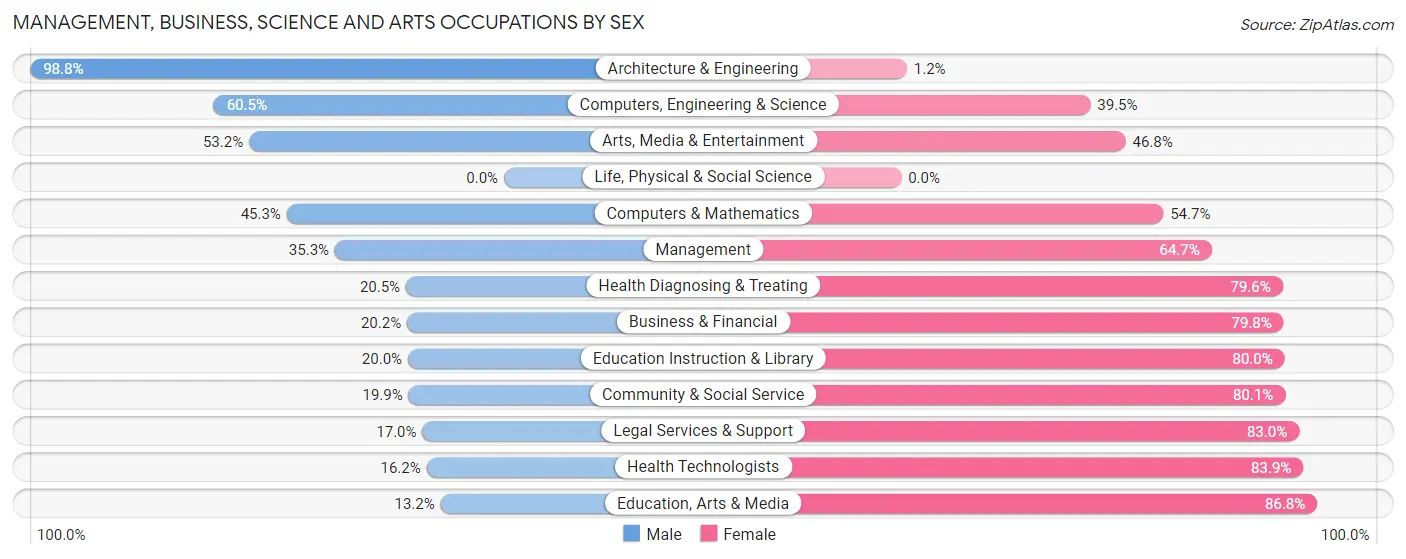
Management, Business, Science and Arts Occupations by Sex
Within the Management, Business, Science and Arts occupations in South Holland, the most male-oriented occupations are Architecture & Engineering (98.8%), Computers, Engineering & Science (60.5%), and Arts, Media & Entertainment (53.2%), while the most female-oriented occupations are Education, Arts & Media (86.8%), Health Technologists (83.9%), and Legal Services & Support (83.0%).
| Occupation | Male | Female |
| Management | 406 (35.3%) | 745 (64.7%) |
| Business & Financial | 107 (20.2%) | 422 (79.8%) |
| Computers, Engineering & Science | 181 (60.5%) | 118 (39.5%) |
| Computers & Mathematics | 97 (45.3%) | 117 (54.7%) |
| Architecture & Engineering | 84 (98.8%) | 1 (1.2%) |
| Life, Physical & Social Science | 0 (0.0%) | 0 (0.0%) |
| Community & Social Service | 170 (19.9%) | 684 (80.1%) |
| Education, Arts & Media | 27 (13.2%) | 177 (86.8%) |
| Legal Services & Support | 16 (17.0%) | 78 (83.0%) |
| Education Instruction & Library | 102 (20.0%) | 407 (80.0%) |
| Arts, Media & Entertainment | 25 (53.2%) | 22 (46.8%) |
| Health Diagnosing & Treating | 90 (20.4%) | 350 (79.5%) |
| Health Technologists | 31 (16.2%) | 161 (83.9%) |
| Total (Category) | 954 (29.1%) | 2,319 (70.9%) |
| Total (Overall) | 3,882 (43.8%) | 4,986 (56.2%) |
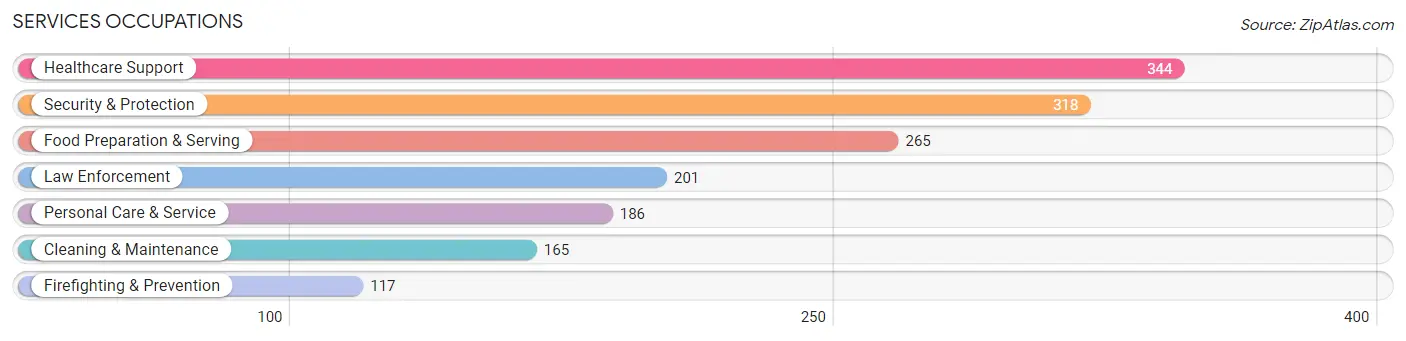
Services Occupations
The most common Services occupations in South Holland are Healthcare Support (344 | 3.9%), Security & Protection (318 | 3.6%), Food Preparation & Serving (265 | 3.0%), Law Enforcement (201 | 2.3%), and Personal Care & Service (186 | 2.1%).
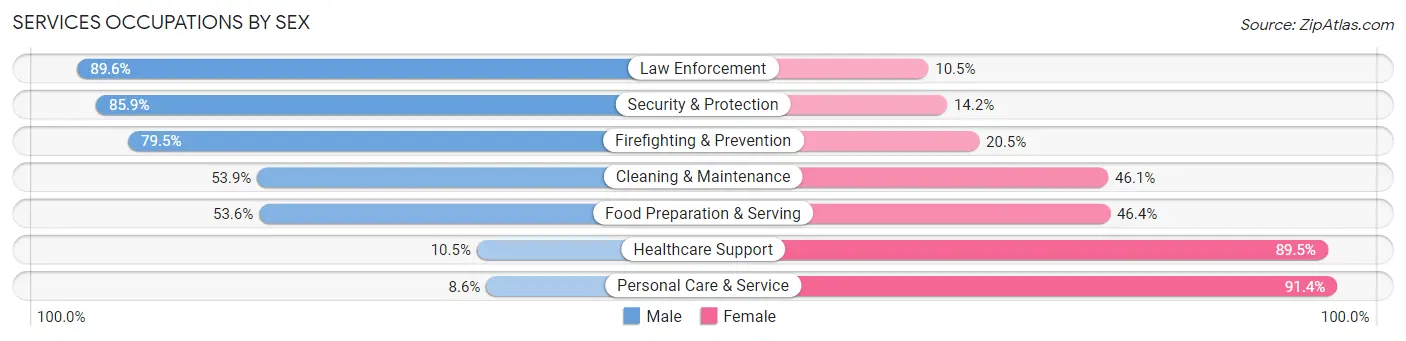
Services Occupations by Sex
Within the Services occupations in South Holland, the most male-oriented occupations are Law Enforcement (89.5%), Security & Protection (85.9%), and Firefighting & Prevention (79.5%), while the most female-oriented occupations are Personal Care & Service (91.4%), Healthcare Support (89.5%), and Food Preparation & Serving (46.4%).
| Occupation | Male | Female |
| Healthcare Support | 36 (10.5%) | 308 (89.5%) |
| Security & Protection | 273 (85.9%) | 45 (14.1%) |
| Firefighting & Prevention | 93 (79.5%) | 24 (20.5%) |
| Law Enforcement | 180 (89.5%) | 21 (10.4%) |
| Food Preparation & Serving | 142 (53.6%) | 123 (46.4%) |
| Cleaning & Maintenance | 89 (53.9%) | 76 (46.1%) |
| Personal Care & Service | 16 (8.6%) | 170 (91.4%) |
| Total (Category) | 556 (43.5%) | 722 (56.5%) |
| Total (Overall) | 3,882 (43.8%) | 4,986 (56.2%) |
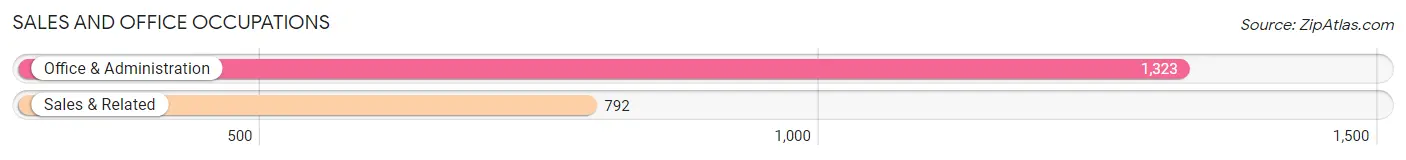
Sales and Office Occupations
The most common Sales and Office occupations in South Holland are Office & Administration (1,323 | 14.9%), and Sales & Related (792 | 8.9%).
Sales and Office Occupations by Sex
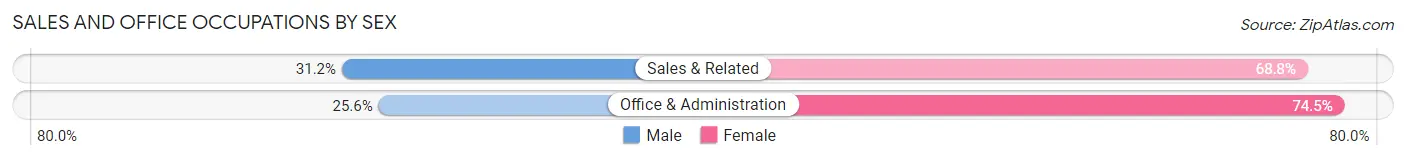
| Occupation | Male | Female |
| Sales & Related | 247 (31.2%) | 545 (68.8%) |
| Office & Administration | 338 (25.6%) | 985 (74.5%) |
| Total (Category) | 585 (27.7%) | 1,530 (72.3%) |
| Total (Overall) | 3,882 (43.8%) | 4,986 (56.2%) |
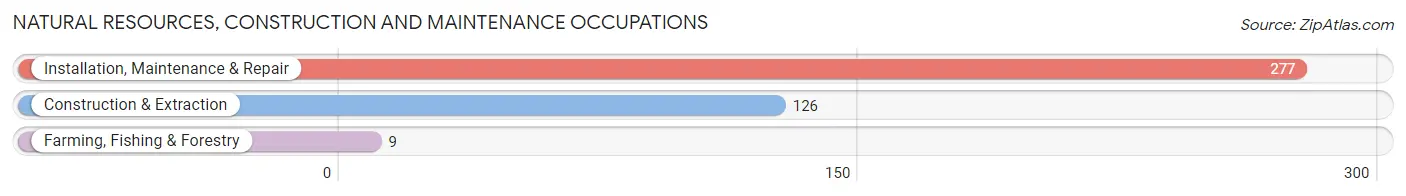
Natural Resources, Construction and Maintenance Occupations
The most common Natural Resources, Construction and Maintenance occupations in South Holland are Installation, Maintenance & Repair (277 | 3.1%), Construction & Extraction (126 | 1.4%), and Farming, Fishing & Forestry (9 | 0.1%).
Natural Resources, Construction and Maintenance Occupations by Sex
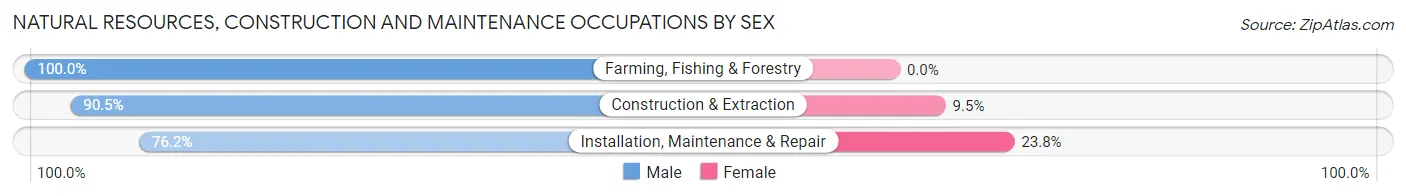
| Occupation | Male | Female |
| Farming, Fishing & Forestry | 9 (100.0%) | 0 (0.0%) |
| Construction & Extraction | 114 (90.5%) | 12 (9.5%) |
| Installation, Maintenance & Repair | 211 (76.2%) | 66 (23.8%) |
| Total (Category) | 334 (81.1%) | 78 (18.9%) |
| Total (Overall) | 3,882 (43.8%) | 4,986 (56.2%) |
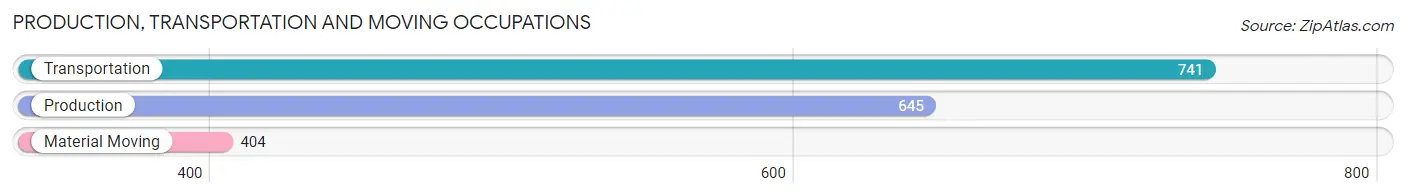
Production, Transportation and Moving Occupations
The most common Production, Transportation and Moving occupations in South Holland are Transportation (741 | 8.4%), Production (645 | 7.3%), and Material Moving (404 | 4.6%).
Production, Transportation and Moving Occupations by Sex
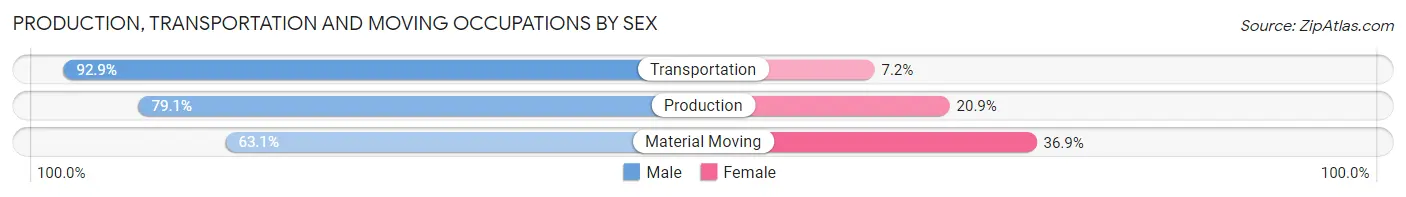
| Occupation | Male | Female |
| Production | 510 (79.1%) | 135 (20.9%) |
| Transportation | 688 (92.8%) | 53 (7.1%) |
| Material Moving | 255 (63.1%) | 149 (36.9%) |
| Total (Category) | 1,453 (81.2%) | 337 (18.8%) |
| Total (Overall) | 3,882 (43.8%) | 4,986 (56.2%) |
Employment Industries by Sex in South Holland
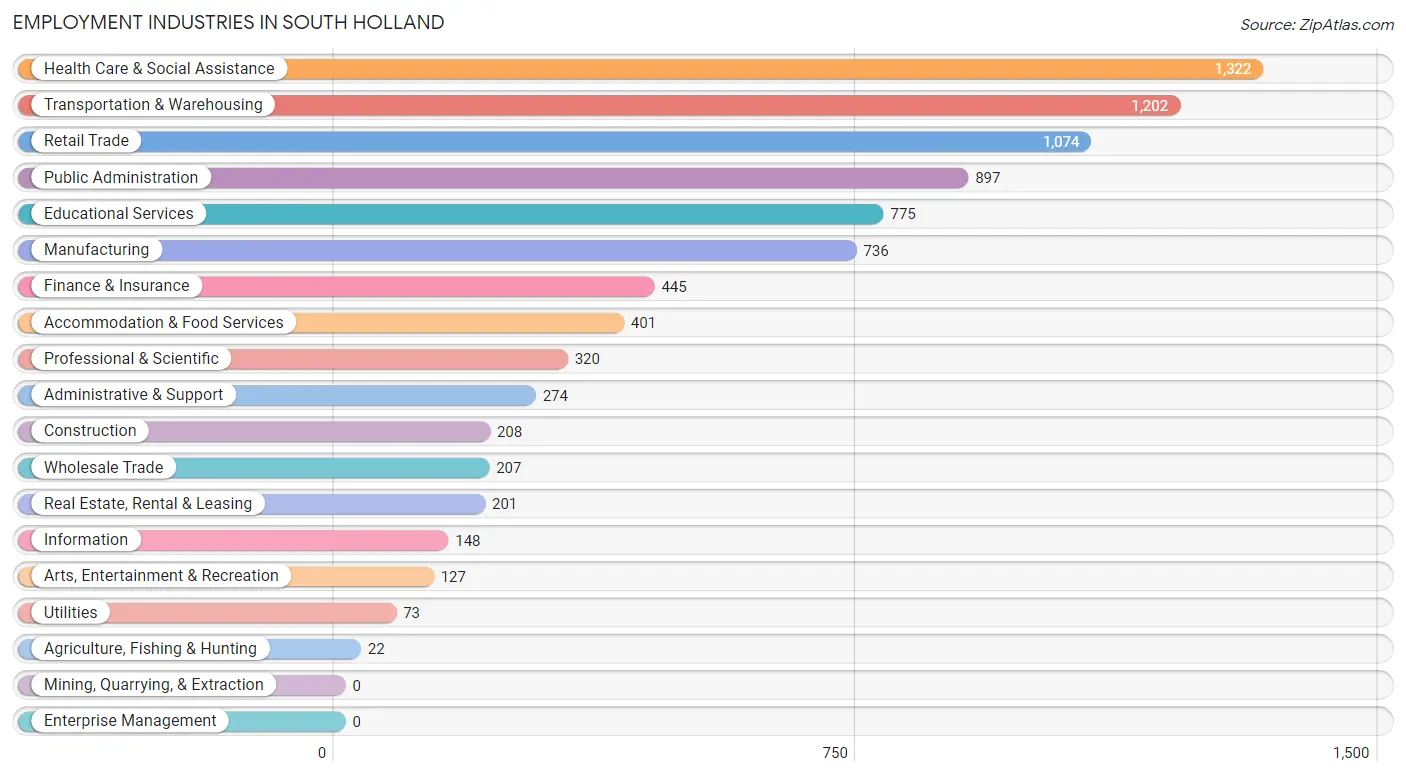
Employment Industries in South Holland
The major employment industries in South Holland include Health Care & Social Assistance (1,322 | 14.9%), Transportation & Warehousing (1,202 | 13.6%), Retail Trade (1,074 | 12.1%), Public Administration (897 | 10.1%), and Educational Services (775 | 8.7%).
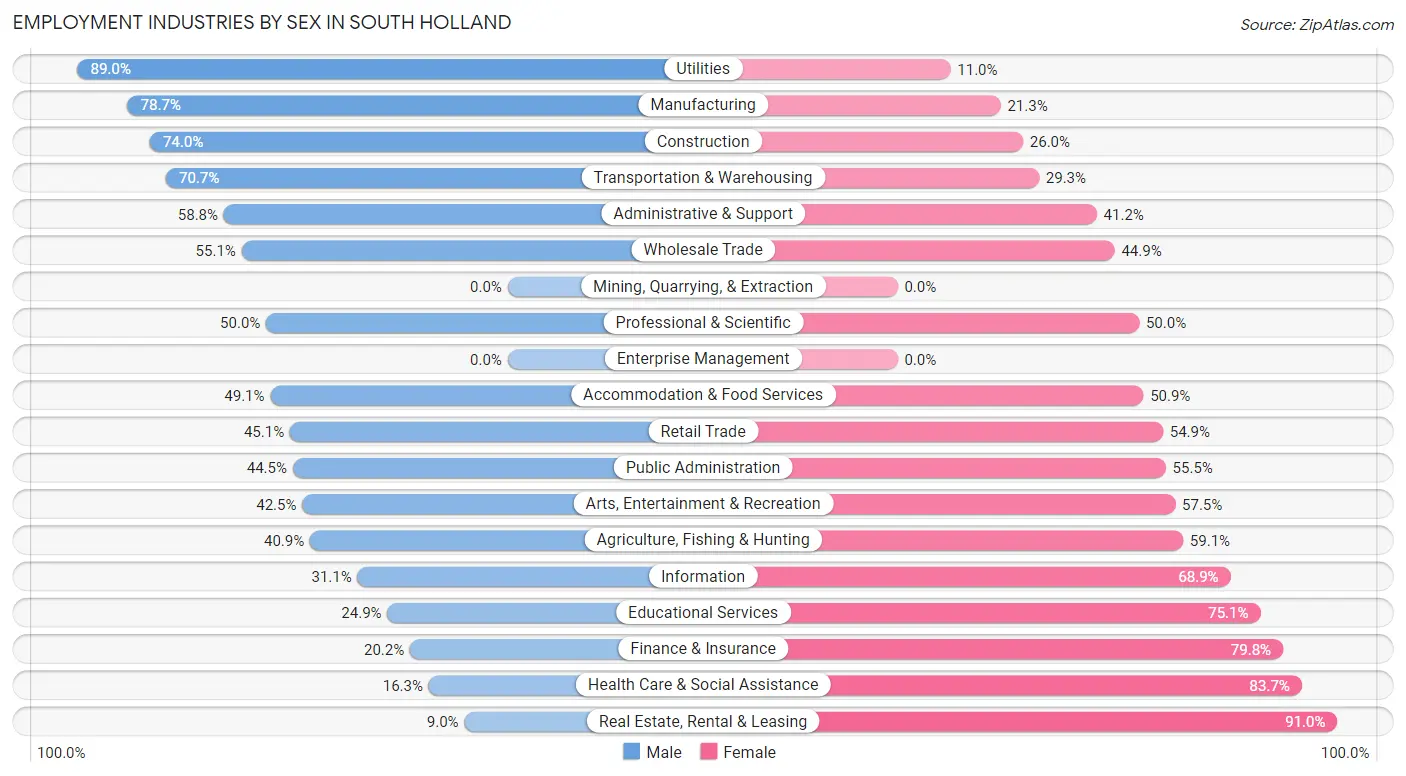
Employment Industries by Sex in South Holland
The South Holland industries that see more men than women are Utilities (89.0%), Manufacturing (78.7%), and Construction (74.0%), whereas the industries that tend to have a higher number of women are Real Estate, Rental & Leasing (91.0%), Health Care & Social Assistance (83.7%), and Finance & Insurance (79.8%).
| Industry | Male | Female |
| Agriculture, Fishing & Hunting | 9 (40.9%) | 13 (59.1%) |
| Mining, Quarrying, & Extraction | 0 (0.0%) | 0 (0.0%) |
| Construction | 154 (74.0%) | 54 (26.0%) |
| Manufacturing | 579 (78.7%) | 157 (21.3%) |
| Wholesale Trade | 114 (55.1%) | 93 (44.9%) |
| Retail Trade | 484 (45.1%) | 590 (54.9%) |
| Transportation & Warehousing | 850 (70.7%) | 352 (29.3%) |
| Utilities | 65 (89.0%) | 8 (11.0%) |
| Information | 46 (31.1%) | 102 (68.9%) |
| Finance & Insurance | 90 (20.2%) | 355 (79.8%) |
| Real Estate, Rental & Leasing | 18 (9.0%) | 183 (91.0%) |
| Professional & Scientific | 160 (50.0%) | 160 (50.0%) |
| Enterprise Management | 0 (0.0%) | 0 (0.0%) |
| Administrative & Support | 161 (58.8%) | 113 (41.2%) |
| Educational Services | 193 (24.9%) | 582 (75.1%) |
| Health Care & Social Assistance | 216 (16.3%) | 1,106 (83.7%) |
| Arts, Entertainment & Recreation | 54 (42.5%) | 73 (57.5%) |
| Accommodation & Food Services | 197 (49.1%) | 204 (50.9%) |
| Public Administration | 399 (44.5%) | 498 (55.5%) |
| Total | 3,882 (43.8%) | 4,986 (56.2%) |
Education in South Holland
School Enrollment in South Holland
The most common levels of schooling among the 5,841 students in South Holland are middle school (1,411 | 24.2%), high school (1,360 | 23.3%), and college / undergraduate (1,040 | 17.8%).
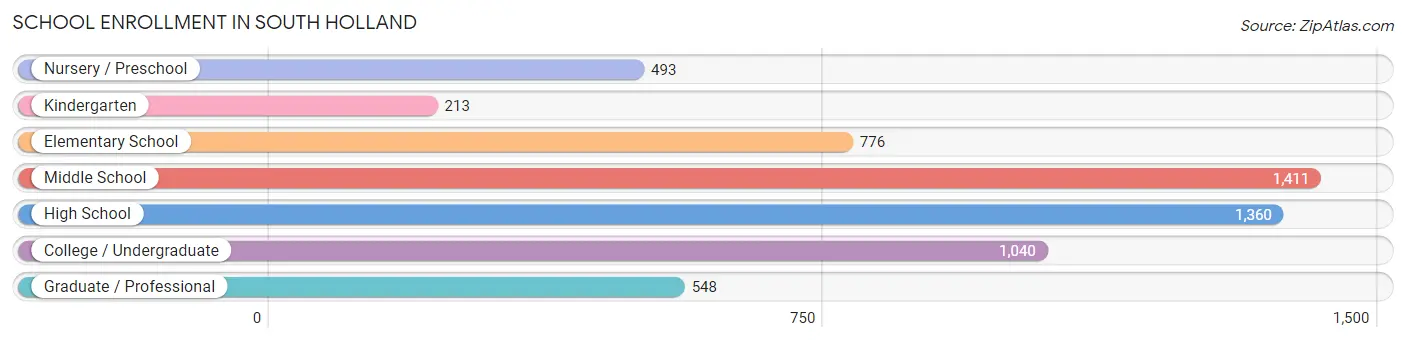
| School Level | # Students | % Students |
| Nursery / Preschool | 493 | 8.4% |
| Kindergarten | 213 | 3.6% |
| Elementary School | 776 | 13.3% |
| Middle School | 1,411 | 24.2% |
| High School | 1,360 | 23.3% |
| College / Undergraduate | 1,040 | 17.8% |
| Graduate / Professional | 548 | 9.4% |
| Total | 5,841 | 100.0% |
School Enrollment by Age by Funding Source in South Holland
Out of a total of 5,841 students who are enrolled in schools in South Holland, 900 (15.4%) attend a private institution, while the remaining 4,941 (84.6%) are enrolled in public schools. The age group of 25 to 34 year olds has the highest likelihood of being enrolled in private schools, with 217 (40.6% in the age bracket) enrolled. Conversely, the age group of 10 to 14 year olds has the lowest likelihood of being enrolled in a private school, with 1,565 (93.2% in the age bracket) attending a public institution.
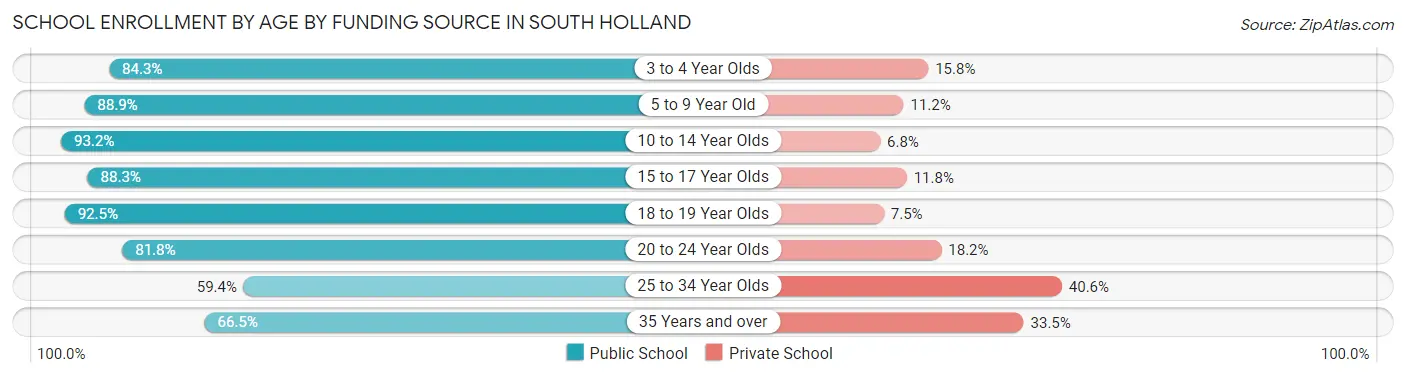
| Age Bracket | Public School | Private School |
| 3 to 4 Year Olds | 337 (84.3%) | 63 (15.8%) |
| 5 to 9 Year Old | 845 (88.8%) | 106 (11.2%) |
| 10 to 14 Year Olds | 1,565 (93.2%) | 114 (6.8%) |
| 15 to 17 Year Olds | 864 (88.2%) | 115 (11.7%) |
| 18 to 19 Year Olds | 297 (92.5%) | 24 (7.5%) |
| 20 to 24 Year Olds | 355 (81.8%) | 79 (18.2%) |
| 25 to 34 Year Olds | 317 (59.4%) | 217 (40.6%) |
| 35 Years and over | 361 (66.5%) | 182 (33.5%) |
| Total | 4,941 (84.6%) | 900 (15.4%) |
Educational Attainment by Field of Study in South Holland
Business (849 | 19.3%), arts & humanities (659 | 15.0%), education (546 | 12.4%), science & technology (423 | 9.6%), and social sciences (305 | 6.9%) are the most common fields of study among 4,395 individuals in South Holland who have obtained a bachelor's degree or higher.
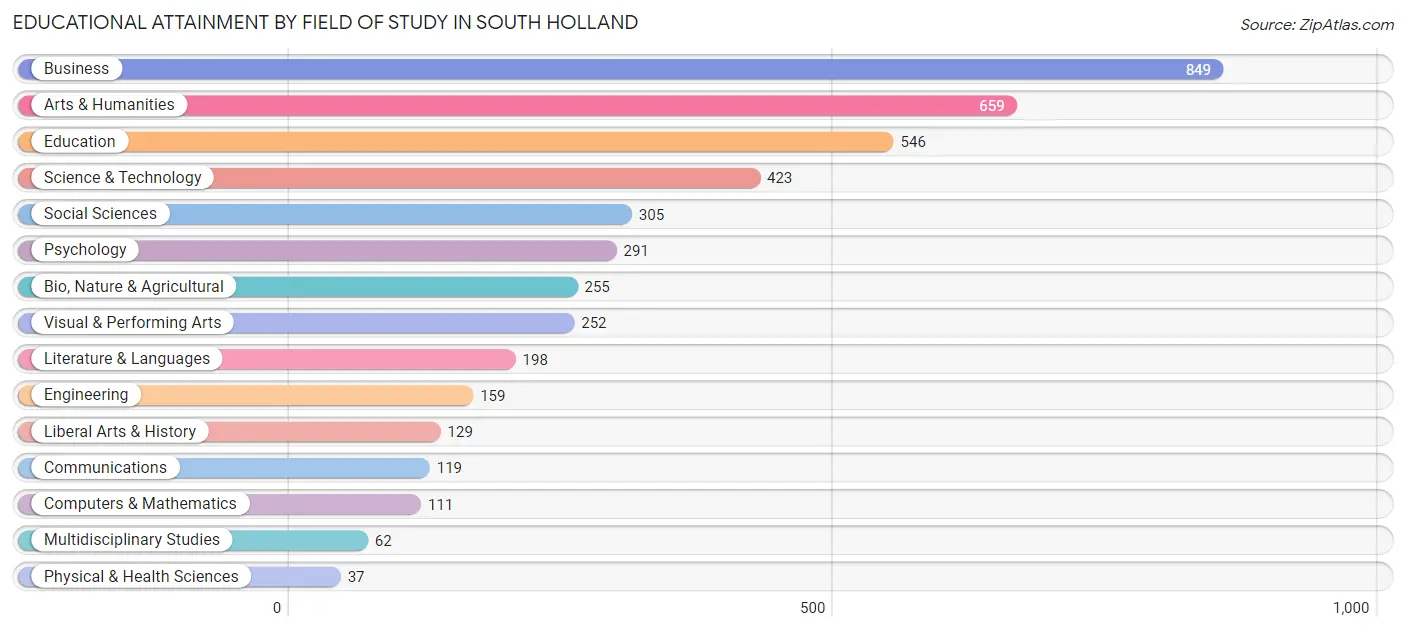
| Field of Study | # Graduates | % Graduates |
| Computers & Mathematics | 111 | 2.5% |
| Bio, Nature & Agricultural | 255 | 5.8% |
| Physical & Health Sciences | 37 | 0.8% |
| Psychology | 291 | 6.6% |
| Social Sciences | 305 | 6.9% |
| Engineering | 159 | 3.6% |
| Multidisciplinary Studies | 62 | 1.4% |
| Science & Technology | 423 | 9.6% |
| Business | 849 | 19.3% |
| Education | 546 | 12.4% |
| Literature & Languages | 198 | 4.5% |
| Liberal Arts & History | 129 | 2.9% |
| Visual & Performing Arts | 252 | 5.7% |
| Communications | 119 | 2.7% |
| Arts & Humanities | 659 | 15.0% |
| Total | 4,395 | 100.0% |
Transportation & Commute in South Holland
Vehicle Availability by Sex in South Holland
The most prevalent vehicle ownership categories in South Holland are males with 2 vehicles (1,503, accounting for 40.1%) and females with 2 vehicles (1,899, making up 32.0%).
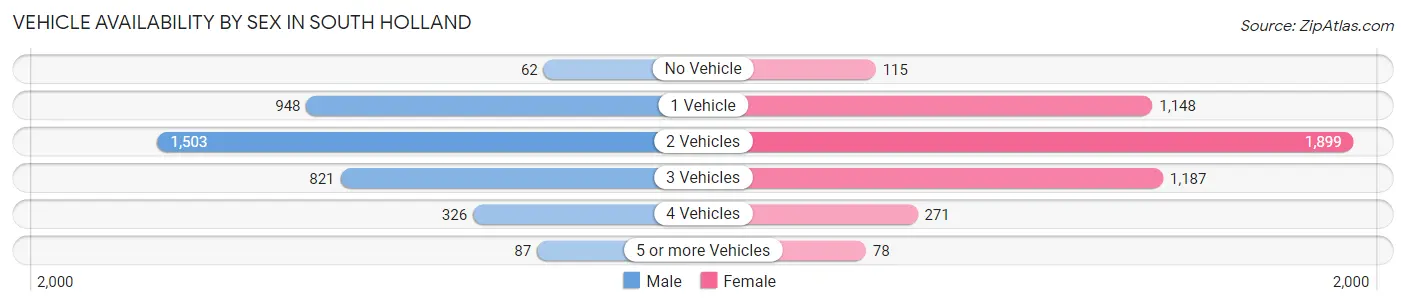
| Vehicles Available | Male | Female |
| No Vehicle | 62 (1.7%) | 115 (2.5%) |
| 1 Vehicle | 948 (25.3%) | 1,148 (24.4%) |
| 2 Vehicles | 1,503 (40.1%) | 1,899 (40.4%) |
| 3 Vehicles | 821 (21.9%) | 1,187 (25.3%) |
| 4 Vehicles | 326 (8.7%) | 271 (5.8%) |
| 5 or more Vehicles | 87 (2.3%) | 78 (1.7%) |
| Total | 3,747 (100.0%) | 4,698 (100.0%) |
Commute Time in South Holland
The most frequently occuring commute durations in South Holland are 60 to 89 minutes (1,222 commuters, 16.3%), 30 to 34 minutes (1,073 commuters, 14.3%), and 45 to 59 minutes (886 commuters, 11.8%).
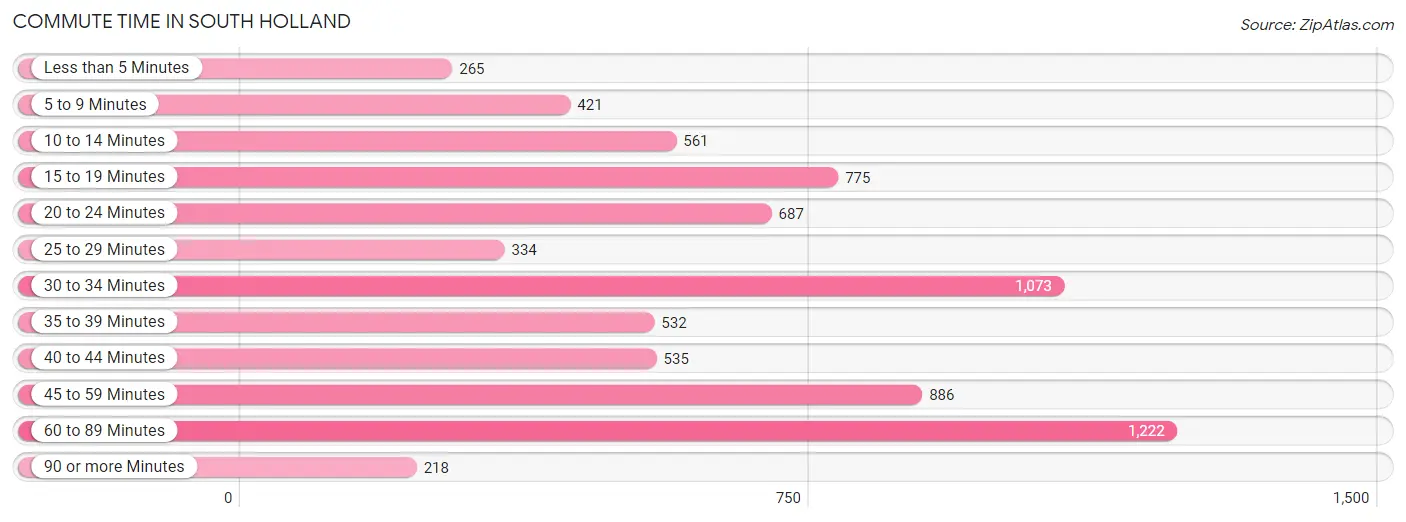
| Commute Time | # Commuters | % Commuters |
| Less than 5 Minutes | 265 | 3.5% |
| 5 to 9 Minutes | 421 | 5.6% |
| 10 to 14 Minutes | 561 | 7.5% |
| 15 to 19 Minutes | 775 | 10.3% |
| 20 to 24 Minutes | 687 | 9.1% |
| 25 to 29 Minutes | 334 | 4.4% |
| 30 to 34 Minutes | 1,073 | 14.3% |
| 35 to 39 Minutes | 532 | 7.1% |
| 40 to 44 Minutes | 535 | 7.1% |
| 45 to 59 Minutes | 886 | 11.8% |
| 60 to 89 Minutes | 1,222 | 16.3% |
| 90 or more Minutes | 218 | 2.9% |
Commute Time by Sex in South Holland
The most common commute times in South Holland are 30 to 34 minutes (621 commuters, 18.4%) for males and 60 to 89 minutes (794 commuters, 19.2%) for females.
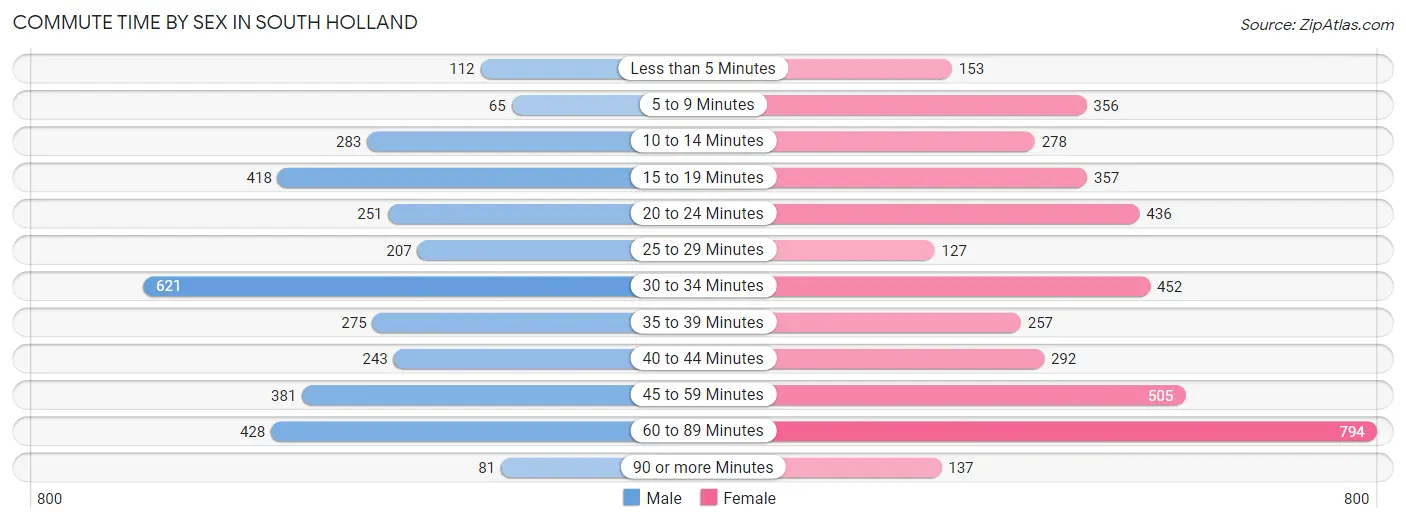
| Commute Time | Male | Female |
| Less than 5 Minutes | 112 (3.3%) | 153 (3.7%) |
| 5 to 9 Minutes | 65 (1.9%) | 356 (8.6%) |
| 10 to 14 Minutes | 283 (8.4%) | 278 (6.7%) |
| 15 to 19 Minutes | 418 (12.4%) | 357 (8.6%) |
| 20 to 24 Minutes | 251 (7.5%) | 436 (10.5%) |
| 25 to 29 Minutes | 207 (6.1%) | 127 (3.1%) |
| 30 to 34 Minutes | 621 (18.4%) | 452 (10.9%) |
| 35 to 39 Minutes | 275 (8.2%) | 257 (6.2%) |
| 40 to 44 Minutes | 243 (7.2%) | 292 (7.0%) |
| 45 to 59 Minutes | 381 (11.3%) | 505 (12.2%) |
| 60 to 89 Minutes | 428 (12.7%) | 794 (19.2%) |
| 90 or more Minutes | 81 (2.4%) | 137 (3.3%) |
Time of Departure to Work by Sex in South Holland
The most frequent times of departure to work in South Holland are 4:00 PM to 11:59 PM (501, 14.9%) for males and 7:00 AM to 7:29 AM (803, 19.4%) for females.
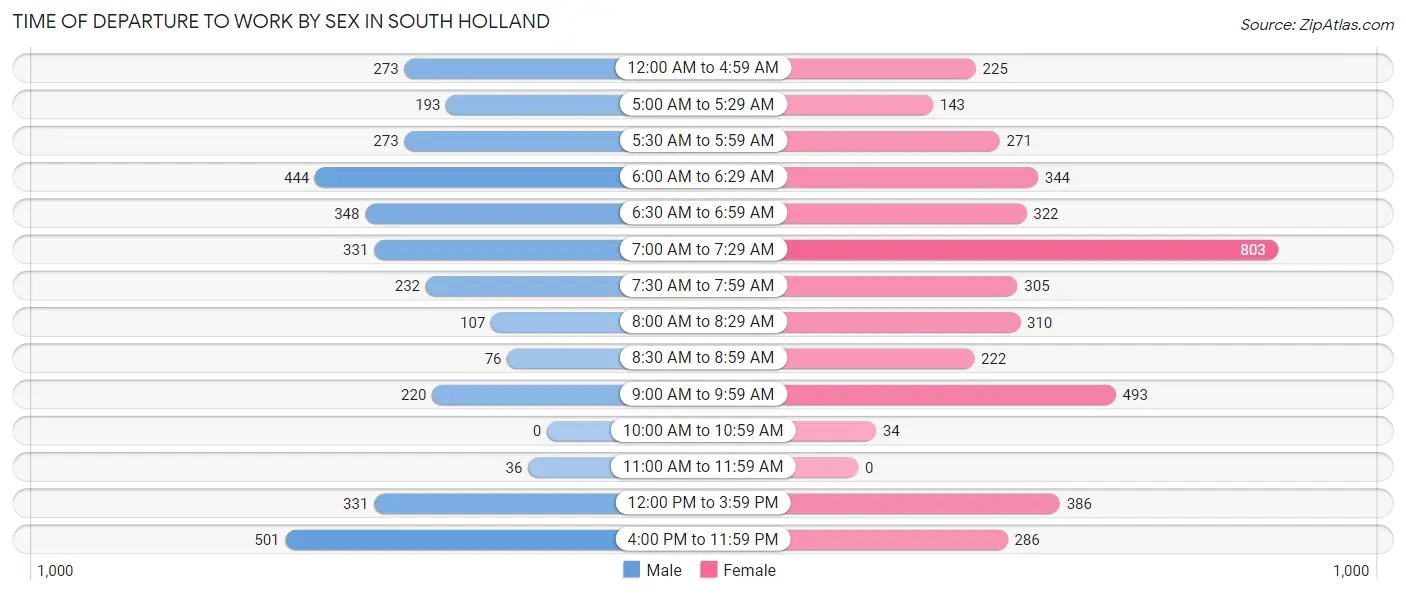
| Time of Departure | Male | Female |
| 12:00 AM to 4:59 AM | 273 (8.1%) | 225 (5.4%) |
| 5:00 AM to 5:29 AM | 193 (5.7%) | 143 (3.5%) |
| 5:30 AM to 5:59 AM | 273 (8.1%) | 271 (6.5%) |
| 6:00 AM to 6:29 AM | 444 (13.2%) | 344 (8.3%) |
| 6:30 AM to 6:59 AM | 348 (10.3%) | 322 (7.8%) |
| 7:00 AM to 7:29 AM | 331 (9.8%) | 803 (19.4%) |
| 7:30 AM to 7:59 AM | 232 (6.9%) | 305 (7.4%) |
| 8:00 AM to 8:29 AM | 107 (3.2%) | 310 (7.5%) |
| 8:30 AM to 8:59 AM | 76 (2.3%) | 222 (5.4%) |
| 9:00 AM to 9:59 AM | 220 (6.5%) | 493 (11.9%) |
| 10:00 AM to 10:59 AM | 0 (0.0%) | 34 (0.8%) |
| 11:00 AM to 11:59 AM | 36 (1.1%) | 0 (0.0%) |
| 12:00 PM to 3:59 PM | 331 (9.8%) | 386 (9.3%) |
| 4:00 PM to 11:59 PM | 501 (14.9%) | 286 (6.9%) |
| Total | 3,365 (100.0%) | 4,144 (100.0%) |
Housing Occupancy in South Holland
Occupancy by Ownership in South Holland
Of the total 7,638 dwellings in South Holland, owner-occupied units account for 6,335 (82.9%), while renter-occupied units make up 1,303 (17.1%).
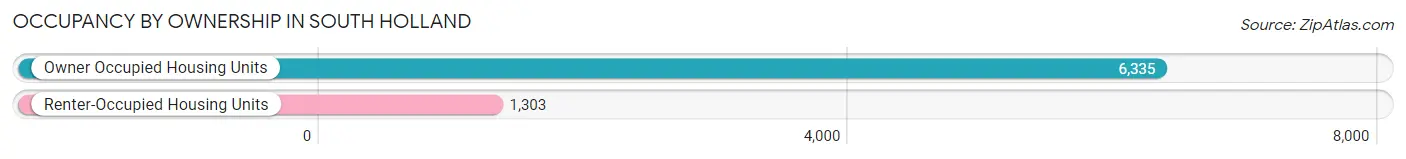
| Occupancy | # Housing Units | % Housing Units |
| Owner Occupied Housing Units | 6,335 | 82.9% |
| Renter-Occupied Housing Units | 1,303 | 17.1% |
| Total Occupied Housing Units | 7,638 | 100.0% |
Occupancy by Household Size in South Holland
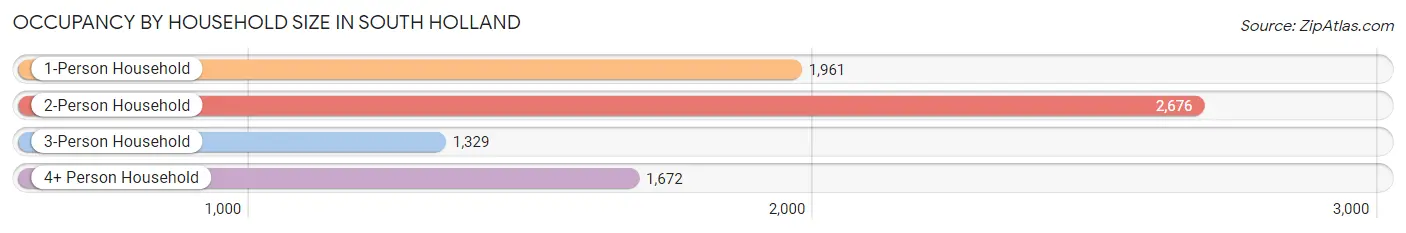
| Household Size | # Housing Units | % Housing Units |
| 1-Person Household | 1,961 | 25.7% |
| 2-Person Household | 2,676 | 35.0% |
| 3-Person Household | 1,329 | 17.4% |
| 4+ Person Household | 1,672 | 21.9% |
| Total Housing Units | 7,638 | 100.0% |
Occupancy by Ownership by Household Size in South Holland
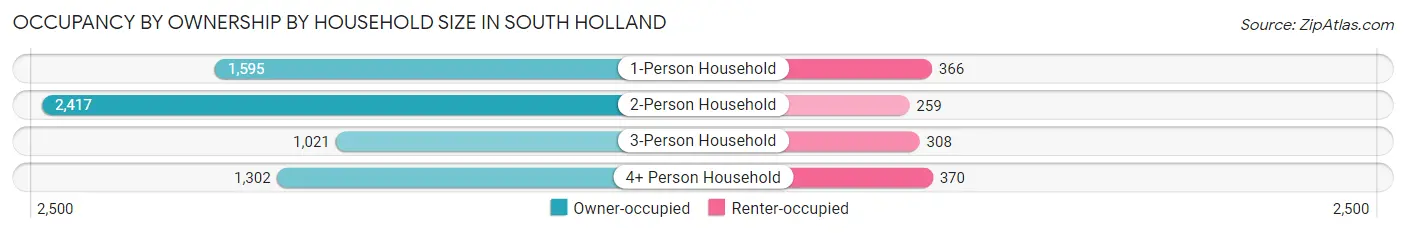
| Household Size | Owner-occupied | Renter-occupied |
| 1-Person Household | 1,595 (81.3%) | 366 (18.7%) |
| 2-Person Household | 2,417 (90.3%) | 259 (9.7%) |
| 3-Person Household | 1,021 (76.8%) | 308 (23.2%) |
| 4+ Person Household | 1,302 (77.9%) | 370 (22.1%) |
| Total Housing Units | 6,335 (82.9%) | 1,303 (17.1%) |
Occupancy by Educational Attainment in South Holland
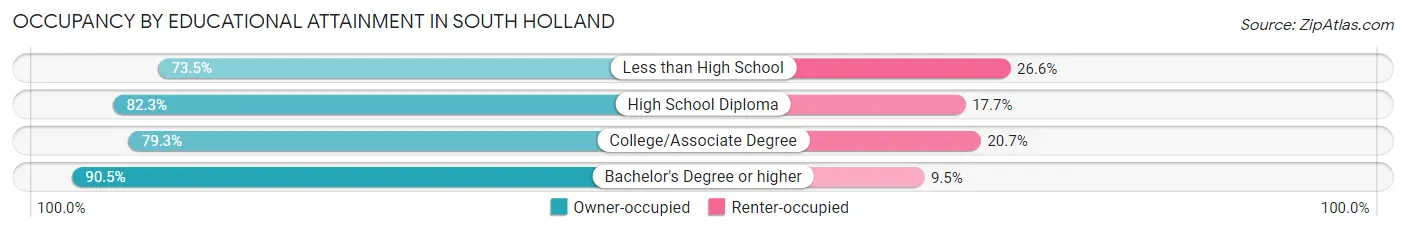
| Household Size | Owner-occupied | Renter-occupied |
| Less than High School | 404 (73.5%) | 146 (26.6%) |
| High School Diploma | 1,254 (82.3%) | 269 (17.7%) |
| College/Associate Degree | 2,554 (79.3%) | 666 (20.7%) |
| Bachelor's Degree or higher | 2,123 (90.5%) | 222 (9.5%) |
Occupancy by Age of Householder in South Holland
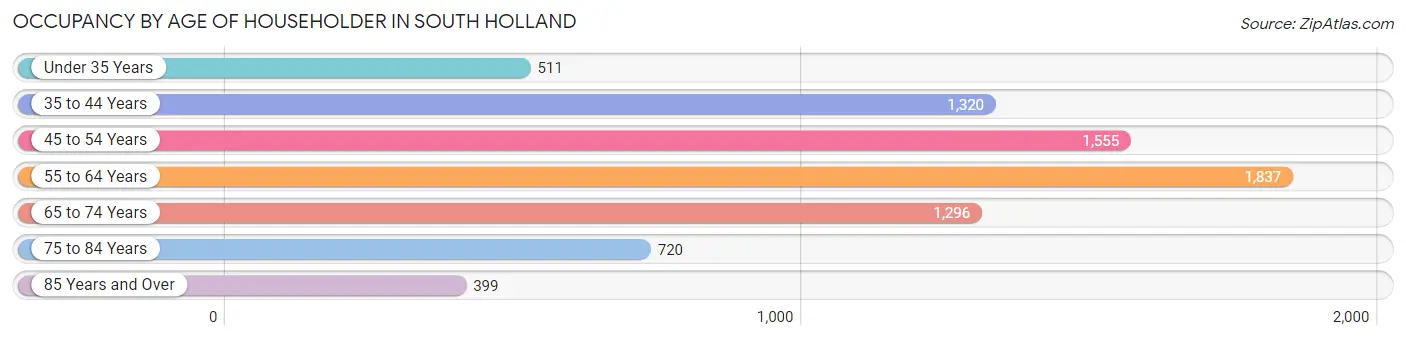
| Age Bracket | # Households | % Households |
| Under 35 Years | 511 | 6.7% |
| 35 to 44 Years | 1,320 | 17.3% |
| 45 to 54 Years | 1,555 | 20.4% |
| 55 to 64 Years | 1,837 | 24.0% |
| 65 to 74 Years | 1,296 | 17.0% |
| 75 to 84 Years | 720 | 9.4% |
| 85 Years and Over | 399 | 5.2% |
| Total | 7,638 | 100.0% |
Housing Finances in South Holland
Median Income by Occupancy in South Holland
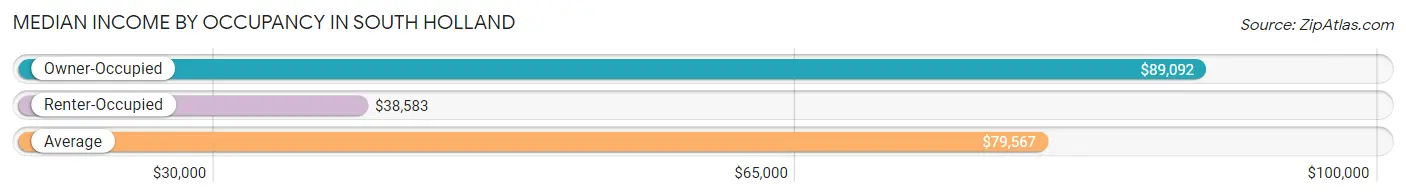
| Occupancy Type | # Households | Median Income |
| Owner-Occupied | 6,335 (82.9%) | $89,092 |
| Renter-Occupied | 1,303 (17.1%) | $38,583 |
| Average | 7,638 (100.0%) | $79,567 |
Occupancy by Householder Income Bracket in South Holland
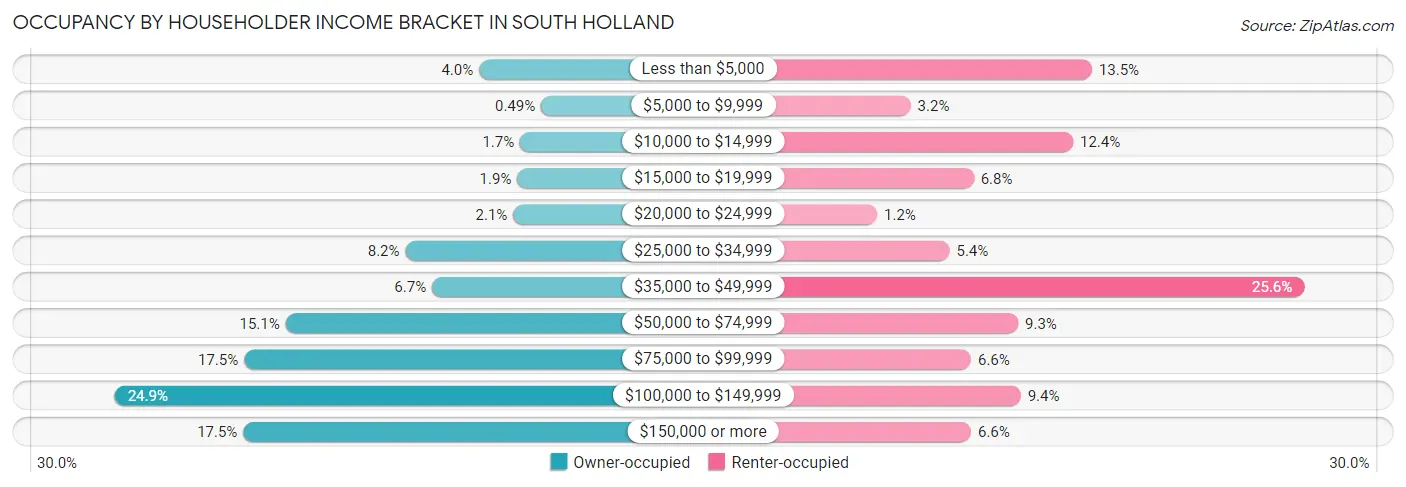
| Income Bracket | Owner-occupied | Renter-occupied |
| Less than $5,000 | 255 (4.0%) | 176 (13.5%) |
| $5,000 to $9,999 | 31 (0.5%) | 41 (3.2%) |
| $10,000 to $14,999 | 107 (1.7%) | 162 (12.4%) |
| $15,000 to $19,999 | 117 (1.8%) | 88 (6.8%) |
| $20,000 to $24,999 | 132 (2.1%) | 16 (1.2%) |
| $25,000 to $34,999 | 522 (8.2%) | 70 (5.4%) |
| $35,000 to $49,999 | 426 (6.7%) | 334 (25.6%) |
| $50,000 to $74,999 | 956 (15.1%) | 121 (9.3%) |
| $75,000 to $99,999 | 1,106 (17.5%) | 86 (6.6%) |
| $100,000 to $149,999 | 1,574 (24.8%) | 123 (9.4%) |
| $150,000 or more | 1,109 (17.5%) | 86 (6.6%) |
| Total | 6,335 (100.0%) | 1,303 (100.0%) |
Monthly Housing Cost Tiers in South Holland
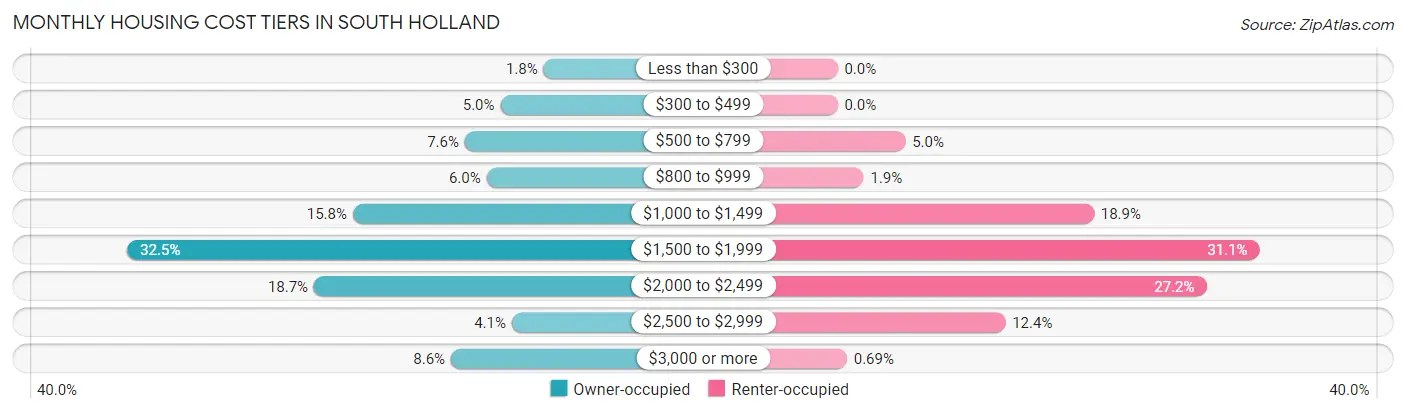
| Monthly Cost | Owner-occupied | Renter-occupied |
| Less than $300 | 113 (1.8%) | 0 (0.0%) |
| $300 to $499 | 314 (5.0%) | 0 (0.0%) |
| $500 to $799 | 480 (7.6%) | 65 (5.0%) |
| $800 to $999 | 379 (6.0%) | 25 (1.9%) |
| $1,000 to $1,499 | 1,003 (15.8%) | 246 (18.9%) |
| $1,500 to $1,999 | 2,056 (32.5%) | 405 (31.1%) |
| $2,000 to $2,499 | 1,184 (18.7%) | 354 (27.2%) |
| $2,500 to $2,999 | 261 (4.1%) | 161 (12.4%) |
| $3,000 or more | 545 (8.6%) | 9 (0.7%) |
| Total | 6,335 (100.0%) | 1,303 (100.0%) |
Physical Housing Characteristics in South Holland
Housing Structures in South Holland
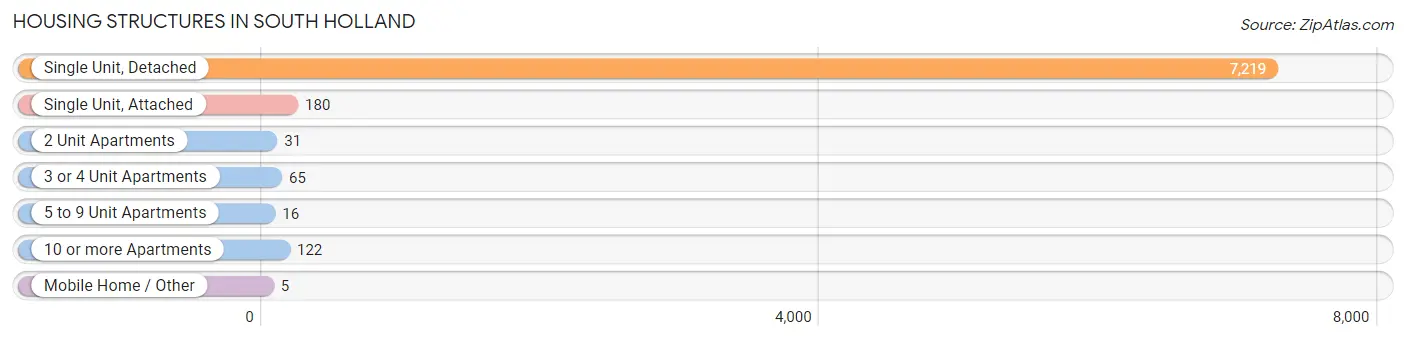
| Structure Type | # Housing Units | % Housing Units |
| Single Unit, Detached | 7,219 | 94.5% |
| Single Unit, Attached | 180 | 2.4% |
| 2 Unit Apartments | 31 | 0.4% |
| 3 or 4 Unit Apartments | 65 | 0.9% |
| 5 to 9 Unit Apartments | 16 | 0.2% |
| 10 or more Apartments | 122 | 1.6% |
| Mobile Home / Other | 5 | 0.1% |
| Total | 7,638 | 100.0% |
Housing Structures by Occupancy in South Holland
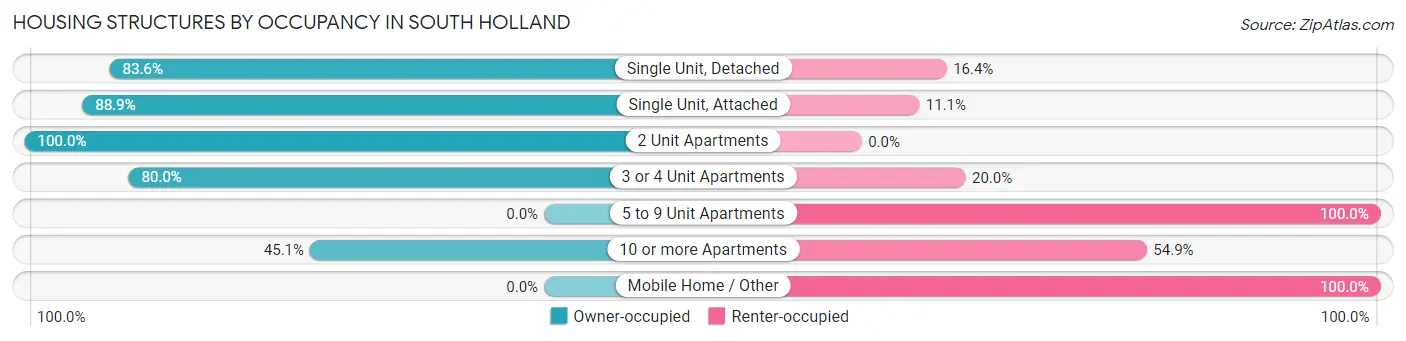
| Structure Type | Owner-occupied | Renter-occupied |
| Single Unit, Detached | 6,037 (83.6%) | 1,182 (16.4%) |
| Single Unit, Attached | 160 (88.9%) | 20 (11.1%) |
| 2 Unit Apartments | 31 (100.0%) | 0 (0.0%) |
| 3 or 4 Unit Apartments | 52 (80.0%) | 13 (20.0%) |
| 5 to 9 Unit Apartments | 0 (0.0%) | 16 (100.0%) |
| 10 or more Apartments | 55 (45.1%) | 67 (54.9%) |
| Mobile Home / Other | 0 (0.0%) | 5 (100.0%) |
| Total | 6,335 (82.9%) | 1,303 (17.1%) |
Housing Structures by Number of Rooms in South Holland
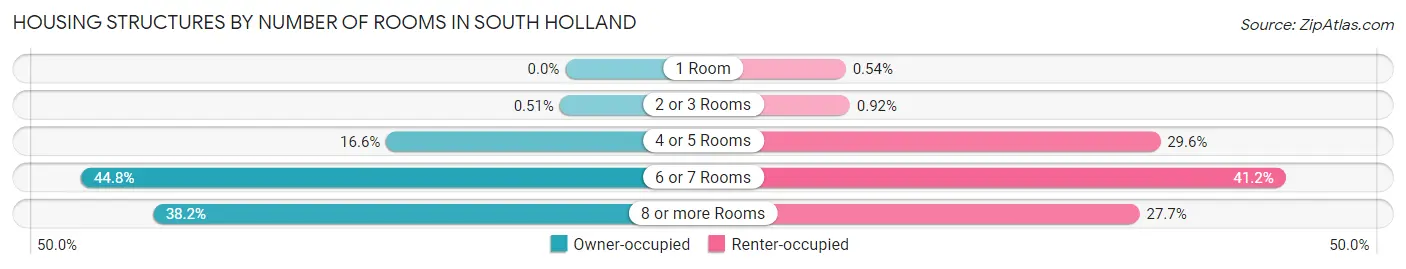
| Number of Rooms | Owner-occupied | Renter-occupied |
| 1 Room | 0 (0.0%) | 7 (0.5%) |
| 2 or 3 Rooms | 32 (0.5%) | 12 (0.9%) |
| 4 or 5 Rooms | 1,049 (16.6%) | 386 (29.6%) |
| 6 or 7 Rooms | 2,837 (44.8%) | 537 (41.2%) |
| 8 or more Rooms | 2,417 (38.2%) | 361 (27.7%) |
| Total | 6,335 (100.0%) | 1,303 (100.0%) |
Housing Structure by Heating Type in South Holland
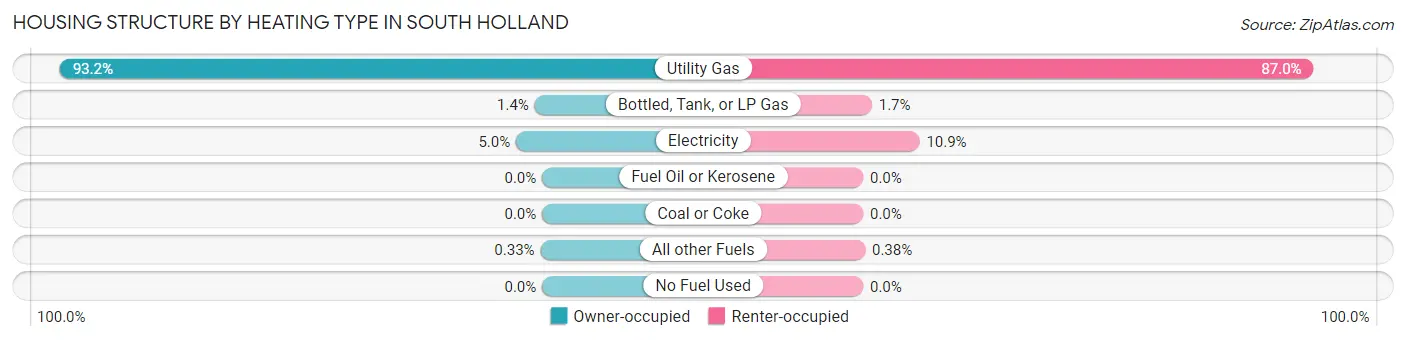
| Heating Type | Owner-occupied | Renter-occupied |
| Utility Gas | 5,904 (93.2%) | 1,134 (87.0%) |
| Bottled, Tank, or LP Gas | 91 (1.4%) | 22 (1.7%) |
| Electricity | 319 (5.0%) | 142 (10.9%) |
| Fuel Oil or Kerosene | 0 (0.0%) | 0 (0.0%) |
| Coal or Coke | 0 (0.0%) | 0 (0.0%) |
| All other Fuels | 21 (0.3%) | 5 (0.4%) |
| No Fuel Used | 0 (0.0%) | 0 (0.0%) |
| Total | 6,335 (100.0%) | 1,303 (100.0%) |
Household Vehicle Usage in South Holland
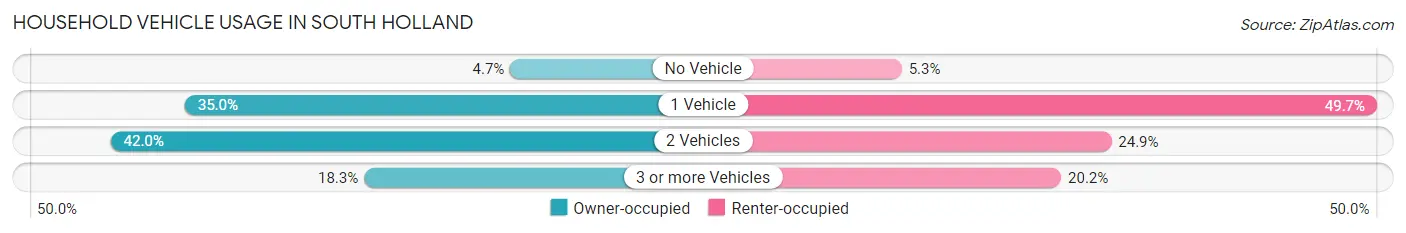
| Vehicles per Household | Owner-occupied | Renter-occupied |
| No Vehicle | 296 (4.7%) | 69 (5.3%) |
| 1 Vehicle | 2,220 (35.0%) | 647 (49.6%) |
| 2 Vehicles | 2,659 (42.0%) | 324 (24.9%) |
| 3 or more Vehicles | 1,160 (18.3%) | 263 (20.2%) |
| Total | 6,335 (100.0%) | 1,303 (100.0%) |
Real Estate & Mortgages in South Holland
Real Estate and Mortgage Overview in South Holland
| Characteristic | Without Mortgage | With Mortgage |
| Housing Units | 1,386 | 4,949 |
| Median Property Value | $166,900 | $187,000 |
| Median Household Income | $61,635 | $897 |
| Monthly Housing Costs | $737 | $545 |
| Real Estate Taxes | $4,760 | $53 |
Property Value by Mortgage Status in South Holland
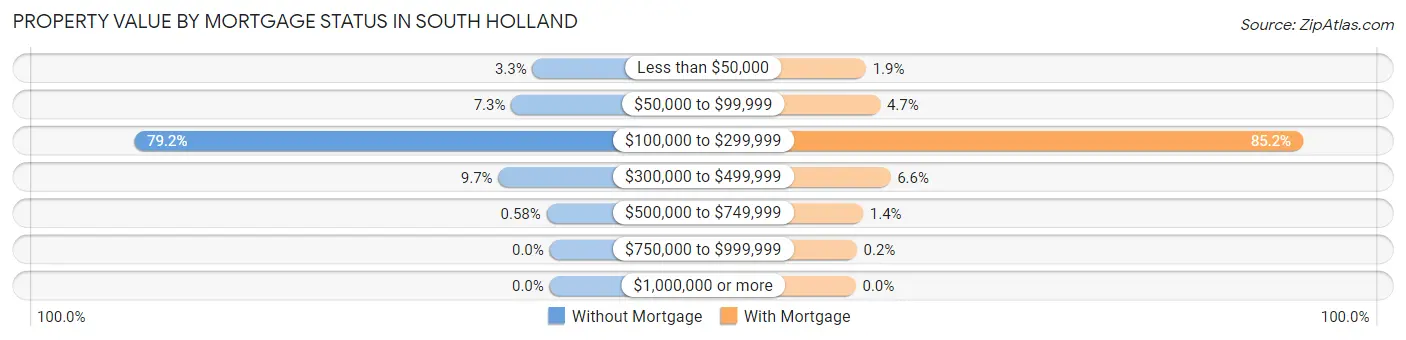
| Property Value | Without Mortgage | With Mortgage |
| Less than $50,000 | 45 (3.3%) | 96 (1.9%) |
| $50,000 to $99,999 | 101 (7.3%) | 230 (4.6%) |
| $100,000 to $299,999 | 1,097 (79.1%) | 4,217 (85.2%) |
| $300,000 to $499,999 | 135 (9.7%) | 327 (6.6%) |
| $500,000 to $749,999 | 8 (0.6%) | 69 (1.4%) |
| $750,000 to $999,999 | 0 (0.0%) | 10 (0.2%) |
| $1,000,000 or more | 0 (0.0%) | 0 (0.0%) |
| Total | 1,386 (100.0%) | 4,949 (100.0%) |
Household Income by Mortgage Status in South Holland
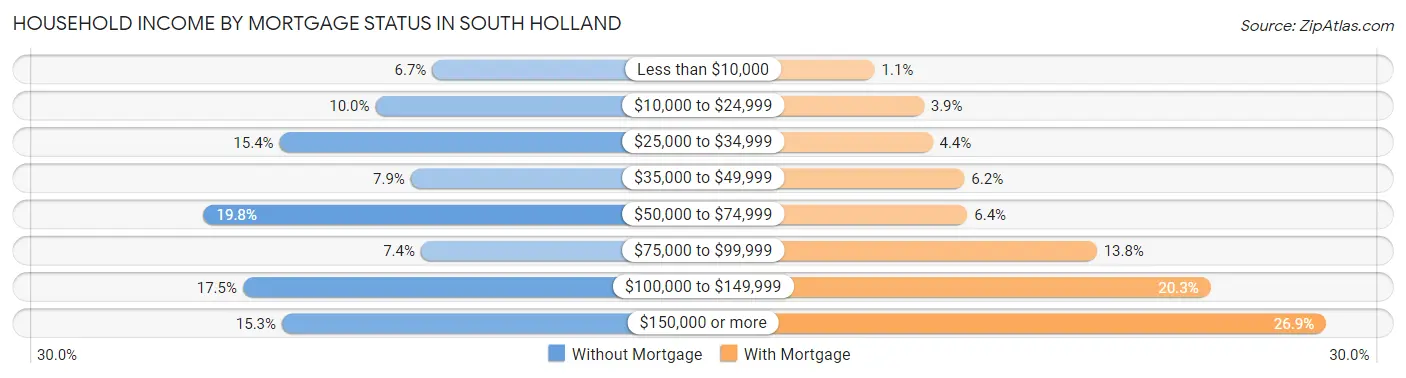
| Household Income | Without Mortgage | With Mortgage |
| Less than $10,000 | 93 (6.7%) | 54 (1.1%) |
| $10,000 to $24,999 | 138 (10.0%) | 193 (3.9%) |
| $25,000 to $34,999 | 214 (15.4%) | 218 (4.4%) |
| $35,000 to $49,999 | 110 (7.9%) | 308 (6.2%) |
| $50,000 to $74,999 | 274 (19.8%) | 316 (6.4%) |
| $75,000 to $99,999 | 102 (7.4%) | 682 (13.8%) |
| $100,000 to $149,999 | 243 (17.5%) | 1,004 (20.3%) |
| $150,000 or more | 212 (15.3%) | 1,331 (26.9%) |
| Total | 1,386 (100.0%) | 4,949 (100.0%) |
Property Value to Household Income Ratio in South Holland
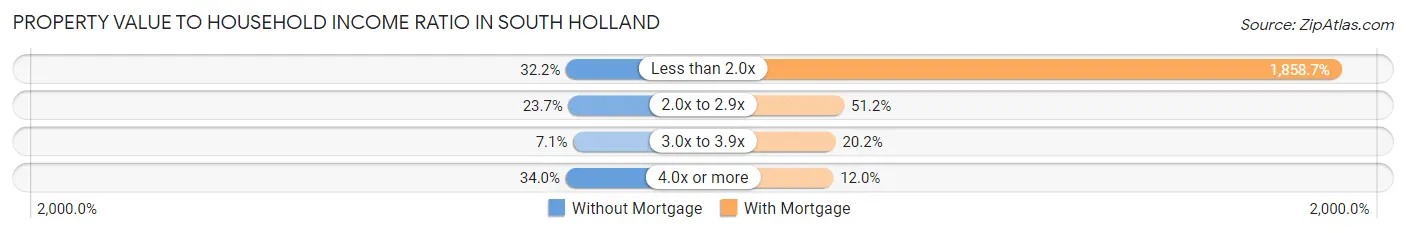
| Value-to-Income Ratio | Without Mortgage | With Mortgage |
| Less than 2.0x | 446 (32.2%) | 91,987 (1,858.7%) |
| 2.0x to 2.9x | 329 (23.7%) | 2,532 (51.2%) |
| 3.0x to 3.9x | 99 (7.1%) | 1,000 (20.2%) |
| 4.0x or more | 471 (34.0%) | 592 (12.0%) |
| Total | 1,386 (100.0%) | 4,949 (100.0%) |
Real Estate Taxes by Mortgage Status in South Holland
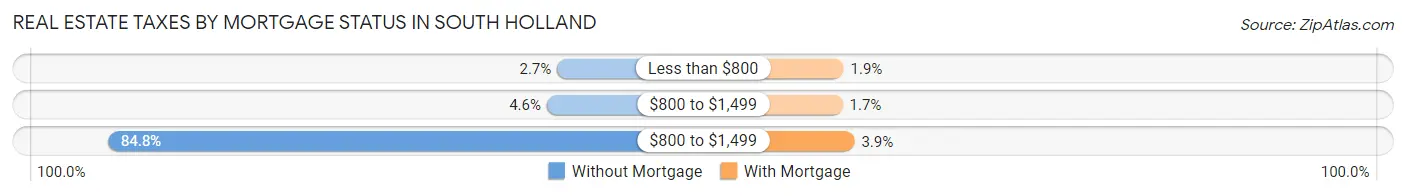
| Property Taxes | Without Mortgage | With Mortgage |
| Less than $800 | 38 (2.7%) | 95 (1.9%) |
| $800 to $1,499 | 64 (4.6%) | 86 (1.7%) |
| $800 to $1,499 | 1,175 (84.8%) | 194 (3.9%) |
| Total | 1,386 (100.0%) | 4,949 (100.0%) |
Health & Disability in South Holland
Health Insurance Coverage by Age in South Holland
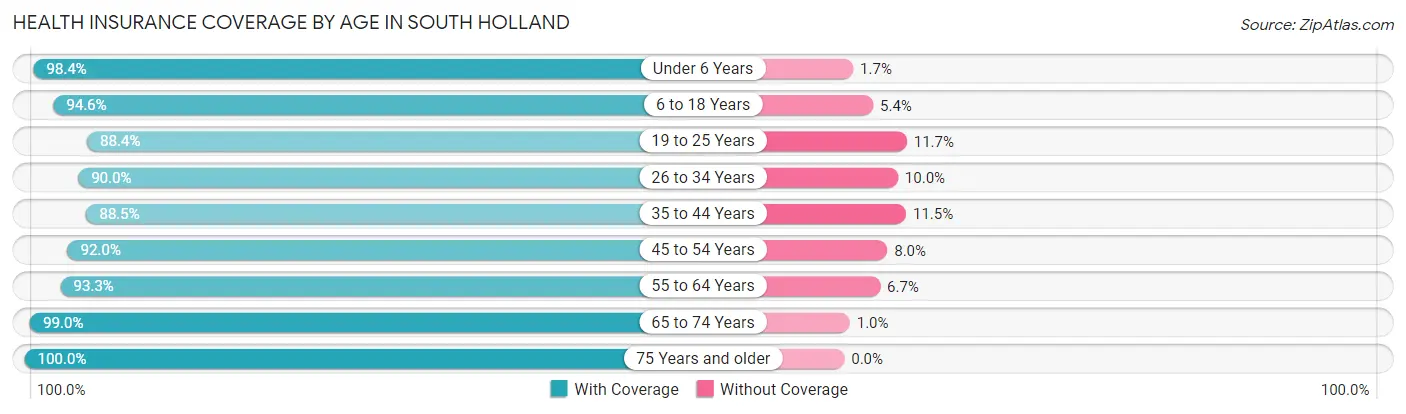
| Age Bracket | With Coverage | Without Coverage |
| Under 6 Years | 1,314 (98.4%) | 22 (1.7%) |
| 6 to 18 Years | 3,457 (94.6%) | 196 (5.4%) |
| 19 to 25 Years | 1,631 (88.3%) | 215 (11.7%) |
| 26 to 34 Years | 1,557 (90.0%) | 173 (10.0%) |
| 35 to 44 Years | 2,380 (88.5%) | 310 (11.5%) |
| 45 to 54 Years | 2,764 (92.0%) | 241 (8.0%) |
| 55 to 64 Years | 2,893 (93.3%) | 207 (6.7%) |
| 65 to 74 Years | 1,933 (99.0%) | 20 (1.0%) |
| 75 Years and older | 1,551 (100.0%) | 0 (0.0%) |
| Total | 19,480 (93.4%) | 1,384 (6.6%) |
Health Insurance Coverage by Citizenship Status in South Holland
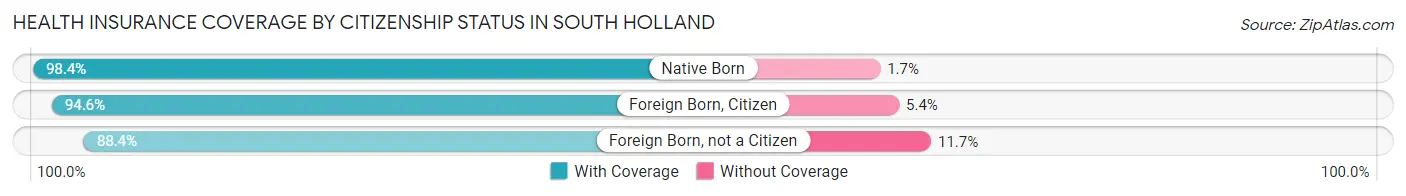
| Citizenship Status | With Coverage | Without Coverage |
| Native Born | 1,314 (98.4%) | 22 (1.7%) |
| Foreign Born, Citizen | 3,457 (94.6%) | 196 (5.4%) |
| Foreign Born, not a Citizen | 1,631 (88.3%) | 215 (11.7%) |
Health Insurance Coverage by Household Income in South Holland
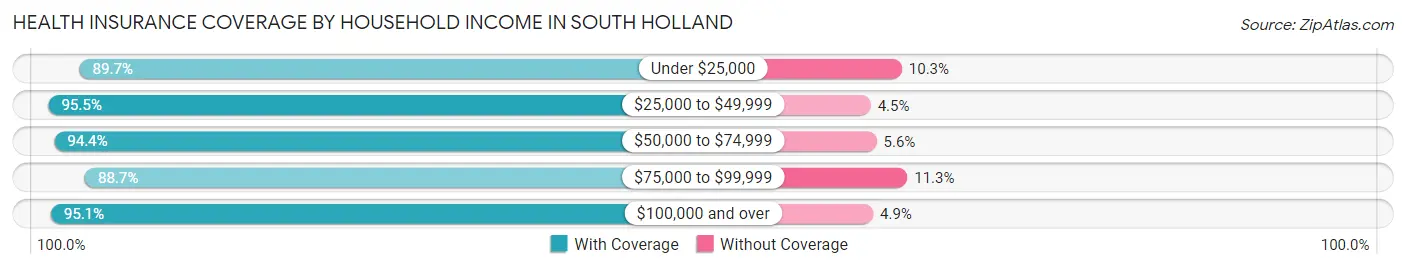
| Household Income | With Coverage | Without Coverage |
| Under $25,000 | 2,338 (89.7%) | 269 (10.3%) |
| $25,000 to $49,999 | 2,710 (95.5%) | 127 (4.5%) |
| $50,000 to $74,999 | 2,893 (94.4%) | 171 (5.6%) |
| $75,000 to $99,999 | 2,728 (88.7%) | 349 (11.3%) |
| $100,000 and over | 8,738 (95.1%) | 453 (4.9%) |
Public vs Private Health Insurance Coverage by Age in South Holland
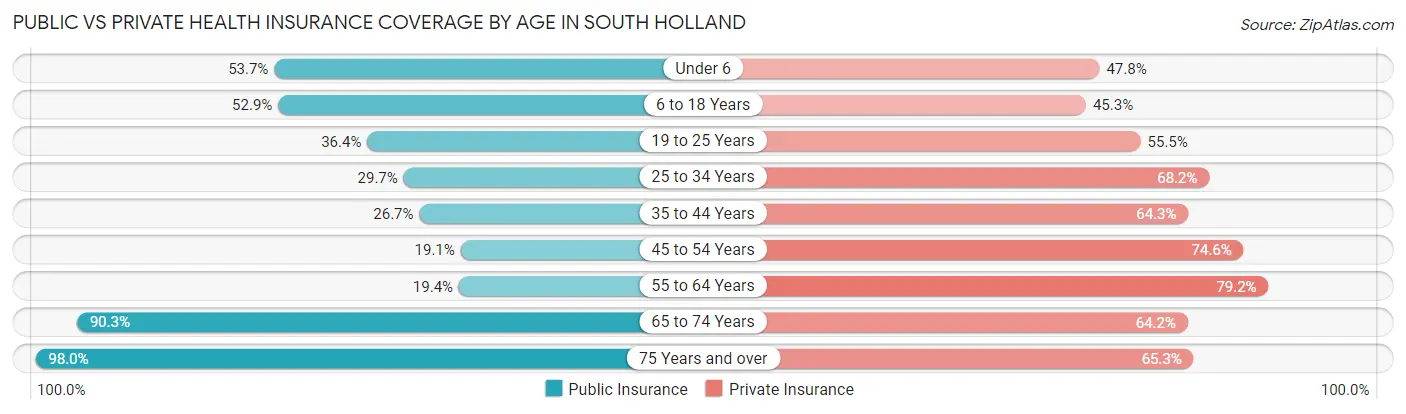
| Age Bracket | Public Insurance | Private Insurance |
| Under 6 | 717 (53.7%) | 639 (47.8%) |
| 6 to 18 Years | 1,934 (52.9%) | 1,656 (45.3%) |
| 19 to 25 Years | 672 (36.4%) | 1,024 (55.5%) |
| 25 to 34 Years | 513 (29.6%) | 1,180 (68.2%) |
| 35 to 44 Years | 719 (26.7%) | 1,730 (64.3%) |
| 45 to 54 Years | 573 (19.1%) | 2,241 (74.6%) |
| 55 to 64 Years | 601 (19.4%) | 2,455 (79.2%) |
| 65 to 74 Years | 1,764 (90.3%) | 1,254 (64.2%) |
| 75 Years and over | 1,520 (98.0%) | 1,013 (65.3%) |
| Total | 9,013 (43.2%) | 13,192 (63.2%) |
Disability Status by Sex by Age in South Holland
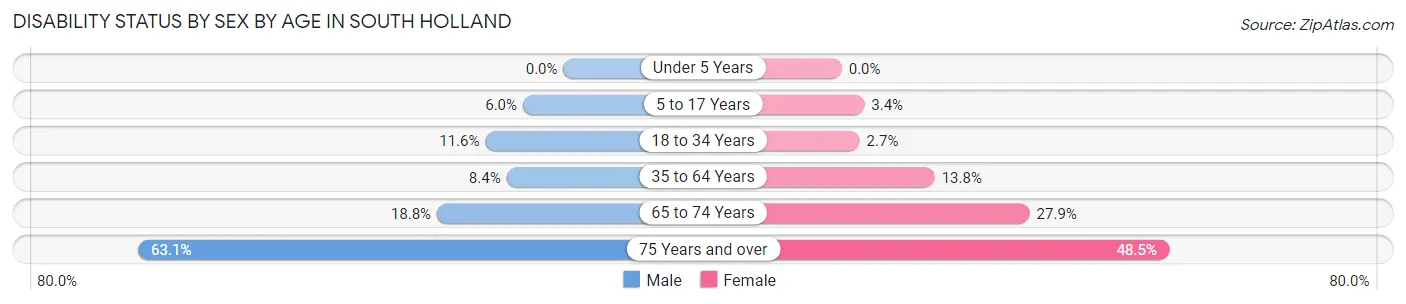
| Age Bracket | Male | Female |
| Under 5 Years | 0 (0.0%) | 0 (0.0%) |
| 5 to 17 Years | 105 (6.0%) | 65 (3.4%) |
| 18 to 34 Years | 206 (11.6%) | 55 (2.6%) |
| 35 to 64 Years | 324 (8.4%) | 684 (13.8%) |
| 65 to 74 Years | 156 (18.8%) | 313 (27.9%) |
| 75 Years and over | 524 (63.1%) | 350 (48.5%) |
Disability Class by Sex by Age in South Holland
Disability Class: Hearing Difficulty
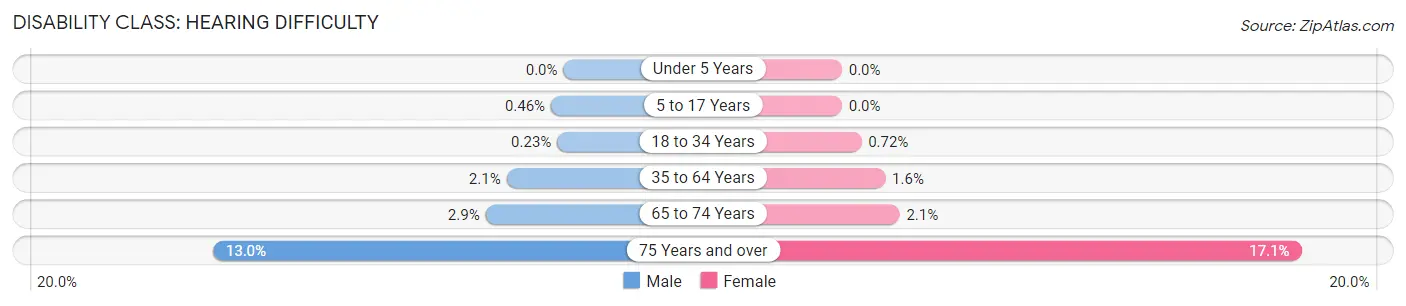
| Age Bracket | Male | Female |
| Under 5 Years | 0 (0.0%) | 0 (0.0%) |
| 5 to 17 Years | 8 (0.5%) | 0 (0.0%) |
| 18 to 34 Years | 4 (0.2%) | 15 (0.7%) |
| 35 to 64 Years | 81 (2.1%) | 80 (1.6%) |
| 65 to 74 Years | 24 (2.9%) | 24 (2.1%) |
| 75 Years and over | 108 (13.0%) | 123 (17.1%) |
Disability Class: Vision Difficulty
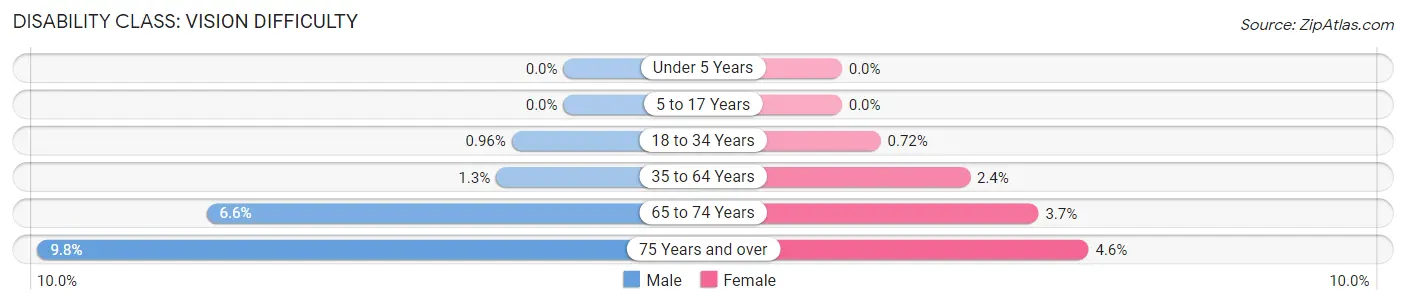
| Age Bracket | Male | Female |
| Under 5 Years | 0 (0.0%) | 0 (0.0%) |
| 5 to 17 Years | 0 (0.0%) | 0 (0.0%) |
| 18 to 34 Years | 17 (1.0%) | 15 (0.7%) |
| 35 to 64 Years | 48 (1.3%) | 118 (2.4%) |
| 65 to 74 Years | 55 (6.6%) | 41 (3.6%) |
| 75 Years and over | 81 (9.8%) | 33 (4.6%) |
Disability Class: Cognitive Difficulty
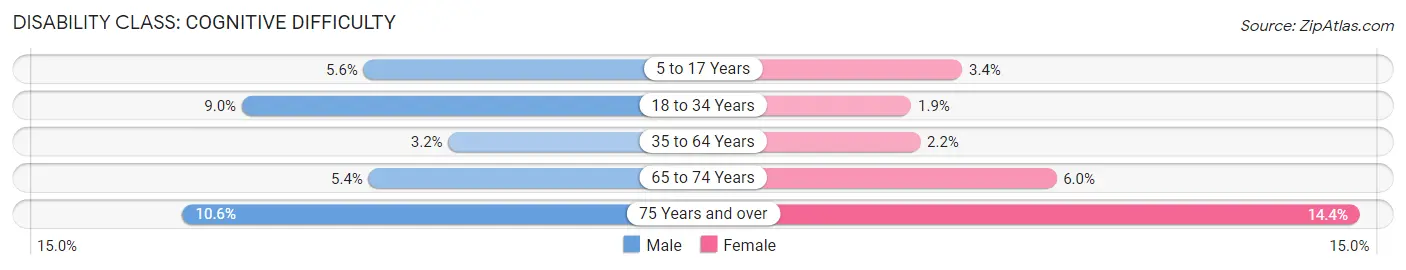
| Age Bracket | Male | Female |
| 5 to 17 Years | 97 (5.6%) | 65 (3.4%) |
| 18 to 34 Years | 159 (8.9%) | 40 (1.9%) |
| 35 to 64 Years | 123 (3.2%) | 108 (2.2%) |
| 65 to 74 Years | 45 (5.4%) | 67 (6.0%) |
| 75 Years and over | 88 (10.6%) | 104 (14.4%) |
Disability Class: Ambulatory Difficulty
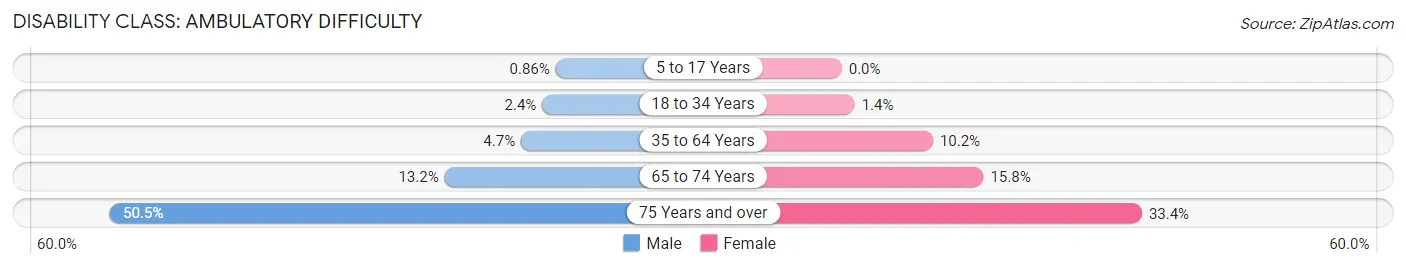
| Age Bracket | Male | Female |
| 5 to 17 Years | 15 (0.9%) | 0 (0.0%) |
| 18 to 34 Years | 42 (2.4%) | 30 (1.4%) |
| 35 to 64 Years | 181 (4.7%) | 503 (10.2%) |
| 65 to 74 Years | 110 (13.2%) | 177 (15.8%) |
| 75 Years and over | 419 (50.5%) | 241 (33.4%) |
Disability Class: Self-Care Difficulty
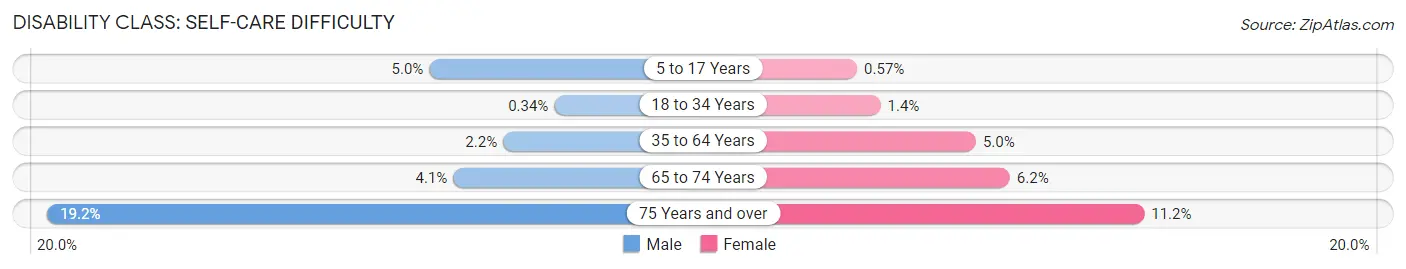
| Age Bracket | Male | Female |
| 5 to 17 Years | 87 (5.0%) | 11 (0.6%) |
| 18 to 34 Years | 6 (0.3%) | 30 (1.4%) |
| 35 to 64 Years | 86 (2.2%) | 247 (5.0%) |
| 65 to 74 Years | 34 (4.1%) | 70 (6.2%) |
| 75 Years and over | 159 (19.2%) | 81 (11.2%) |
Technology Access in South Holland
Computing Device Access in South Holland
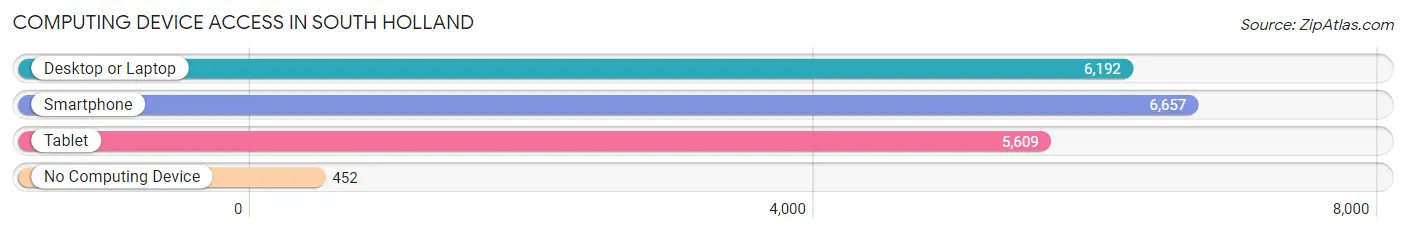
| Device Type | # Households | % Households |
| Desktop or Laptop | 6,192 | 81.1% |
| Smartphone | 6,657 | 87.2% |
| Tablet | 5,609 | 73.4% |
| No Computing Device | 452 | 5.9% |
| Total | 7,638 | 100.0% |
Internet Access in South Holland
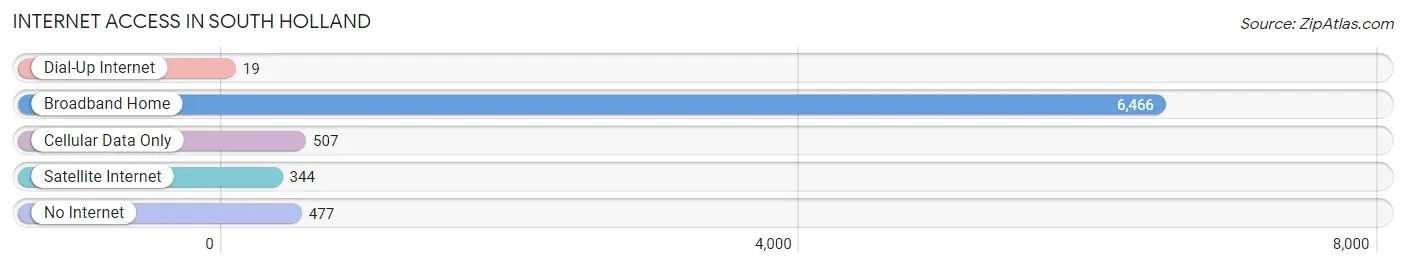
| Internet Type | # Households | % Households |
| Dial-Up Internet | 19 | 0.3% |
| Broadband Home | 6,466 | 84.7% |
| Cellular Data Only | 507 | 6.6% |
| Satellite Internet | 344 | 4.5% |
| No Internet | 477 | 6.2% |
| Total | 7,638 | 100.0% |
South Holland Summary
History
South Holland, Illinois is a village located in Cook County, Illinois, United States. It is a suburb of Chicago and is part of the Chicago metropolitan area. The village was founded in 1894 by Dutch immigrants who were looking for a place to settle and practice their faith. The village was named after the Dutch province of South Holland.
The village was originally a farming community, but it has since grown into a residential and industrial center. The village has a long history of Dutch culture and traditions, which are still celebrated today. The village is home to the Dutch Heritage Museum, which showcases the history and culture of the Dutch settlers.
The village has a rich history of industry and commerce. In the early 1900s, the village was home to several factories, including a brickyard, a canning factory, and a furniture factory. The village also had a thriving dairy industry, which provided milk and other dairy products to the surrounding area.
The village has also been home to several notable people, including former Chicago Bears coach Mike Ditka, former Chicago Bulls coach Phil Jackson, and former Chicago Cubs manager Joe Maddon.
Geography
South Holland is located in Cook County, Illinois, United States. It is a suburb of Chicago and is part of the Chicago metropolitan area. The village is situated on the banks of the Calumet River, which flows through the village. The village is bordered by the cities of Calumet City, Lansing, and Thornton.
The village has a total area of 4.2 square miles, all of which is land. The village is located in the Calumet region of the Chicago metropolitan area. The village is located in the Central Time Zone and observes Daylight Saving Time.
Economy
South Holland is a residential and industrial center. The village has a thriving business community, with several large companies located in the village. The village is home to several manufacturing companies, including a steel mill, a plastics factory, and a printing company. The village also has a large retail sector, with several shopping centers and stores located in the village.
The village is also home to several educational institutions, including South Suburban College and Trinity Christian College. The village is served by the South Holland Public Library, which provides access to books, magazines, and other media.
Demographics
As of the 2010 census, the village had a population of 22,030. The population density was 5,220 people per square mile. The racial makeup of the village was 79.2% White, 11.3% African American, 0.3% Native American, 1.2% Asian, 0.1% Pacific Islander, 5.2% from other races, and 2.9% from two or more races. Hispanic or Latino of any race were 11.7% of the population.
The median income for a household in the village was $50,945, and the median income for a family was $60,945. The per capita income for the village was $22,945. About 6.2% of families and 8.2% of the population were below the poverty line, including 10.2% of those under age 18 and 6.2% of those age 65 or over.
Common Questions
What is Per Capita Income in South Holland?
Per Capita income in South Holland is $32,999.
What is the Median Family Income in South Holland?
Median Family Income in South Holland is $89,587.
What is the Median Household income in South Holland?
Median Household Income in South Holland is $79,567.
What is Income or Wage Gap in South Holland?
Income or Wage Gap in South Holland is 31.2%.
Women in South Holland earn 68.8 cents for every dollar earned by a man.
What is Family Income Deficit in South Holland?
Family Income Deficit in South Holland is $16,619.
Families that are below poverty line in South Holland earn $16,619 less on average than the poverty threshold level.
What is Inequality or Gini Index in South Holland?
Inequality or Gini Index in South Holland is 0.40.
What is the Total Population of South Holland?
Total Population of South Holland is 21,287.
What is the Total Male Population of South Holland?
Total Male Population of South Holland is 9,766.
What is the Total Female Population of South Holland?
Total Female Population of South Holland is 11,521.
What is the Ratio of Males per 100 Females in South Holland?
There are 84.77 Males per 100 Females in South Holland.
What is the Ratio of Females per 100 Males in South Holland?
There are 117.97 Females per 100 Males in South Holland.
What is the Median Population Age in South Holland?
Median Population Age in South Holland is 42.6 Years.
What is the Average Family Size in South Holland
Average Family Size in South Holland is 3.3 People.
What is the Average Household Size in South Holland
Average Household Size in South Holland is 2.7 People.
How Large is the Labor Force in South Holland?
There are 10,332 People in the Labor Forcein in South Holland.
What is the Percentage of People in the Labor Force in South Holland?
60.2% of People are in the Labor Force in South Holland.
What is the Unemployment Rate in South Holland?
Unemployment Rate in South Holland is 14.1%.