Chicago Heights, IL Map & Demographics
Chicago Heights Map
Chicago Heights Overview
$26,041
PER CAPITA INCOME
$66,142
AVG FAMILY INCOME
$56,755
AVG HOUSEHOLD INCOME
23.3%
WAGE / INCOME GAP [ % ]
76.7¢/ $1
WAGE / INCOME GAP [ $ ]
$13,463
FAMILY INCOME DEFICIT
0.47
INEQUALITY / GINI INDEX
27,366
TOTAL POPULATION
13,108
MALE POPULATION
14,258
FEMALE POPULATION
91.93
MALES / 100 FEMALES
108.77
FEMALES / 100 MALES
35.8
MEDIAN AGE
3.6
AVG FAMILY SIZE
2.9
AVG HOUSEHOLD SIZE
12,685
LABOR FORCE [ PEOPLE ]
60.1%
PERCENT IN LABOR FORCE
13.8%
UNEMPLOYMENT RATE
Chicago Heights Zip Codes
Chicago Heights Area Codes
Income in Chicago Heights
Income Overview in Chicago Heights
Per Capita Income in Chicago Heights is $26,041, while median incomes of families and households are $66,142 and $56,755 respectively.
| Characteristic | Number | Measure |
| Per Capita Income | 27,366 | $26,041 |
| Median Family Income | 6,255 | $66,142 |
| Mean Family Income | 6,255 | $84,214 |
| Median Household Income | 9,186 | $56,755 |
| Mean Household Income | 9,186 | $74,226 |
| Income Deficit | 6,255 | $13,463 |
| Wage / Income Gap (%) | 27,366 | 23.34% |
| Wage / Income Gap ($) | 27,366 | 76.66¢ per $1 |
| Gini / Inequality Index | 27,366 | 0.47 |
Earnings by Sex in Chicago Heights
Average Earnings in Chicago Heights are $35,929, $40,889 for men and $31,347 for women, a difference of 23.3%.

| Sex | Number | Average Earnings |
| Male | 6,586 (53.6%) | $40,889 |
| Female | 5,702 (46.4%) | $31,347 |
| Total | 12,288 (100.0%) | $35,929 |
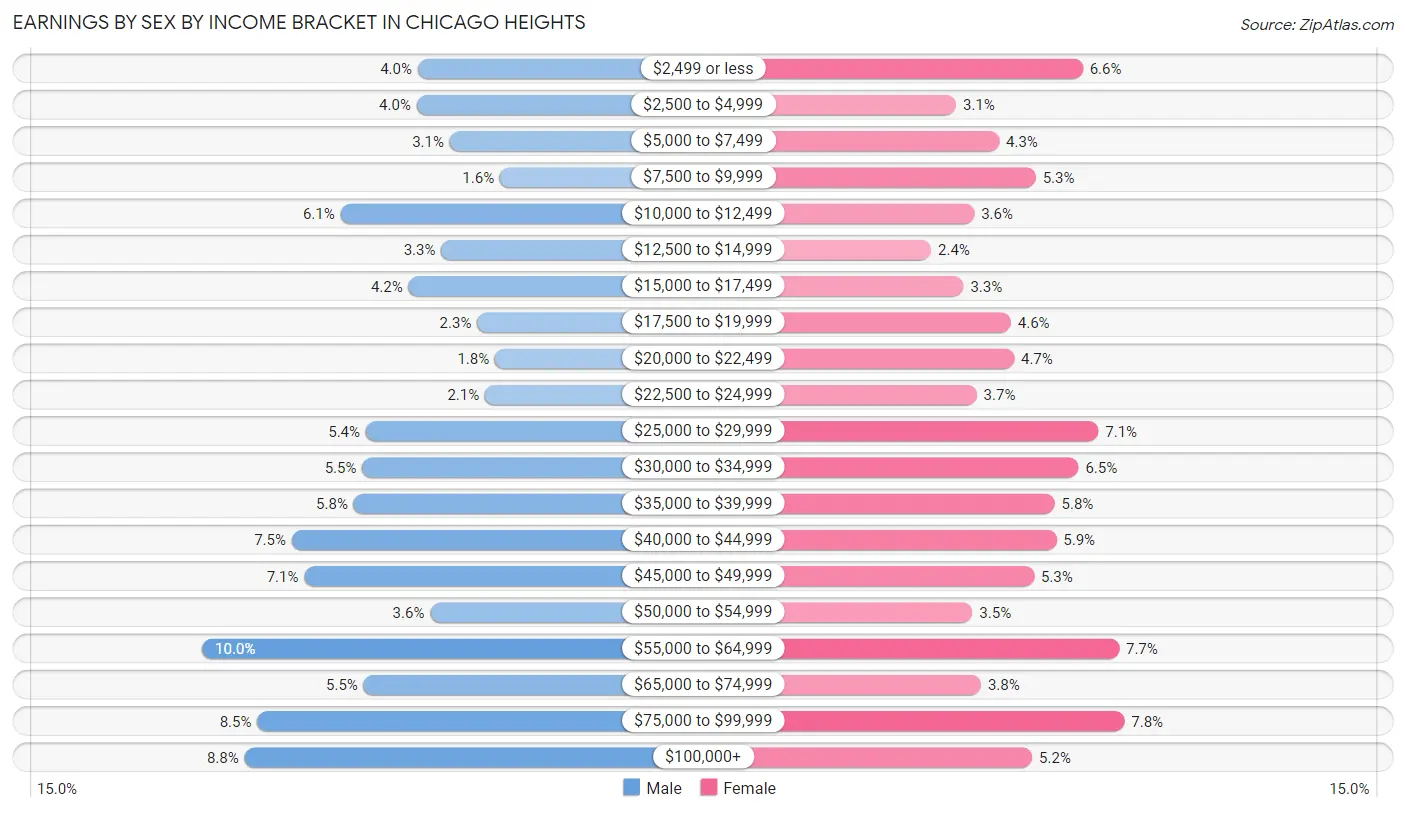
Earnings by Sex by Income Bracket in Chicago Heights
The most common earnings brackets in Chicago Heights are $55,000 to $64,999 for men (659 | 10.0%) and $75,000 to $99,999 for women (445 | 7.8%).
| Income | Male | Female |
| $2,499 or less | 260 (4.0%) | 378 (6.6%) |
| $2,500 to $4,999 | 262 (4.0%) | 175 (3.1%) |
| $5,000 to $7,499 | 201 (3.0%) | 244 (4.3%) |
| $7,500 to $9,999 | 108 (1.6%) | 303 (5.3%) |
| $10,000 to $12,499 | 403 (6.1%) | 204 (3.6%) |
| $12,500 to $14,999 | 217 (3.3%) | 135 (2.4%) |
| $15,000 to $17,499 | 277 (4.2%) | 187 (3.3%) |
| $17,500 to $19,999 | 150 (2.3%) | 263 (4.6%) |
| $20,000 to $22,499 | 117 (1.8%) | 268 (4.7%) |
| $22,500 to $24,999 | 136 (2.1%) | 208 (3.6%) |
| $25,000 to $29,999 | 356 (5.4%) | 403 (7.1%) |
| $30,000 to $34,999 | 363 (5.5%) | 371 (6.5%) |
| $35,000 to $39,999 | 379 (5.8%) | 333 (5.8%) |
| $40,000 to $44,999 | 493 (7.5%) | 336 (5.9%) |
| $45,000 to $49,999 | 470 (7.1%) | 300 (5.3%) |
| $50,000 to $54,999 | 237 (3.6%) | 201 (3.5%) |
| $55,000 to $64,999 | 659 (10.0%) | 436 (7.6%) |
| $65,000 to $74,999 | 360 (5.5%) | 215 (3.8%) |
| $75,000 to $99,999 | 557 (8.5%) | 445 (7.8%) |
| $100,000+ | 581 (8.8%) | 297 (5.2%) |
| Total | 6,586 (100.0%) | 5,702 (100.0%) |
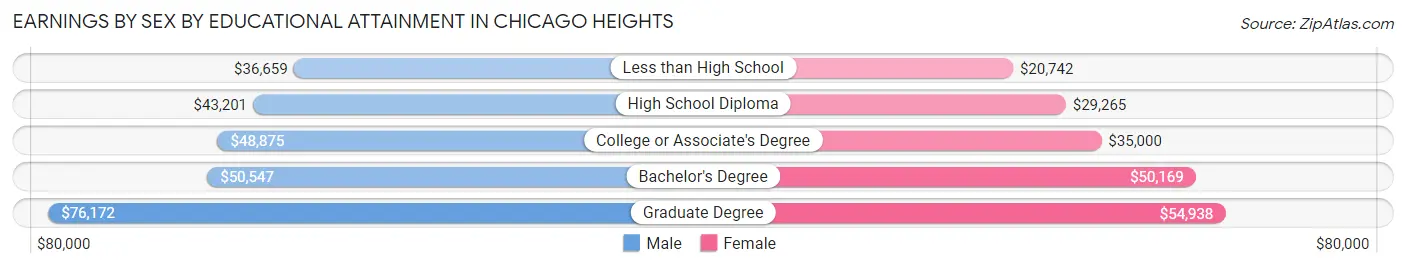
Earnings by Sex by Educational Attainment in Chicago Heights
Average earnings in Chicago Heights are $44,895 for men and $36,091 for women, a difference of 19.6%. Men with an educational attainment of graduate degree enjoy the highest average annual earnings of $76,172, while those with less than high school education earn the least with $36,659. Women with an educational attainment of graduate degree earn the most with the average annual earnings of $54,938, while those with less than high school education have the smallest earnings of $20,742.
| Educational Attainment | Male Income | Female Income |
| Less than High School | $36,659 | $20,742 |
| High School Diploma | $43,201 | $29,265 |
| College or Associate's Degree | $48,875 | $35,000 |
| Bachelor's Degree | $50,547 | $50,169 |
| Graduate Degree | $76,172 | $54,938 |
| Total | $44,895 | $36,091 |
Family Income in Chicago Heights
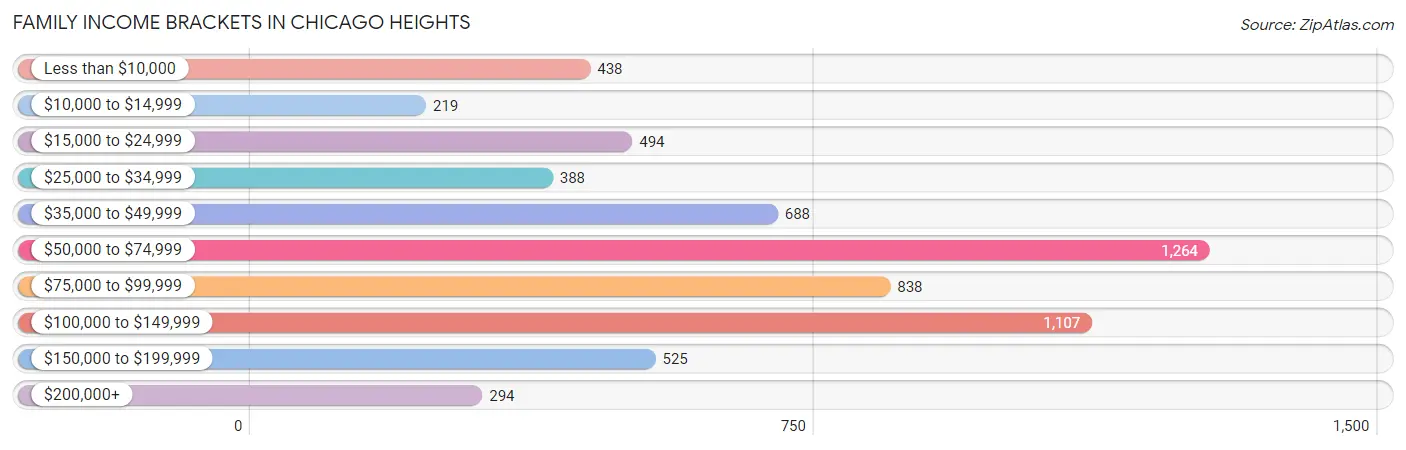
Family Income Brackets in Chicago Heights
According to the Chicago Heights family income data, there are 1,264 families falling into the $50,000 to $74,999 income range, which is the most common income bracket and makes up 20.2% of all families. Conversely, the $10,000 to $14,999 income bracket is the least frequent group with only 219 families (3.5%) belonging to this category.
| Income Bracket | # Families | % Families |
| Less than $10,000 | 438 | 7.0% |
| $10,000 to $14,999 | 219 | 3.5% |
| $15,000 to $24,999 | 494 | 7.9% |
| $25,000 to $34,999 | 388 | 6.2% |
| $35,000 to $49,999 | 688 | 11.0% |
| $50,000 to $74,999 | 1,264 | 20.2% |
| $75,000 to $99,999 | 838 | 13.4% |
| $100,000 to $149,999 | 1,107 | 17.7% |
| $150,000 to $199,999 | 525 | 8.4% |
| $200,000+ | 294 | 4.7% |
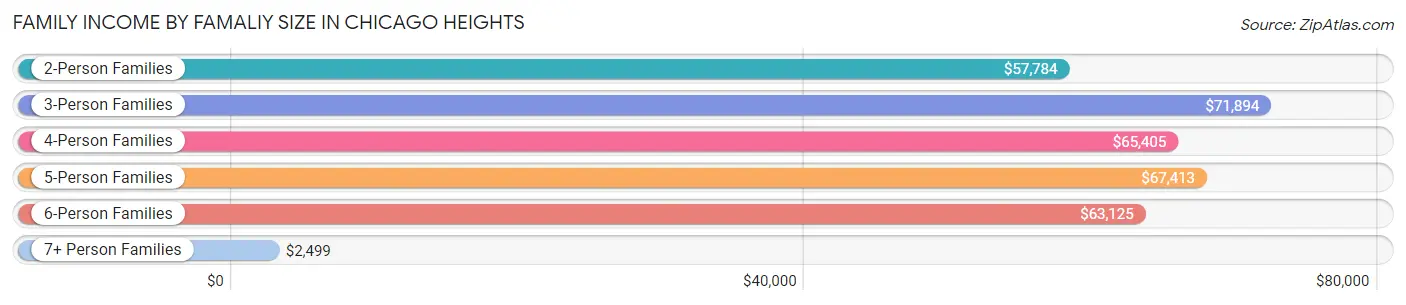
Family Income by Famaliy Size in Chicago Heights
3-person families (1,629 | 26.0%) account for the highest median family income in Chicago Heights with $71,894 per family, while 2-person families (2,181 | 34.9%) have the highest median income of $28,892 per family member.
| Income Bracket | # Families | Median Income |
| 2-Person Families | 2,181 (34.9%) | $57,784 |
| 3-Person Families | 1,629 (26.0%) | $71,894 |
| 4-Person Families | 1,095 (17.5%) | $65,405 |
| 5-Person Families | 773 (12.4%) | $67,413 |
| 6-Person Families | 366 (5.9%) | $63,125 |
| 7+ Person Families | 211 (3.4%) | $2,499 |
| Total | 6,255 (100.0%) | $66,142 |
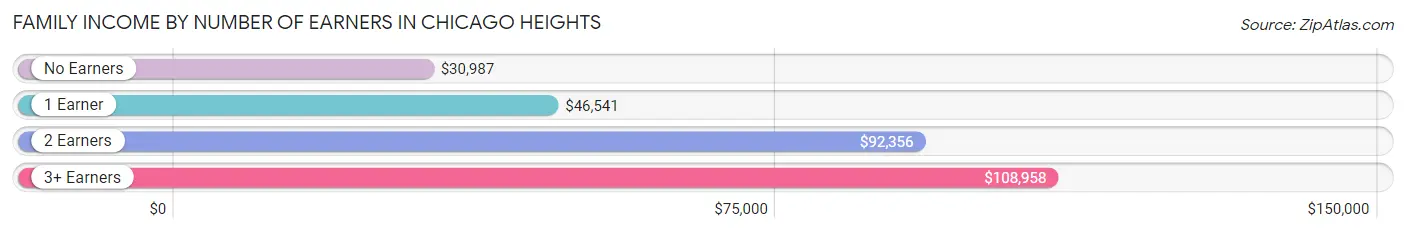
Family Income by Number of Earners in Chicago Heights
The median family income in Chicago Heights is $66,142, with families comprising 3+ earners (843) having the highest median family income of $108,958, while families with no earners (907) have the lowest median family income of $30,987, accounting for 13.5% and 14.5% of families, respectively.
| Number of Earners | # Families | Median Income |
| No Earners | 907 (14.5%) | $30,987 |
| 1 Earner | 2,504 (40.0%) | $46,541 |
| 2 Earners | 2,001 (32.0%) | $92,356 |
| 3+ Earners | 843 (13.5%) | $108,958 |
| Total | 6,255 (100.0%) | $66,142 |
Household Income in Chicago Heights
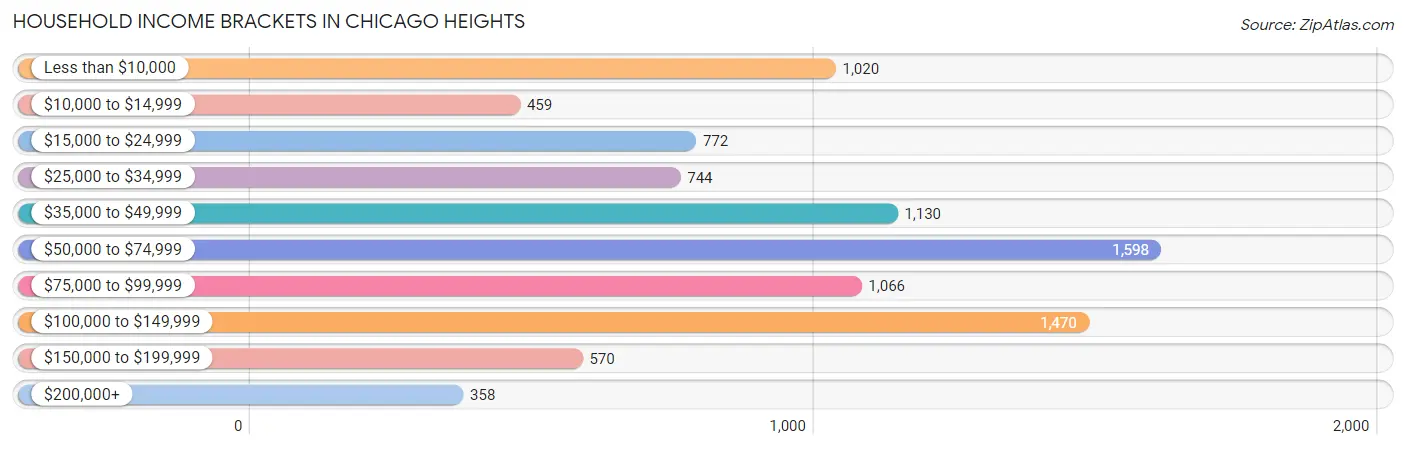
Household Income Brackets in Chicago Heights
With 1,598 households falling in the category, the $50,000 to $74,999 income range is the most frequent in Chicago Heights, accounting for 17.4% of all households. In contrast, only 358 households (3.9%) fall into the $200,000+ income bracket, making it the least populous group.
| Income Bracket | # Households | % Households |
| Less than $10,000 | 1,020 | 11.1% |
| $10,000 to $14,999 | 459 | 5.0% |
| $15,000 to $24,999 | 772 | 8.4% |
| $25,000 to $34,999 | 744 | 8.1% |
| $35,000 to $49,999 | 1,130 | 12.3% |
| $50,000 to $74,999 | 1,598 | 17.4% |
| $75,000 to $99,999 | 1,066 | 11.6% |
| $100,000 to $149,999 | 1,470 | 16.0% |
| $150,000 to $199,999 | 570 | 6.2% |
| $200,000+ | 358 | 3.9% |
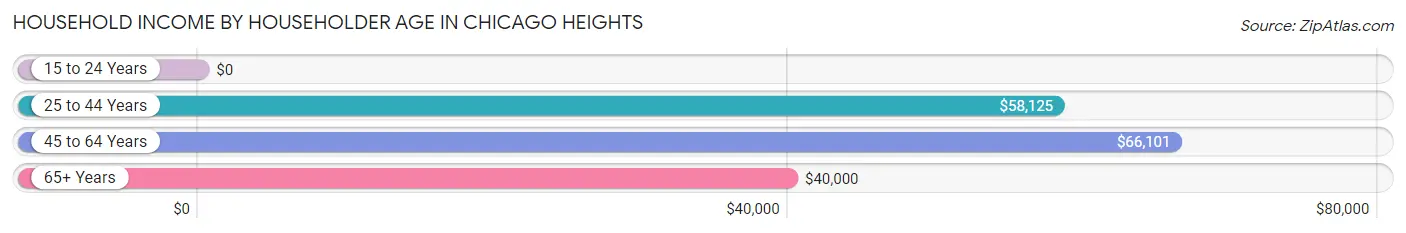
Household Income by Householder Age in Chicago Heights
The median household income in Chicago Heights is $56,755, with the highest median household income of $66,101 found in the 45 to 64 years age bracket for the primary householder. A total of 3,811 households (41.5%) fall into this category. Meanwhile, the 15 to 24 years age bracket for the primary householder has the lowest median household income of $0, with 253 households (2.8%) in this group.
| Income Bracket | # Households | Median Income |
| 15 to 24 Years | 253 (2.8%) | $0 |
| 25 to 44 Years | 2,814 (30.6%) | $58,125 |
| 45 to 64 Years | 3,811 (41.5%) | $66,101 |
| 65+ Years | 2,308 (25.1%) | $40,000 |
| Total | 9,186 (100.0%) | $56,755 |
Poverty in Chicago Heights
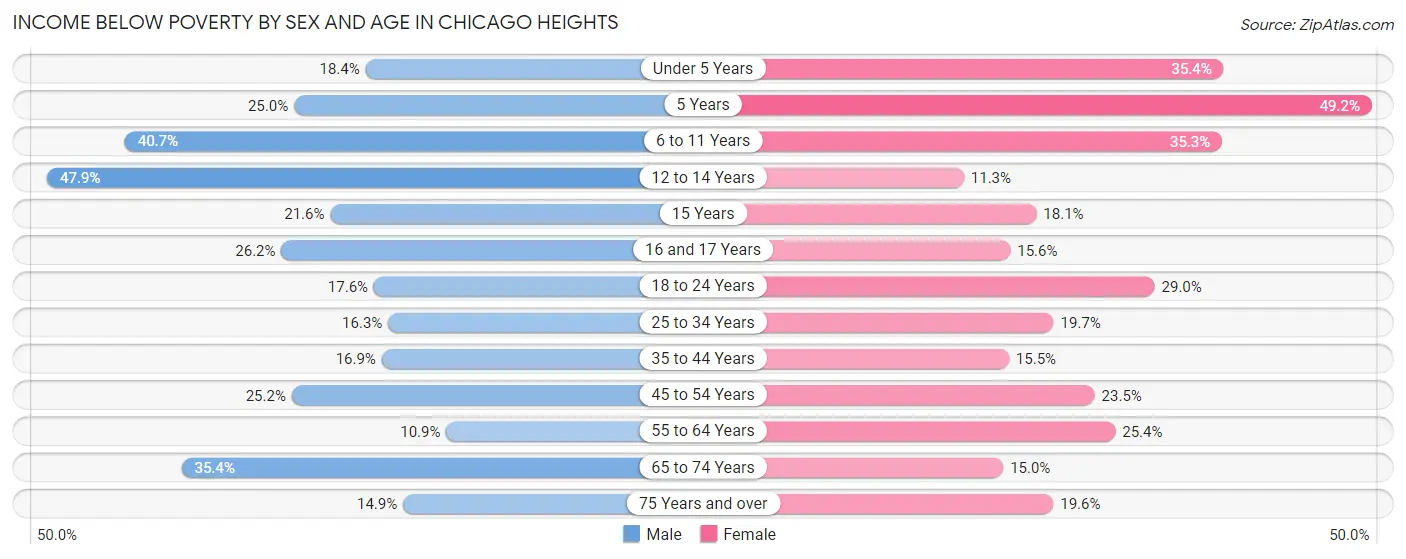
Income Below Poverty by Sex and Age in Chicago Heights
With 23.1% poverty level for males and 23.5% for females among the residents of Chicago Heights, 12 to 14 year old males and 5 year old females are the most vulnerable to poverty, with 333 males (47.9%) and 60 females (49.2%) in their respective age groups living below the poverty level.
| Age Bracket | Male | Female |
| Under 5 Years | 129 (18.3%) | 304 (35.4%) |
| 5 Years | 27 (25.0%) | 60 (49.2%) |
| 6 to 11 Years | 407 (40.7%) | 553 (35.3%) |
| 12 to 14 Years | 333 (47.9%) | 69 (11.3%) |
| 15 Years | 53 (21.6%) | 41 (18.1%) |
| 16 and 17 Years | 179 (26.2%) | 66 (15.6%) |
| 18 to 24 Years | 272 (17.6%) | 423 (29.0%) |
| 25 to 34 Years | 257 (16.3%) | 263 (19.7%) |
| 35 to 44 Years | 311 (16.9%) | 276 (15.5%) |
| 45 to 54 Years | 415 (25.2%) | 453 (23.5%) |
| 55 to 64 Years | 136 (10.9%) | 469 (25.4%) |
| 65 to 74 Years | 377 (35.4%) | 160 (15.0%) |
| 75 Years and over | 79 (14.9%) | 149 (19.6%) |
| Total | 2,975 (23.1%) | 3,286 (23.5%) |
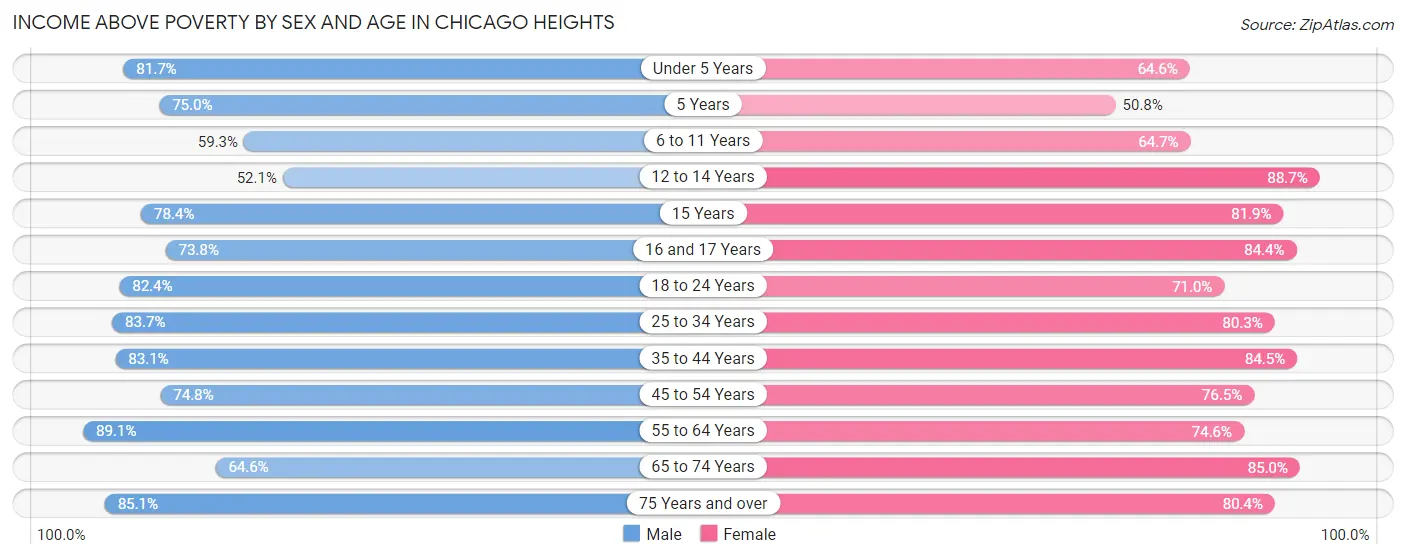
Income Above Poverty by Sex and Age in Chicago Heights
According to the poverty statistics in Chicago Heights, males aged 55 to 64 years and females aged 12 to 14 years are the age groups that are most secure financially, with 89.1% of males and 88.7% of females in these age groups living above the poverty line.
| Age Bracket | Male | Female |
| Under 5 Years | 574 (81.7%) | 554 (64.6%) |
| 5 Years | 81 (75.0%) | 62 (50.8%) |
| 6 to 11 Years | 593 (59.3%) | 1,014 (64.7%) |
| 12 to 14 Years | 362 (52.1%) | 540 (88.7%) |
| 15 Years | 192 (78.4%) | 186 (81.9%) |
| 16 and 17 Years | 505 (73.8%) | 356 (84.4%) |
| 18 to 24 Years | 1,275 (82.4%) | 1,034 (71.0%) |
| 25 to 34 Years | 1,324 (83.7%) | 1,075 (80.3%) |
| 35 to 44 Years | 1,534 (83.1%) | 1,503 (84.5%) |
| 45 to 54 Years | 1,231 (74.8%) | 1,477 (76.5%) |
| 55 to 64 Years | 1,116 (89.1%) | 1,379 (74.6%) |
| 65 to 74 Years | 687 (64.6%) | 908 (85.0%) |
| 75 Years and over | 452 (85.1%) | 610 (80.4%) |
| Total | 9,926 (76.9%) | 10,698 (76.5%) |
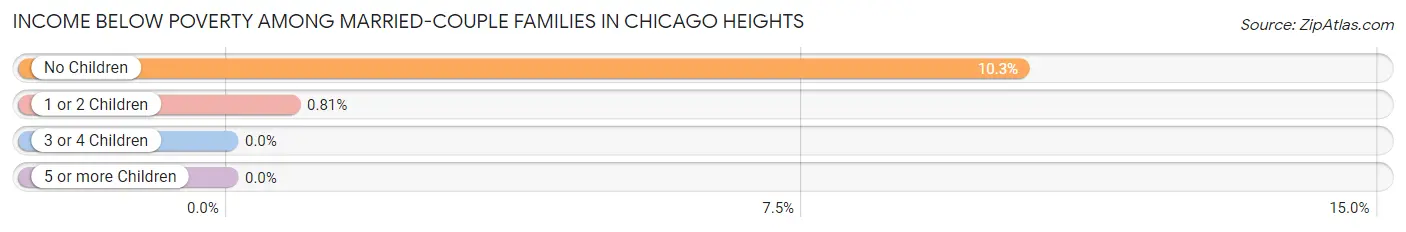
Income Below Poverty Among Married-Couple Families in Chicago Heights
The poverty statistics for married-couple families in Chicago Heights show that 6.1% or 190 of the total 3,136 families live below the poverty line. Families with no children have the highest poverty rate of 10.3%, comprising of 181 families. On the other hand, families with 3 or 4 children have the lowest poverty rate of 0.0%, which includes 0 families.
| Children | Above Poverty | Below Poverty |
| No Children | 1,569 (89.7%) | 181 (10.3%) |
| 1 or 2 Children | 1,106 (99.2%) | 9 (0.8%) |
| 3 or 4 Children | 237 (100.0%) | 0 (0.0%) |
| 5 or more Children | 34 (100.0%) | 0 (0.0%) |
| Total | 2,946 (93.9%) | 190 (6.1%) |
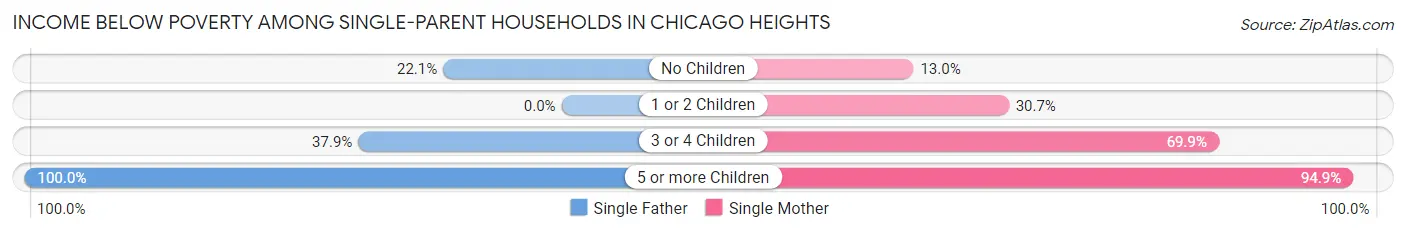
Income Below Poverty Among Single-Parent Households in Chicago Heights
According to the poverty data in Chicago Heights, 24.7% or 210 single-father households and 33.0% or 748 single-mother households are living below the poverty line. Among single-father households, those with 5 or more children have the highest poverty rate, with 54 households (100.0%) experiencing poverty. Likewise, among single-mother households, those with 5 or more children have the highest poverty rate, with 74 households (94.9%) falling below the poverty line.
| Children | Single Father | Single Mother |
| No Children | 92 (22.1%) | 111 (13.0%) |
| 1 or 2 Children | 0 (0.0%) | 292 (30.7%) |
| 3 or 4 Children | 64 (37.9%) | 271 (69.9%) |
| 5 or more Children | 54 (100.0%) | 74 (94.9%) |
| Total | 210 (24.7%) | 748 (33.0%) |
Income Below Poverty Among Married-Couple vs Single-Parent Households in Chicago Heights
The poverty data for Chicago Heights shows that 190 of the married-couple family households (6.1%) and 958 of the single-parent households (30.7%) are living below the poverty level. Within the married-couple family households, those with no children have the highest poverty rate, with 181 households (10.3%) falling below the poverty line. Among the single-parent households, those with 5 or more children have the highest poverty rate, with 128 household (97.0%) living below poverty.
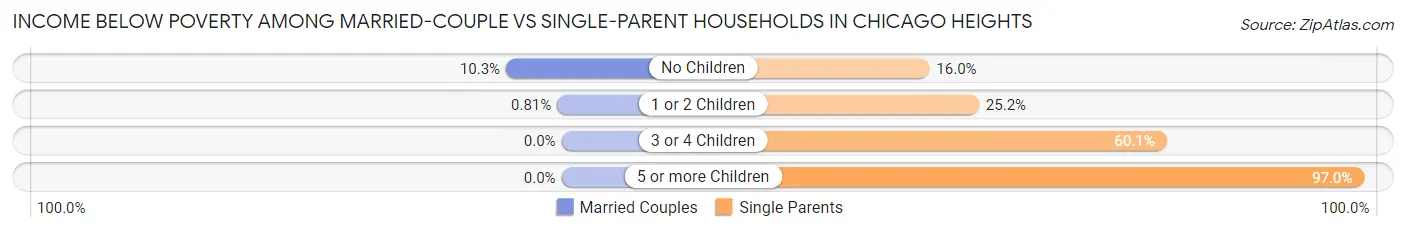
| Children | Married-Couple Families | Single-Parent Households |
| No Children | 181 (10.3%) | 203 (16.0%) |
| 1 or 2 Children | 9 (0.8%) | 292 (25.2%) |
| 3 or 4 Children | 0 (0.0%) | 335 (60.1%) |
| 5 or more Children | 0 (0.0%) | 128 (97.0%) |
| Total | 190 (6.1%) | 958 (30.7%) |
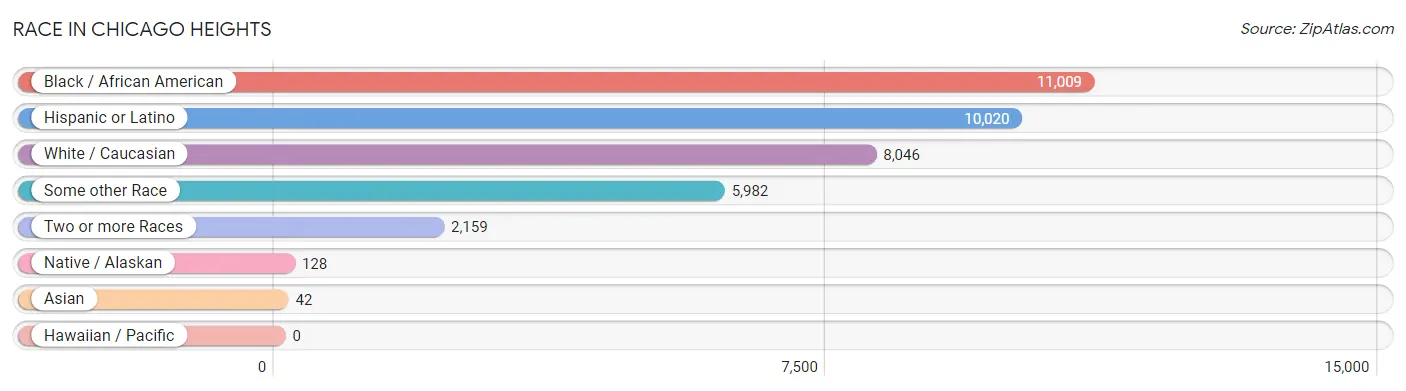
Race in Chicago Heights
The most populous races in Chicago Heights are Black / African American (11,009 | 40.2%), Hispanic or Latino (10,020 | 36.6%), and White / Caucasian (8,046 | 29.4%).
| Race | # Population | % Population |
| Asian | 42 | 0.2% |
| Black / African American | 11,009 | 40.2% |
| Hawaiian / Pacific | 0 | 0.0% |
| Hispanic or Latino | 10,020 | 36.6% |
| Native / Alaskan | 128 | 0.5% |
| White / Caucasian | 8,046 | 29.4% |
| Two or more Races | 2,159 | 7.9% |
| Some other Race | 5,982 | 21.9% |
| Total | 27,366 | 100.0% |
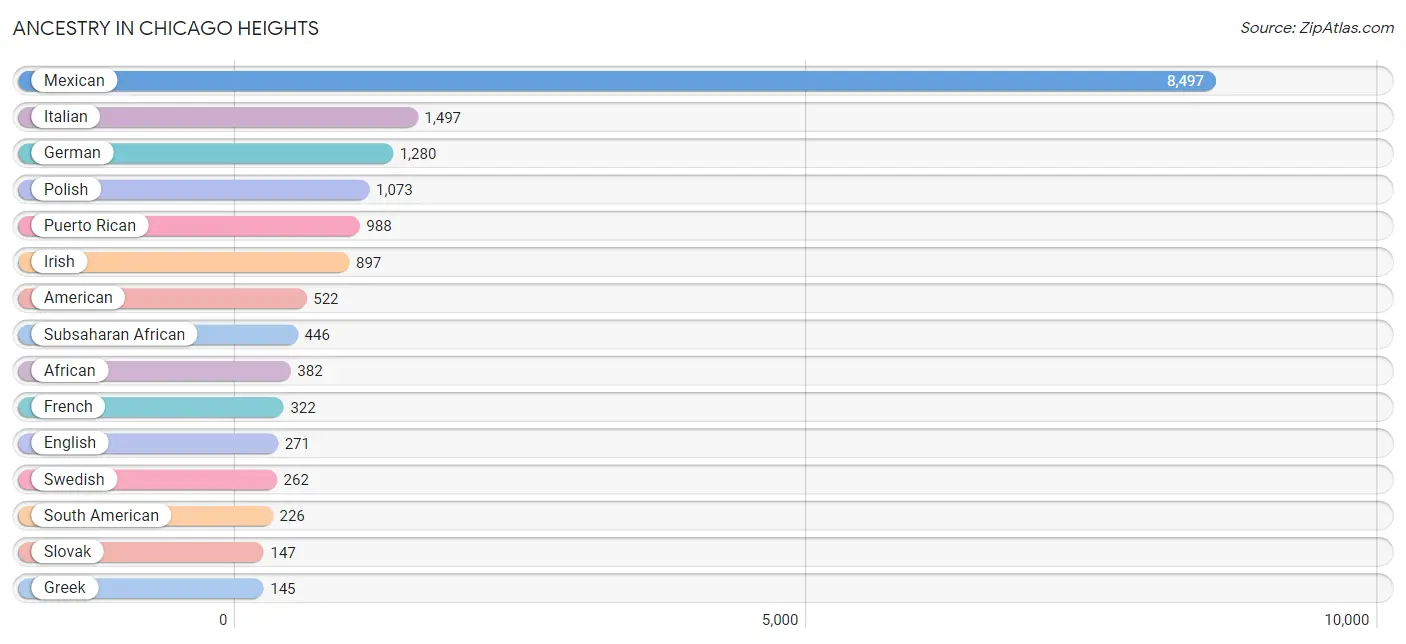
Ancestry in Chicago Heights
The most populous ancestries reported in Chicago Heights are Mexican (8,497 | 31.0%), Italian (1,497 | 5.5%), German (1,280 | 4.7%), Polish (1,073 | 3.9%), and Puerto Rican (988 | 3.6%), together accounting for 48.7% of all Chicago Heights residents.
| Ancestry | # Population | % Population |
| African | 382 | 1.4% |
| American | 522 | 1.9% |
| Argentinean | 89 | 0.3% |
| Armenian | 26 | 0.1% |
| Belizean | 28 | 0.1% |
| Canadian | 16 | 0.1% |
| Central American | 47 | 0.2% |
| Central American Indian | 22 | 0.1% |
| Cherokee | 23 | 0.1% |
| Choctaw | 7 | 0.0% |
| Colombian | 58 | 0.2% |
| Croatian | 19 | 0.1% |
| Czech | 9 | 0.0% |
| Czechoslovakian | 22 | 0.1% |
| Danish | 16 | 0.1% |
| Dominican | 15 | 0.1% |
| Dutch | 46 | 0.2% |
| English | 271 | 1.0% |
| European | 94 | 0.3% |
| French | 322 | 1.2% |
| French Canadian | 57 | 0.2% |
| German | 1,280 | 4.7% |
| Greek | 145 | 0.5% |
| Guatemalan | 38 | 0.1% |
| Guyanese | 9 | 0.0% |
| Haitian | 15 | 0.1% |
| Hungarian | 19 | 0.1% |
| Irish | 897 | 3.3% |
| Italian | 1,497 | 5.5% |
| Jamaican | 79 | 0.3% |
| Korean | 17 | 0.1% |
| Lithuanian | 118 | 0.4% |
| Macedonian | 24 | 0.1% |
| Mexican | 8,497 | 31.0% |
| Mexican American Indian | 45 | 0.2% |
| Nigerian | 64 | 0.2% |
| Norwegian | 124 | 0.4% |
| Peruvian | 33 | 0.1% |
| Polish | 1,073 | 3.9% |
| Puerto Rican | 988 | 3.6% |
| Russian | 21 | 0.1% |
| Salvadoran | 9 | 0.0% |
| Scandinavian | 16 | 0.1% |
| Scotch-Irish | 29 | 0.1% |
| Scottish | 41 | 0.2% |
| Serbian | 36 | 0.1% |
| Slovak | 147 | 0.5% |
| South American | 226 | 0.8% |
| Spanish | 42 | 0.2% |
| Sri Lankan | 39 | 0.1% |
| Subsaharan African | 446 | 1.6% |
| Swedish | 262 | 1.0% |
| Swiss | 24 | 0.1% |
| Venezuelan | 46 | 0.2% |
| Vietnamese | 24 | 0.1% |
| Welsh | 7 | 0.0% | View All 56 Rows |
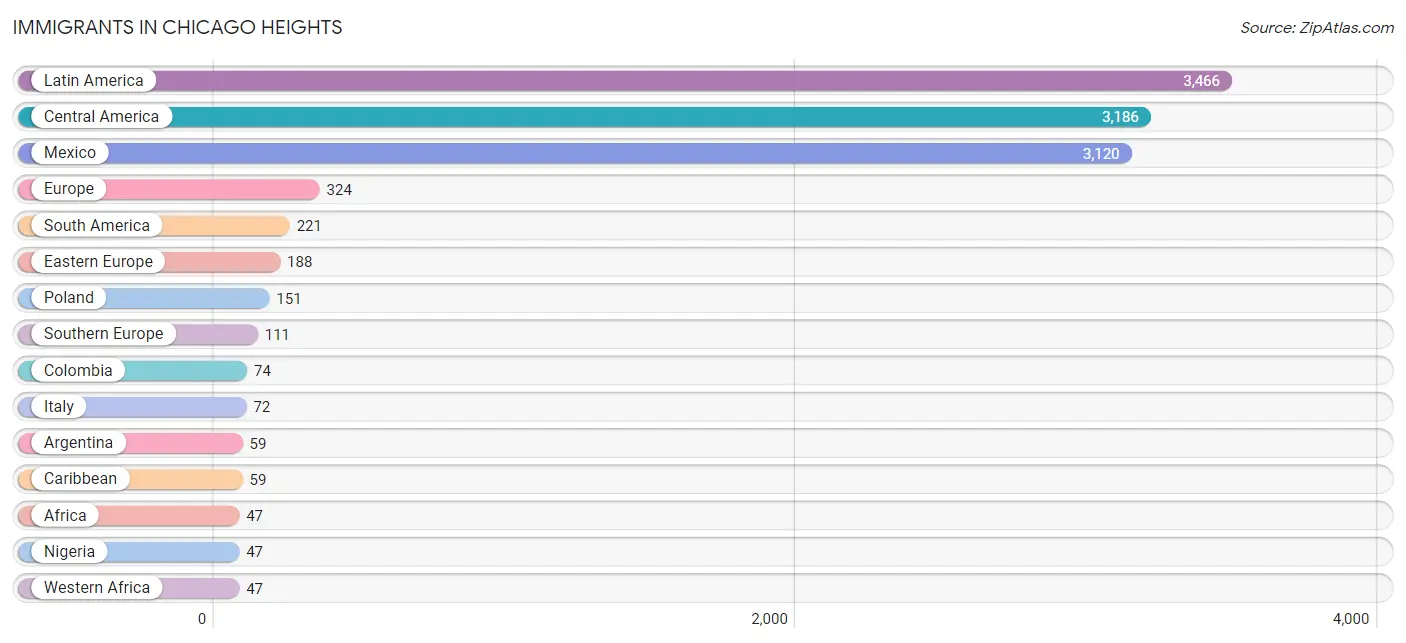
Immigrants in Chicago Heights
The most numerous immigrant groups reported in Chicago Heights came from Latin America (3,466 | 12.7%), Central America (3,186 | 11.6%), Mexico (3,120 | 11.4%), Europe (324 | 1.2%), and South America (221 | 0.8%), together accounting for 37.7% of all Chicago Heights residents.
| Immigration Origin | # Population | % Population |
| Africa | 47 | 0.2% |
| Argentina | 59 | 0.2% |
| Asia | 25 | 0.1% |
| Bangladesh | 24 | 0.1% |
| Belize | 28 | 0.1% |
| Caribbean | 59 | 0.2% |
| Central America | 3,186 | 11.6% |
| Colombia | 74 | 0.3% |
| Dominican Republic | 15 | 0.1% |
| Eastern Europe | 188 | 0.7% |
| Europe | 324 | 1.2% |
| Germany | 5 | 0.0% |
| Greece | 39 | 0.1% |
| Guatemala | 38 | 0.1% |
| Guyana | 29 | 0.1% |
| Ireland | 5 | 0.0% |
| Italy | 72 | 0.3% |
| Jamaica | 44 | 0.2% |
| Latin America | 3,466 | 12.7% |
| Lithuania | 37 | 0.1% |
| Mexico | 3,120 | 11.4% |
| Netherlands | 15 | 0.1% |
| Nigeria | 47 | 0.2% |
| Northern Europe | 5 | 0.0% |
| Oceania | 18 | 0.1% |
| Peru | 13 | 0.1% |
| Philippines | 1 | 0.0% |
| Poland | 151 | 0.5% |
| South America | 221 | 0.8% |
| South Central Asia | 24 | 0.1% |
| South Eastern Asia | 1 | 0.0% |
| Southern Europe | 111 | 0.4% |
| Venezuela | 46 | 0.2% |
| Western Africa | 47 | 0.2% |
| Western Europe | 20 | 0.1% | View All 35 Rows |
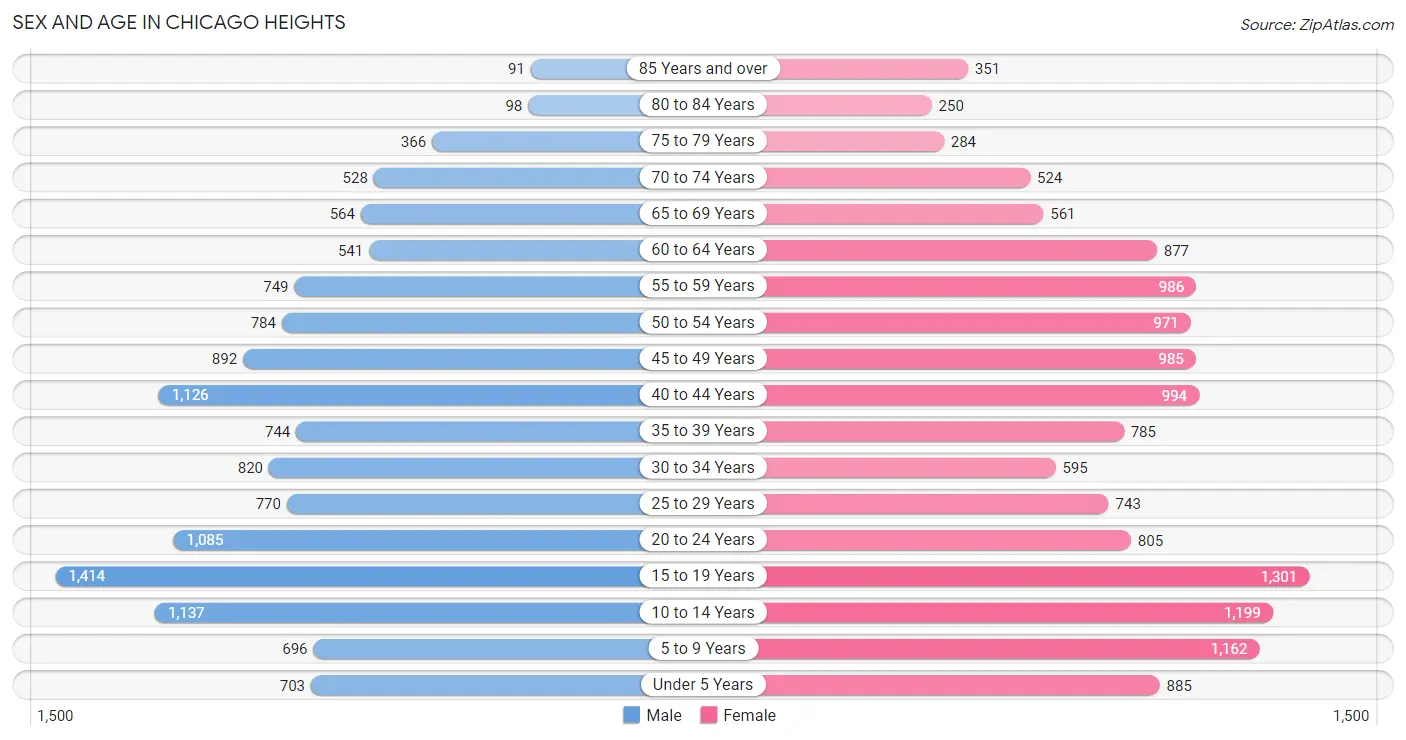
Sex and Age in Chicago Heights
Sex and Age in Chicago Heights
The most populous age groups in Chicago Heights are 15 to 19 Years (1,414 | 10.8%) for men and 15 to 19 Years (1,301 | 9.1%) for women.
| Age Bracket | Male | Female |
| Under 5 Years | 703 (5.4%) | 885 (6.2%) |
| 5 to 9 Years | 696 (5.3%) | 1,162 (8.2%) |
| 10 to 14 Years | 1,137 (8.7%) | 1,199 (8.4%) |
| 15 to 19 Years | 1,414 (10.8%) | 1,301 (9.1%) |
| 20 to 24 Years | 1,085 (8.3%) | 805 (5.7%) |
| 25 to 29 Years | 770 (5.9%) | 743 (5.2%) |
| 30 to 34 Years | 820 (6.3%) | 595 (4.2%) |
| 35 to 39 Years | 744 (5.7%) | 785 (5.5%) |
| 40 to 44 Years | 1,126 (8.6%) | 994 (7.0%) |
| 45 to 49 Years | 892 (6.8%) | 985 (6.9%) |
| 50 to 54 Years | 784 (6.0%) | 971 (6.8%) |
| 55 to 59 Years | 749 (5.7%) | 986 (6.9%) |
| 60 to 64 Years | 541 (4.1%) | 877 (6.1%) |
| 65 to 69 Years | 564 (4.3%) | 561 (3.9%) |
| 70 to 74 Years | 528 (4.0%) | 524 (3.7%) |
| 75 to 79 Years | 366 (2.8%) | 284 (2.0%) |
| 80 to 84 Years | 98 (0.7%) | 250 (1.8%) |
| 85 Years and over | 91 (0.7%) | 351 (2.5%) |
| Total | 13,108 (100.0%) | 14,258 (100.0%) |
Families and Households in Chicago Heights
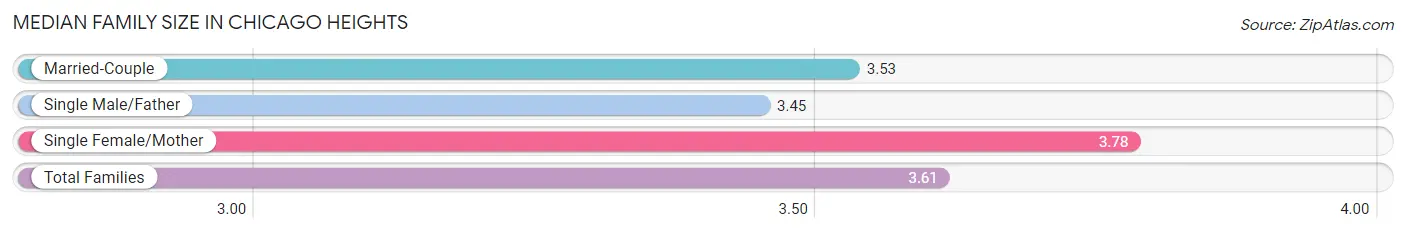
Median Family Size in Chicago Heights
The median family size in Chicago Heights is 3.61 persons per family, with single female/mother families (2,270 | 36.3%) accounting for the largest median family size of 3.78 persons per family. On the other hand, single male/father families (849 | 13.6%) represent the smallest median family size with 3.45 persons per family.
| Family Type | # Families | Family Size |
| Married-Couple | 3,136 (50.1%) | 3.53 |
| Single Male/Father | 849 (13.6%) | 3.45 |
| Single Female/Mother | 2,270 (36.3%) | 3.78 |
| Total Families | 6,255 (100.0%) | 3.61 |
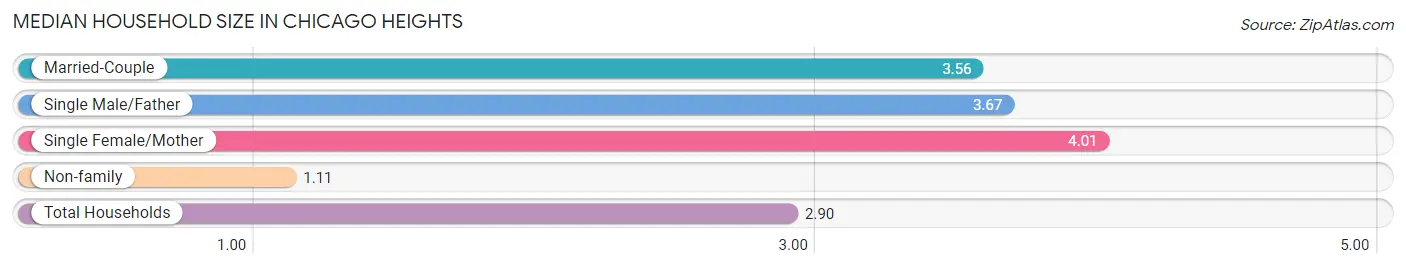
Median Household Size in Chicago Heights
The median household size in Chicago Heights is 2.90 persons per household, with single female/mother households (2,270 | 24.7%) accounting for the largest median household size of 4.01 persons per household. non-family households (2,931 | 31.9%) represent the smallest median household size with 1.11 persons per household.
| Household Type | # Households | Household Size |
| Married-Couple | 3,136 (34.1%) | 3.56 |
| Single Male/Father | 849 (9.2%) | 3.67 |
| Single Female/Mother | 2,270 (24.7%) | 4.01 |
| Non-family | 2,931 (31.9%) | 1.11 |
| Total Households | 9,186 (100.0%) | 2.90 |
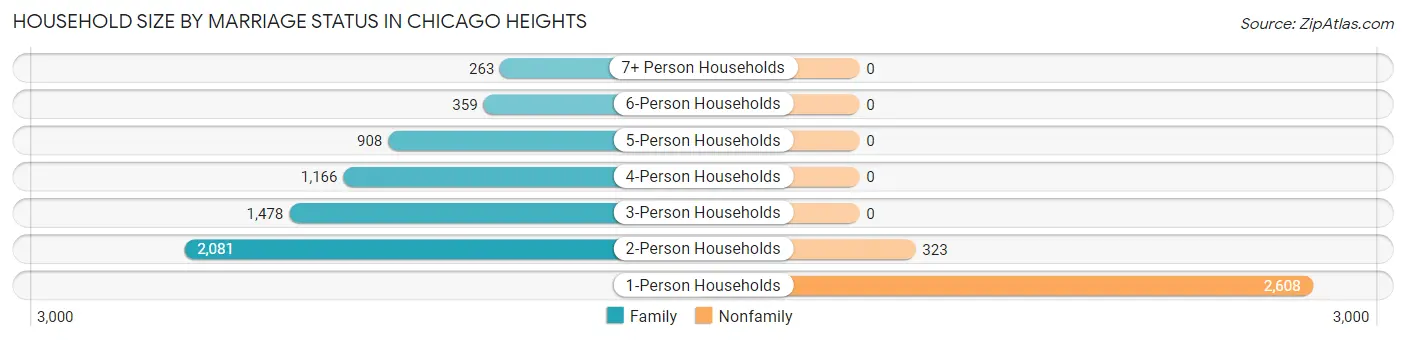
Household Size by Marriage Status in Chicago Heights
Out of a total of 9,186 households in Chicago Heights, 6,255 (68.1%) are family households, while 2,931 (31.9%) are nonfamily households. The most numerous type of family households are 2-person households, comprising 2,081, and the most common type of nonfamily households are 1-person households, comprising 2,608.
| Household Size | Family Households | Nonfamily Households |
| 1-Person Households | - | 2,608 (28.4%) |
| 2-Person Households | 2,081 (22.7%) | 323 (3.5%) |
| 3-Person Households | 1,478 (16.1%) | 0 (0.0%) |
| 4-Person Households | 1,166 (12.7%) | 0 (0.0%) |
| 5-Person Households | 908 (9.9%) | 0 (0.0%) |
| 6-Person Households | 359 (3.9%) | 0 (0.0%) |
| 7+ Person Households | 263 (2.9%) | 0 (0.0%) |
| Total | 6,255 (68.1%) | 2,931 (31.9%) |
Female Fertility in Chicago Heights
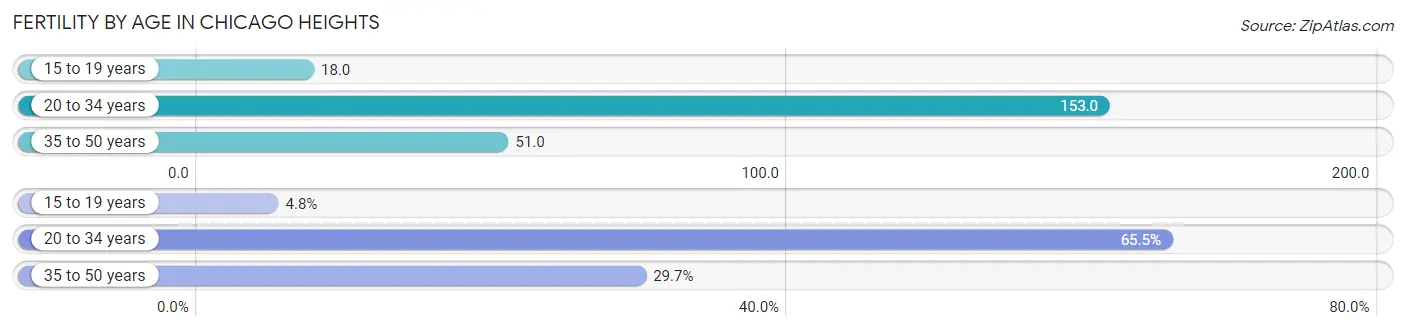
Fertility by Age in Chicago Heights
Average fertility rate in Chicago Heights is 79.0 births per 1,000 women. Women in the age bracket of 20 to 34 years have the highest fertility rate with 153.0 births per 1,000 women. Women in the age bracket of 20 to 34 years acount for 65.5% of all women with births.
| Age Bracket | Women with Births | Births / 1,000 Women |
| 15 to 19 years | 24 (4.8%) | 18.0 |
| 20 to 34 years | 328 (65.5%) | 153.0 |
| 35 to 50 years | 149 (29.7%) | 51.0 |
| Total | 501 (100.0%) | 79.0 |
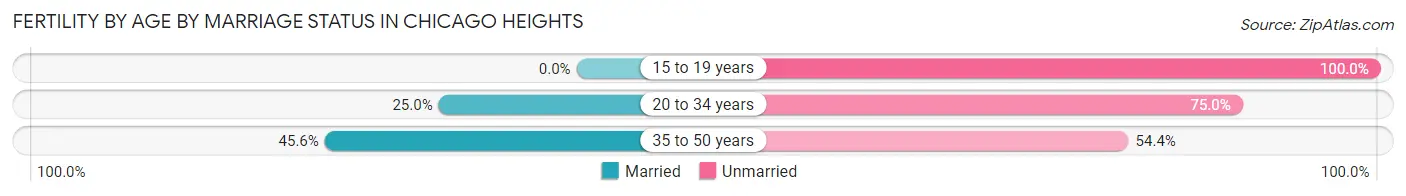
Fertility by Age by Marriage Status in Chicago Heights
29.9% of women with births (501) in Chicago Heights are married. The highest percentage of unmarried women with births falls into 15 to 19 years age bracket with 100.0% of them unmarried at the time of birth, while the lowest percentage of unmarried women with births belong to 35 to 50 years age bracket with 54.4% of them unmarried.
| Age Bracket | Married | Unmarried |
| 15 to 19 years | 0 (0.0%) | 24 (100.0%) |
| 20 to 34 years | 82 (25.0%) | 246 (75.0%) |
| 35 to 50 years | 68 (45.6%) | 81 (54.4%) |
| Total | 150 (29.9%) | 351 (70.1%) |
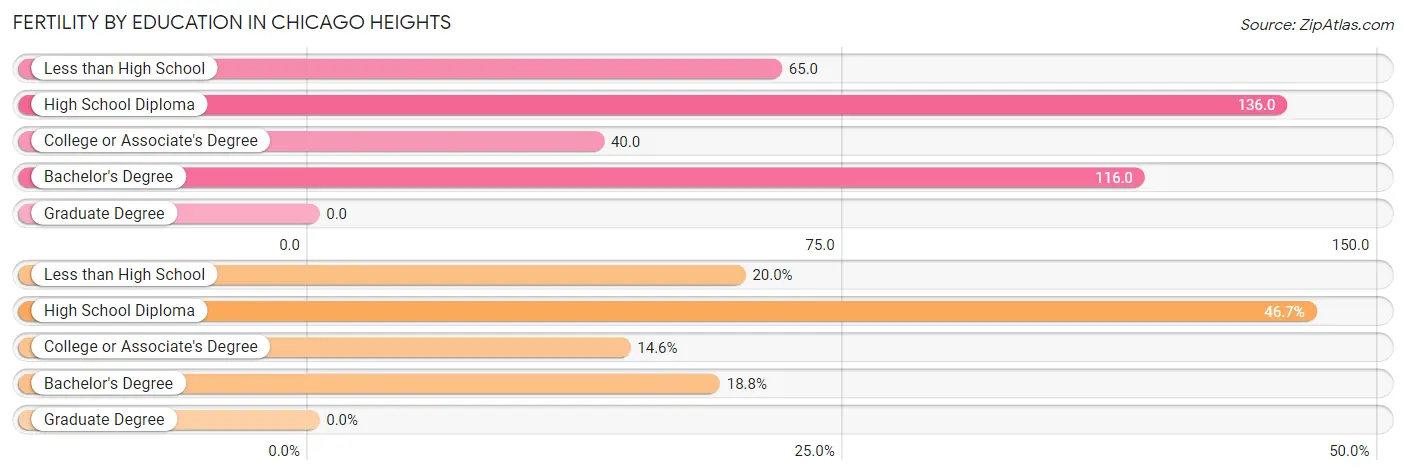
Fertility by Education in Chicago Heights
| Educational Attainment | Women with Births | Births / 1,000 Women |
| Less than High School | 100 (20.0%) | 65.0 |
| High School Diploma | 234 (46.7%) | 136.0 |
| College or Associate's Degree | 73 (14.6%) | 40.0 |
| Bachelor's Degree | 94 (18.8%) | 116.0 |
| Graduate Degree | 0 (0.0%) | 0.0 |
| Total | 501 (100.0%) | 79.0 |
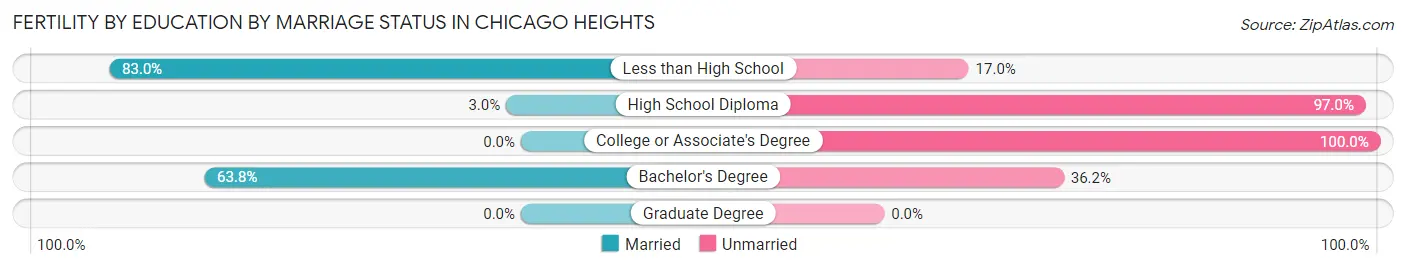
Fertility by Education by Marriage Status in Chicago Heights
70.1% of women with births in Chicago Heights are unmarried. Women with the educational attainment of less than high school are most likely to be married with 83.0% of them married at childbirth, while women with the educational attainment of college or associate's degree are least likely to be married with 100.0% of them unmarried at childbirth.
| Educational Attainment | Married | Unmarried |
| Less than High School | 83 (83.0%) | 17 (17.0%) |
| High School Diploma | 7 (3.0%) | 227 (97.0%) |
| College or Associate's Degree | 0 (0.0%) | 73 (100.0%) |
| Bachelor's Degree | 60 (63.8%) | 34 (36.2%) |
| Graduate Degree | 0 (0.0%) | 0 (0.0%) |
| Total | 150 (29.9%) | 351 (70.1%) |
Employment Characteristics in Chicago Heights
Employment by Class of Employer in Chicago Heights
Among the 10,644 employed individuals in Chicago Heights, private company employees (7,415 | 69.7%), not-for-profit organizations (954 | 9.0%), and local government employees (864 | 8.1%) make up the most common classes of employment.
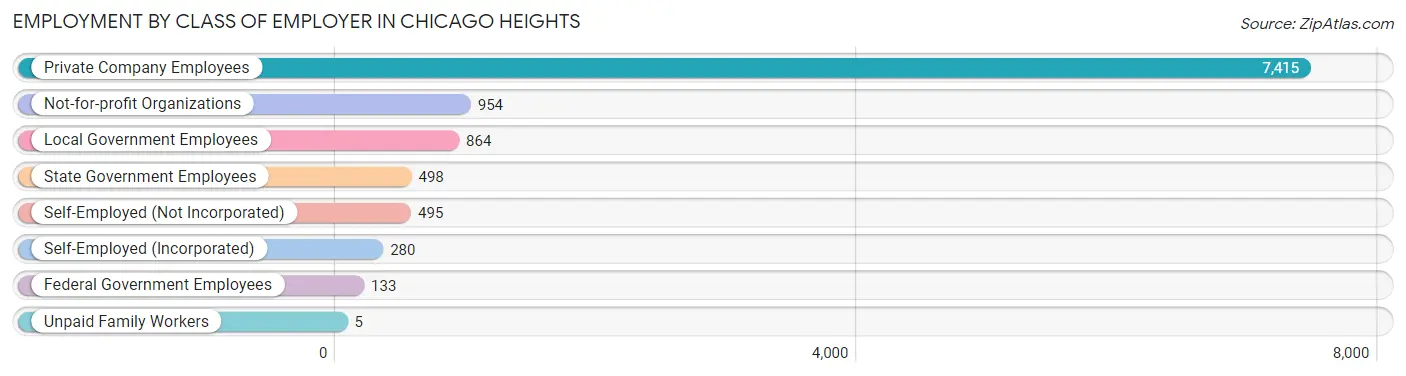
| Employer Class | # Employees | % Employees |
| Private Company Employees | 7,415 | 69.7% |
| Self-Employed (Incorporated) | 280 | 2.6% |
| Self-Employed (Not Incorporated) | 495 | 4.6% |
| Not-for-profit Organizations | 954 | 9.0% |
| Local Government Employees | 864 | 8.1% |
| State Government Employees | 498 | 4.7% |
| Federal Government Employees | 133 | 1.3% |
| Unpaid Family Workers | 5 | 0.1% |
| Total | 10,644 | 100.0% |
Employment Status by Age in Chicago Heights
According to the labor force statistics for Chicago Heights, out of the total population over 16 years of age (21,107), 60.1% or 12,685 individuals are in the labor force, with 13.8% or 1,751 of them unemployed. The age group with the highest labor force participation rate is 30 to 34 years, with 88.9% or 1,258 individuals in the labor force. Within the labor force, the 16 to 19 years age range has the highest percentage of unemployed individuals, with 39.9% or 281 of them being unemployed.
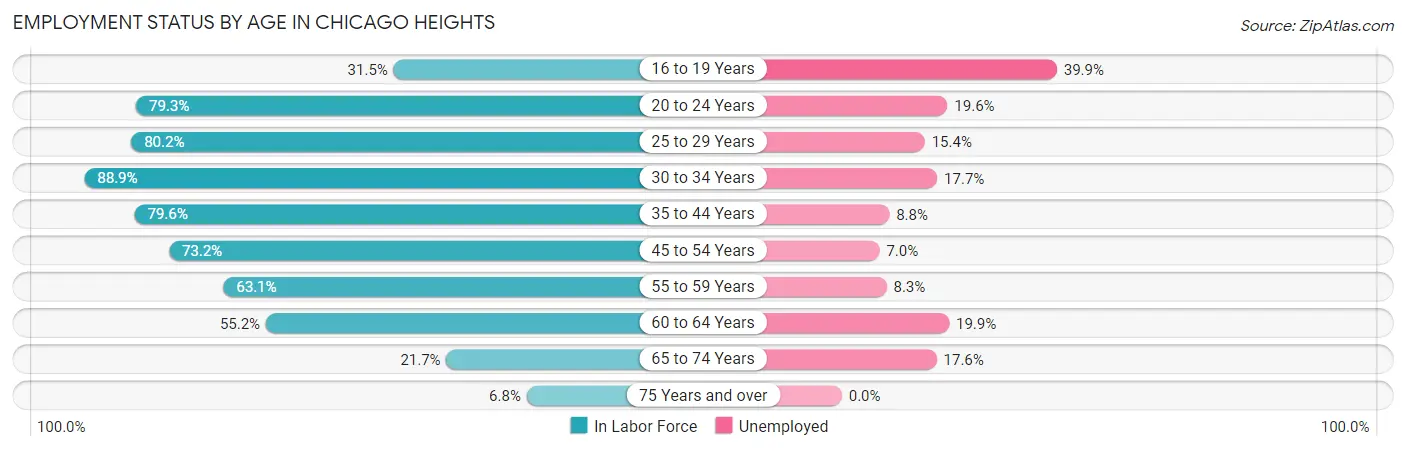
| Age Bracket | In Labor Force | Unemployed |
| 16 to 19 Years | 705 (31.5%) | 281 (39.9%) |
| 20 to 24 Years | 1,499 (79.3%) | 294 (19.6%) |
| 25 to 29 Years | 1,213 (80.2%) | 187 (15.4%) |
| 30 to 34 Years | 1,258 (88.9%) | 223 (17.7%) |
| 35 to 44 Years | 2,905 (79.6%) | 256 (8.8%) |
| 45 to 54 Years | 2,659 (73.2%) | 186 (7.0%) |
| 55 to 59 Years | 1,095 (63.1%) | 91 (8.3%) |
| 60 to 64 Years | 783 (55.2%) | 156 (19.9%) |
| 65 to 74 Years | 472 (21.7%) | 83 (17.6%) |
| 75 Years and over | 98 (6.8%) | 0 (0.0%) |
| Total | 12,685 (60.1%) | 1,751 (13.8%) |
Employment Status by Educational Attainment in Chicago Heights
According to labor force statistics for Chicago Heights, 74.2% of individuals (9,915) out of the total population between 25 and 64 years of age (13,362) are in the labor force, with 11.1% or 1,101 of them being unemployed. The group with the highest labor force participation rate are those with the educational attainment of bachelor's degree or higher, with 84.5% or 2,256 individuals in the labor force. Within the labor force, individuals with high school diploma education have the highest percentage of unemployment, with 17.5% or 526 of them being unemployed.
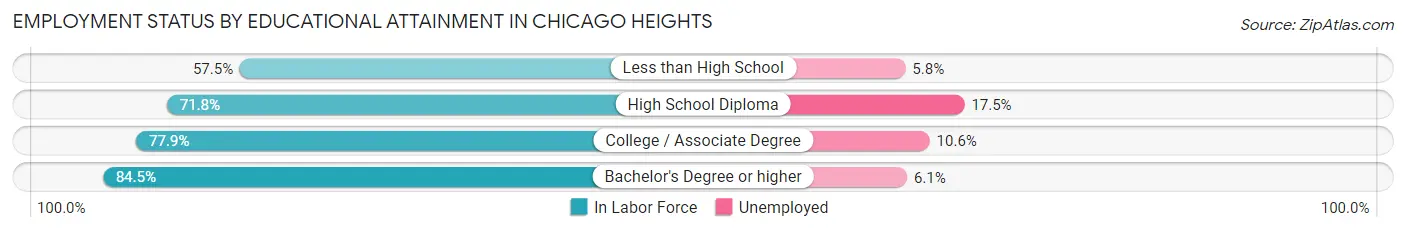
| Educational Attainment | In Labor Force | Unemployed |
| Less than High School | 1,178 (57.5%) | 119 (5.8%) |
| High School Diploma | 3,005 (71.8%) | 732 (17.5%) |
| College / Associate Degree | 3,473 (77.9%) | 473 (10.6%) |
| Bachelor's Degree or higher | 2,256 (84.5%) | 163 (6.1%) |
| Total | 9,915 (74.2%) | 1,483 (11.1%) |
Employment Occupations by Sex in Chicago Heights
Management, Business, Science and Arts Occupations
The most common Management, Business, Science and Arts occupations in Chicago Heights are Community & Social Service (997 | 9.1%), Management (683 | 6.3%), Education Instruction & Library (581 | 5.3%), Health Diagnosing & Treating (554 | 5.1%), and Education, Arts & Media (321 | 2.9%).
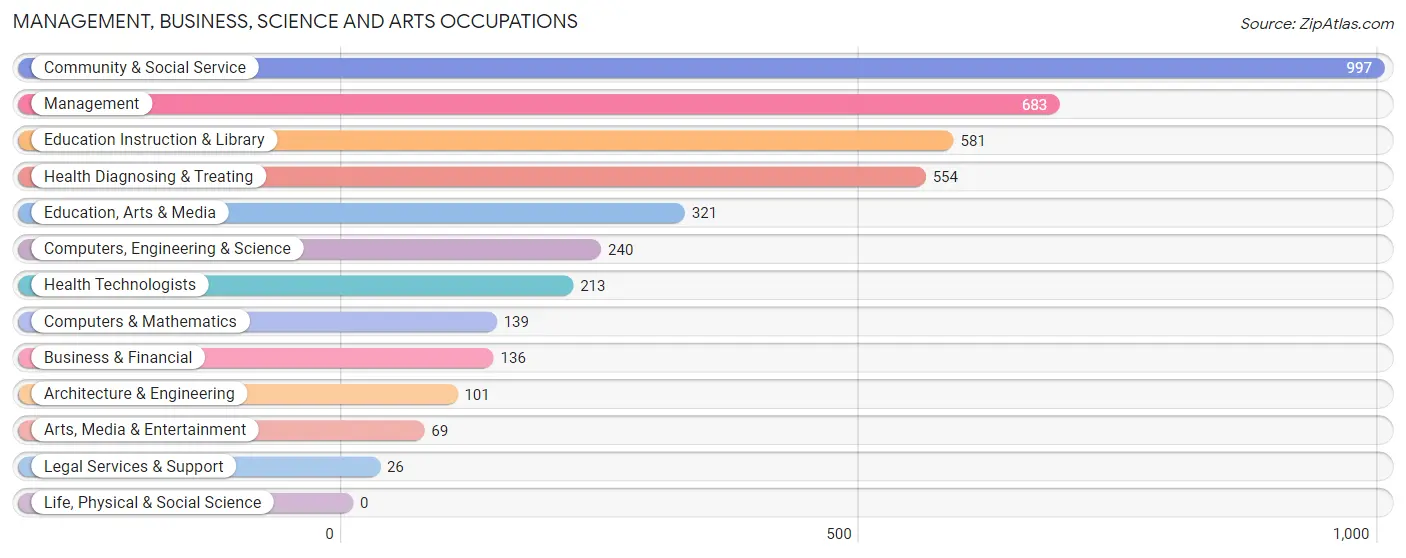
Management, Business, Science and Arts Occupations by Sex
Within the Management, Business, Science and Arts occupations in Chicago Heights, the most male-oriented occupations are Legal Services & Support (100.0%), Architecture & Engineering (97.0%), and Computers, Engineering & Science (73.3%), while the most female-oriented occupations are Education, Arts & Media (90.3%), Arts, Media & Entertainment (79.7%), and Health Diagnosing & Treating (78.0%).
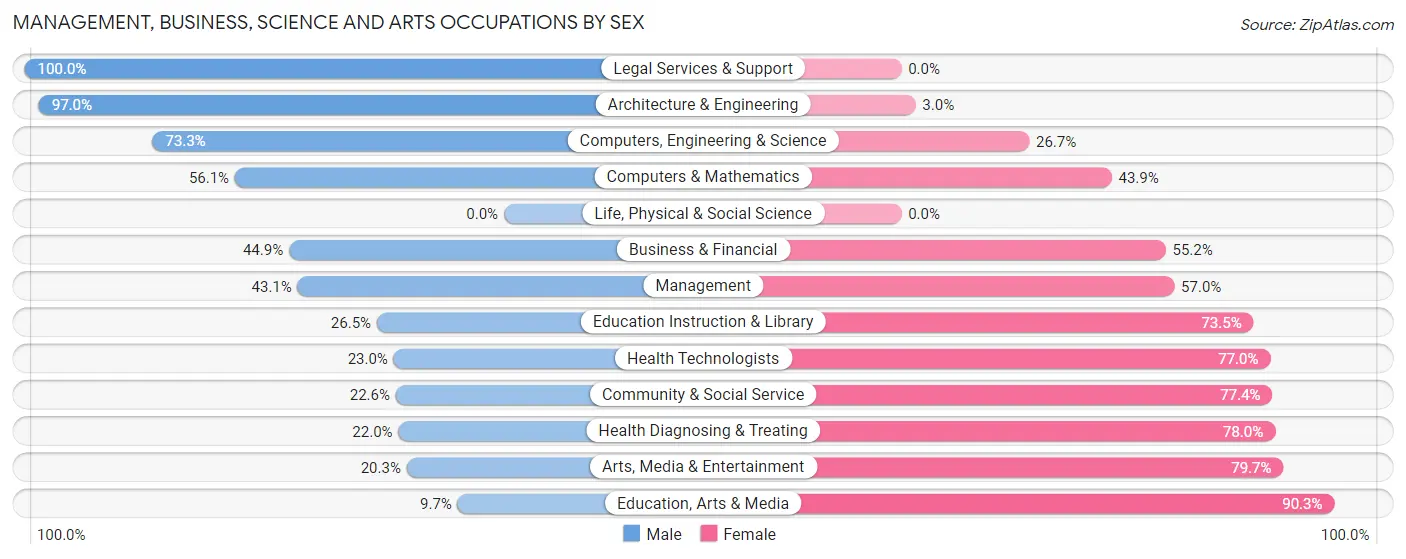
| Occupation | Male | Female |
| Management | 294 (43.0%) | 389 (57.0%) |
| Business & Financial | 61 (44.9%) | 75 (55.1%) |
| Computers, Engineering & Science | 176 (73.3%) | 64 (26.7%) |
| Computers & Mathematics | 78 (56.1%) | 61 (43.9%) |
| Architecture & Engineering | 98 (97.0%) | 3 (3.0%) |
| Life, Physical & Social Science | 0 (0.0%) | 0 (0.0%) |
| Community & Social Service | 225 (22.6%) | 772 (77.4%) |
| Education, Arts & Media | 31 (9.7%) | 290 (90.3%) |
| Legal Services & Support | 26 (100.0%) | 0 (0.0%) |
| Education Instruction & Library | 154 (26.5%) | 427 (73.5%) |
| Arts, Media & Entertainment | 14 (20.3%) | 55 (79.7%) |
| Health Diagnosing & Treating | 122 (22.0%) | 432 (78.0%) |
| Health Technologists | 49 (23.0%) | 164 (77.0%) |
| Total (Category) | 878 (33.6%) | 1,732 (66.4%) |
| Total (Overall) | 5,905 (54.2%) | 4,996 (45.8%) |
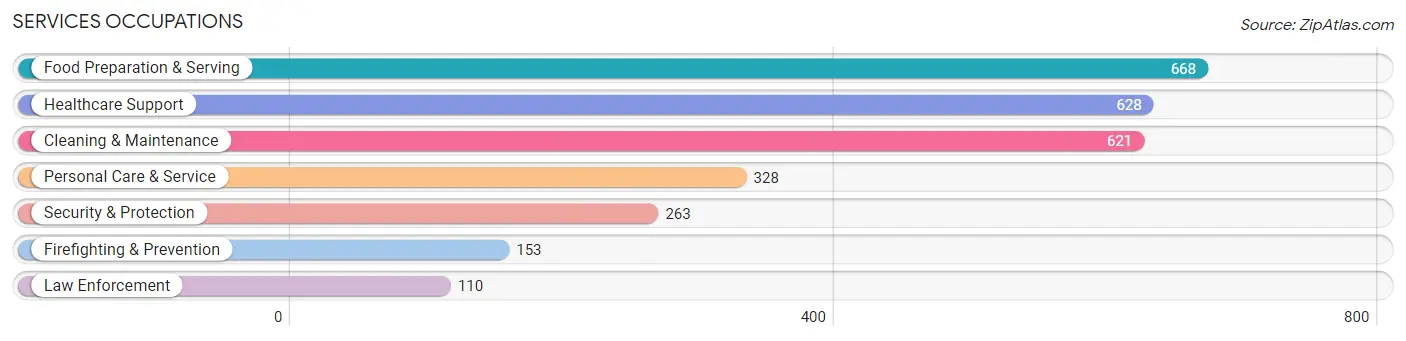
Services Occupations
The most common Services occupations in Chicago Heights are Food Preparation & Serving (668 | 6.1%), Healthcare Support (628 | 5.8%), Cleaning & Maintenance (621 | 5.7%), Personal Care & Service (328 | 3.0%), and Security & Protection (263 | 2.4%).
Services Occupations by Sex
Within the Services occupations in Chicago Heights, the most male-oriented occupations are Security & Protection (100.0%), Firefighting & Prevention (100.0%), and Law Enforcement (100.0%), while the most female-oriented occupations are Healthcare Support (74.5%), Personal Care & Service (66.8%), and Food Preparation & Serving (53.1%).
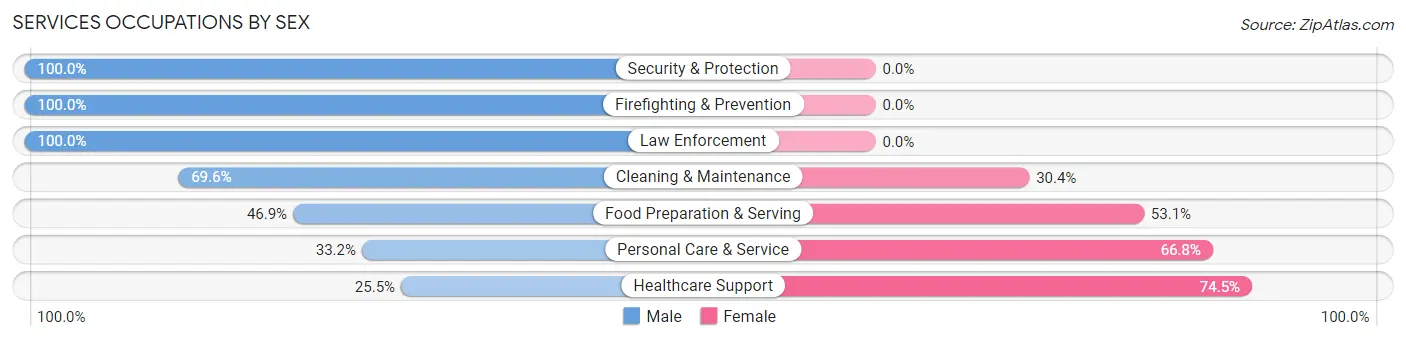
| Occupation | Male | Female |
| Healthcare Support | 160 (25.5%) | 468 (74.5%) |
| Security & Protection | 263 (100.0%) | 0 (0.0%) |
| Firefighting & Prevention | 153 (100.0%) | 0 (0.0%) |
| Law Enforcement | 110 (100.0%) | 0 (0.0%) |
| Food Preparation & Serving | 313 (46.9%) | 355 (53.1%) |
| Cleaning & Maintenance | 432 (69.6%) | 189 (30.4%) |
| Personal Care & Service | 109 (33.2%) | 219 (66.8%) |
| Total (Category) | 1,277 (50.9%) | 1,231 (49.1%) |
| Total (Overall) | 5,905 (54.2%) | 4,996 (45.8%) |
Sales and Office Occupations
The most common Sales and Office occupations in Chicago Heights are Office & Administration (998 | 9.2%), and Sales & Related (943 | 8.6%).
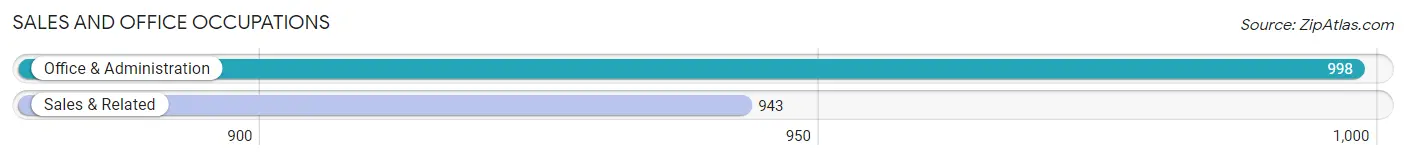
Sales and Office Occupations by Sex

| Occupation | Male | Female |
| Sales & Related | 416 (44.1%) | 527 (55.9%) |
| Office & Administration | 147 (14.7%) | 851 (85.3%) |
| Total (Category) | 563 (29.0%) | 1,378 (71.0%) |
| Total (Overall) | 5,905 (54.2%) | 4,996 (45.8%) |
Natural Resources, Construction and Maintenance Occupations
The most common Natural Resources, Construction and Maintenance occupations in Chicago Heights are Construction & Extraction (535 | 4.9%), and Installation, Maintenance & Repair (385 | 3.5%).
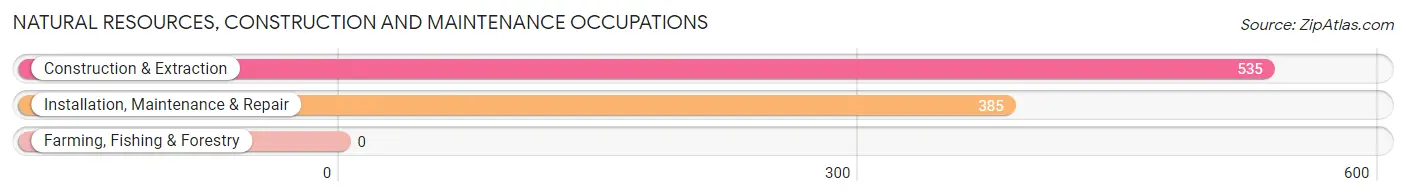
Natural Resources, Construction and Maintenance Occupations by Sex

| Occupation | Male | Female |
| Farming, Fishing & Forestry | 0 (0.0%) | 0 (0.0%) |
| Construction & Extraction | 535 (100.0%) | 0 (0.0%) |
| Installation, Maintenance & Repair | 385 (100.0%) | 0 (0.0%) |
| Total (Category) | 920 (100.0%) | 0 (0.0%) |
| Total (Overall) | 5,905 (54.2%) | 4,996 (45.8%) |
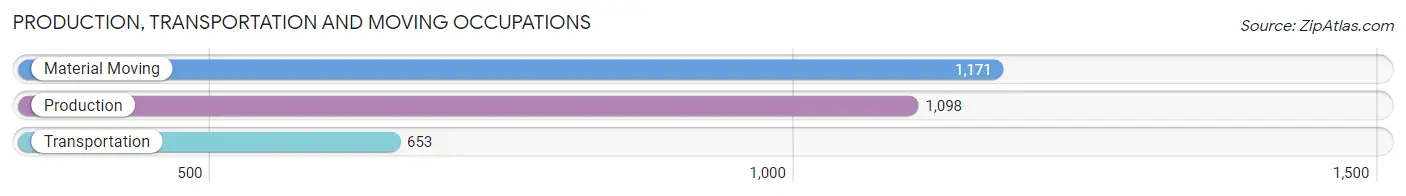
Production, Transportation and Moving Occupations
The most common Production, Transportation and Moving occupations in Chicago Heights are Material Moving (1,171 | 10.7%), Production (1,098 | 10.1%), and Transportation (653 | 6.0%).
Production, Transportation and Moving Occupations by Sex
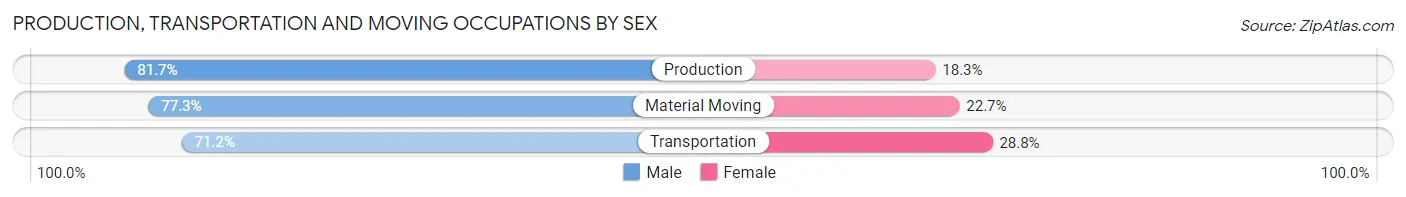
| Occupation | Male | Female |
| Production | 897 (81.7%) | 201 (18.3%) |
| Transportation | 465 (71.2%) | 188 (28.8%) |
| Material Moving | 905 (77.3%) | 266 (22.7%) |
| Total (Category) | 2,267 (77.6%) | 655 (22.4%) |
| Total (Overall) | 5,905 (54.2%) | 4,996 (45.8%) |
Employment Industries by Sex in Chicago Heights
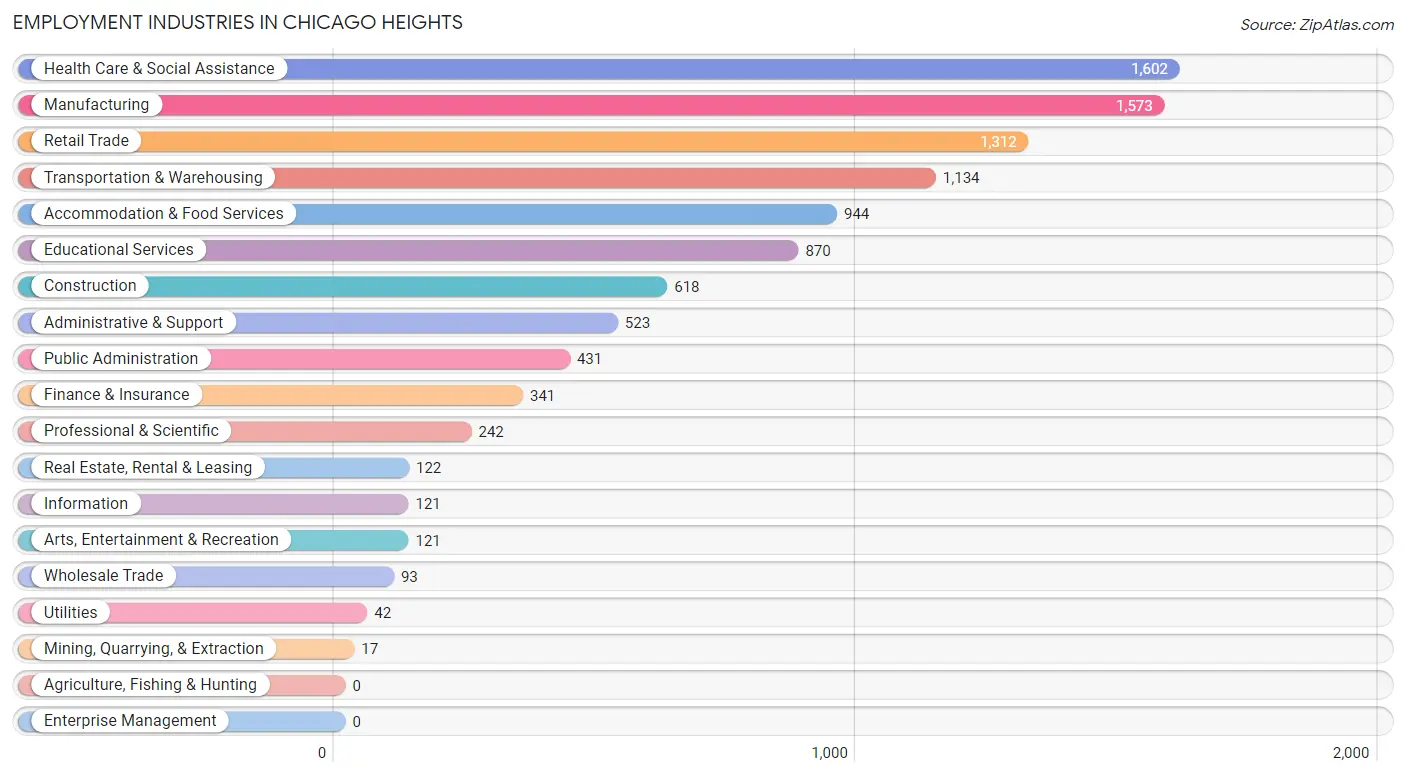
Employment Industries in Chicago Heights
The major employment industries in Chicago Heights include Health Care & Social Assistance (1,602 | 14.7%), Manufacturing (1,573 | 14.4%), Retail Trade (1,312 | 12.0%), Transportation & Warehousing (1,134 | 10.4%), and Accommodation & Food Services (944 | 8.7%).
Employment Industries by Sex in Chicago Heights
The Chicago Heights industries that see more men than women are Construction (100.0%), Arts, Entertainment & Recreation (91.7%), and Manufacturing (77.9%), whereas the industries that tend to have a higher number of women are Mining, Quarrying, & Extraction (100.0%), Finance & Insurance (83.9%), and Health Care & Social Assistance (81.1%).
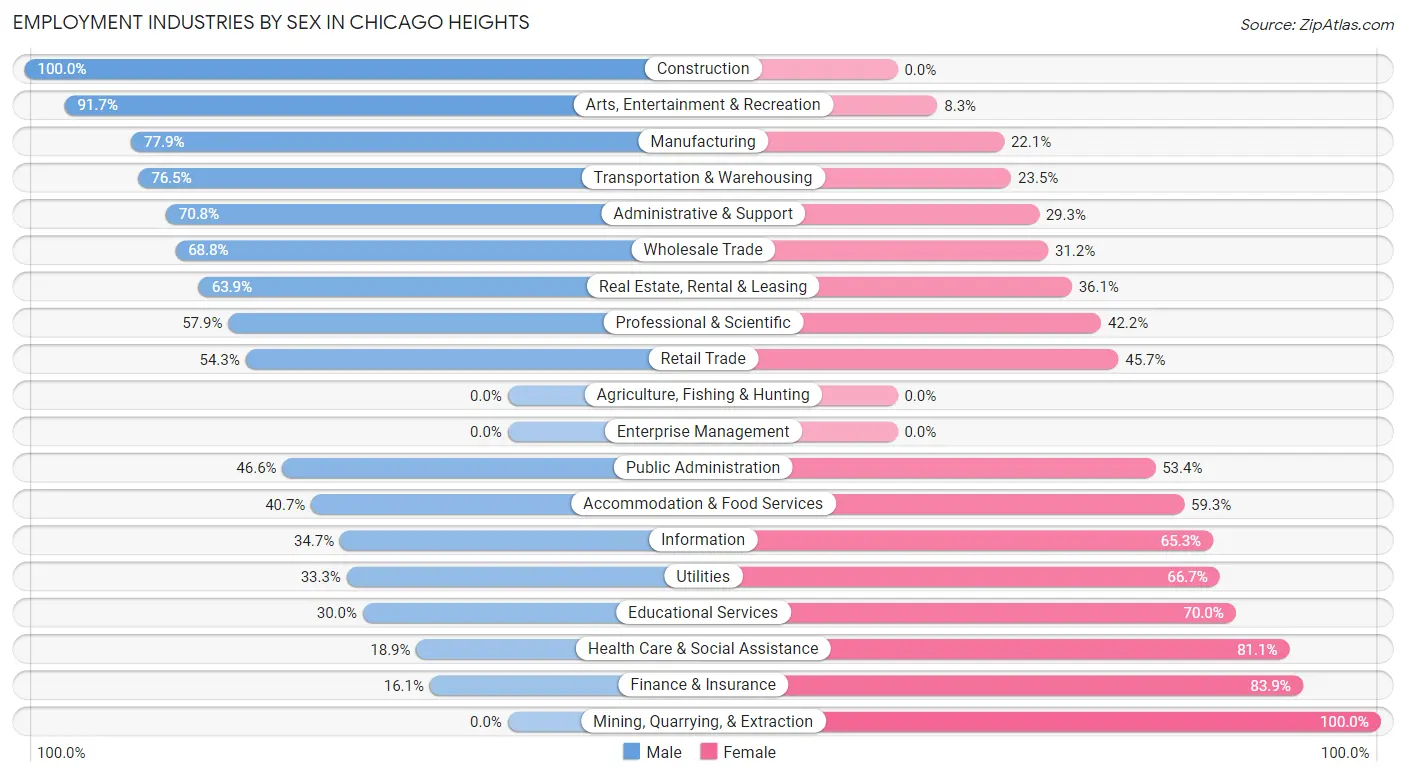
| Industry | Male | Female |
| Agriculture, Fishing & Hunting | 0 (0.0%) | 0 (0.0%) |
| Mining, Quarrying, & Extraction | 0 (0.0%) | 17 (100.0%) |
| Construction | 618 (100.0%) | 0 (0.0%) |
| Manufacturing | 1,226 (77.9%) | 347 (22.1%) |
| Wholesale Trade | 64 (68.8%) | 29 (31.2%) |
| Retail Trade | 712 (54.3%) | 600 (45.7%) |
| Transportation & Warehousing | 867 (76.5%) | 267 (23.5%) |
| Utilities | 14 (33.3%) | 28 (66.7%) |
| Information | 42 (34.7%) | 79 (65.3%) |
| Finance & Insurance | 55 (16.1%) | 286 (83.9%) |
| Real Estate, Rental & Leasing | 78 (63.9%) | 44 (36.1%) |
| Professional & Scientific | 140 (57.9%) | 102 (42.1%) |
| Enterprise Management | 0 (0.0%) | 0 (0.0%) |
| Administrative & Support | 370 (70.8%) | 153 (29.2%) |
| Educational Services | 261 (30.0%) | 609 (70.0%) |
| Health Care & Social Assistance | 303 (18.9%) | 1,299 (81.1%) |
| Arts, Entertainment & Recreation | 111 (91.7%) | 10 (8.3%) |
| Accommodation & Food Services | 384 (40.7%) | 560 (59.3%) |
| Public Administration | 201 (46.6%) | 230 (53.4%) |
| Total | 5,905 (54.2%) | 4,996 (45.8%) |
Education in Chicago Heights
School Enrollment in Chicago Heights
The most common levels of schooling among the 7,891 students in Chicago Heights are high school (2,210 | 28.0%), middle school (1,812 | 23.0%), and elementary school (1,731 | 21.9%).
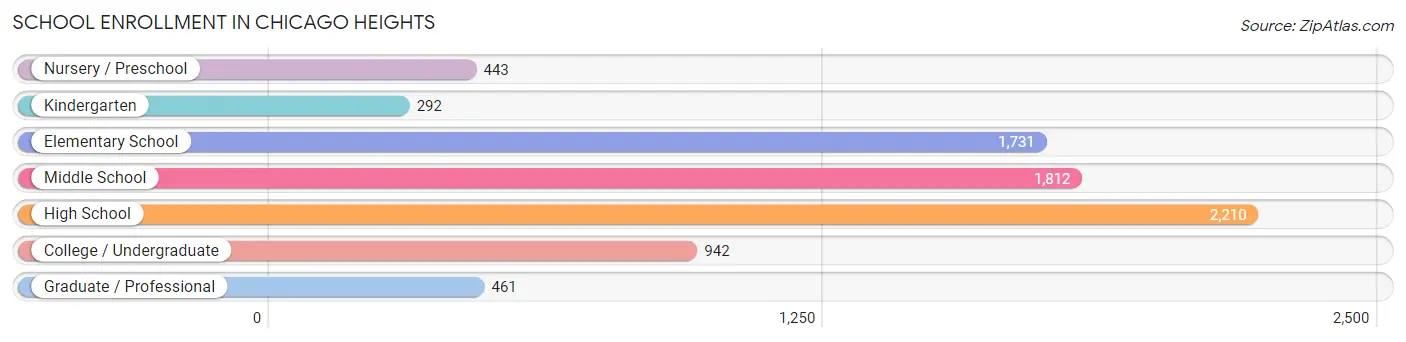
| School Level | # Students | % Students |
| Nursery / Preschool | 443 | 5.6% |
| Kindergarten | 292 | 3.7% |
| Elementary School | 1,731 | 21.9% |
| Middle School | 1,812 | 23.0% |
| High School | 2,210 | 28.0% |
| College / Undergraduate | 942 | 11.9% |
| Graduate / Professional | 461 | 5.8% |
| Total | 7,891 | 100.0% |
School Enrollment by Age by Funding Source in Chicago Heights
Out of a total of 7,891 students who are enrolled in schools in Chicago Heights, 718 (9.1%) attend a private institution, while the remaining 7,173 (90.9%) are enrolled in public schools. The age group of 35 years and over has the highest likelihood of being enrolled in private schools, with 257 (48.0% in the age bracket) enrolled. Conversely, the age group of 15 to 17 year olds has the lowest likelihood of being enrolled in a private school, with 1,566 (98.2% in the age bracket) attending a public institution.
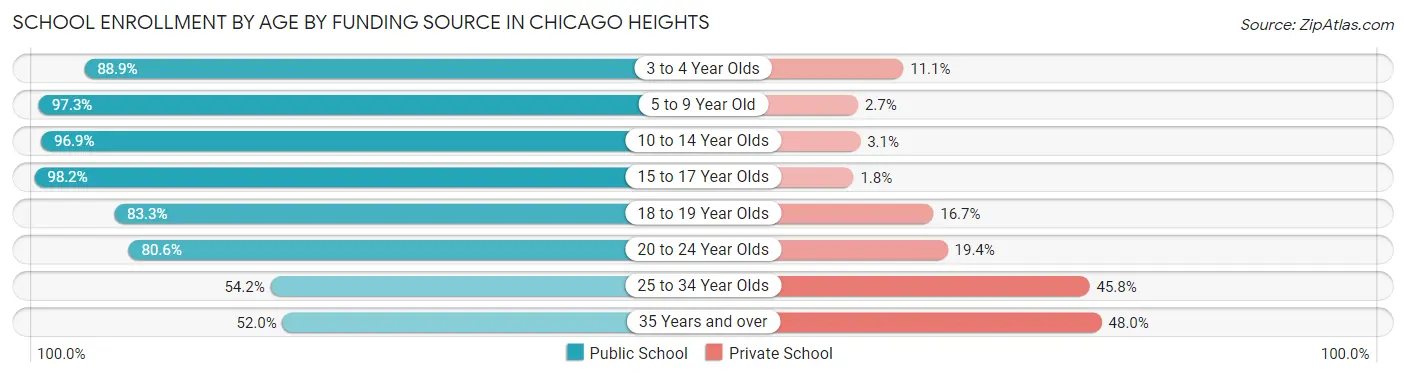
| Age Bracket | Public School | Private School |
| 3 to 4 Year Olds | 336 (88.9%) | 42 (11.1%) |
| 5 to 9 Year Old | 1,752 (97.3%) | 48 (2.7%) |
| 10 to 14 Year Olds | 2,203 (96.9%) | 70 (3.1%) |
| 15 to 17 Year Olds | 1,566 (98.2%) | 29 (1.8%) |
| 18 to 19 Year Olds | 539 (83.3%) | 108 (16.7%) |
| 20 to 24 Year Olds | 429 (80.6%) | 103 (19.4%) |
| 25 to 34 Year Olds | 71 (54.2%) | 60 (45.8%) |
| 35 Years and over | 278 (52.0%) | 257 (48.0%) |
| Total | 7,173 (90.9%) | 718 (9.1%) |
Educational Attainment by Field of Study in Chicago Heights
Business (806 | 21.9%), science & technology (488 | 13.3%), education (400 | 10.9%), psychology (332 | 9.0%), and arts & humanities (280 | 7.6%) are the most common fields of study among 3,675 individuals in Chicago Heights who have obtained a bachelor's degree or higher.
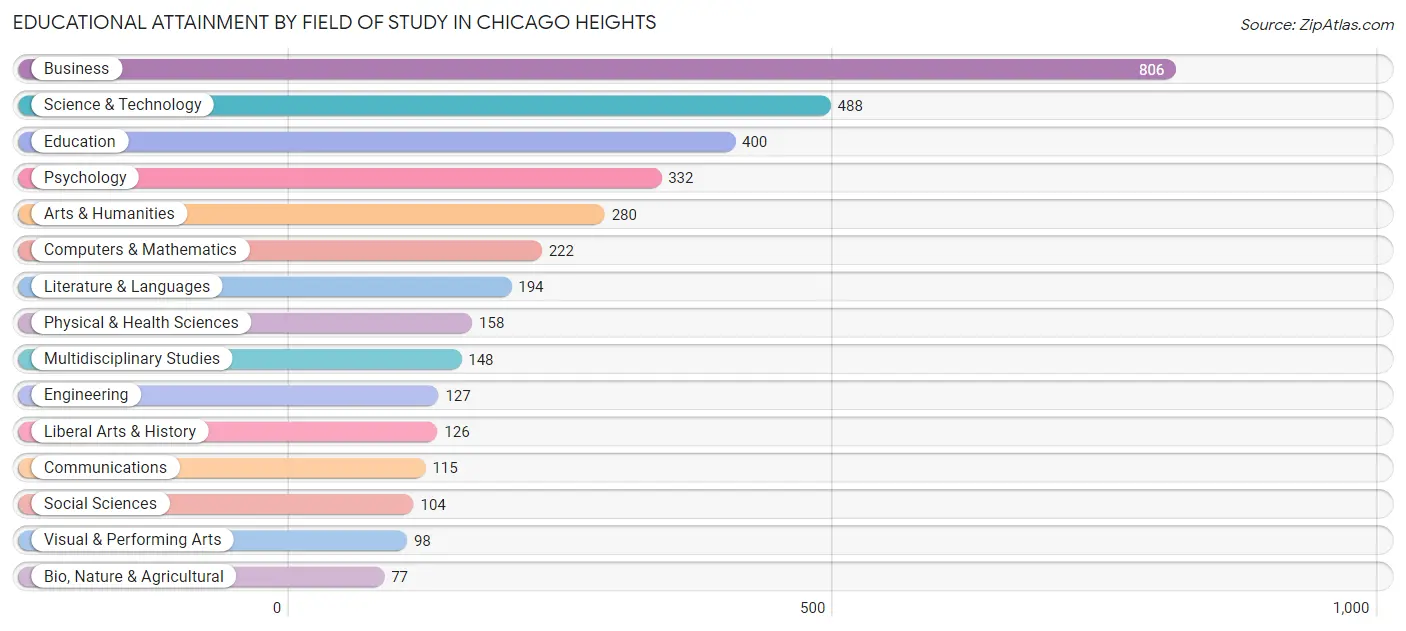
| Field of Study | # Graduates | % Graduates |
| Computers & Mathematics | 222 | 6.0% |
| Bio, Nature & Agricultural | 77 | 2.1% |
| Physical & Health Sciences | 158 | 4.3% |
| Psychology | 332 | 9.0% |
| Social Sciences | 104 | 2.8% |
| Engineering | 127 | 3.5% |
| Multidisciplinary Studies | 148 | 4.0% |
| Science & Technology | 488 | 13.3% |
| Business | 806 | 21.9% |
| Education | 400 | 10.9% |
| Literature & Languages | 194 | 5.3% |
| Liberal Arts & History | 126 | 3.4% |
| Visual & Performing Arts | 98 | 2.7% |
| Communications | 115 | 3.1% |
| Arts & Humanities | 280 | 7.6% |
| Total | 3,675 | 100.0% |
Transportation & Commute in Chicago Heights
Vehicle Availability by Sex in Chicago Heights
The most prevalent vehicle ownership categories in Chicago Heights are males with 2 vehicles (2,510, accounting for 43.0%) and females with 2 vehicles (1,906, making up 52.4%).
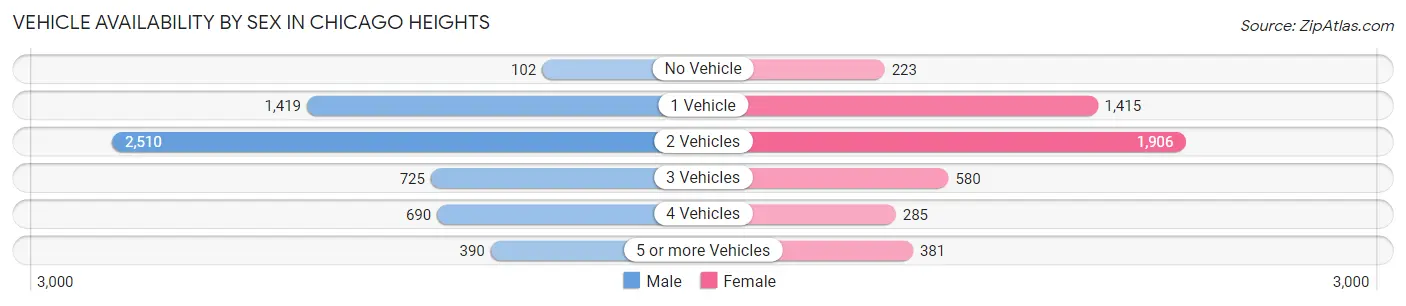
| Vehicles Available | Male | Female |
| No Vehicle | 102 (1.8%) | 223 (4.7%) |
| 1 Vehicle | 1,419 (24.3%) | 1,415 (29.5%) |
| 2 Vehicles | 2,510 (43.0%) | 1,906 (39.8%) |
| 3 Vehicles | 725 (12.4%) | 580 (12.1%) |
| 4 Vehicles | 690 (11.8%) | 285 (5.9%) |
| 5 or more Vehicles | 390 (6.7%) | 381 (8.0%) |
| Total | 5,836 (100.0%) | 4,790 (100.0%) |
Commute Time in Chicago Heights
The most frequently occuring commute durations in Chicago Heights are 10 to 14 minutes (1,467 commuters, 14.7%), 30 to 34 minutes (1,461 commuters, 14.6%), and 20 to 24 minutes (1,440 commuters, 14.4%).
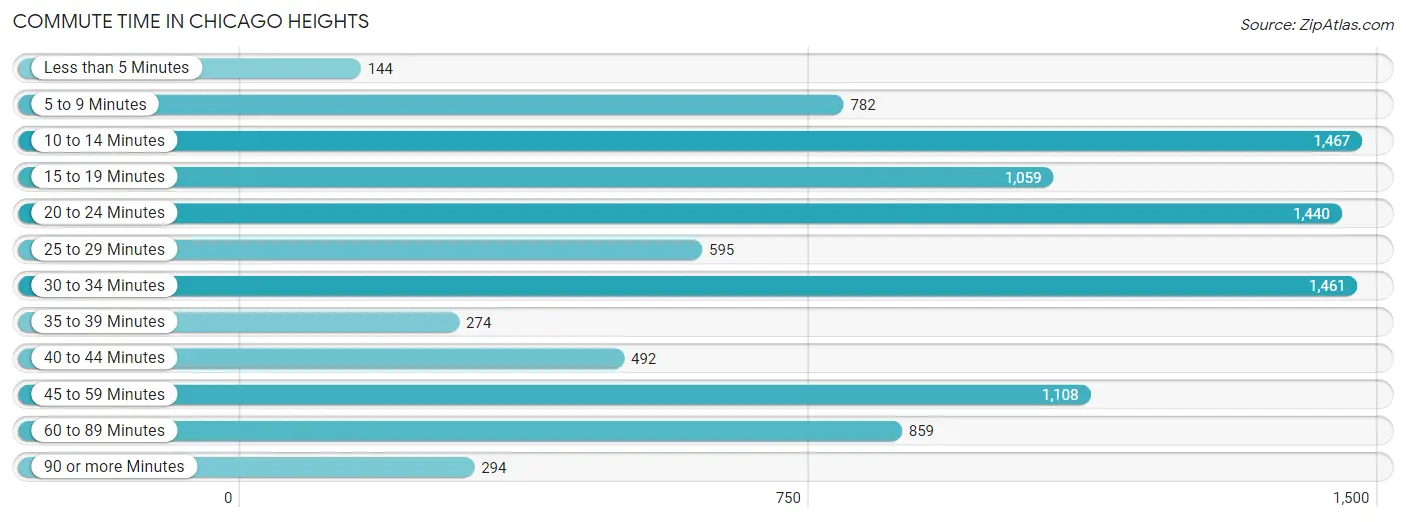
| Commute Time | # Commuters | % Commuters |
| Less than 5 Minutes | 144 | 1.4% |
| 5 to 9 Minutes | 782 | 7.8% |
| 10 to 14 Minutes | 1,467 | 14.7% |
| 15 to 19 Minutes | 1,059 | 10.6% |
| 20 to 24 Minutes | 1,440 | 14.4% |
| 25 to 29 Minutes | 595 | 6.0% |
| 30 to 34 Minutes | 1,461 | 14.6% |
| 35 to 39 Minutes | 274 | 2.8% |
| 40 to 44 Minutes | 492 | 4.9% |
| 45 to 59 Minutes | 1,108 | 11.1% |
| 60 to 89 Minutes | 859 | 8.6% |
| 90 or more Minutes | 294 | 2.9% |
Commute Time by Sex in Chicago Heights
The most common commute times in Chicago Heights are 20 to 24 minutes (967 commuters, 17.2%) for males and 10 to 14 minutes (710 commuters, 16.3%) for females.
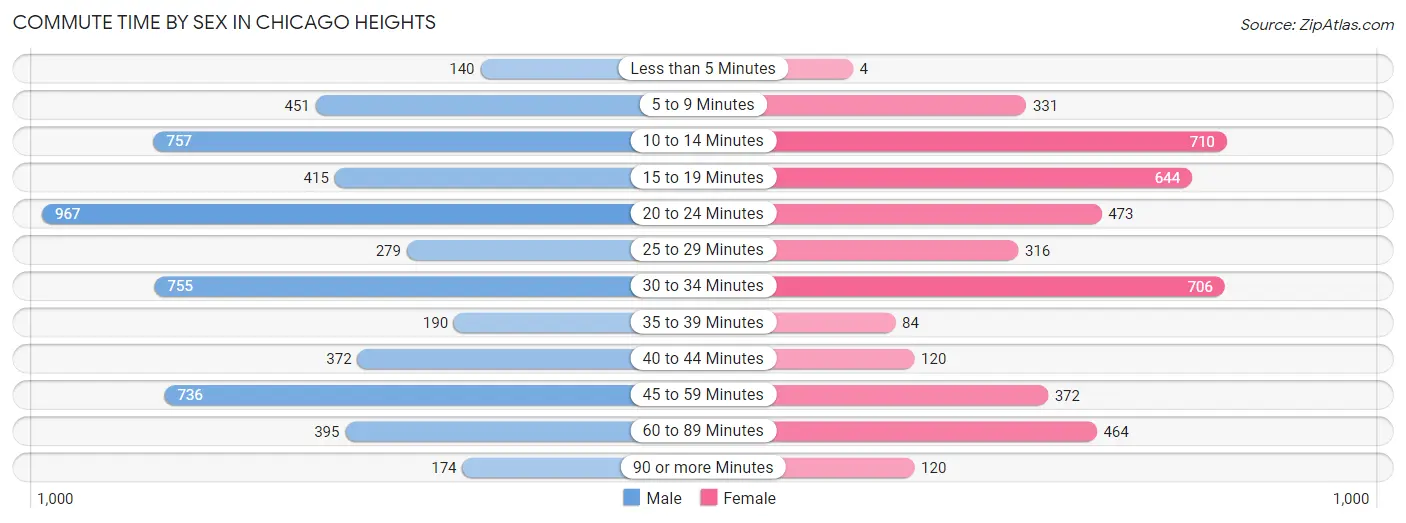
| Commute Time | Male | Female |
| Less than 5 Minutes | 140 (2.5%) | 4 (0.1%) |
| 5 to 9 Minutes | 451 (8.0%) | 331 (7.6%) |
| 10 to 14 Minutes | 757 (13.4%) | 710 (16.3%) |
| 15 to 19 Minutes | 415 (7.4%) | 644 (14.8%) |
| 20 to 24 Minutes | 967 (17.2%) | 473 (10.9%) |
| 25 to 29 Minutes | 279 (5.0%) | 316 (7.3%) |
| 30 to 34 Minutes | 755 (13.4%) | 706 (16.3%) |
| 35 to 39 Minutes | 190 (3.4%) | 84 (1.9%) |
| 40 to 44 Minutes | 372 (6.6%) | 120 (2.8%) |
| 45 to 59 Minutes | 736 (13.1%) | 372 (8.6%) |
| 60 to 89 Minutes | 395 (7.0%) | 464 (10.7%) |
| 90 or more Minutes | 174 (3.1%) | 120 (2.8%) |
Time of Departure to Work by Sex in Chicago Heights
The most frequent times of departure to work in Chicago Heights are 6:00 AM to 6:29 AM (858, 15.2%) for males and 7:00 AM to 7:29 AM (722, 16.6%) for females.
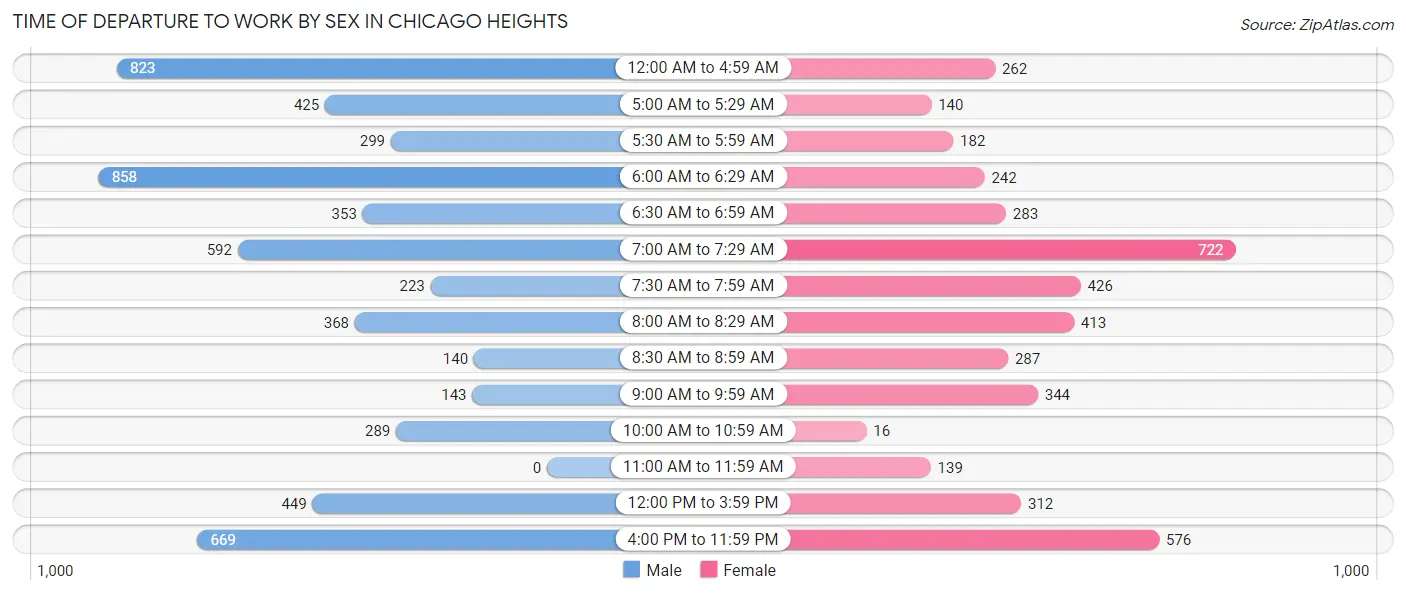
| Time of Departure | Male | Female |
| 12:00 AM to 4:59 AM | 823 (14.6%) | 262 (6.0%) |
| 5:00 AM to 5:29 AM | 425 (7.5%) | 140 (3.2%) |
| 5:30 AM to 5:59 AM | 299 (5.3%) | 182 (4.2%) |
| 6:00 AM to 6:29 AM | 858 (15.2%) | 242 (5.6%) |
| 6:30 AM to 6:59 AM | 353 (6.3%) | 283 (6.5%) |
| 7:00 AM to 7:29 AM | 592 (10.5%) | 722 (16.6%) |
| 7:30 AM to 7:59 AM | 223 (4.0%) | 426 (9.8%) |
| 8:00 AM to 8:29 AM | 368 (6.5%) | 413 (9.5%) |
| 8:30 AM to 8:59 AM | 140 (2.5%) | 287 (6.6%) |
| 9:00 AM to 9:59 AM | 143 (2.5%) | 344 (7.9%) |
| 10:00 AM to 10:59 AM | 289 (5.1%) | 16 (0.4%) |
| 11:00 AM to 11:59 AM | 0 (0.0%) | 139 (3.2%) |
| 12:00 PM to 3:59 PM | 449 (8.0%) | 312 (7.2%) |
| 4:00 PM to 11:59 PM | 669 (11.9%) | 576 (13.3%) |
| Total | 5,631 (100.0%) | 4,344 (100.0%) |
Housing Occupancy in Chicago Heights
Occupancy by Ownership in Chicago Heights
Of the total 9,186 dwellings in Chicago Heights, owner-occupied units account for 5,778 (62.9%), while renter-occupied units make up 3,408 (37.1%).
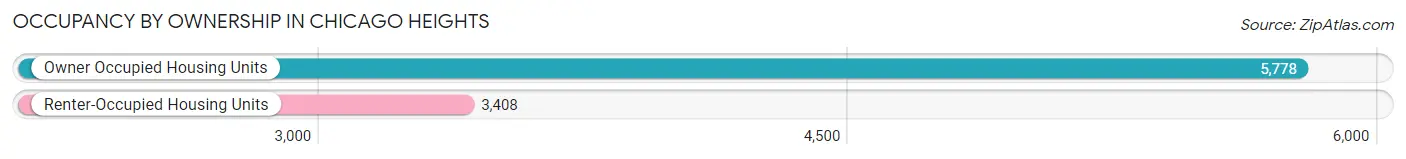
| Occupancy | # Housing Units | % Housing Units |
| Owner Occupied Housing Units | 5,778 | 62.9% |
| Renter-Occupied Housing Units | 3,408 | 37.1% |
| Total Occupied Housing Units | 9,186 | 100.0% |
Occupancy by Household Size in Chicago Heights
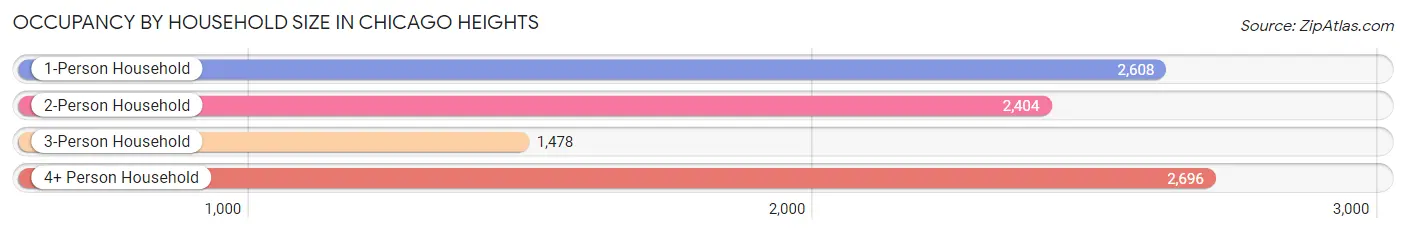
| Household Size | # Housing Units | % Housing Units |
| 1-Person Household | 2,608 | 28.4% |
| 2-Person Household | 2,404 | 26.2% |
| 3-Person Household | 1,478 | 16.1% |
| 4+ Person Household | 2,696 | 29.3% |
| Total Housing Units | 9,186 | 100.0% |
Occupancy by Ownership by Household Size in Chicago Heights
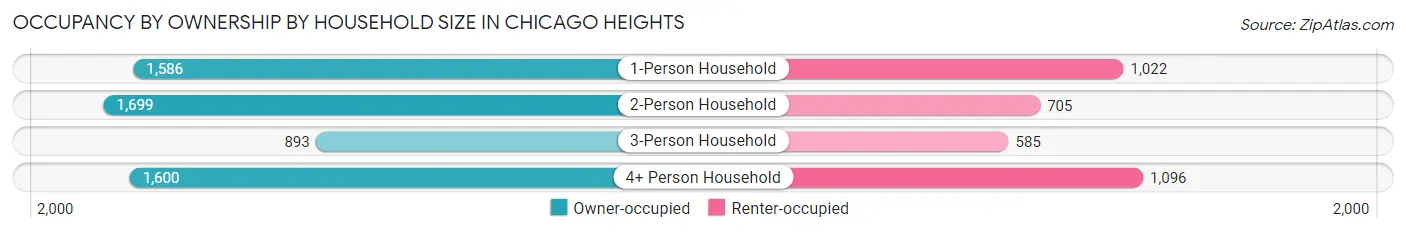
| Household Size | Owner-occupied | Renter-occupied |
| 1-Person Household | 1,586 (60.8%) | 1,022 (39.2%) |
| 2-Person Household | 1,699 (70.7%) | 705 (29.3%) |
| 3-Person Household | 893 (60.4%) | 585 (39.6%) |
| 4+ Person Household | 1,600 (59.4%) | 1,096 (40.6%) |
| Total Housing Units | 5,778 (62.9%) | 3,408 (37.1%) |
Occupancy by Educational Attainment in Chicago Heights
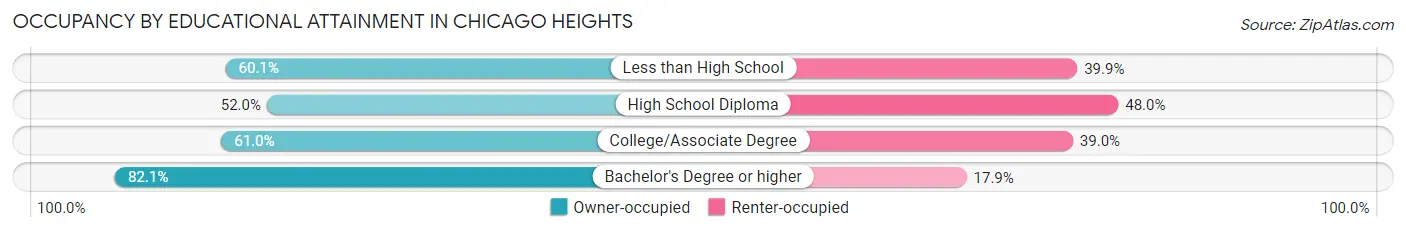
| Household Size | Owner-occupied | Renter-occupied |
| Less than High School | 599 (60.1%) | 397 (39.9%) |
| High School Diploma | 1,571 (52.0%) | 1,451 (48.0%) |
| College/Associate Degree | 1,832 (61.0%) | 1,172 (39.0%) |
| Bachelor's Degree or higher | 1,776 (82.1%) | 388 (17.9%) |
Occupancy by Age of Householder in Chicago Heights

| Age Bracket | # Households | % Households |
| Under 35 Years | 1,313 | 14.3% |
| 35 to 44 Years | 1,754 | 19.1% |
| 45 to 54 Years | 1,912 | 20.8% |
| 55 to 64 Years | 1,899 | 20.7% |
| 65 to 74 Years | 1,388 | 15.1% |
| 75 to 84 Years | 637 | 6.9% |
| 85 Years and Over | 283 | 3.1% |
| Total | 9,186 | 100.0% |
Housing Finances in Chicago Heights
Median Income by Occupancy in Chicago Heights
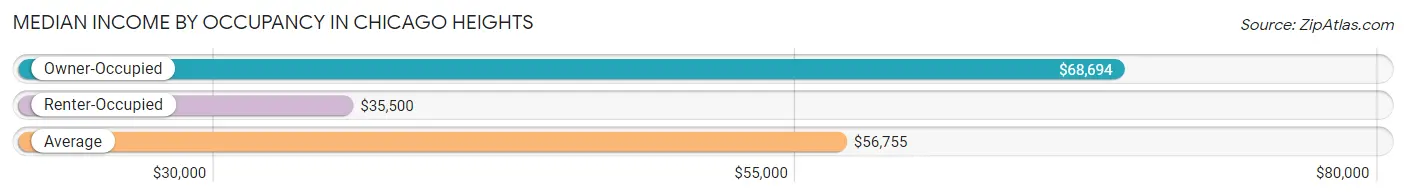
| Occupancy Type | # Households | Median Income |
| Owner-Occupied | 5,778 (62.9%) | $68,694 |
| Renter-Occupied | 3,408 (37.1%) | $35,500 |
| Average | 9,186 (100.0%) | $56,755 |
Occupancy by Householder Income Bracket in Chicago Heights
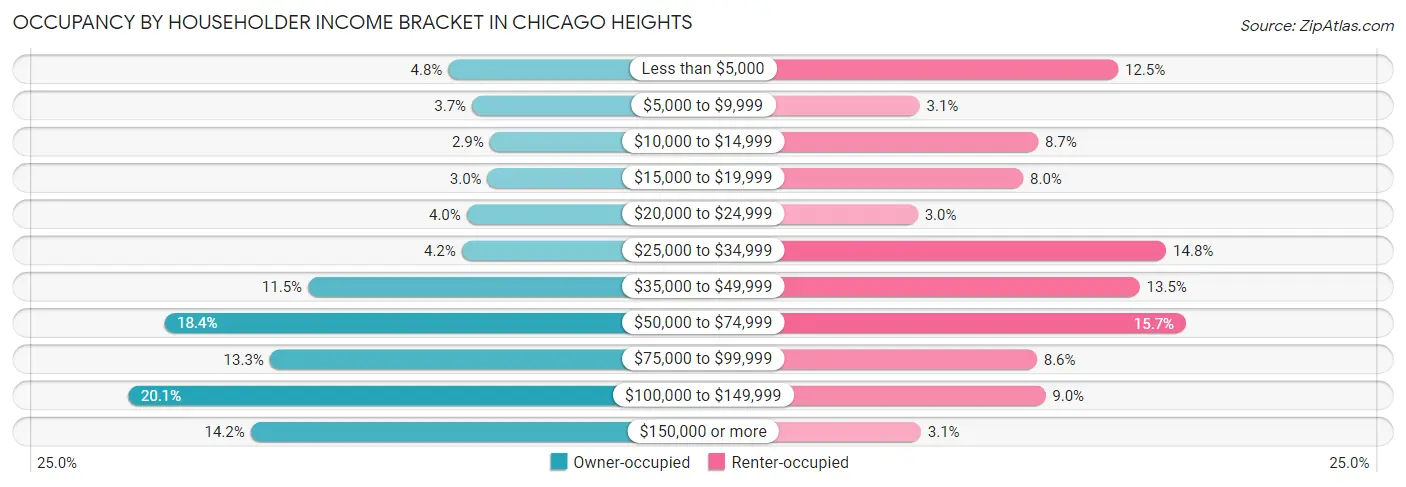
| Income Bracket | Owner-occupied | Renter-occupied |
| Less than $5,000 | 279 (4.8%) | 426 (12.5%) |
| $5,000 to $9,999 | 214 (3.7%) | 104 (3.0%) |
| $10,000 to $14,999 | 165 (2.9%) | 296 (8.7%) |
| $15,000 to $19,999 | 171 (3.0%) | 272 (8.0%) |
| $20,000 to $24,999 | 228 (4.0%) | 101 (3.0%) |
| $25,000 to $34,999 | 242 (4.2%) | 504 (14.8%) |
| $35,000 to $49,999 | 665 (11.5%) | 461 (13.5%) |
| $50,000 to $74,999 | 1,061 (18.4%) | 536 (15.7%) |
| $75,000 to $99,999 | 770 (13.3%) | 294 (8.6%) |
| $100,000 to $149,999 | 1,160 (20.1%) | 308 (9.0%) |
| $150,000 or more | 823 (14.2%) | 106 (3.1%) |
| Total | 5,778 (100.0%) | 3,408 (100.0%) |
Monthly Housing Cost Tiers in Chicago Heights
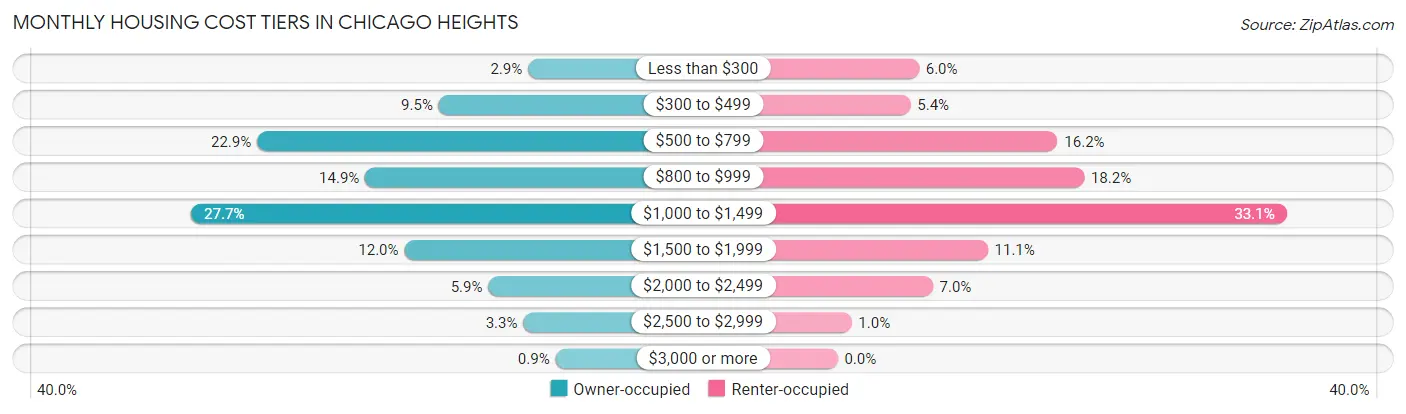
| Monthly Cost | Owner-occupied | Renter-occupied |
| Less than $300 | 169 (2.9%) | 204 (6.0%) |
| $300 to $499 | 549 (9.5%) | 183 (5.4%) |
| $500 to $799 | 1,322 (22.9%) | 552 (16.2%) |
| $800 to $999 | 862 (14.9%) | 619 (18.2%) |
| $1,000 to $1,499 | 1,602 (27.7%) | 1,127 (33.1%) |
| $1,500 to $1,999 | 695 (12.0%) | 377 (11.1%) |
| $2,000 to $2,499 | 338 (5.9%) | 239 (7.0%) |
| $2,500 to $2,999 | 189 (3.3%) | 35 (1.0%) |
| $3,000 or more | 52 (0.9%) | 0 (0.0%) |
| Total | 5,778 (100.0%) | 3,408 (100.0%) |
Physical Housing Characteristics in Chicago Heights
Housing Structures in Chicago Heights
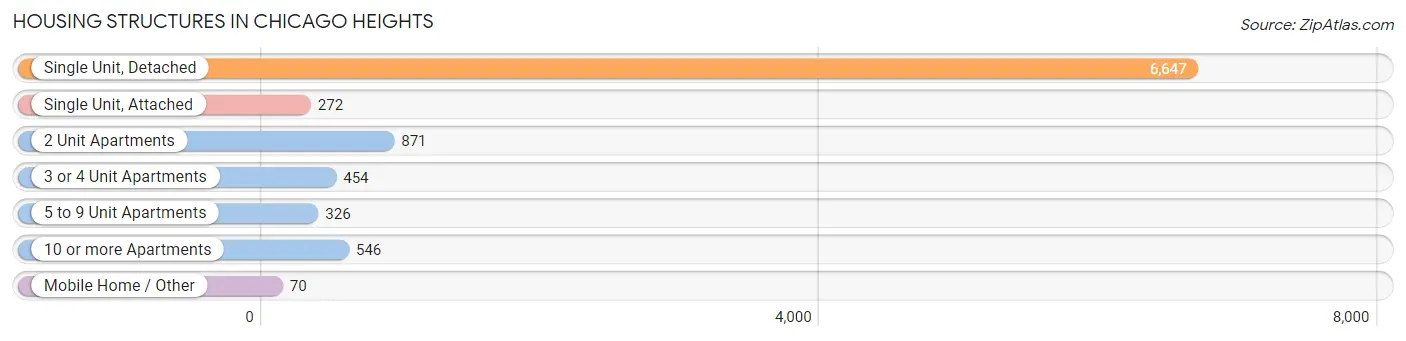
| Structure Type | # Housing Units | % Housing Units |
| Single Unit, Detached | 6,647 | 72.4% |
| Single Unit, Attached | 272 | 3.0% |
| 2 Unit Apartments | 871 | 9.5% |
| 3 or 4 Unit Apartments | 454 | 4.9% |
| 5 to 9 Unit Apartments | 326 | 3.5% |
| 10 or more Apartments | 546 | 5.9% |
| Mobile Home / Other | 70 | 0.8% |
| Total | 9,186 | 100.0% |
Housing Structures by Occupancy in Chicago Heights
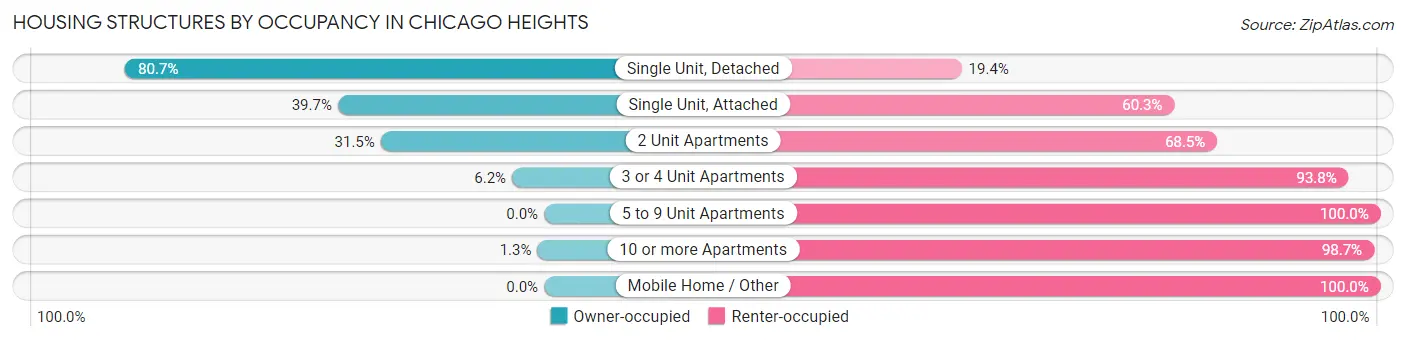
| Structure Type | Owner-occupied | Renter-occupied |
| Single Unit, Detached | 5,361 (80.6%) | 1,286 (19.4%) |
| Single Unit, Attached | 108 (39.7%) | 164 (60.3%) |
| 2 Unit Apartments | 274 (31.5%) | 597 (68.5%) |
| 3 or 4 Unit Apartments | 28 (6.2%) | 426 (93.8%) |
| 5 to 9 Unit Apartments | 0 (0.0%) | 326 (100.0%) |
| 10 or more Apartments | 7 (1.3%) | 539 (98.7%) |
| Mobile Home / Other | 0 (0.0%) | 70 (100.0%) |
| Total | 5,778 (62.9%) | 3,408 (37.1%) |
Housing Structures by Number of Rooms in Chicago Heights
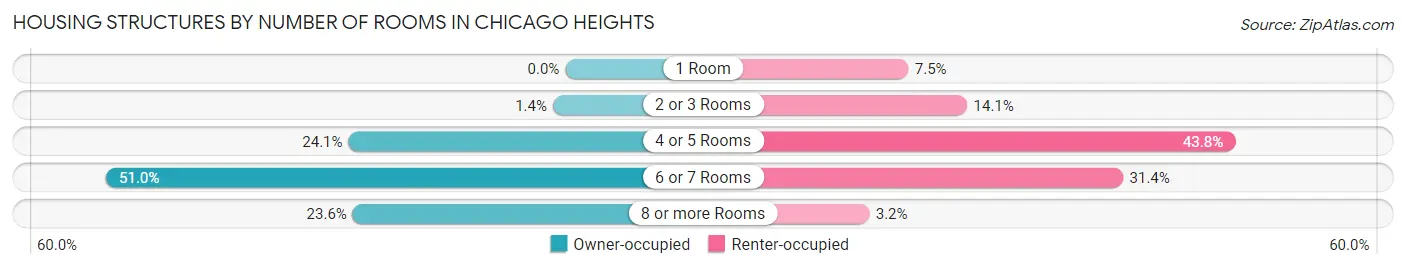
| Number of Rooms | Owner-occupied | Renter-occupied |
| 1 Room | 0 (0.0%) | 257 (7.5%) |
| 2 or 3 Rooms | 80 (1.4%) | 479 (14.1%) |
| 4 or 5 Rooms | 1,391 (24.1%) | 1,494 (43.8%) |
| 6 or 7 Rooms | 2,944 (50.9%) | 1,069 (31.4%) |
| 8 or more Rooms | 1,363 (23.6%) | 109 (3.2%) |
| Total | 5,778 (100.0%) | 3,408 (100.0%) |
Housing Structure by Heating Type in Chicago Heights
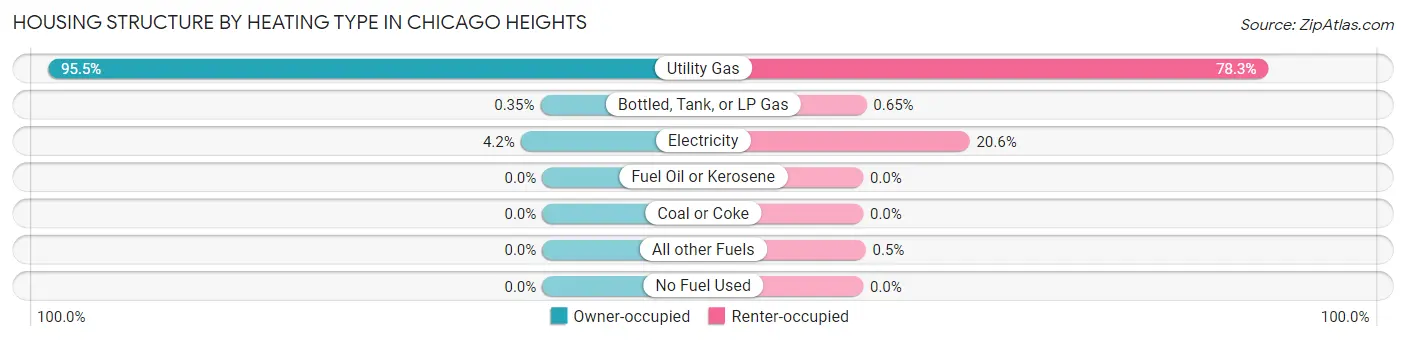
| Heating Type | Owner-occupied | Renter-occupied |
| Utility Gas | 5,517 (95.5%) | 2,668 (78.3%) |
| Bottled, Tank, or LP Gas | 20 (0.4%) | 22 (0.6%) |
| Electricity | 241 (4.2%) | 701 (20.6%) |
| Fuel Oil or Kerosene | 0 (0.0%) | 0 (0.0%) |
| Coal or Coke | 0 (0.0%) | 0 (0.0%) |
| All other Fuels | 0 (0.0%) | 17 (0.5%) |
| No Fuel Used | 0 (0.0%) | 0 (0.0%) |
| Total | 5,778 (100.0%) | 3,408 (100.0%) |
Household Vehicle Usage in Chicago Heights
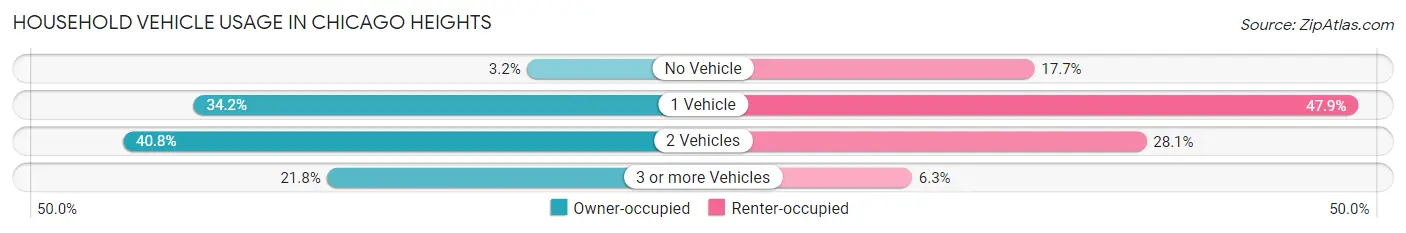
| Vehicles per Household | Owner-occupied | Renter-occupied |
| No Vehicle | 182 (3.2%) | 603 (17.7%) |
| 1 Vehicle | 1,977 (34.2%) | 1,633 (47.9%) |
| 2 Vehicles | 2,358 (40.8%) | 959 (28.1%) |
| 3 or more Vehicles | 1,261 (21.8%) | 213 (6.2%) |
| Total | 5,778 (100.0%) | 3,408 (100.0%) |
Real Estate & Mortgages in Chicago Heights
Real Estate and Mortgage Overview in Chicago Heights
| Characteristic | Without Mortgage | With Mortgage |
| Housing Units | 2,767 | 3,011 |
| Median Property Value | $120,500 | $149,000 |
| Median Household Income | $59,063 | $514 |
| Monthly Housing Costs | $691 | $52 |
| Real Estate Taxes | $3,694 | $113 |
Property Value by Mortgage Status in Chicago Heights
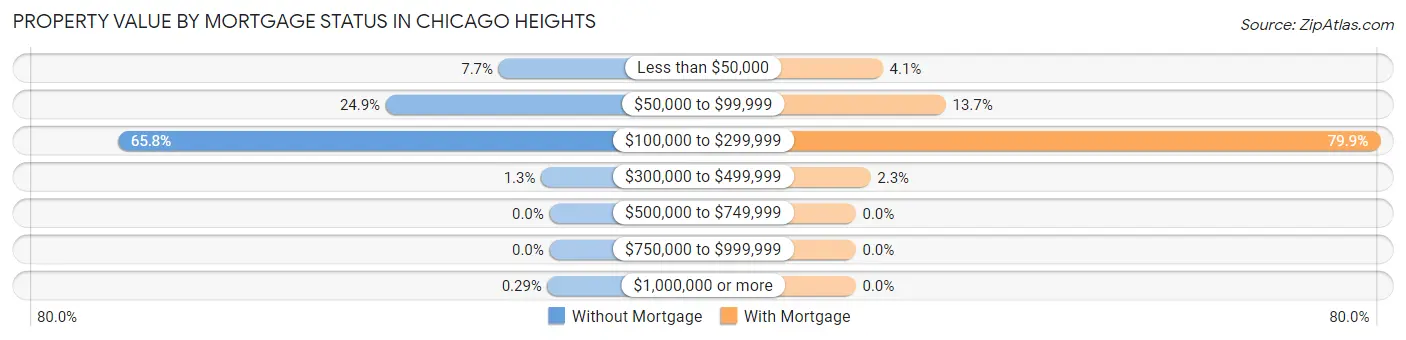
| Property Value | Without Mortgage | With Mortgage |
| Less than $50,000 | 214 (7.7%) | 124 (4.1%) |
| $50,000 to $99,999 | 690 (24.9%) | 413 (13.7%) |
| $100,000 to $299,999 | 1,820 (65.8%) | 2,406 (79.9%) |
| $300,000 to $499,999 | 35 (1.3%) | 68 (2.3%) |
| $500,000 to $749,999 | 0 (0.0%) | 0 (0.0%) |
| $750,000 to $999,999 | 0 (0.0%) | 0 (0.0%) |
| $1,000,000 or more | 8 (0.3%) | 0 (0.0%) |
| Total | 2,767 (100.0%) | 3,011 (100.0%) |
Household Income by Mortgage Status in Chicago Heights
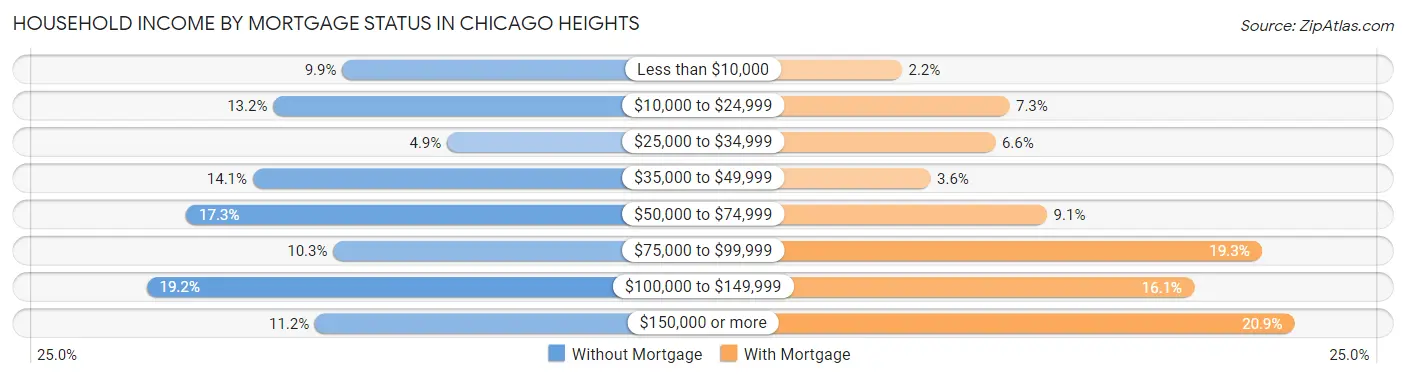
| Household Income | Without Mortgage | With Mortgage |
| Less than $10,000 | 273 (9.9%) | 66 (2.2%) |
| $10,000 to $24,999 | 364 (13.2%) | 220 (7.3%) |
| $25,000 to $34,999 | 135 (4.9%) | 200 (6.6%) |
| $35,000 to $49,999 | 391 (14.1%) | 107 (3.5%) |
| $50,000 to $74,999 | 479 (17.3%) | 274 (9.1%) |
| $75,000 to $99,999 | 285 (10.3%) | 582 (19.3%) |
| $100,000 to $149,999 | 531 (19.2%) | 485 (16.1%) |
| $150,000 or more | 309 (11.2%) | 629 (20.9%) |
| Total | 2,767 (100.0%) | 3,011 (100.0%) |
Property Value to Household Income Ratio in Chicago Heights
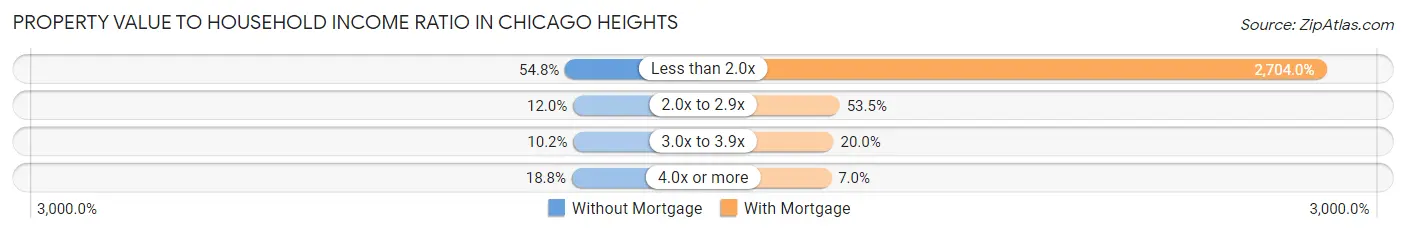
| Value-to-Income Ratio | Without Mortgage | With Mortgage |
| Less than 2.0x | 1,517 (54.8%) | 81,418 (2,704.0%) |
| 2.0x to 2.9x | 331 (12.0%) | 1,611 (53.5%) |
| 3.0x to 3.9x | 282 (10.2%) | 602 (20.0%) |
| 4.0x or more | 521 (18.8%) | 212 (7.0%) |
| Total | 2,767 (100.0%) | 3,011 (100.0%) |
Real Estate Taxes by Mortgage Status in Chicago Heights

| Property Taxes | Without Mortgage | With Mortgage |
| Less than $800 | 155 (5.6%) | 18 (0.6%) |
| $800 to $1,499 | 160 (5.8%) | 206 (6.8%) |
| $800 to $1,499 | 2,124 (76.8%) | 146 (4.9%) |
| Total | 2,767 (100.0%) | 3,011 (100.0%) |
Health & Disability in Chicago Heights
Health Insurance Coverage by Age in Chicago Heights
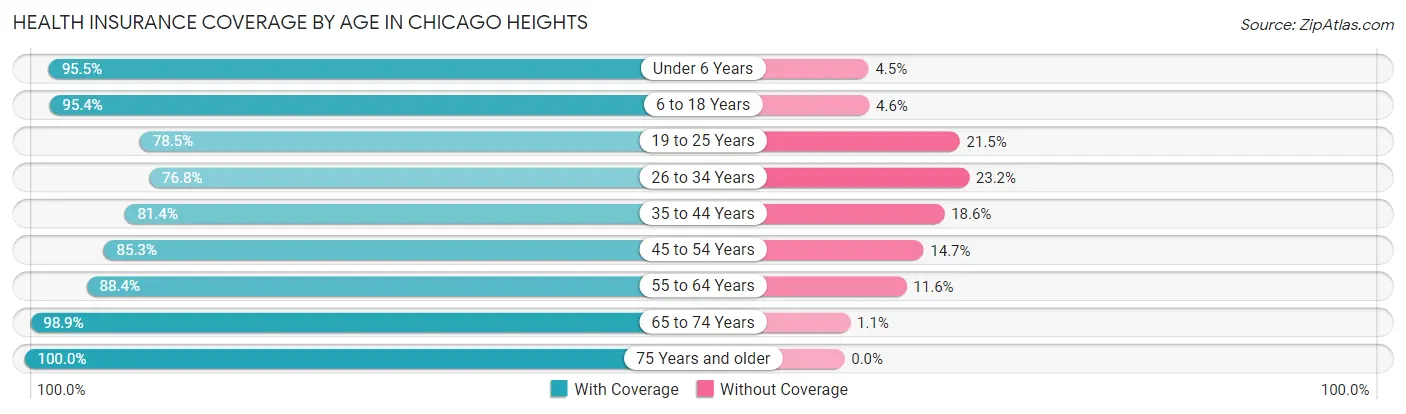
| Age Bracket | With Coverage | Without Coverage |
| Under 6 Years | 1,736 (95.5%) | 82 (4.5%) |
| 6 to 18 Years | 5,826 (95.4%) | 283 (4.6%) |
| 19 to 25 Years | 2,063 (78.5%) | 565 (21.5%) |
| 26 to 34 Years | 2,066 (76.8%) | 625 (23.2%) |
| 35 to 44 Years | 2,949 (81.4%) | 675 (18.6%) |
| 45 to 54 Years | 3,049 (85.3%) | 527 (14.7%) |
| 55 to 64 Years | 2,741 (88.4%) | 359 (11.6%) |
| 65 to 74 Years | 2,109 (98.9%) | 23 (1.1%) |
| 75 Years and older | 1,290 (100.0%) | 0 (0.0%) |
| Total | 23,829 (88.4%) | 3,139 (11.6%) |
Health Insurance Coverage by Citizenship Status in Chicago Heights

| Citizenship Status | With Coverage | Without Coverage |
| Native Born | 1,736 (95.5%) | 82 (4.5%) |
| Foreign Born, Citizen | 5,826 (95.4%) | 283 (4.6%) |
| Foreign Born, not a Citizen | 2,063 (78.5%) | 565 (21.5%) |
Health Insurance Coverage by Household Income in Chicago Heights
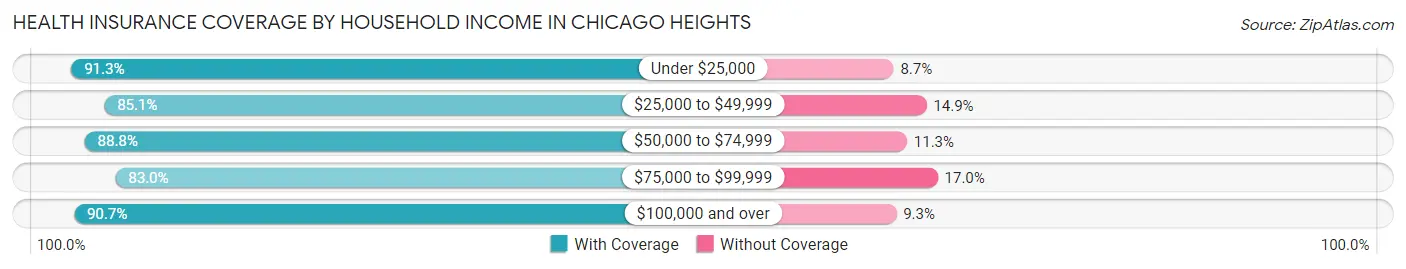
| Household Income | With Coverage | Without Coverage |
| Under $25,000 | 4,470 (91.3%) | 428 (8.7%) |
| $25,000 to $49,999 | 4,476 (85.1%) | 785 (14.9%) |
| $50,000 to $74,999 | 4,592 (88.7%) | 582 (11.3%) |
| $75,000 to $99,999 | 2,679 (83.0%) | 549 (17.0%) |
| $100,000 and over | 7,285 (90.7%) | 743 (9.3%) |
Public vs Private Health Insurance Coverage by Age in Chicago Heights
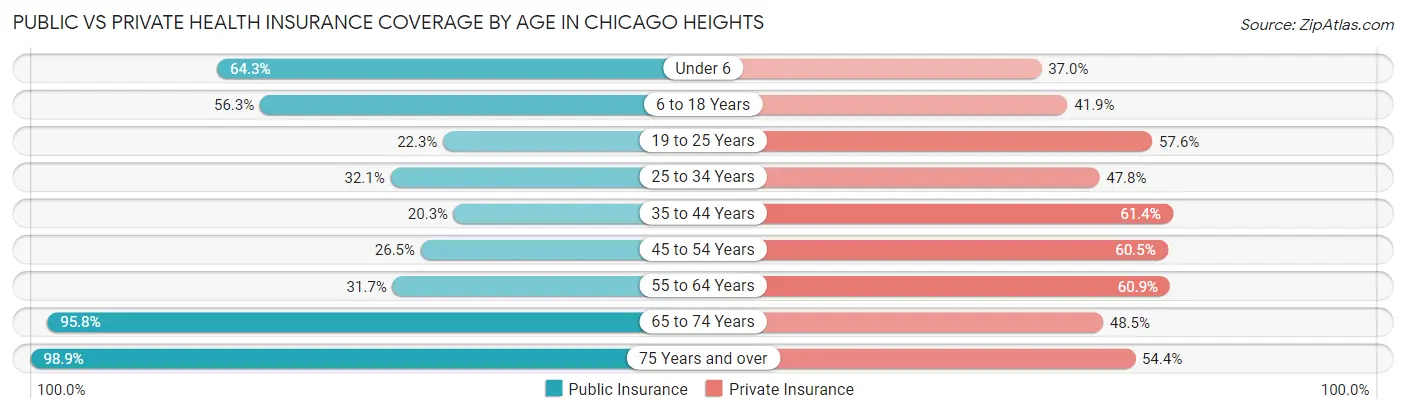
| Age Bracket | Public Insurance | Private Insurance |
| Under 6 | 1,168 (64.2%) | 673 (37.0%) |
| 6 to 18 Years | 3,439 (56.3%) | 2,558 (41.9%) |
| 19 to 25 Years | 586 (22.3%) | 1,514 (57.6%) |
| 25 to 34 Years | 863 (32.1%) | 1,286 (47.8%) |
| 35 to 44 Years | 736 (20.3%) | 2,224 (61.4%) |
| 45 to 54 Years | 946 (26.5%) | 2,162 (60.5%) |
| 55 to 64 Years | 982 (31.7%) | 1,888 (60.9%) |
| 65 to 74 Years | 2,042 (95.8%) | 1,033 (48.4%) |
| 75 Years and over | 1,276 (98.9%) | 702 (54.4%) |
| Total | 12,038 (44.6%) | 14,040 (52.1%) |
Disability Status by Sex by Age in Chicago Heights
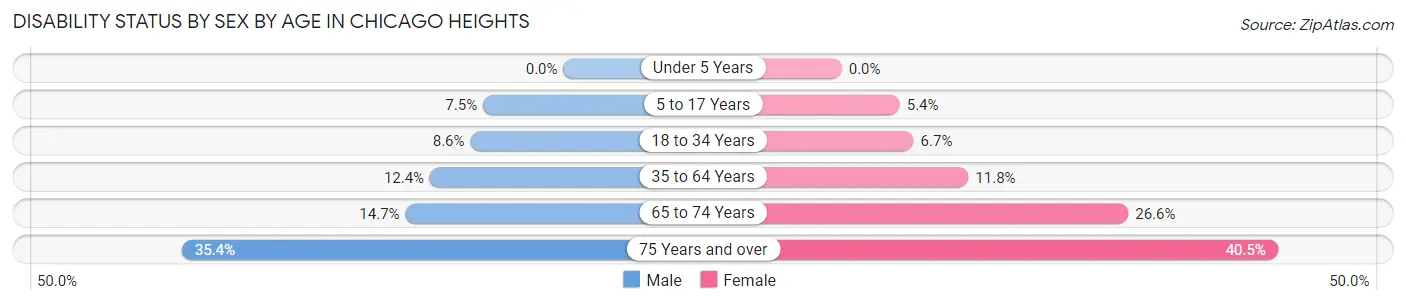
| Age Bracket | Male | Female |
| Under 5 Years | 0 (0.0%) | 0 (0.0%) |
| 5 to 17 Years | 206 (7.5%) | 162 (5.4%) |
| 18 to 34 Years | 270 (8.6%) | 184 (6.7%) |
| 35 to 64 Years | 587 (12.4%) | 653 (11.7%) |
| 65 to 74 Years | 156 (14.7%) | 284 (26.6%) |
| 75 Years and over | 188 (35.4%) | 307 (40.5%) |
Disability Class by Sex by Age in Chicago Heights
Disability Class: Hearing Difficulty
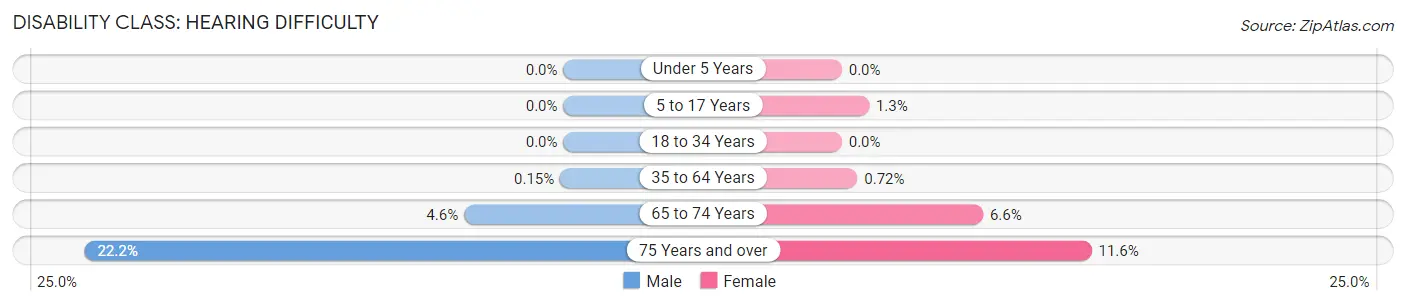
| Age Bracket | Male | Female |
| Under 5 Years | 0 (0.0%) | 0 (0.0%) |
| 5 to 17 Years | 0 (0.0%) | 38 (1.3%) |
| 18 to 34 Years | 0 (0.0%) | 0 (0.0%) |
| 35 to 64 Years | 7 (0.2%) | 40 (0.7%) |
| 65 to 74 Years | 49 (4.6%) | 70 (6.6%) |
| 75 Years and over | 118 (22.2%) | 88 (11.6%) |
Disability Class: Vision Difficulty
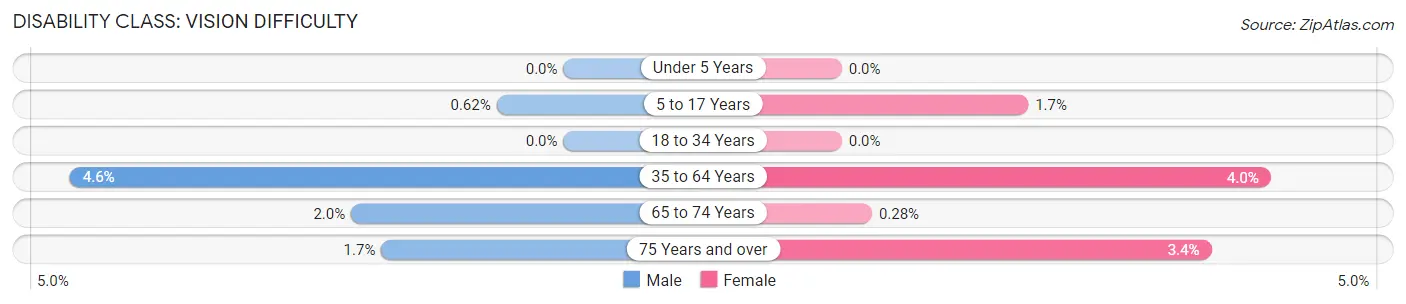
| Age Bracket | Male | Female |
| Under 5 Years | 0 (0.0%) | 0 (0.0%) |
| 5 to 17 Years | 17 (0.6%) | 52 (1.7%) |
| 18 to 34 Years | 0 (0.0%) | 0 (0.0%) |
| 35 to 64 Years | 217 (4.6%) | 221 (4.0%) |
| 65 to 74 Years | 21 (2.0%) | 3 (0.3%) |
| 75 Years and over | 9 (1.7%) | 26 (3.4%) |
Disability Class: Cognitive Difficulty
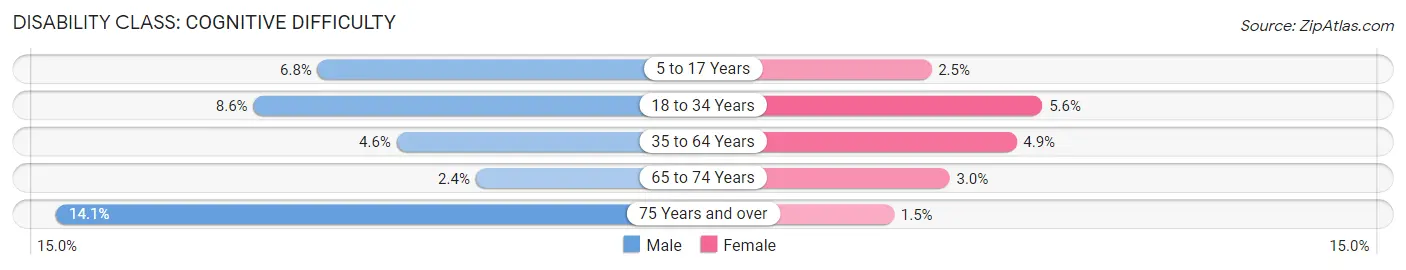
| Age Bracket | Male | Female |
| 5 to 17 Years | 189 (6.8%) | 75 (2.5%) |
| 18 to 34 Years | 270 (8.6%) | 154 (5.6%) |
| 35 to 64 Years | 220 (4.6%) | 270 (4.9%) |
| 65 to 74 Years | 26 (2.4%) | 32 (3.0%) |
| 75 Years and over | 75 (14.1%) | 11 (1.5%) |
Disability Class: Ambulatory Difficulty
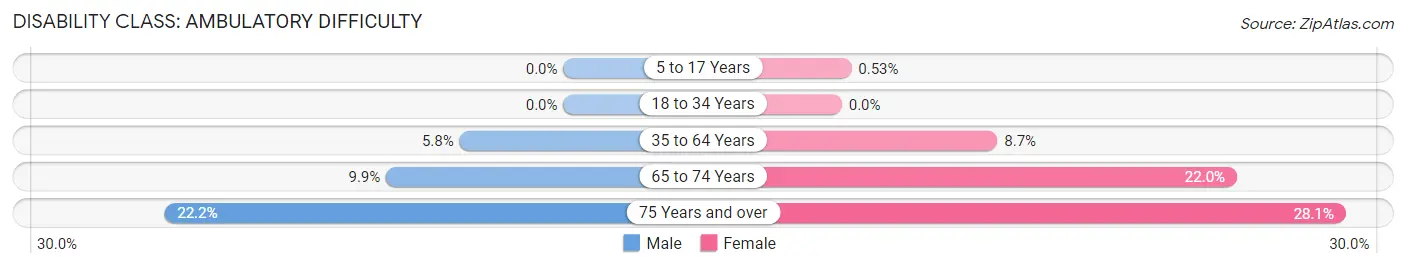
| Age Bracket | Male | Female |
| 5 to 17 Years | 0 (0.0%) | 16 (0.5%) |
| 18 to 34 Years | 0 (0.0%) | 0 (0.0%) |
| 35 to 64 Years | 274 (5.8%) | 481 (8.7%) |
| 65 to 74 Years | 105 (9.9%) | 235 (22.0%) |
| 75 Years and over | 118 (22.2%) | 213 (28.1%) |
Disability Class: Self-Care Difficulty
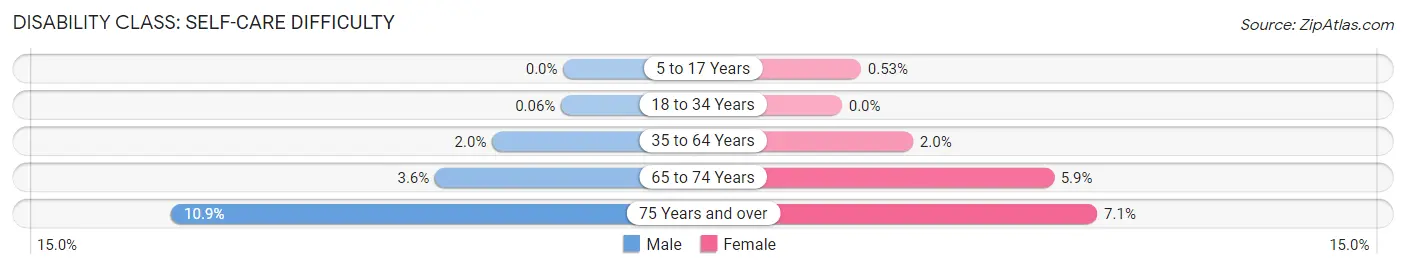
| Age Bracket | Male | Female |
| 5 to 17 Years | 0 (0.0%) | 16 (0.5%) |
| 18 to 34 Years | 2 (0.1%) | 0 (0.0%) |
| 35 to 64 Years | 94 (2.0%) | 110 (2.0%) |
| 65 to 74 Years | 38 (3.6%) | 63 (5.9%) |
| 75 Years and over | 58 (10.9%) | 54 (7.1%) |
Technology Access in Chicago Heights
Computing Device Access in Chicago Heights
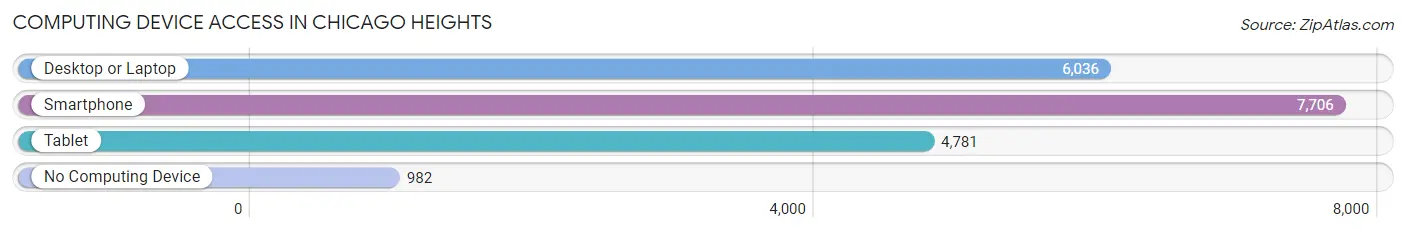
| Device Type | # Households | % Households |
| Desktop or Laptop | 6,036 | 65.7% |
| Smartphone | 7,706 | 83.9% |
| Tablet | 4,781 | 52.0% |
| No Computing Device | 982 | 10.7% |
| Total | 9,186 | 100.0% |
Internet Access in Chicago Heights
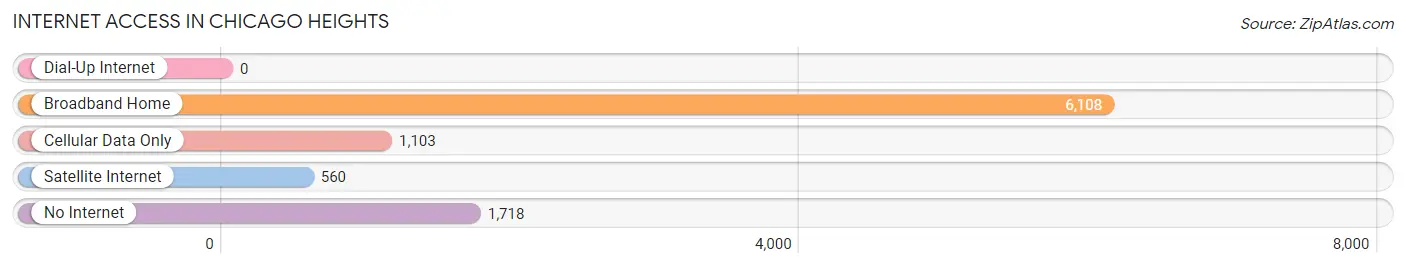
| Internet Type | # Households | % Households |
| Dial-Up Internet | 0 | 0.0% |
| Broadband Home | 6,108 | 66.5% |
| Cellular Data Only | 1,103 | 12.0% |
| Satellite Internet | 560 | 6.1% |
| No Internet | 1,718 | 18.7% |
| Total | 9,186 | 100.0% |
Chicago Heights Summary
History
Chicago Heights is a city located in Cook County, Illinois, United States. It is a suburb of Chicago, located approximately 30 miles south of the city. The city was founded in 1892 and incorporated in 1903. It is the home of the Chicago Heights Steel Company, which was founded in 1906 and is now owned by ArcelorMittal.
The area that is now Chicago Heights was originally inhabited by the Potawatomi Native Americans. The first European settlers arrived in the area in the 1830s. The area was originally known as East Bloomfield, and was later renamed Chicago Heights in 1892.
The city was originally a farming community, but it quickly developed into an industrial center. The Chicago Heights Steel Company was founded in 1906 and quickly became the largest employer in the city. The company was later acquired by ArcelorMittal in 2006.
The city has a long history of organized labor. The Chicago Heights Steel Workers Union was formed in 1909 and was one of the first unions in the city. The union was active in the city until the late 1970s.
Geography
Chicago Heights is located in Cook County, Illinois, approximately 30 miles south of Chicago. The city is situated on the Calumet River, which flows through the city from east to west. The city is bordered by the cities of Park Forest to the north, South Chicago Heights to the east, and Steger to the south.
The city has a total area of 8.3 square miles, of which 8.2 square miles is land and 0.1 square miles is water. The city is located at an elevation of 590 feet above sea level.
Economy
Chicago Heights is a major industrial center. The city is home to the Chicago Heights Steel Company, which is now owned by ArcelorMittal. The company is the largest employer in the city, with over 1,000 employees.
The city is also home to several other major employers, including the Ford Motor Company, the University of Chicago Medical Center, and the University of Chicago.
The city has a diverse economy, with a variety of industries represented. The city is home to a number of manufacturing companies, including food processing, automotive, and metalworking. The city also has a number of retail stores, restaurants, and other businesses.
Demographics
As of the 2010 census, the city had a population of 30,276. The racial makeup of the city was 57.2% White, 33.3% African American, 0.3% Native American, 1.2% Asian, 0.1% Pacific Islander, 5.7% from other races, and 2.4% from two or more races. Hispanic or Latino of any race were 13.2% of the population.
The median household income in the city was $41,945, and the median family income was $50,945. The per capita income in the city was $20,945. About 17.2% of the population was below the poverty line.
Common Questions
What is Per Capita Income in Chicago Heights?
Per Capita income in Chicago Heights is $26,041.
What is the Median Family Income in Chicago Heights?
Median Family Income in Chicago Heights is $66,142.
What is the Median Household income in Chicago Heights?
Median Household Income in Chicago Heights is $56,755.
What is Income or Wage Gap in Chicago Heights?
Income or Wage Gap in Chicago Heights is 23.3%.
Women in Chicago Heights earn 76.7 cents for every dollar earned by a man.
What is Family Income Deficit in Chicago Heights?
Family Income Deficit in Chicago Heights is $13,463.
Families that are below poverty line in Chicago Heights earn $13,463 less on average than the poverty threshold level.
What is Inequality or Gini Index in Chicago Heights?
Inequality or Gini Index in Chicago Heights is 0.47.
What is the Total Population of Chicago Heights?
Total Population of Chicago Heights is 27,366.
What is the Total Male Population of Chicago Heights?
Total Male Population of Chicago Heights is 13,108.
What is the Total Female Population of Chicago Heights?
Total Female Population of Chicago Heights is 14,258.
What is the Ratio of Males per 100 Females in Chicago Heights?
There are 91.93 Males per 100 Females in Chicago Heights.
What is the Ratio of Females per 100 Males in Chicago Heights?
There are 108.77 Females per 100 Males in Chicago Heights.
What is the Median Population Age in Chicago Heights?
Median Population Age in Chicago Heights is 35.8 Years.
What is the Average Family Size in Chicago Heights
Average Family Size in Chicago Heights is 3.6 People.
What is the Average Household Size in Chicago Heights
Average Household Size in Chicago Heights is 2.9 People.
How Large is the Labor Force in Chicago Heights?
There are 12,685 People in the Labor Forcein in Chicago Heights.
What is the Percentage of People in the Labor Force in Chicago Heights?
60.1% of People are in the Labor Force in Chicago Heights.
What is the Unemployment Rate in Chicago Heights?
Unemployment Rate in Chicago Heights is 13.8%.