Cave In Rock, IL Map & Demographics
Cave In Rock Map
Cave In Rock Overview
$27,841
PER CAPITA INCOME
$29,250
AVG FAMILY INCOME
$27,625
AVG HOUSEHOLD INCOME
0.3%
WAGE / INCOME GAP [ % ]
99.7¢/ $1
WAGE / INCOME GAP [ $ ]
0.63
INEQUALITY / GINI INDEX
197
TOTAL POPULATION
90
MALE POPULATION
107
FEMALE POPULATION
84.11
MALES / 100 FEMALES
118.89
FEMALES / 100 MALES
50.6
MEDIAN AGE
2.7
AVG FAMILY SIZE
2.0
AVG HOUSEHOLD SIZE
76
LABOR FORCE [ PEOPLE ]
42.9%
PERCENT IN LABOR FORCE
Cave In Rock Zip Codes
Cave In Rock Area Codes
Income in Cave In Rock
Income Overview in Cave In Rock
Per Capita Income in Cave In Rock is $27,841, while median incomes of families and households are $29,250 and $27,625 respectively.
| Characteristic | Number | Measure |
| Per Capita Income | 197 | $27,841 |
| Median Family Income | 48 | $29,250 |
| Mean Family Income | 48 | $80,969 |
| Median Household Income | 97 | $27,625 |
| Mean Household Income | 97 | $52,920 |
| Income Deficit | 48 | $0 |
| Wage / Income Gap (%) | 197 | 0.35% |
| Wage / Income Gap ($) | 197 | 99.65¢ per $1 |
| Gini / Inequality Index | 197 | 0.63 |
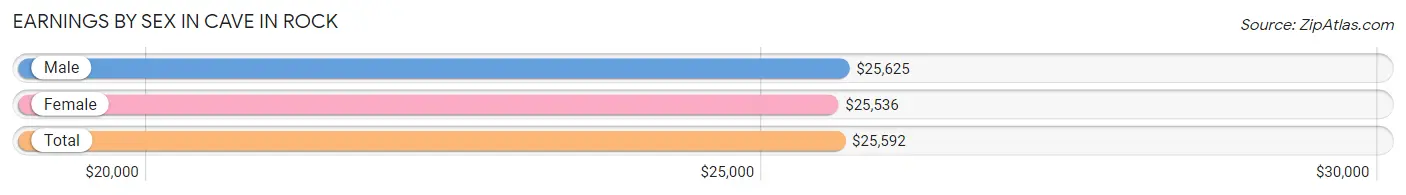
Earnings by Sex in Cave In Rock
Average Earnings in Cave In Rock are $25,592, $25,625 for men and $25,536 for women, a difference of 0.4%.
| Sex | Number | Average Earnings |
| Male | 50 (64.9%) | $25,625 |
| Female | 27 (35.1%) | $25,536 |
| Total | 77 (100.0%) | $25,592 |
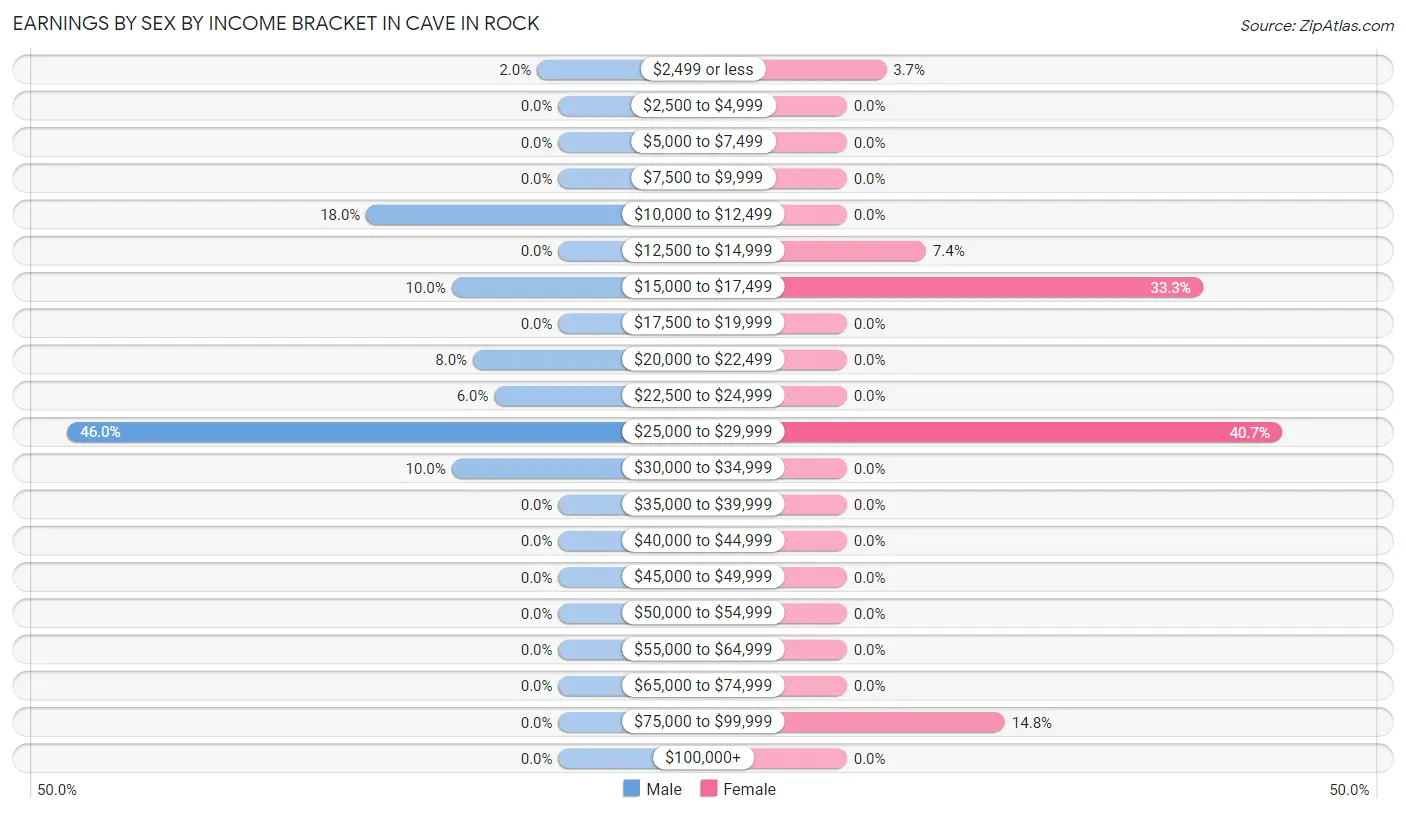
Earnings by Sex by Income Bracket in Cave In Rock
The most common earnings brackets in Cave In Rock are $25,000 to $29,999 for men (23 | 46.0%) and $25,000 to $29,999 for women (11 | 40.7%).
| Income | Male | Female |
| $2,499 or less | 1 (2.0%) | 1 (3.7%) |
| $2,500 to $4,999 | 0 (0.0%) | 0 (0.0%) |
| $5,000 to $7,499 | 0 (0.0%) | 0 (0.0%) |
| $7,500 to $9,999 | 0 (0.0%) | 0 (0.0%) |
| $10,000 to $12,499 | 9 (18.0%) | 0 (0.0%) |
| $12,500 to $14,999 | 0 (0.0%) | 2 (7.4%) |
| $15,000 to $17,499 | 5 (10.0%) | 9 (33.3%) |
| $17,500 to $19,999 | 0 (0.0%) | 0 (0.0%) |
| $20,000 to $22,499 | 4 (8.0%) | 0 (0.0%) |
| $22,500 to $24,999 | 3 (6.0%) | 0 (0.0%) |
| $25,000 to $29,999 | 23 (46.0%) | 11 (40.7%) |
| $30,000 to $34,999 | 5 (10.0%) | 0 (0.0%) |
| $35,000 to $39,999 | 0 (0.0%) | 0 (0.0%) |
| $40,000 to $44,999 | 0 (0.0%) | 0 (0.0%) |
| $45,000 to $49,999 | 0 (0.0%) | 0 (0.0%) |
| $50,000 to $54,999 | 0 (0.0%) | 0 (0.0%) |
| $55,000 to $64,999 | 0 (0.0%) | 0 (0.0%) |
| $65,000 to $74,999 | 0 (0.0%) | 0 (0.0%) |
| $75,000 to $99,999 | 0 (0.0%) | 4 (14.8%) |
| $100,000+ | 0 (0.0%) | 0 (0.0%) |
| Total | 50 (100.0%) | 27 (100.0%) |
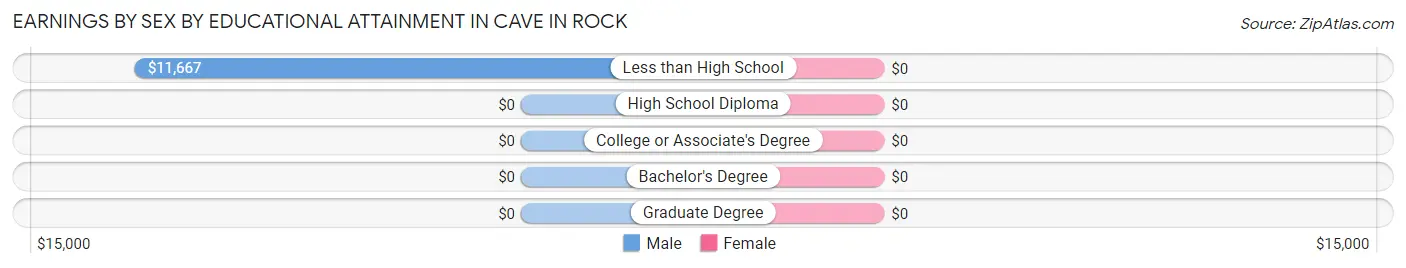
Earnings by Sex by Educational Attainment in Cave In Rock
| Educational Attainment | Male Income | Female Income |
| Less than High School | $11,667 | $0 |
| High School Diploma | - | - |
| College or Associate's Degree | - | - |
| Bachelor's Degree | - | - |
| Graduate Degree | - | - |
| Total | $25,938 | $27,143 |
Family Income in Cave In Rock
Family Income Brackets in Cave In Rock
According to the Cave In Rock family income data, there are 14 families falling into the $25,000 to $34,999 income range, which is the most common income bracket and makes up 29.2% of all families.
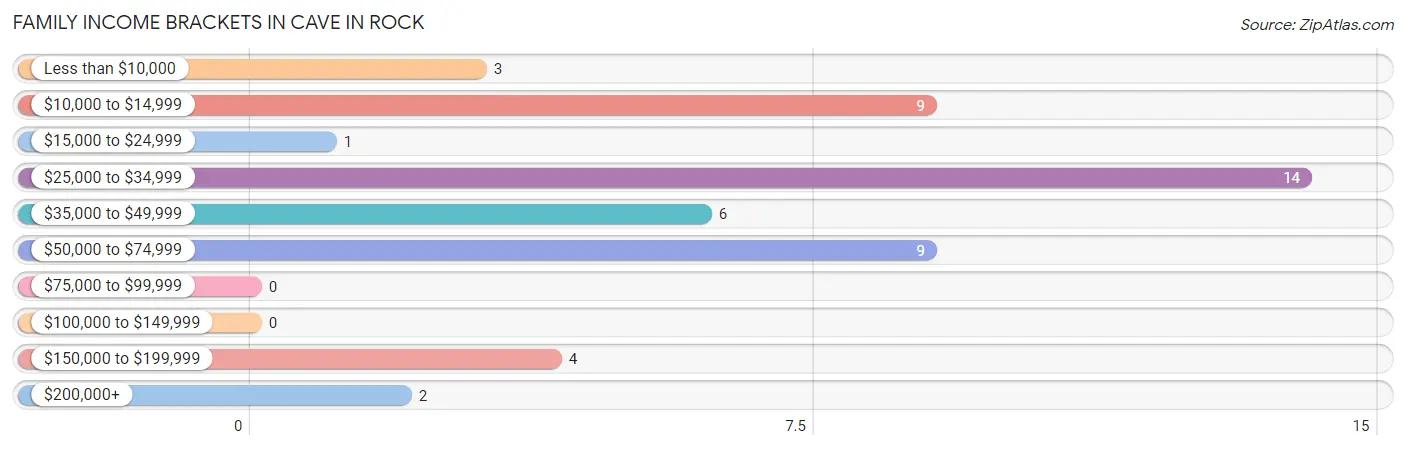
| Income Bracket | # Families | % Families |
| Less than $10,000 | 3 | 6.3% |
| $10,000 to $14,999 | 9 | 18.8% |
| $15,000 to $24,999 | 1 | 2.1% |
| $25,000 to $34,999 | 14 | 29.2% |
| $35,000 to $49,999 | 6 | 12.5% |
| $50,000 to $74,999 | 9 | 18.8% |
| $75,000 to $99,999 | 0 | 0.0% |
| $100,000 to $149,999 | 0 | 0.0% |
| $150,000 to $199,999 | 4 | 8.3% |
| $200,000+ | 2 | 4.2% |
Family Income by Famaliy Size in Cave In Rock
2-person families (31 | 64.6%) account for the highest median family income in Cave In Rock with $29,375 per family, while 2-person families (31 | 64.6%) have the highest median income of $14,688 per family member.
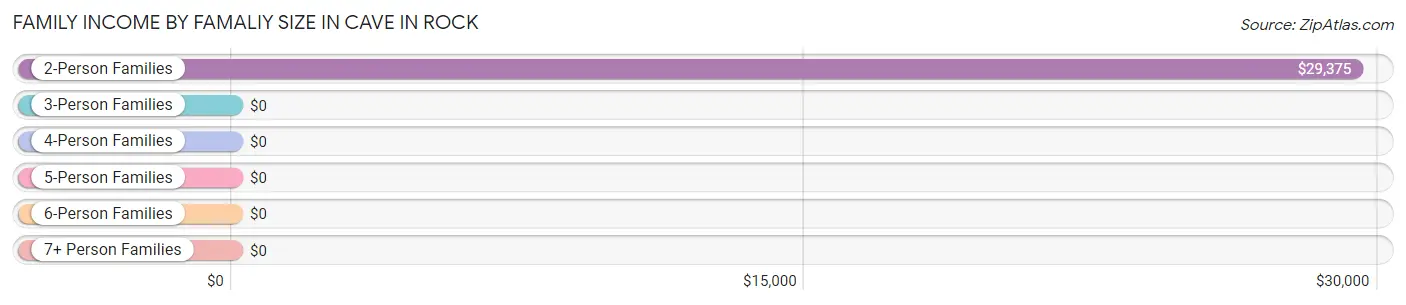
| Income Bracket | # Families | Median Income |
| 2-Person Families | 31 (64.6%) | $29,375 |
| 3-Person Families | 13 (27.1%) | $0 |
| 4-Person Families | 4 (8.3%) | $0 |
| 5-Person Families | 0 (0.0%) | $0 |
| 6-Person Families | 0 (0.0%) | $0 |
| 7+ Person Families | 0 (0.0%) | $0 |
| Total | 48 (100.0%) | $29,250 |
Family Income by Number of Earners in Cave In Rock
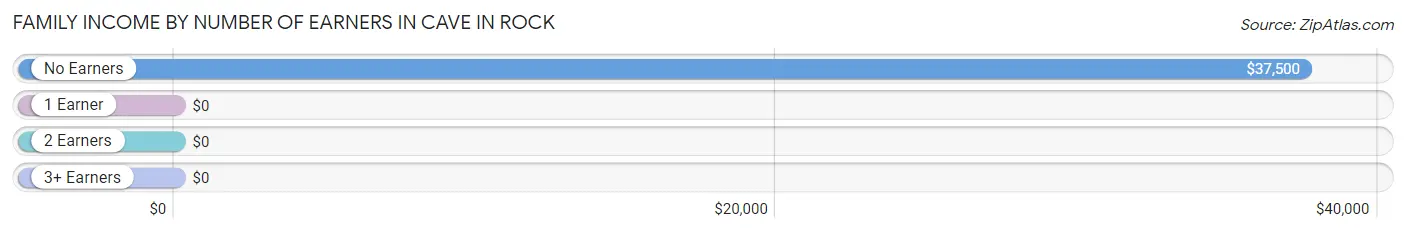
| Number of Earners | # Families | Median Income |
| No Earners | 26 (54.2%) | $37,500 |
| 1 Earner | 18 (37.5%) | $0 |
| 2 Earners | 0 (0.0%) | $0 |
| 3+ Earners | 4 (8.3%) | $0 |
| Total | 48 (100.0%) | $29,250 |
Household Income in Cave In Rock
Household Income Brackets in Cave In Rock
With 26 households falling in the category, the $10,000 to $14,999 income range is the most frequent in Cave In Rock, accounting for 26.8% of all households.
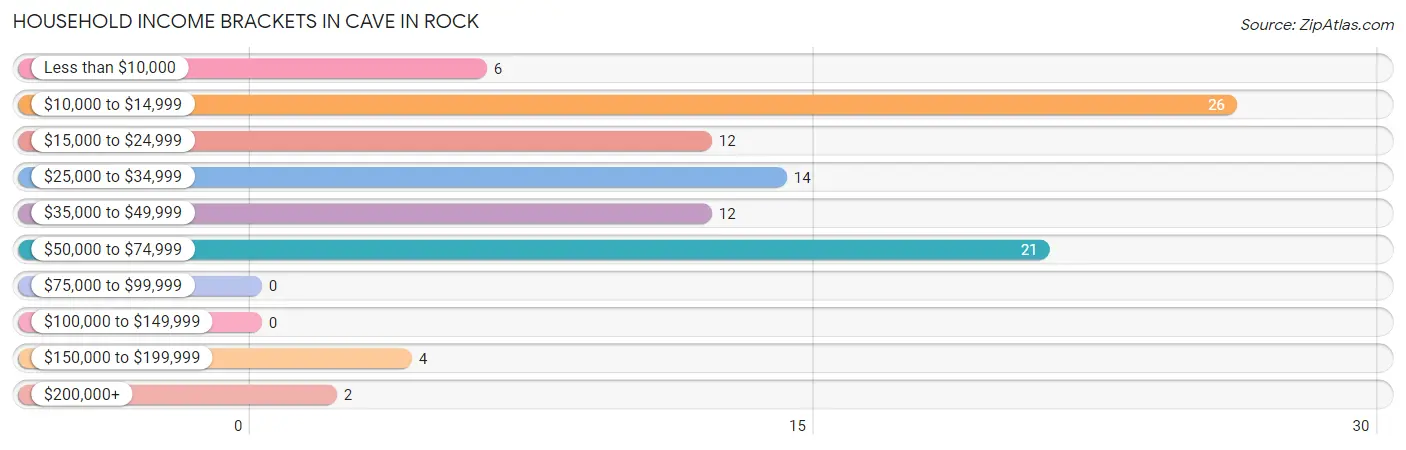
| Income Bracket | # Households | % Households |
| Less than $10,000 | 6 | 6.2% |
| $10,000 to $14,999 | 26 | 26.8% |
| $15,000 to $24,999 | 12 | 12.4% |
| $25,000 to $34,999 | 14 | 14.4% |
| $35,000 to $49,999 | 12 | 12.4% |
| $50,000 to $74,999 | 21 | 21.6% |
| $75,000 to $99,999 | 0 | 0.0% |
| $100,000 to $149,999 | 0 | 0.0% |
| $150,000 to $199,999 | 4 | 4.1% |
| $200,000+ | 2 | 2.1% |
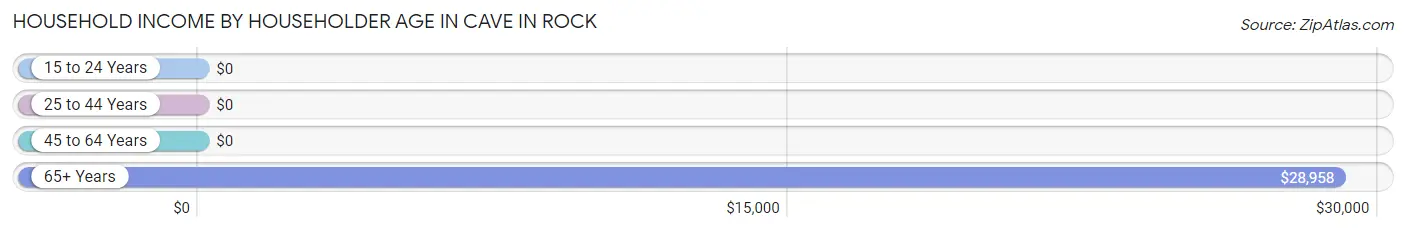
Household Income by Householder Age in Cave In Rock
The median household income in Cave In Rock is $27,625, with the highest median household income of $28,958 found in the 65+ years age bracket for the primary householder. A total of 43 households (44.3%) fall into this category. Meanwhile, the 15 to 24 years age bracket for the primary householder has the lowest median household income of $0, with 3 households (3.1%) in this group.
| Income Bracket | # Households | Median Income |
| 15 to 24 Years | 3 (3.1%) | $0 |
| 25 to 44 Years | 26 (26.8%) | $0 |
| 45 to 64 Years | 25 (25.8%) | $0 |
| 65+ Years | 43 (44.3%) | $28,958 |
| Total | 97 (100.0%) | $27,625 |
Poverty in Cave In Rock
Income Below Poverty by Sex and Age in Cave In Rock
With 23.3% poverty level for males and 26.2% for females among the residents of Cave In Rock, 55 to 64 year old males and 25 to 34 year old females are the most vulnerable to poverty, with 11 males (73.3%) and 11 females (100.0%) in their respective age groups living below the poverty level.
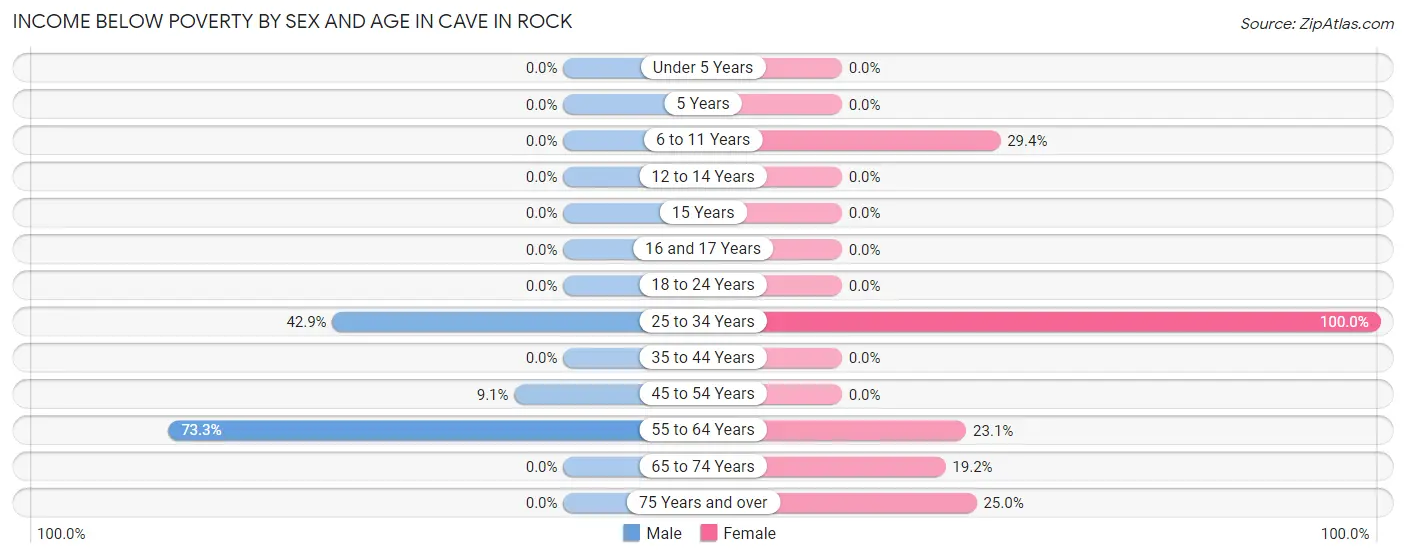
| Age Bracket | Male | Female |
| Under 5 Years | 0 (0.0%) | 0 (0.0%) |
| 5 Years | 0 (0.0%) | 0 (0.0%) |
| 6 to 11 Years | 0 (0.0%) | 5 (29.4%) |
| 12 to 14 Years | 0 (0.0%) | 0 (0.0%) |
| 15 Years | 0 (0.0%) | 0 (0.0%) |
| 16 and 17 Years | 0 (0.0%) | 0 (0.0%) |
| 18 to 24 Years | 0 (0.0%) | 0 (0.0%) |
| 25 to 34 Years | 9 (42.9%) | 11 (100.0%) |
| 35 to 44 Years | 0 (0.0%) | 0 (0.0%) |
| 45 to 54 Years | 1 (9.1%) | 0 (0.0%) |
| 55 to 64 Years | 11 (73.3%) | 3 (23.1%) |
| 65 to 74 Years | 0 (0.0%) | 5 (19.2%) |
| 75 Years and over | 0 (0.0%) | 4 (25.0%) |
| Total | 21 (23.3%) | 28 (26.2%) |
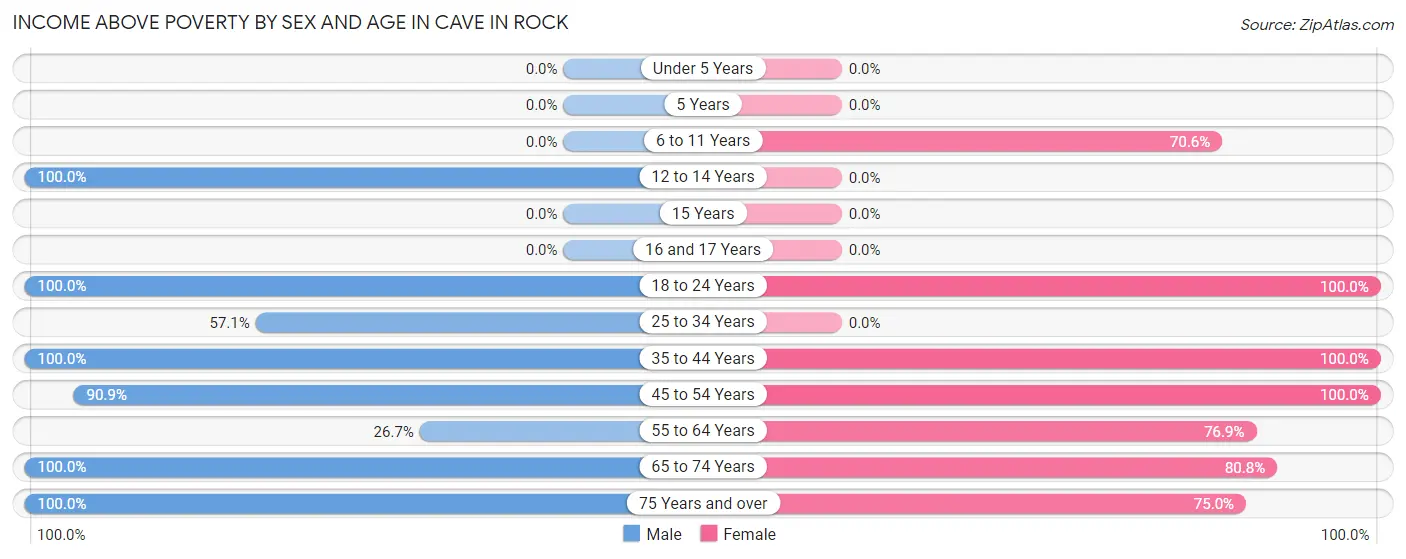
Income Above Poverty by Sex and Age in Cave In Rock
According to the poverty statistics in Cave In Rock, males aged 12 to 14 years and females aged 18 to 24 years are the age groups that are most secure financially, with 100.0% of males and 100.0% of females in these age groups living above the poverty line.
| Age Bracket | Male | Female |
| Under 5 Years | 0 (0.0%) | 0 (0.0%) |
| 5 Years | 0 (0.0%) | 0 (0.0%) |
| 6 to 11 Years | 0 (0.0%) | 12 (70.6%) |
| 12 to 14 Years | 3 (100.0%) | 0 (0.0%) |
| 15 Years | 0 (0.0%) | 0 (0.0%) |
| 16 and 17 Years | 0 (0.0%) | 0 (0.0%) |
| 18 to 24 Years | 3 (100.0%) | 9 (100.0%) |
| 25 to 34 Years | 12 (57.1%) | 0 (0.0%) |
| 35 to 44 Years | 11 (100.0%) | 11 (100.0%) |
| 45 to 54 Years | 10 (90.9%) | 4 (100.0%) |
| 55 to 64 Years | 4 (26.7%) | 10 (76.9%) |
| 65 to 74 Years | 9 (100.0%) | 21 (80.8%) |
| 75 Years and over | 17 (100.0%) | 12 (75.0%) |
| Total | 69 (76.7%) | 79 (73.8%) |
Income Below Poverty Among Married-Couple Families in Cave In Rock
The poverty statistics for married-couple families in Cave In Rock show that 12.9% or 4 of the total 31 families live below the poverty line. Families with no children have the highest poverty rate of 14.8%, comprising of 4 families. On the other hand, families with 1 or 2 children have the lowest poverty rate of 0.0%, which includes 0 families.
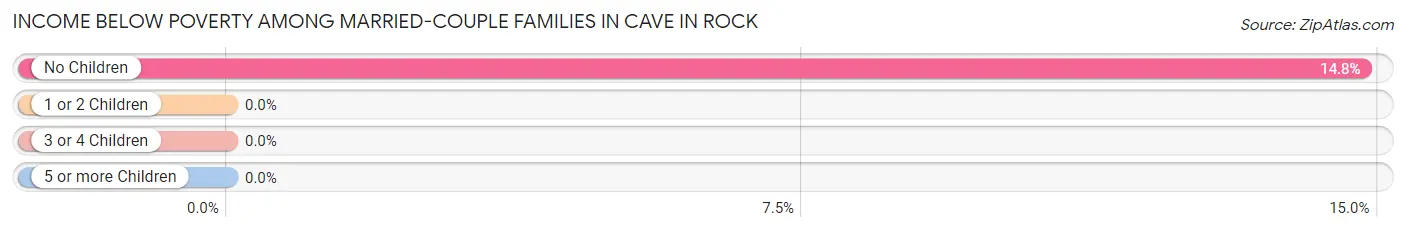
| Children | Above Poverty | Below Poverty |
| No Children | 23 (85.2%) | 4 (14.8%) |
| 1 or 2 Children | 4 (100.0%) | 0 (0.0%) |
| 3 or 4 Children | 0 (0.0%) | 0 (0.0%) |
| 5 or more Children | 0 (0.0%) | 0 (0.0%) |
| Total | 27 (87.1%) | 4 (12.9%) |
Income Below Poverty Among Single-Parent Households in Cave In Rock
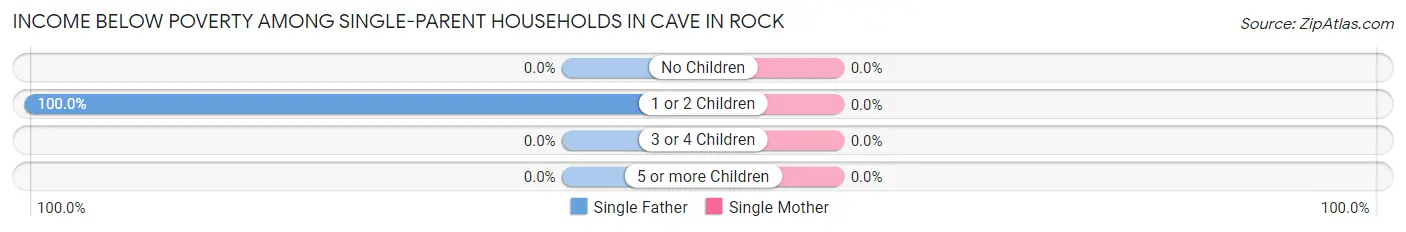
| Children | Single Father | Single Mother |
| No Children | 0 (0.0%) | 0 (0.0%) |
| 1 or 2 Children | 9 (100.0%) | 0 (0.0%) |
| 3 or 4 Children | 0 (0.0%) | 0 (0.0%) |
| 5 or more Children | 0 (0.0%) | 0 (0.0%) |
| Total | 9 (100.0%) | 0 (0.0%) |
Income Below Poverty Among Married-Couple vs Single-Parent Households in Cave In Rock
The poverty data for Cave In Rock shows that 4 of the married-couple family households (12.9%) and 9 of the single-parent households (52.9%) are living below the poverty level. Within the married-couple family households, those with no children have the highest poverty rate, with 4 households (14.8%) falling below the poverty line. Among the single-parent households, those with 1 or 2 children have the highest poverty rate, with 9 household (69.2%) living below poverty.
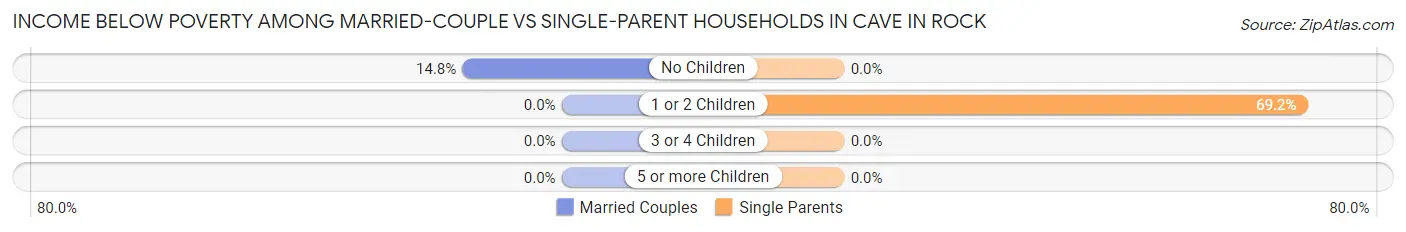
| Children | Married-Couple Families | Single-Parent Households |
| No Children | 4 (14.8%) | 0 (0.0%) |
| 1 or 2 Children | 0 (0.0%) | 9 (69.2%) |
| 3 or 4 Children | 0 (0.0%) | 0 (0.0%) |
| 5 or more Children | 0 (0.0%) | 0 (0.0%) |
| Total | 4 (12.9%) | 9 (52.9%) |
Race in Cave In Rock
The most populous races in Cave In Rock are White / Caucasian (185 | 93.9%), Two or more Races (12 | 6.1%), and Hispanic or Latino (1 | 0.5%).
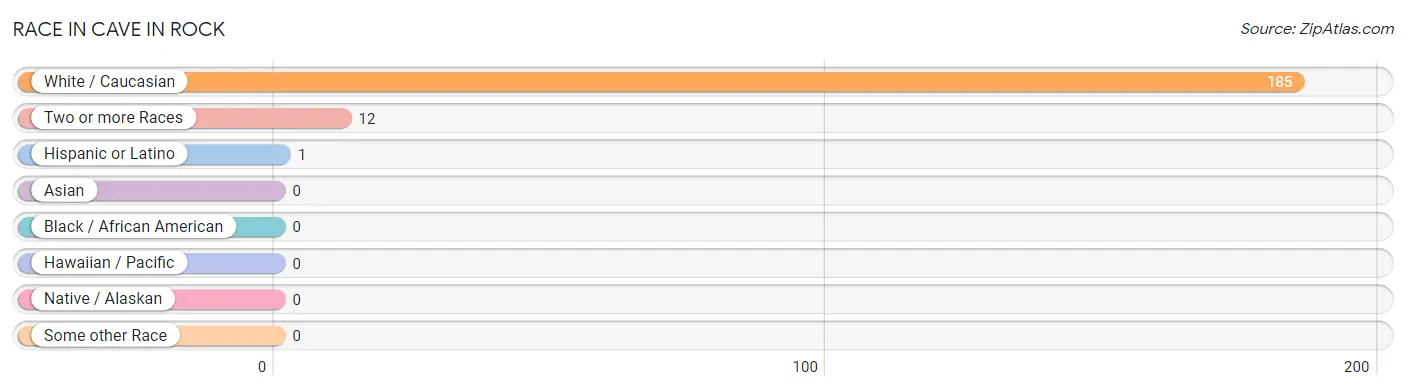
| Race | # Population | % Population |
| Asian | 0 | 0.0% |
| Black / African American | 0 | 0.0% |
| Hawaiian / Pacific | 0 | 0.0% |
| Hispanic or Latino | 1 | 0.5% |
| Native / Alaskan | 0 | 0.0% |
| White / Caucasian | 185 | 93.9% |
| Two or more Races | 12 | 6.1% |
| Some other Race | 0 | 0.0% |
| Total | 197 | 100.0% |
Ancestry in Cave In Rock
The most populous ancestries reported in Cave In Rock are English (22 | 11.2%), German (16 | 8.1%), Irish (12 | 6.1%), Jamaican (12 | 6.1%), and Russian (6 | 3.0%), together accounting for 34.5% of all Cave In Rock residents.
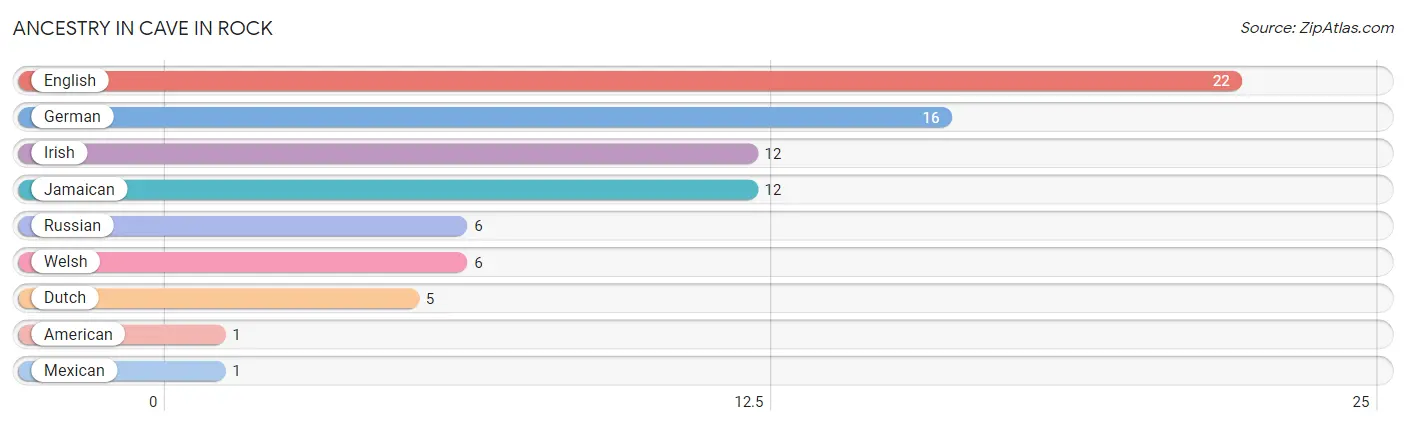
| Ancestry | # Population | % Population |
| American | 1 | 0.5% |
| Dutch | 5 | 2.5% |
| English | 22 | 11.2% |
| German | 16 | 8.1% |
| Irish | 12 | 6.1% |
| Jamaican | 12 | 6.1% |
| Mexican | 1 | 0.5% |
| Russian | 6 | 3.0% |
| Welsh | 6 | 3.0% | View All 9 Rows |
Immigrants in Cave In Rock

| Immigration Origin | # Population | % Population | View All 0 Rows |
Sex and Age in Cave In Rock
Sex and Age in Cave In Rock
The most populous age groups in Cave In Rock are 30 to 34 Years (21 | 23.3%) for men and 70 to 74 Years (21 | 19.6%) for women.
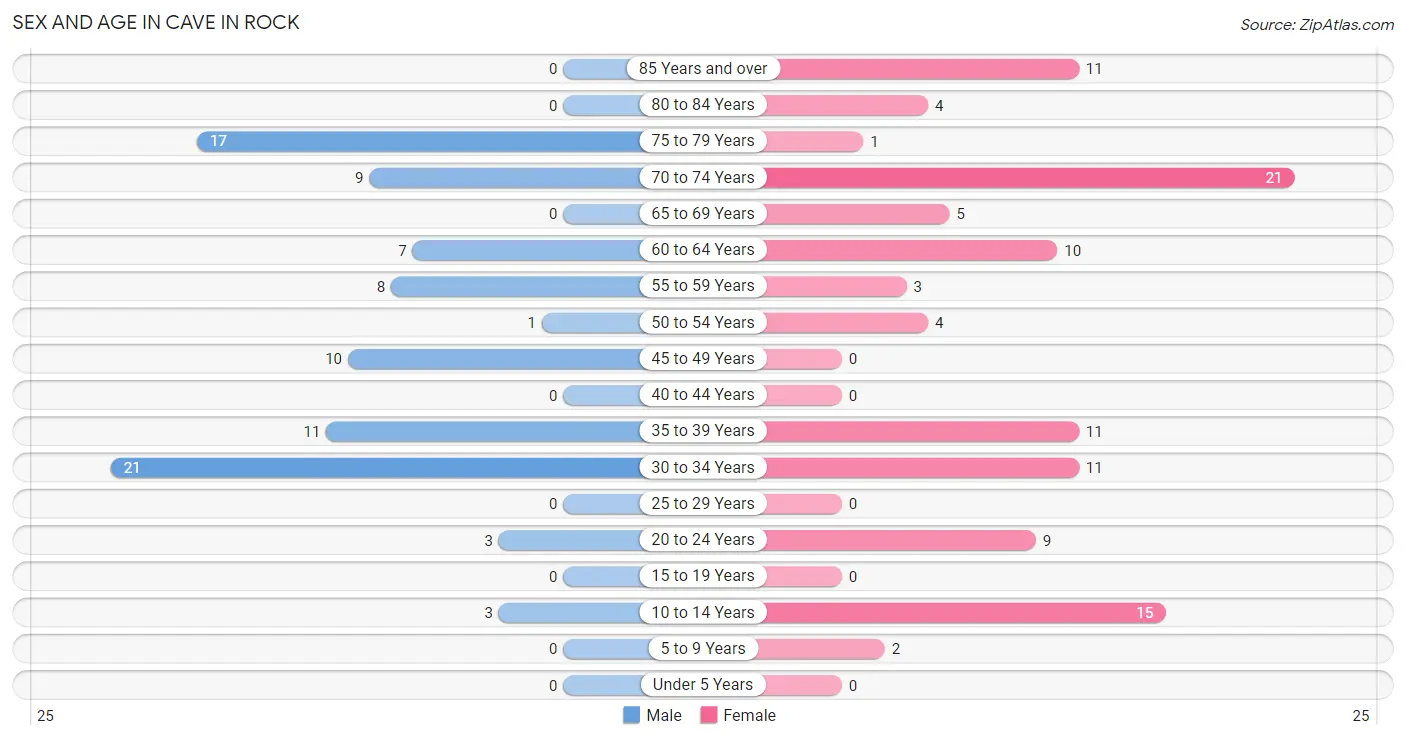
| Age Bracket | Male | Female |
| Under 5 Years | 0 (0.0%) | 0 (0.0%) |
| 5 to 9 Years | 0 (0.0%) | 2 (1.9%) |
| 10 to 14 Years | 3 (3.3%) | 15 (14.0%) |
| 15 to 19 Years | 0 (0.0%) | 0 (0.0%) |
| 20 to 24 Years | 3 (3.3%) | 9 (8.4%) |
| 25 to 29 Years | 0 (0.0%) | 0 (0.0%) |
| 30 to 34 Years | 21 (23.3%) | 11 (10.3%) |
| 35 to 39 Years | 11 (12.2%) | 11 (10.3%) |
| 40 to 44 Years | 0 (0.0%) | 0 (0.0%) |
| 45 to 49 Years | 10 (11.1%) | 0 (0.0%) |
| 50 to 54 Years | 1 (1.1%) | 4 (3.7%) |
| 55 to 59 Years | 8 (8.9%) | 3 (2.8%) |
| 60 to 64 Years | 7 (7.8%) | 10 (9.3%) |
| 65 to 69 Years | 0 (0.0%) | 5 (4.7%) |
| 70 to 74 Years | 9 (10.0%) | 21 (19.6%) |
| 75 to 79 Years | 17 (18.9%) | 1 (0.9%) |
| 80 to 84 Years | 0 (0.0%) | 4 (3.7%) |
| 85 Years and over | 0 (0.0%) | 11 (10.3%) |
| Total | 90 (100.0%) | 107 (100.0%) |
Families and Households in Cave In Rock
Median Family Size in Cave In Rock
The median family size in Cave In Rock is 2.73 persons per family, with single female/mother families (8 | 16.7%) accounting for the largest median family size of 3.75 persons per family. On the other hand, single male/father families (9 | 18.8%) represent the smallest median family size with 1.56 persons per family.
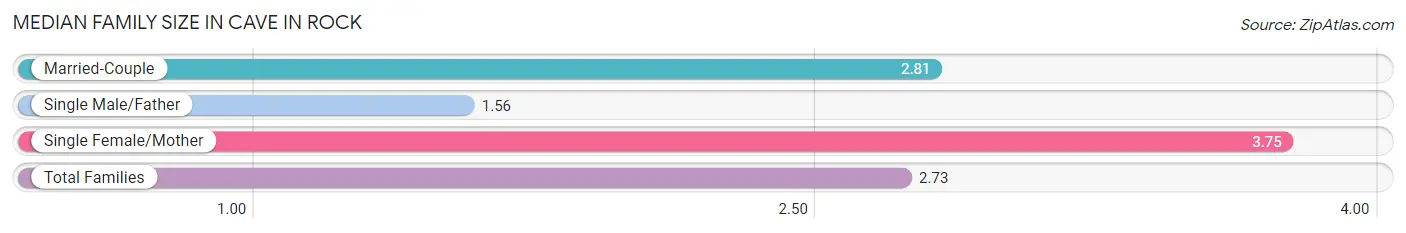
| Family Type | # Families | Family Size |
| Married-Couple | 31 (64.6%) | 2.81 |
| Single Male/Father | 9 (18.8%) | 1.56 |
| Single Female/Mother | 8 (16.7%) | 3.75 |
| Total Families | 48 (100.0%) | 2.73 |
Median Household Size in Cave In Rock
The median household size in Cave In Rock is 2.03 persons per household, with single female/mother households (8 | 8.3%) accounting for the largest median household size of 3.75 persons per household. non-family households (49 | 50.5%) represent the smallest median household size with 1.14 persons per household.
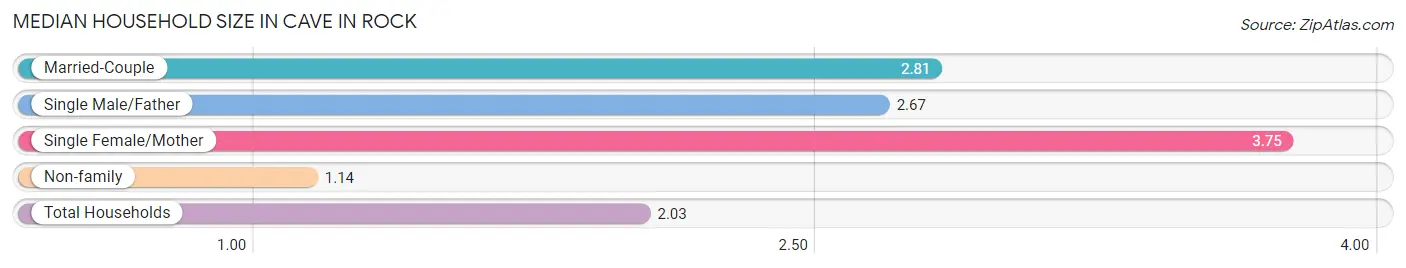
| Household Type | # Households | Household Size |
| Married-Couple | 31 (32.0%) | 2.81 |
| Single Male/Father | 9 (9.3%) | 2.67 |
| Single Female/Mother | 8 (8.3%) | 3.75 |
| Non-family | 49 (50.5%) | 1.14 |
| Total Households | 97 (100.0%) | 2.03 |
Household Size by Marriage Status in Cave In Rock
Out of a total of 97 households in Cave In Rock, 48 (49.5%) are family households, while 49 (50.5%) are nonfamily households. The most numerous type of family households are 2-person households, comprising 31, and the most common type of nonfamily households are 1-person households, comprising 37.
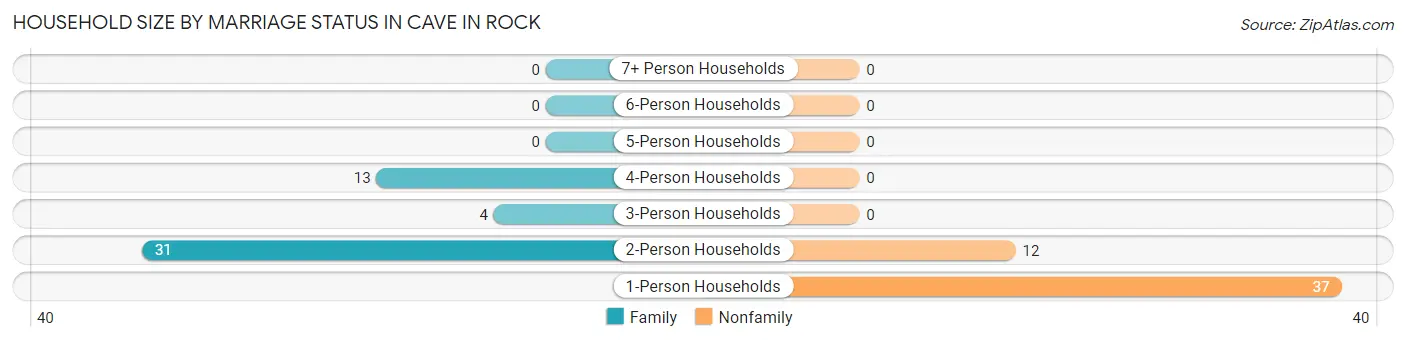
| Household Size | Family Households | Nonfamily Households |
| 1-Person Households | - | 37 (38.1%) |
| 2-Person Households | 31 (32.0%) | 12 (12.4%) |
| 3-Person Households | 4 (4.1%) | 0 (0.0%) |
| 4-Person Households | 13 (13.4%) | 0 (0.0%) |
| 5-Person Households | 0 (0.0%) | 0 (0.0%) |
| 6-Person Households | 0 (0.0%) | 0 (0.0%) |
| 7+ Person Households | 0 (0.0%) | 0 (0.0%) |
| Total | 48 (49.5%) | 49 (50.5%) |
Female Fertility in Cave In Rock
Fertility by Age in Cave In Rock
| Age Bracket | Women with Births | Births / 1,000 Women |
| 15 to 19 years | 0 (0.0%) | 0.0 |
| 20 to 34 years | 0 (0.0%) | 0.0 |
| 35 to 50 years | 0 (0.0%) | 0.0 |
| Total | 0 (0.0%) | 0.0 |
Fertility by Age by Marriage Status in Cave In Rock
| Age Bracket | Married | Unmarried |
| 15 to 19 years | 0 (0.0%) | 0 (0.0%) |
| 20 to 34 years | 0 (0.0%) | 0 (0.0%) |
| 35 to 50 years | 0 (0.0%) | 0 (0.0%) |
| Total | 0 (0.0%) | 0 (0.0%) |
Fertility by Education in Cave In Rock
| Educational Attainment | Women with Births | Births / 1,000 Women |
| Less than High School | 0 (0.0%) | 0.0 |
| High School Diploma | 0 (0.0%) | 0.0 |
| College or Associate's Degree | 0 (0.0%) | 0.0 |
| Bachelor's Degree | 0 (0.0%) | 0.0 |
| Graduate Degree | 0 (0.0%) | 0.0 |
| Total | 0 (0.0%) | 0.0 |
Fertility by Education by Marriage Status in Cave In Rock
| Educational Attainment | Married | Unmarried |
| Less than High School | 0 (0.0%) | 0 (0.0%) |
| High School Diploma | 0 (0.0%) | 0 (0.0%) |
| College or Associate's Degree | 0 (0.0%) | 0 (0.0%) |
| Bachelor's Degree | 0 (0.0%) | 0 (0.0%) |
| Graduate Degree | 0 (0.0%) | 0 (0.0%) |
| Total | 0 (0.0%) | 0 (0.0%) |
Employment Characteristics in Cave In Rock
Employment by Class of Employer in Cave In Rock
Among the 76 employed individuals in Cave In Rock, private company employees (40 | 52.6%), state government employees (18 | 23.7%), and not-for-profit organizations (9 | 11.8%) make up the most common classes of employment.
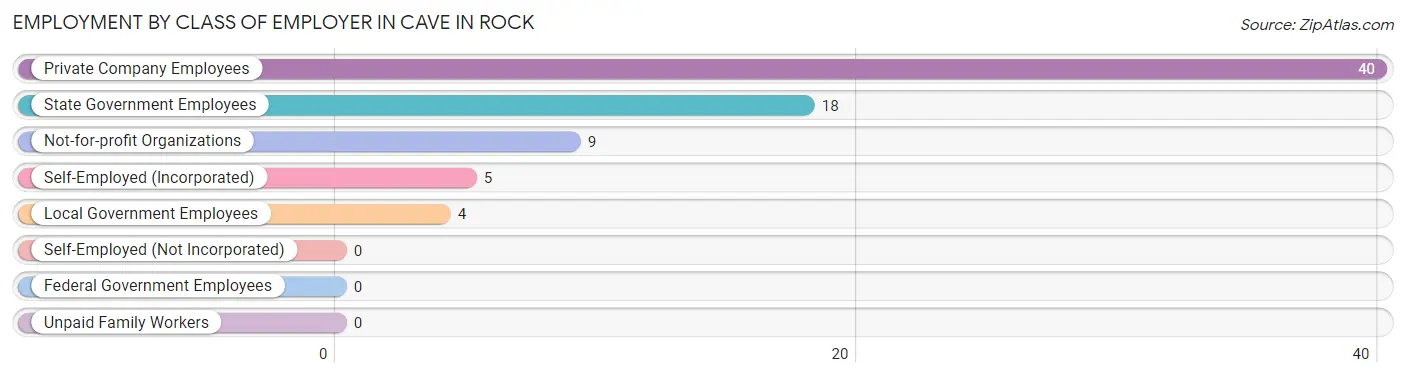
| Employer Class | # Employees | % Employees |
| Private Company Employees | 40 | 52.6% |
| Self-Employed (Incorporated) | 5 | 6.6% |
| Self-Employed (Not Incorporated) | 0 | 0.0% |
| Not-for-profit Organizations | 9 | 11.8% |
| Local Government Employees | 4 | 5.3% |
| State Government Employees | 18 | 23.7% |
| Federal Government Employees | 0 | 0.0% |
| Unpaid Family Workers | 0 | 0.0% |
| Total | 76 | 100.0% |
Employment Status by Age in Cave In Rock
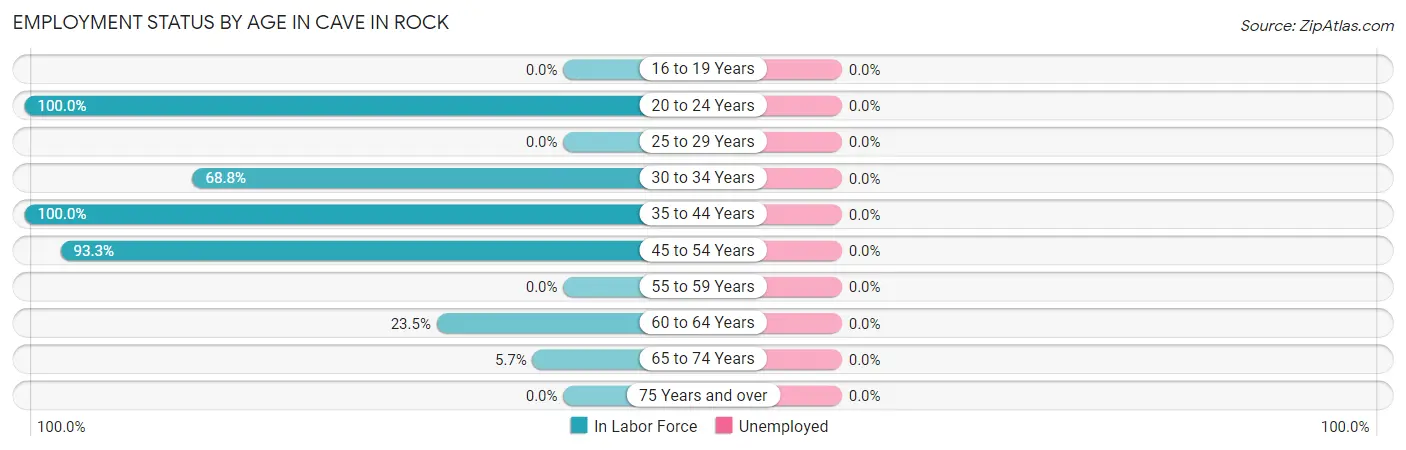
| Age Bracket | In Labor Force | Unemployed |
| 16 to 19 Years | 0 (0.0%) | 0 (0.0%) |
| 20 to 24 Years | 12 (100.0%) | 0 (0.0%) |
| 25 to 29 Years | 0 (0.0%) | 0 (0.0%) |
| 30 to 34 Years | 22 (68.8%) | 0 (0.0%) |
| 35 to 44 Years | 22 (100.0%) | 0 (0.0%) |
| 45 to 54 Years | 14 (93.3%) | 0 (0.0%) |
| 55 to 59 Years | 0 (0.0%) | 0 (0.0%) |
| 60 to 64 Years | 4 (23.5%) | 0 (0.0%) |
| 65 to 74 Years | 2 (5.7%) | 0 (0.0%) |
| 75 Years and over | 0 (0.0%) | 0 (0.0%) |
| Total | 76 (42.9%) | 0 (0.0%) |
Employment Status by Educational Attainment in Cave In Rock
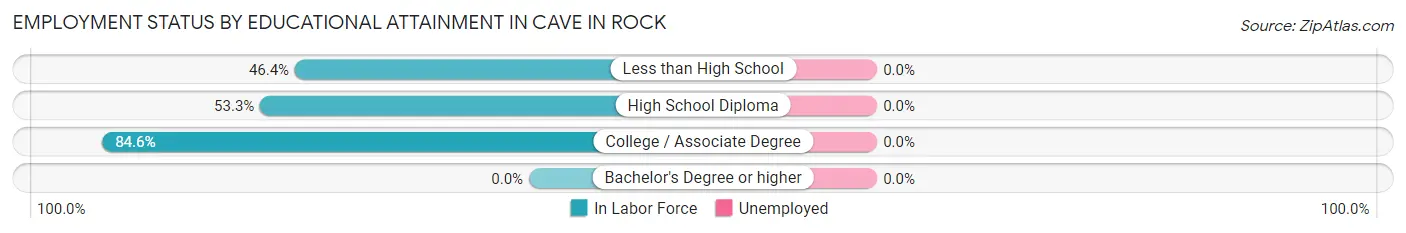
| Educational Attainment | In Labor Force | Unemployed |
| Less than High School | 13 (46.4%) | 0 (0.0%) |
| High School Diploma | 16 (53.3%) | 0 (0.0%) |
| College / Associate Degree | 33 (84.6%) | 0 (0.0%) |
| Bachelor's Degree or higher | 0 (0.0%) | 0 (0.0%) |
| Total | 62 (63.9%) | 0 (0.0%) |
Employment Occupations by Sex in Cave In Rock
Management, Business, Science and Arts Occupations
The most common Management, Business, Science and Arts occupations in Cave In Rock are Health Diagnosing & Treating (4 | 5.3%), Health Technologists (4 | 5.3%), Community & Social Service (2 | 2.6%), and Education Instruction & Library (2 | 2.6%).
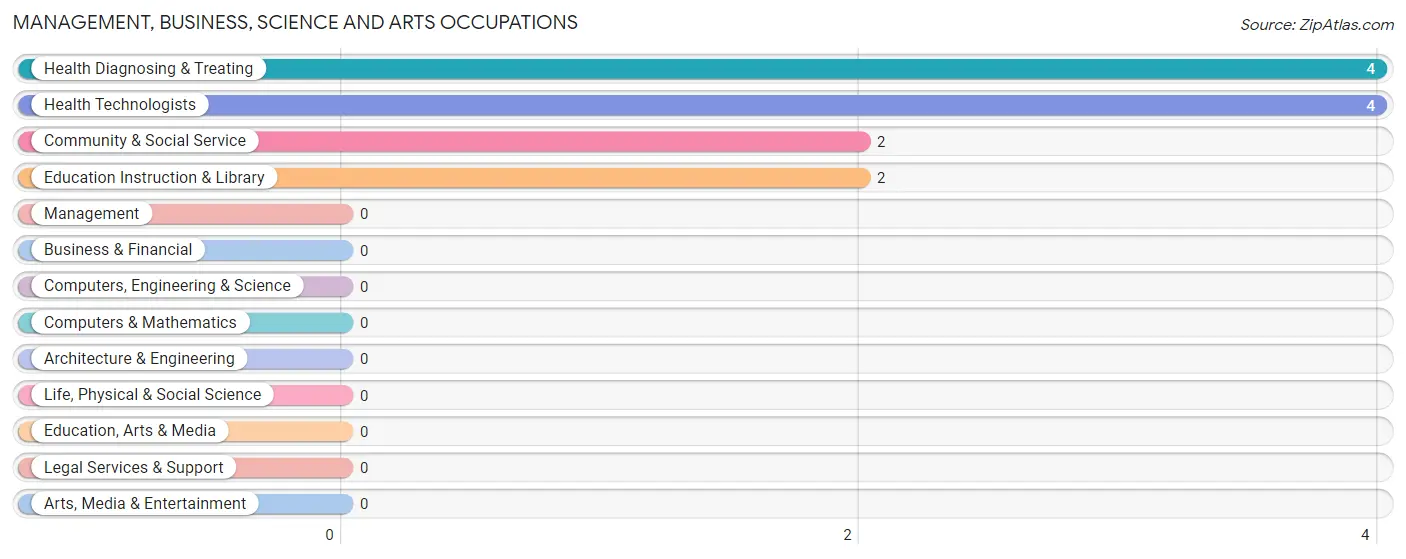
Management, Business, Science and Arts Occupations by Sex
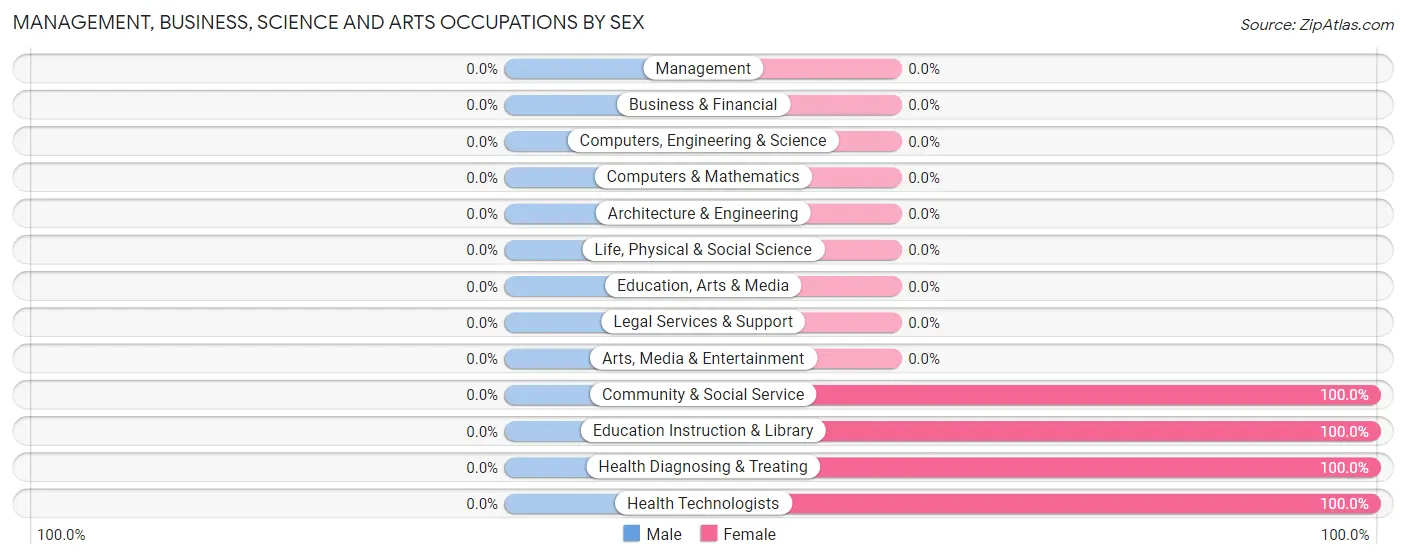
| Occupation | Male | Female |
| Management | 0 (0.0%) | 0 (0.0%) |
| Business & Financial | 0 (0.0%) | 0 (0.0%) |
| Computers, Engineering & Science | 0 (0.0%) | 0 (0.0%) |
| Computers & Mathematics | 0 (0.0%) | 0 (0.0%) |
| Architecture & Engineering | 0 (0.0%) | 0 (0.0%) |
| Life, Physical & Social Science | 0 (0.0%) | 0 (0.0%) |
| Community & Social Service | 0 (0.0%) | 2 (100.0%) |
| Education, Arts & Media | 0 (0.0%) | 0 (0.0%) |
| Legal Services & Support | 0 (0.0%) | 0 (0.0%) |
| Education Instruction & Library | 0 (0.0%) | 2 (100.0%) |
| Arts, Media & Entertainment | 0 (0.0%) | 0 (0.0%) |
| Health Diagnosing & Treating | 0 (0.0%) | 4 (100.0%) |
| Health Technologists | 0 (0.0%) | 4 (100.0%) |
| Total (Category) | 0 (0.0%) | 6 (100.0%) |
| Total (Overall) | 49 (64.5%) | 27 (35.5%) |
Services Occupations
The most common Services occupations in Cave In Rock are Healthcare Support (19 | 25.0%), Cleaning & Maintenance (5 | 6.6%), and Food Preparation & Serving (3 | 4.0%).
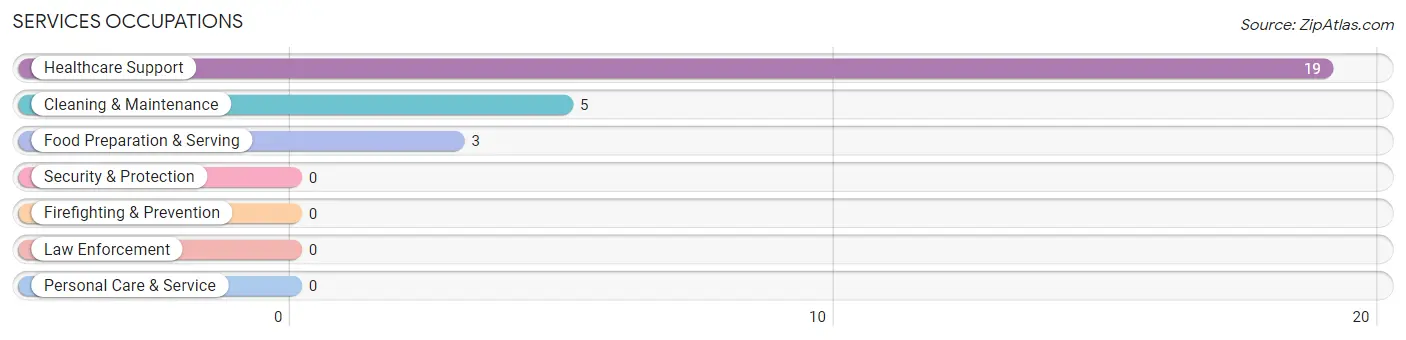
Services Occupations by Sex
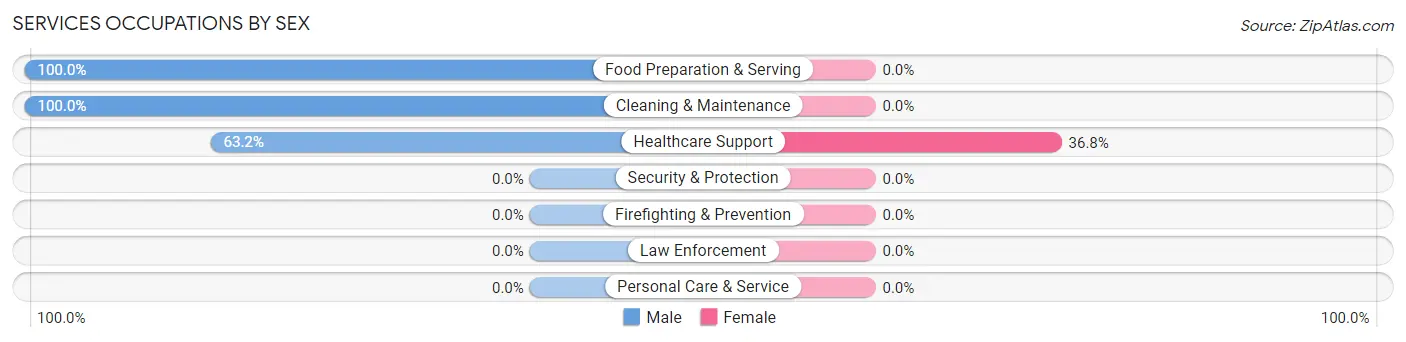
| Occupation | Male | Female |
| Healthcare Support | 12 (63.2%) | 7 (36.8%) |
| Security & Protection | 0 (0.0%) | 0 (0.0%) |
| Firefighting & Prevention | 0 (0.0%) | 0 (0.0%) |
| Law Enforcement | 0 (0.0%) | 0 (0.0%) |
| Food Preparation & Serving | 3 (100.0%) | 0 (0.0%) |
| Cleaning & Maintenance | 5 (100.0%) | 0 (0.0%) |
| Personal Care & Service | 0 (0.0%) | 0 (0.0%) |
| Total (Category) | 20 (74.1%) | 7 (25.9%) |
| Total (Overall) | 49 (64.5%) | 27 (35.5%) |
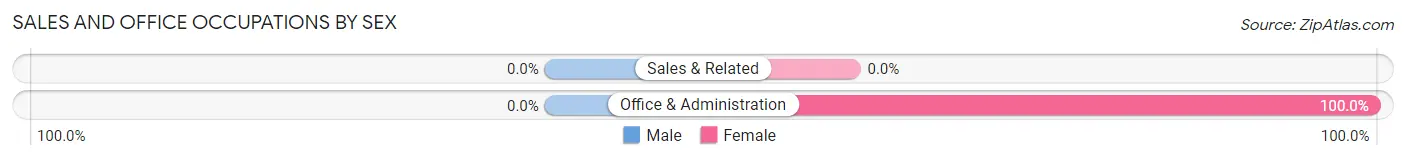
Sales and Office Occupations
The most common Sales and Office occupations in Cave In Rock are , and Office & Administration (5 | 6.6%).
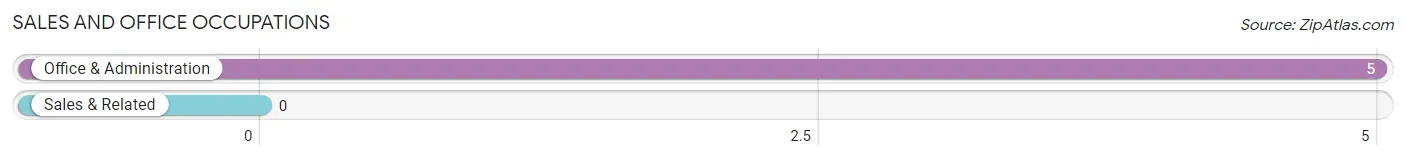
Sales and Office Occupations by Sex
| Occupation | Male | Female |
| Sales & Related | 0 (0.0%) | 0 (0.0%) |
| Office & Administration | 0 (0.0%) | 5 (100.0%) |
| Total (Category) | 0 (0.0%) | 5 (100.0%) |
| Total (Overall) | 49 (64.5%) | 27 (35.5%) |
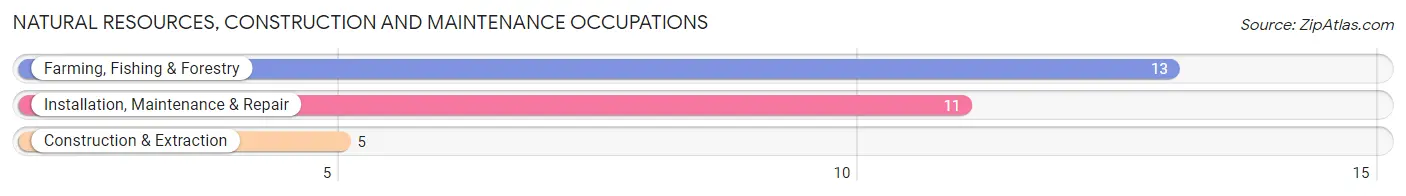
Natural Resources, Construction and Maintenance Occupations
The most common Natural Resources, Construction and Maintenance occupations in Cave In Rock are Farming, Fishing & Forestry (13 | 17.1%), Installation, Maintenance & Repair (11 | 14.5%), and Construction & Extraction (5 | 6.6%).
Natural Resources, Construction and Maintenance Occupations by Sex
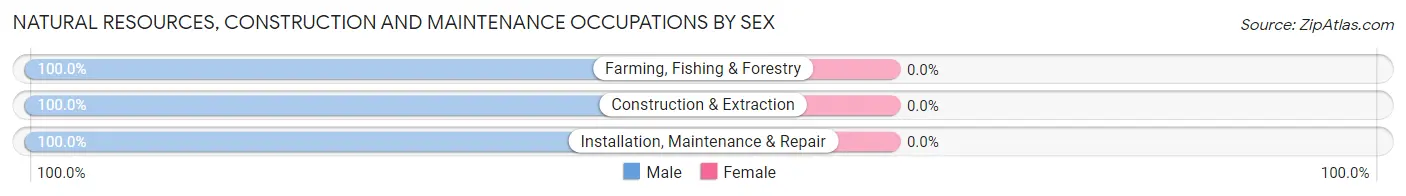
| Occupation | Male | Female |
| Farming, Fishing & Forestry | 13 (100.0%) | 0 (0.0%) |
| Construction & Extraction | 5 (100.0%) | 0 (0.0%) |
| Installation, Maintenance & Repair | 11 (100.0%) | 0 (0.0%) |
| Total (Category) | 29 (100.0%) | 0 (0.0%) |
| Total (Overall) | 49 (64.5%) | 27 (35.5%) |
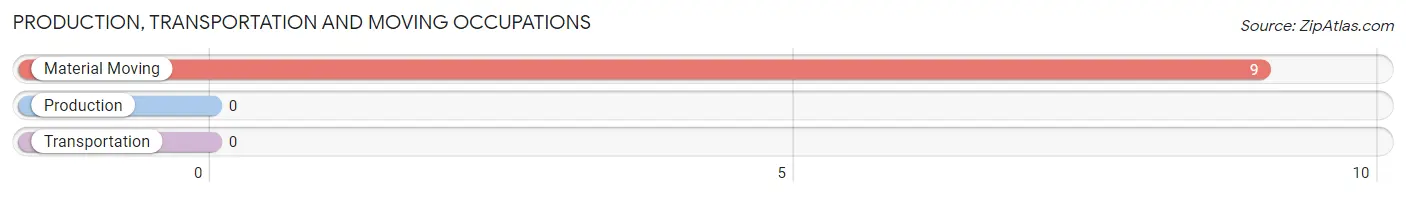
Production, Transportation and Moving Occupations
The most common Production, Transportation and Moving occupations in Cave In Rock are , and Material Moving (9 | 11.8%).
Production, Transportation and Moving Occupations by Sex
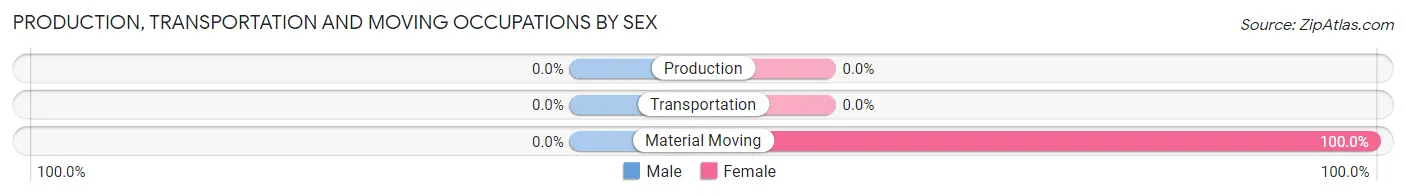
| Occupation | Male | Female |
| Production | 0 (0.0%) | 0 (0.0%) |
| Transportation | 0 (0.0%) | 0 (0.0%) |
| Material Moving | 0 (0.0%) | 9 (100.0%) |
| Total (Category) | 0 (0.0%) | 9 (100.0%) |
| Total (Overall) | 49 (64.5%) | 27 (35.5%) |
Employment Industries by Sex in Cave In Rock
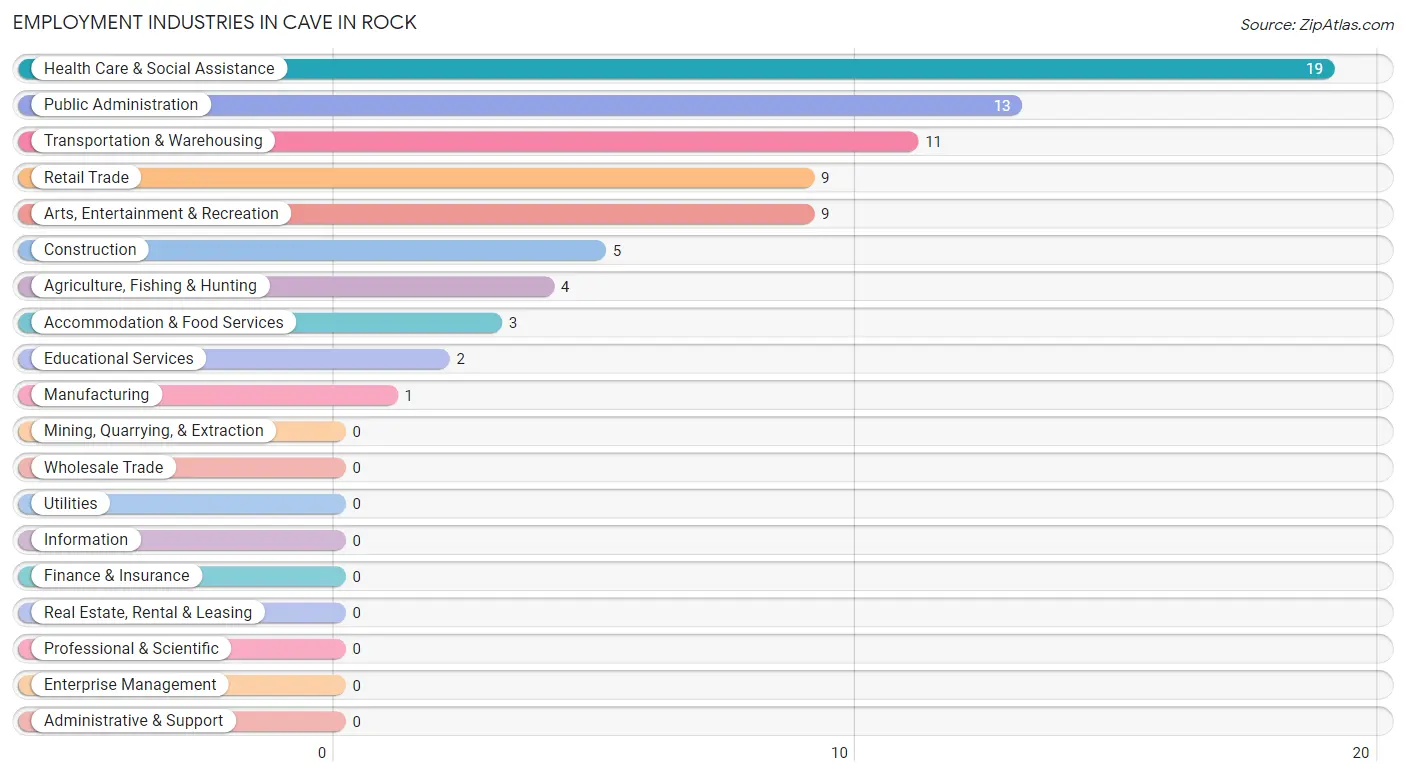
Employment Industries in Cave In Rock
The major employment industries in Cave In Rock include Health Care & Social Assistance (19 | 25.0%), Public Administration (13 | 17.1%), Transportation & Warehousing (11 | 14.5%), Retail Trade (9 | 11.8%), and Arts, Entertainment & Recreation (9 | 11.8%).
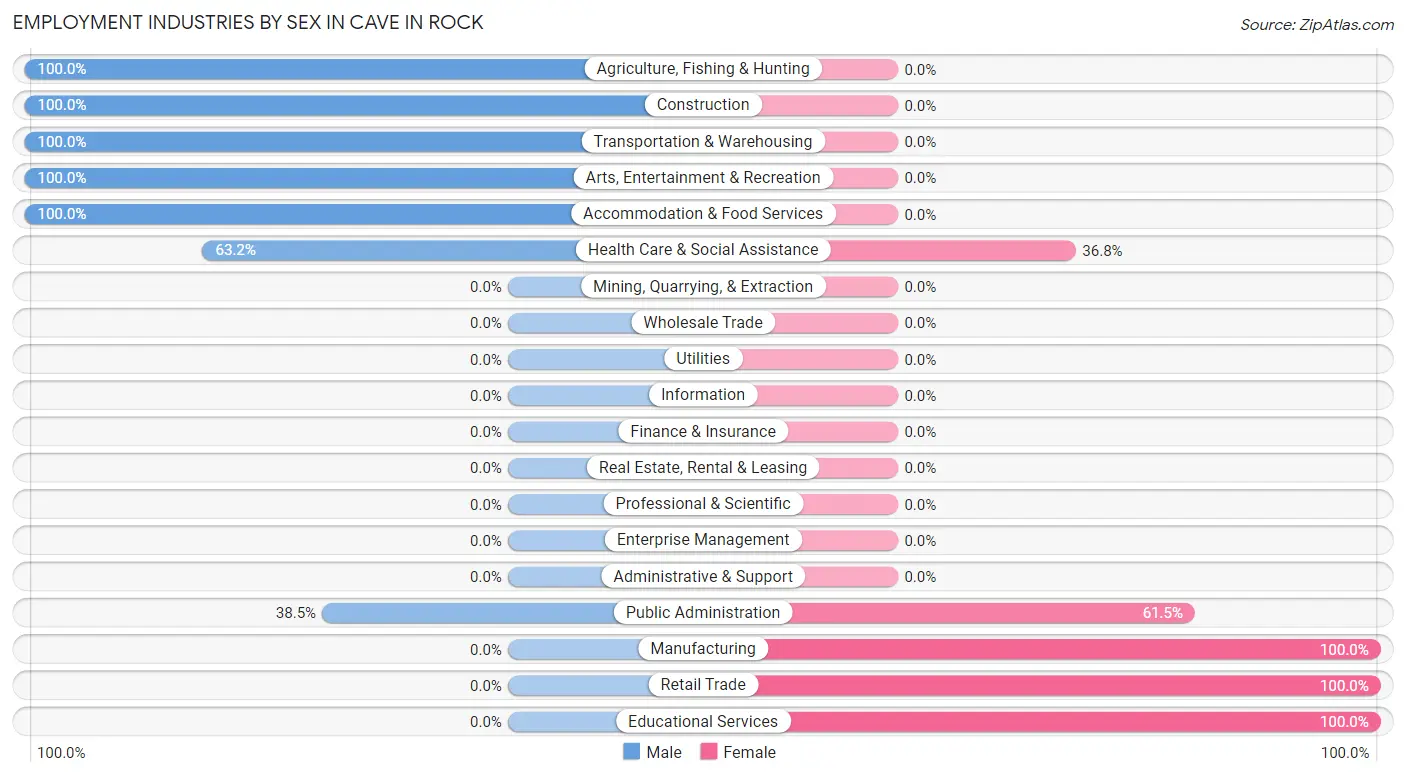
Employment Industries by Sex in Cave In Rock
The Cave In Rock industries that see more men than women are Agriculture, Fishing & Hunting (100.0%), Construction (100.0%), and Transportation & Warehousing (100.0%), whereas the industries that tend to have a higher number of women are Manufacturing (100.0%), Retail Trade (100.0%), and Educational Services (100.0%).
| Industry | Male | Female |
| Agriculture, Fishing & Hunting | 4 (100.0%) | 0 (0.0%) |
| Mining, Quarrying, & Extraction | 0 (0.0%) | 0 (0.0%) |
| Construction | 5 (100.0%) | 0 (0.0%) |
| Manufacturing | 0 (0.0%) | 1 (100.0%) |
| Wholesale Trade | 0 (0.0%) | 0 (0.0%) |
| Retail Trade | 0 (0.0%) | 9 (100.0%) |
| Transportation & Warehousing | 11 (100.0%) | 0 (0.0%) |
| Utilities | 0 (0.0%) | 0 (0.0%) |
| Information | 0 (0.0%) | 0 (0.0%) |
| Finance & Insurance | 0 (0.0%) | 0 (0.0%) |
| Real Estate, Rental & Leasing | 0 (0.0%) | 0 (0.0%) |
| Professional & Scientific | 0 (0.0%) | 0 (0.0%) |
| Enterprise Management | 0 (0.0%) | 0 (0.0%) |
| Administrative & Support | 0 (0.0%) | 0 (0.0%) |
| Educational Services | 0 (0.0%) | 2 (100.0%) |
| Health Care & Social Assistance | 12 (63.2%) | 7 (36.8%) |
| Arts, Entertainment & Recreation | 9 (100.0%) | 0 (0.0%) |
| Accommodation & Food Services | 3 (100.0%) | 0 (0.0%) |
| Public Administration | 5 (38.5%) | 8 (61.5%) |
| Total | 49 (64.5%) | 27 (35.5%) |
Education in Cave In Rock
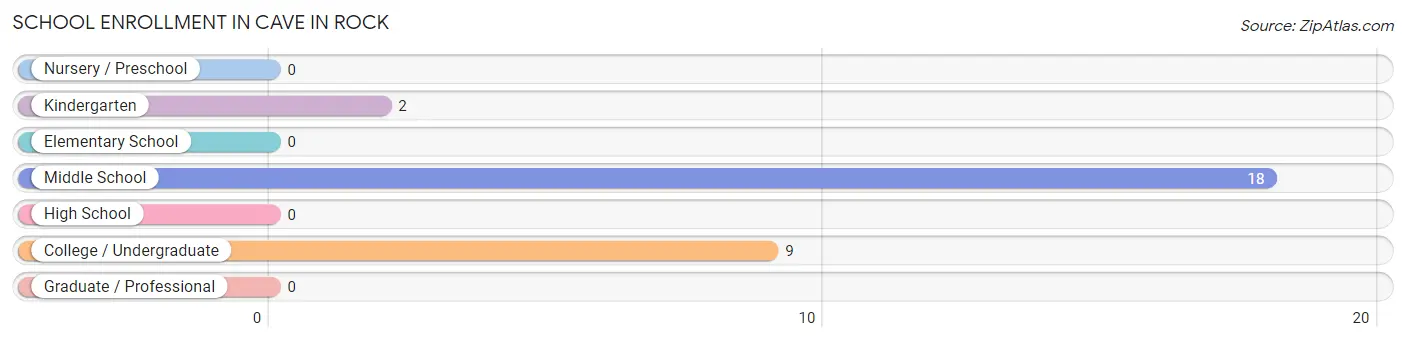
School Enrollment in Cave In Rock
The most common levels of schooling among the 29 students in Cave In Rock are middle school (18 | 62.1%), college / undergraduate (9 | 31.0%), and kindergarten (2 | 6.9%).
| School Level | # Students | % Students |
| Nursery / Preschool | 0 | 0.0% |
| Kindergarten | 2 | 6.9% |
| Elementary School | 0 | 0.0% |
| Middle School | 18 | 62.1% |
| High School | 0 | 0.0% |
| College / Undergraduate | 9 | 31.0% |
| Graduate / Professional | 0 | 0.0% |
| Total | 29 | 100.0% |
School Enrollment by Age by Funding Source in Cave In Rock
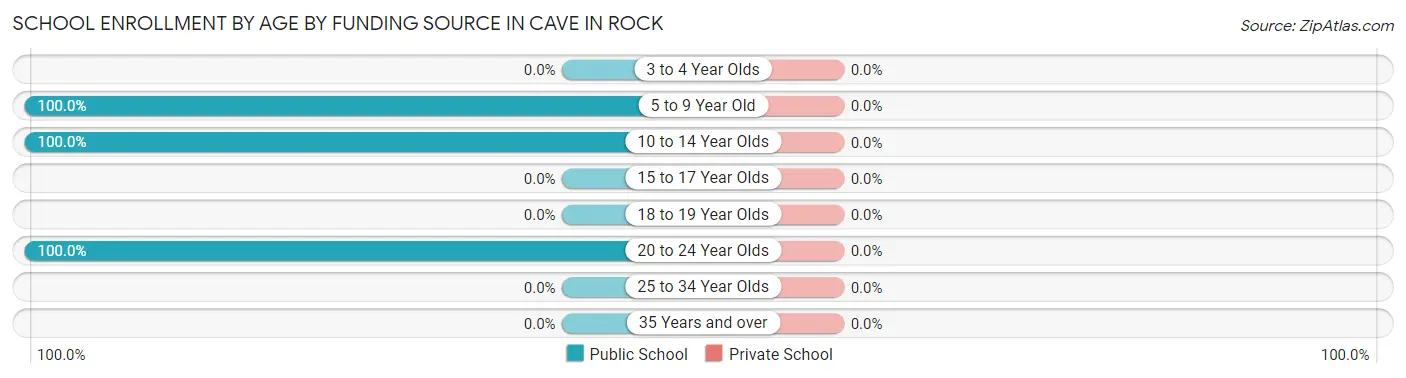
| Age Bracket | Public School | Private School |
| 3 to 4 Year Olds | 0 (0.0%) | 0 (0.0%) |
| 5 to 9 Year Old | 2 (100.0%) | 0 (0.0%) |
| 10 to 14 Year Olds | 18 (100.0%) | 0 (0.0%) |
| 15 to 17 Year Olds | 0 (0.0%) | 0 (0.0%) |
| 18 to 19 Year Olds | 0 (0.0%) | 0 (0.0%) |
| 20 to 24 Year Olds | 9 (100.0%) | 0 (0.0%) |
| 25 to 34 Year Olds | 0 (0.0%) | 0 (0.0%) |
| 35 Years and over | 0 (0.0%) | 0 (0.0%) |
| Total | 29 (100.0%) | 0 (0.0%) |
Educational Attainment by Field of Study in Cave In Rock
, and education (2 | 100.0%) are the most common fields of study among 2 individuals in Cave In Rock who have obtained a bachelor's degree or higher.
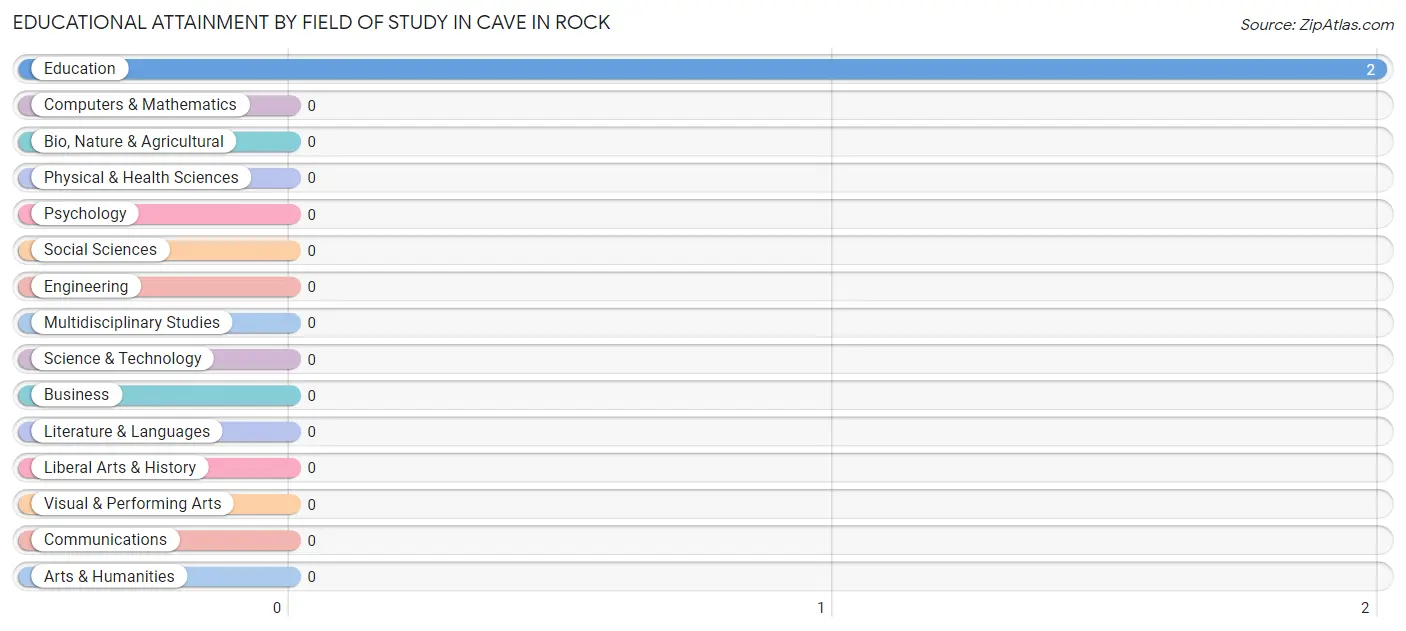
| Field of Study | # Graduates | % Graduates |
| Computers & Mathematics | 0 | 0.0% |
| Bio, Nature & Agricultural | 0 | 0.0% |
| Physical & Health Sciences | 0 | 0.0% |
| Psychology | 0 | 0.0% |
| Social Sciences | 0 | 0.0% |
| Engineering | 0 | 0.0% |
| Multidisciplinary Studies | 0 | 0.0% |
| Science & Technology | 0 | 0.0% |
| Business | 0 | 0.0% |
| Education | 2 | 100.0% |
| Literature & Languages | 0 | 0.0% |
| Liberal Arts & History | 0 | 0.0% |
| Visual & Performing Arts | 0 | 0.0% |
| Communications | 0 | 0.0% |
| Arts & Humanities | 0 | 0.0% |
| Total | 2 | 100.0% |
Transportation & Commute in Cave In Rock
Vehicle Availability by Sex in Cave In Rock
The most prevalent vehicle ownership categories in Cave In Rock are males with 1 vehicle (21, accounting for 42.9%) and females with 1 vehicle (6, making up 77.8%).
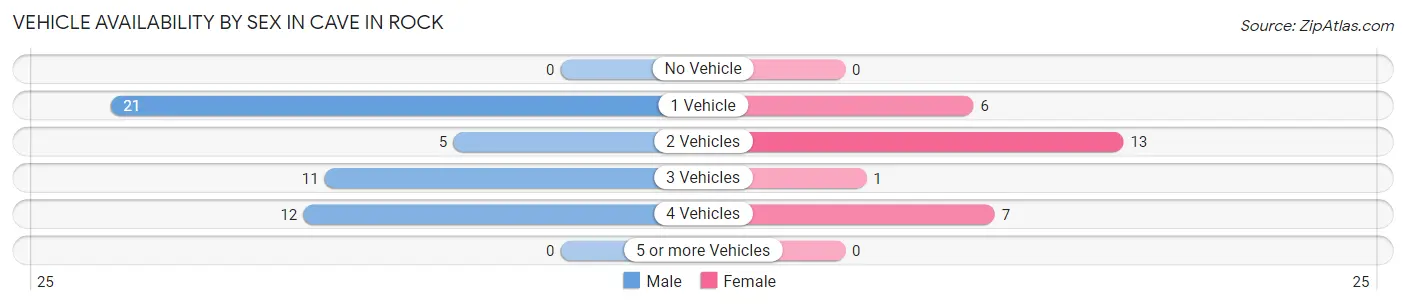
| Vehicles Available | Male | Female |
| No Vehicle | 0 (0.0%) | 0 (0.0%) |
| 1 Vehicle | 21 (42.9%) | 6 (22.2%) |
| 2 Vehicles | 5 (10.2%) | 13 (48.1%) |
| 3 Vehicles | 11 (22.5%) | 1 (3.7%) |
| 4 Vehicles | 12 (24.5%) | 7 (25.9%) |
| 5 or more Vehicles | 0 (0.0%) | 0 (0.0%) |
| Total | 49 (100.0%) | 27 (100.0%) |
Commute Time in Cave In Rock
The most frequently occuring commute durations in Cave In Rock are less than 5 minutes (21 commuters, 28.4%), 30 to 34 minutes (12 commuters, 16.2%), and 60 to 89 minutes (12 commuters, 16.2%).
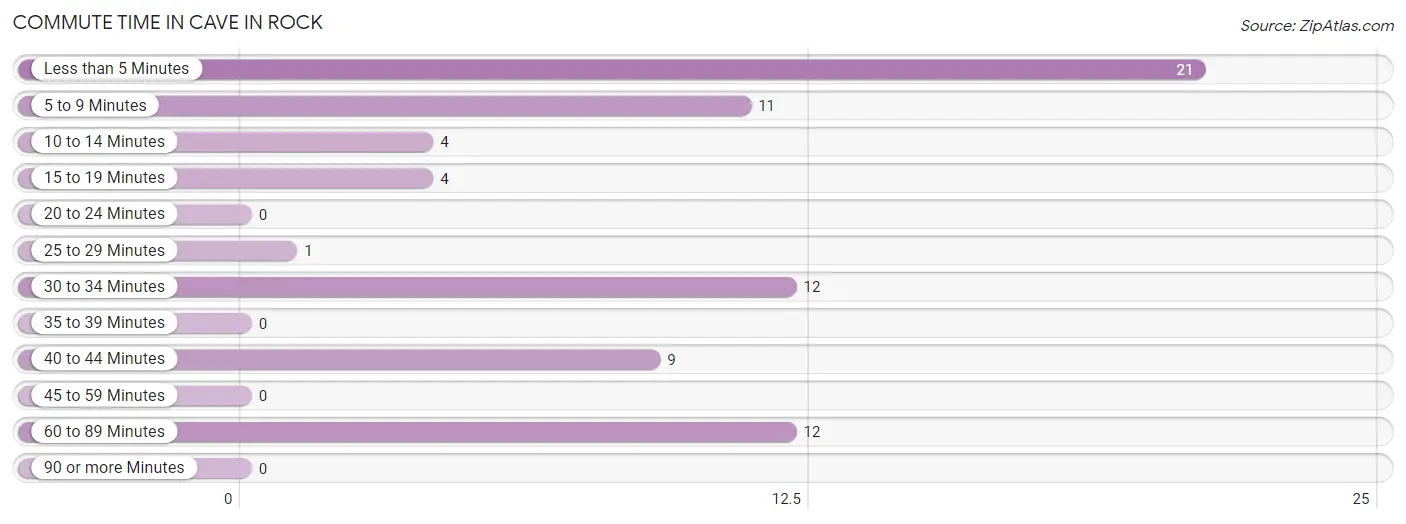
| Commute Time | # Commuters | % Commuters |
| Less than 5 Minutes | 21 | 28.4% |
| 5 to 9 Minutes | 11 | 14.9% |
| 10 to 14 Minutes | 4 | 5.4% |
| 15 to 19 Minutes | 4 | 5.4% |
| 20 to 24 Minutes | 0 | 0.0% |
| 25 to 29 Minutes | 1 | 1.3% |
| 30 to 34 Minutes | 12 | 16.2% |
| 35 to 39 Minutes | 0 | 0.0% |
| 40 to 44 Minutes | 9 | 12.2% |
| 45 to 59 Minutes | 0 | 0.0% |
| 60 to 89 Minutes | 12 | 16.2% |
| 90 or more Minutes | 0 | 0.0% |
Commute Time by Sex in Cave In Rock
The most common commute times in Cave In Rock are less than 5 minutes (17 commuters, 34.7%) for males and 40 to 44 minutes (9 commuters, 36.0%) for females.
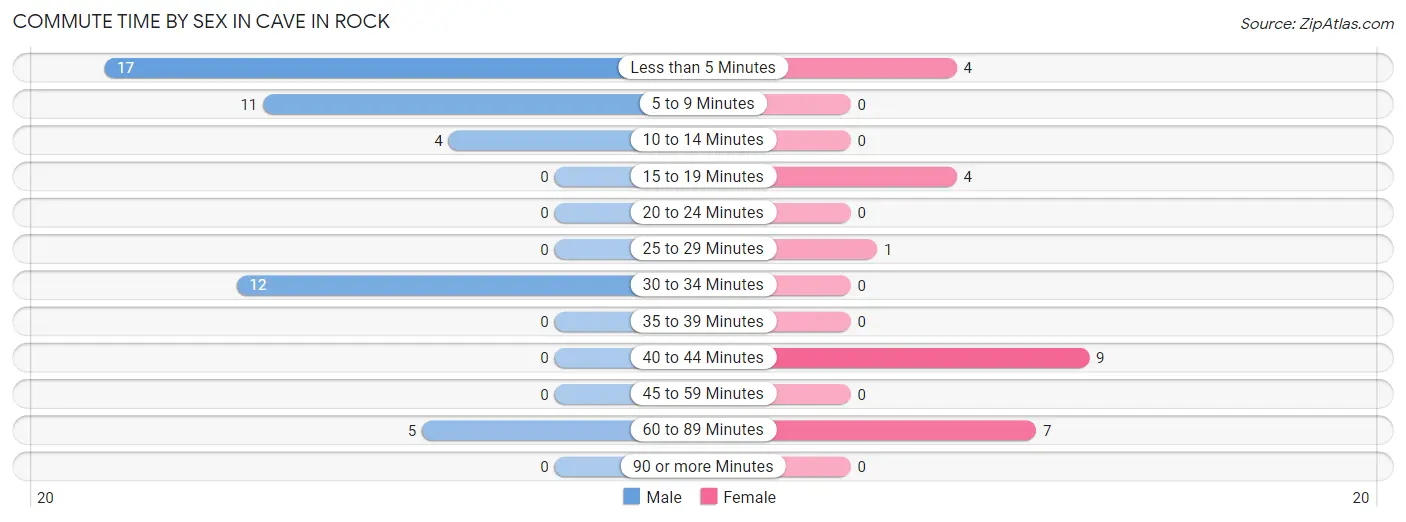
| Commute Time | Male | Female |
| Less than 5 Minutes | 17 (34.7%) | 4 (16.0%) |
| 5 to 9 Minutes | 11 (22.5%) | 0 (0.0%) |
| 10 to 14 Minutes | 4 (8.2%) | 0 (0.0%) |
| 15 to 19 Minutes | 0 (0.0%) | 4 (16.0%) |
| 20 to 24 Minutes | 0 (0.0%) | 0 (0.0%) |
| 25 to 29 Minutes | 0 (0.0%) | 1 (4.0%) |
| 30 to 34 Minutes | 12 (24.5%) | 0 (0.0%) |
| 35 to 39 Minutes | 0 (0.0%) | 0 (0.0%) |
| 40 to 44 Minutes | 0 (0.0%) | 9 (36.0%) |
| 45 to 59 Minutes | 0 (0.0%) | 0 (0.0%) |
| 60 to 89 Minutes | 5 (10.2%) | 7 (28.0%) |
| 90 or more Minutes | 0 (0.0%) | 0 (0.0%) |
Time of Departure to Work by Sex in Cave In Rock
The most frequent times of departure to work in Cave In Rock are 7:00 AM to 7:29 AM (19, 38.8%) for males and 4:00 PM to 11:59 PM (11, 44.0%) for females.
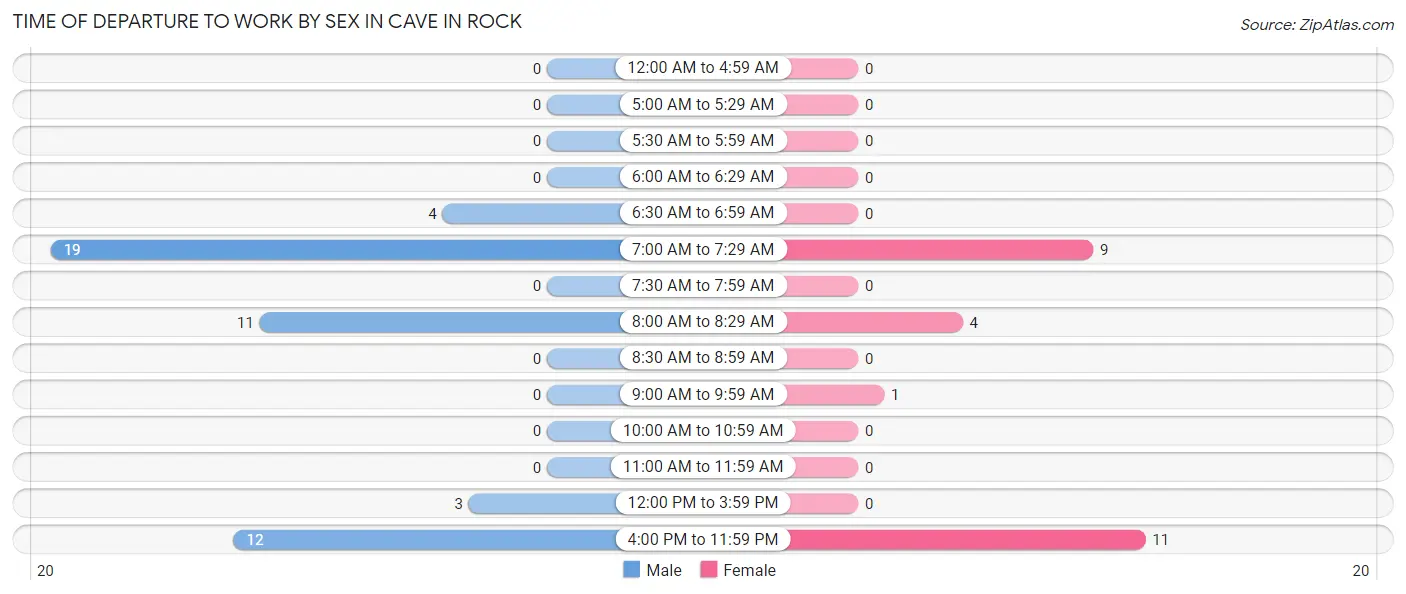
| Time of Departure | Male | Female |
| 12:00 AM to 4:59 AM | 0 (0.0%) | 0 (0.0%) |
| 5:00 AM to 5:29 AM | 0 (0.0%) | 0 (0.0%) |
| 5:30 AM to 5:59 AM | 0 (0.0%) | 0 (0.0%) |
| 6:00 AM to 6:29 AM | 0 (0.0%) | 0 (0.0%) |
| 6:30 AM to 6:59 AM | 4 (8.2%) | 0 (0.0%) |
| 7:00 AM to 7:29 AM | 19 (38.8%) | 9 (36.0%) |
| 7:30 AM to 7:59 AM | 0 (0.0%) | 0 (0.0%) |
| 8:00 AM to 8:29 AM | 11 (22.5%) | 4 (16.0%) |
| 8:30 AM to 8:59 AM | 0 (0.0%) | 0 (0.0%) |
| 9:00 AM to 9:59 AM | 0 (0.0%) | 1 (4.0%) |
| 10:00 AM to 10:59 AM | 0 (0.0%) | 0 (0.0%) |
| 11:00 AM to 11:59 AM | 0 (0.0%) | 0 (0.0%) |
| 12:00 PM to 3:59 PM | 3 (6.1%) | 0 (0.0%) |
| 4:00 PM to 11:59 PM | 12 (24.5%) | 11 (44.0%) |
| Total | 49 (100.0%) | 25 (100.0%) |
Housing Occupancy in Cave In Rock
Occupancy by Ownership in Cave In Rock
Of the total 97 dwellings in Cave In Rock, owner-occupied units account for 42 (43.3%), while renter-occupied units make up 55 (56.7%).
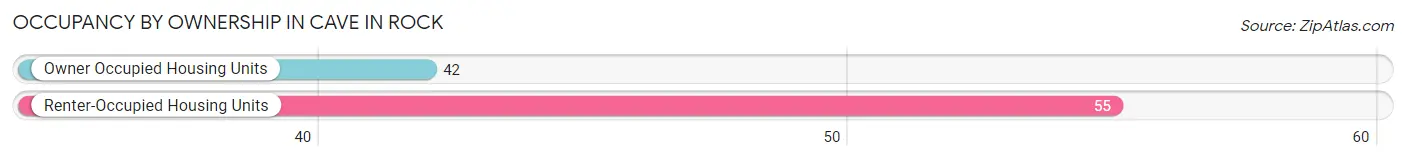
| Occupancy | # Housing Units | % Housing Units |
| Owner Occupied Housing Units | 42 | 43.3% |
| Renter-Occupied Housing Units | 55 | 56.7% |
| Total Occupied Housing Units | 97 | 100.0% |
Occupancy by Household Size in Cave In Rock
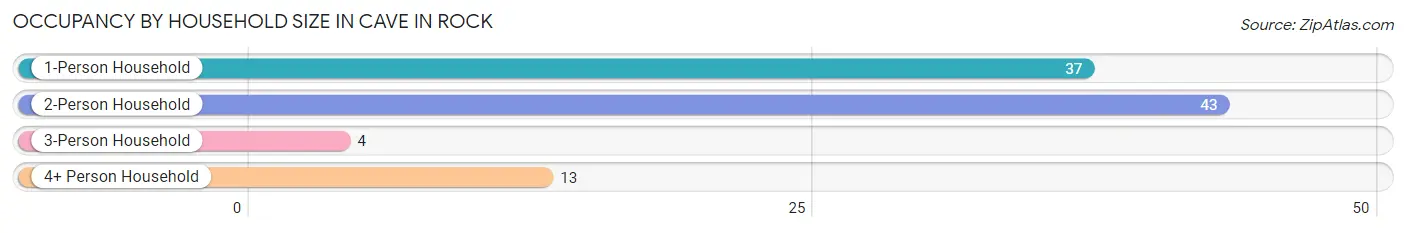
| Household Size | # Housing Units | % Housing Units |
| 1-Person Household | 37 | 38.1% |
| 2-Person Household | 43 | 44.3% |
| 3-Person Household | 4 | 4.1% |
| 4+ Person Household | 13 | 13.4% |
| Total Housing Units | 97 | 100.0% |
Occupancy by Ownership by Household Size in Cave In Rock
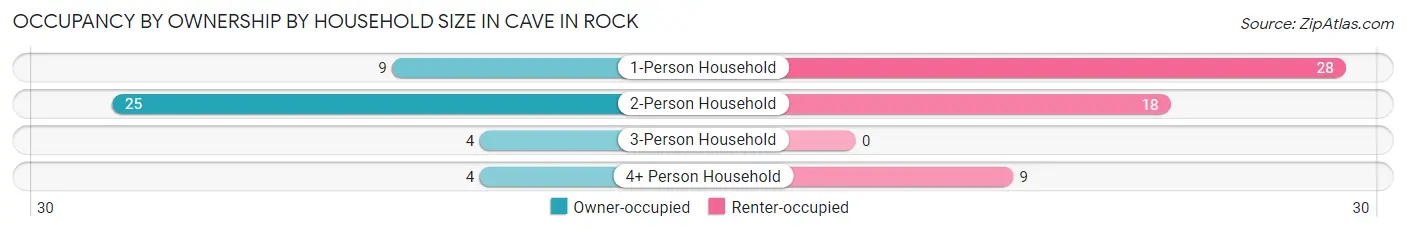
| Household Size | Owner-occupied | Renter-occupied |
| 1-Person Household | 9 (24.3%) | 28 (75.7%) |
| 2-Person Household | 25 (58.1%) | 18 (41.9%) |
| 3-Person Household | 4 (100.0%) | 0 (0.0%) |
| 4+ Person Household | 4 (30.8%) | 9 (69.2%) |
| Total Housing Units | 42 (43.3%) | 55 (56.7%) |
Occupancy by Educational Attainment in Cave In Rock
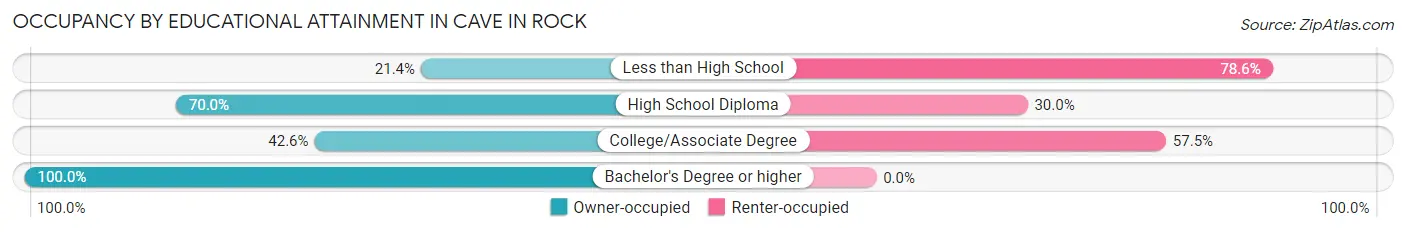
| Household Size | Owner-occupied | Renter-occupied |
| Less than High School | 6 (21.4%) | 22 (78.6%) |
| High School Diploma | 14 (70.0%) | 6 (30.0%) |
| College/Associate Degree | 20 (42.5%) | 27 (57.5%) |
| Bachelor's Degree or higher | 2 (100.0%) | 0 (0.0%) |
Occupancy by Age of Householder in Cave In Rock
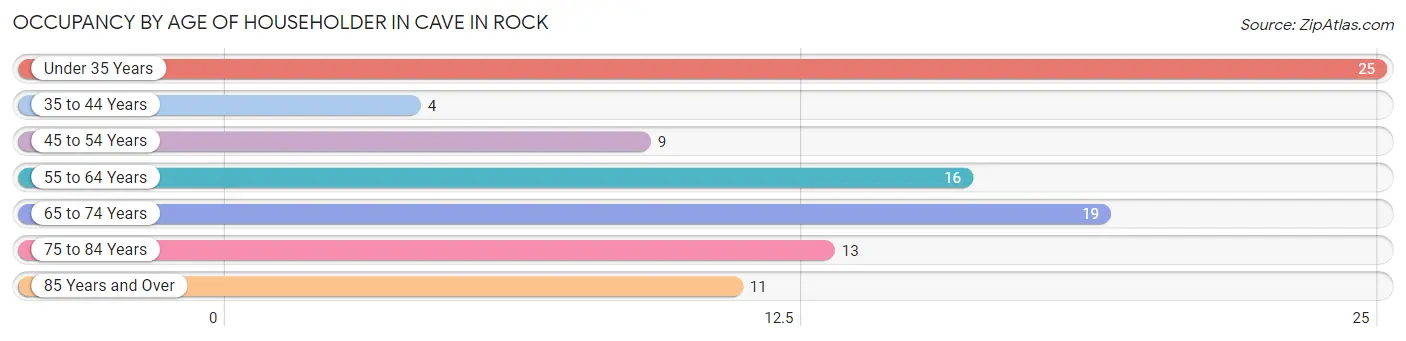
| Age Bracket | # Households | % Households |
| Under 35 Years | 25 | 25.8% |
| 35 to 44 Years | 4 | 4.1% |
| 45 to 54 Years | 9 | 9.3% |
| 55 to 64 Years | 16 | 16.5% |
| 65 to 74 Years | 19 | 19.6% |
| 75 to 84 Years | 13 | 13.4% |
| 85 Years and Over | 11 | 11.3% |
| Total | 97 | 100.0% |
Housing Finances in Cave In Rock
Median Income by Occupancy in Cave In Rock
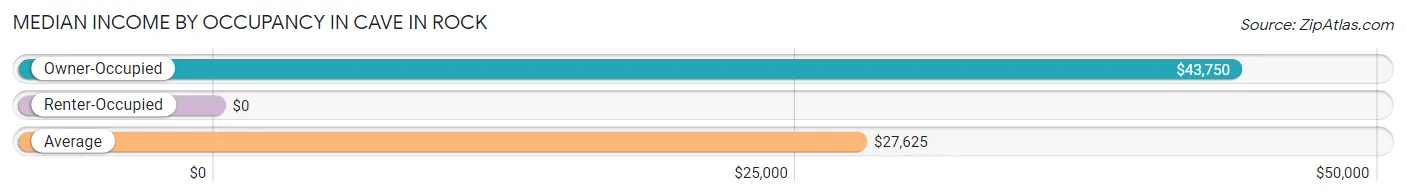
| Occupancy Type | # Households | Median Income |
| Owner-Occupied | 42 (43.3%) | $43,750 |
| Renter-Occupied | 55 (56.7%) | $0 |
| Average | 97 (100.0%) | $27,625 |
Occupancy by Householder Income Bracket in Cave In Rock
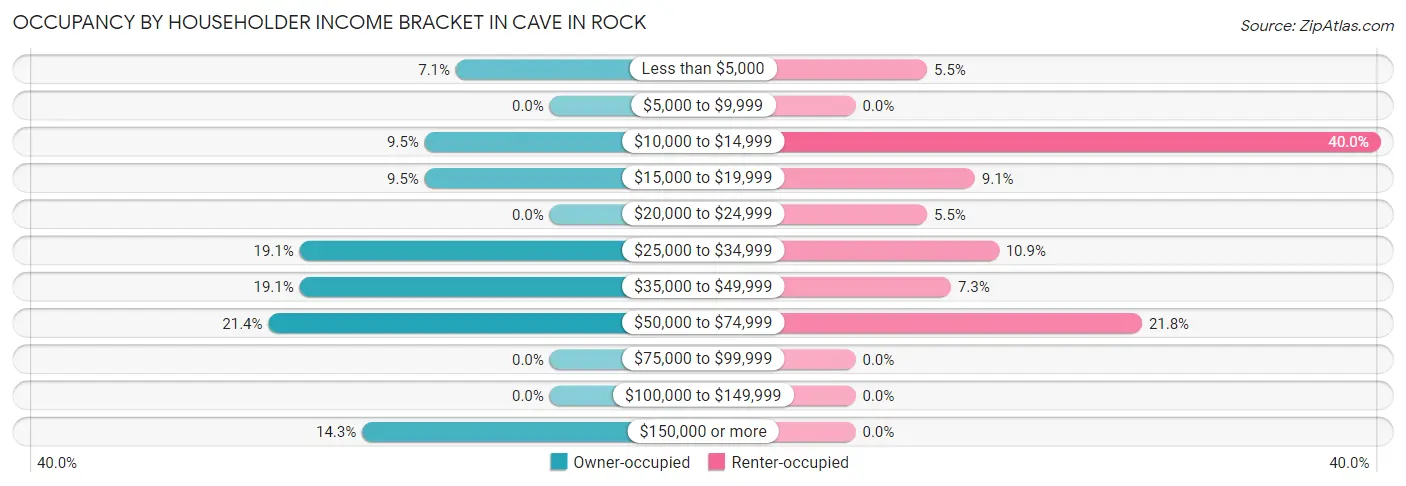
| Income Bracket | Owner-occupied | Renter-occupied |
| Less than $5,000 | 3 (7.1%) | 3 (5.4%) |
| $5,000 to $9,999 | 0 (0.0%) | 0 (0.0%) |
| $10,000 to $14,999 | 4 (9.5%) | 22 (40.0%) |
| $15,000 to $19,999 | 4 (9.5%) | 5 (9.1%) |
| $20,000 to $24,999 | 0 (0.0%) | 3 (5.4%) |
| $25,000 to $34,999 | 8 (19.1%) | 6 (10.9%) |
| $35,000 to $49,999 | 8 (19.1%) | 4 (7.3%) |
| $50,000 to $74,999 | 9 (21.4%) | 12 (21.8%) |
| $75,000 to $99,999 | 0 (0.0%) | 0 (0.0%) |
| $100,000 to $149,999 | 0 (0.0%) | 0 (0.0%) |
| $150,000 or more | 6 (14.3%) | 0 (0.0%) |
| Total | 42 (100.0%) | 55 (100.0%) |
Monthly Housing Cost Tiers in Cave In Rock
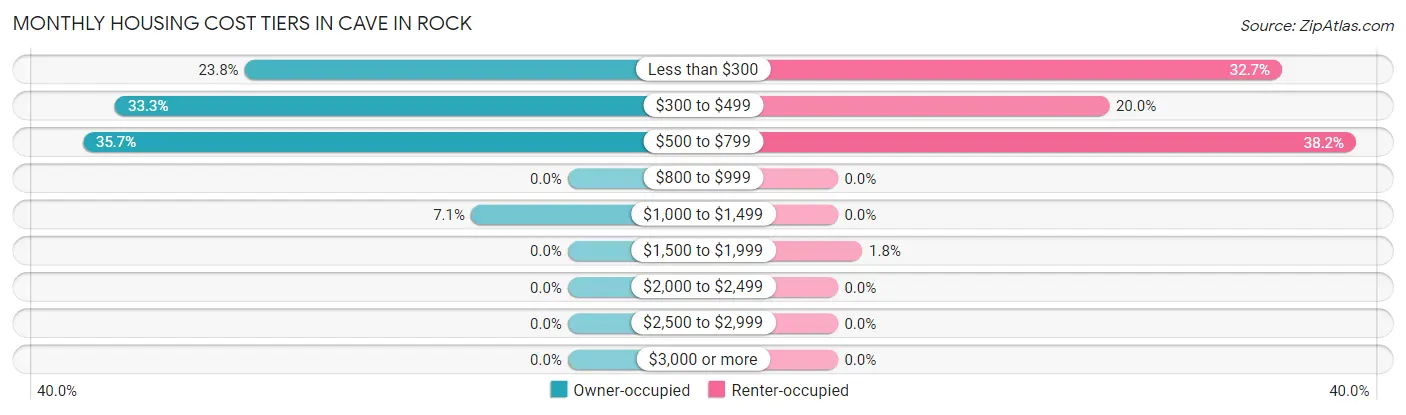
| Monthly Cost | Owner-occupied | Renter-occupied |
| Less than $300 | 10 (23.8%) | 18 (32.7%) |
| $300 to $499 | 14 (33.3%) | 11 (20.0%) |
| $500 to $799 | 15 (35.7%) | 21 (38.2%) |
| $800 to $999 | 0 (0.0%) | 0 (0.0%) |
| $1,000 to $1,499 | 3 (7.1%) | 0 (0.0%) |
| $1,500 to $1,999 | 0 (0.0%) | 1 (1.8%) |
| $2,000 to $2,499 | 0 (0.0%) | 0 (0.0%) |
| $2,500 to $2,999 | 0 (0.0%) | 0 (0.0%) |
| $3,000 or more | 0 (0.0%) | 0 (0.0%) |
| Total | 42 (100.0%) | 55 (100.0%) |
Physical Housing Characteristics in Cave In Rock
Housing Structures in Cave In Rock
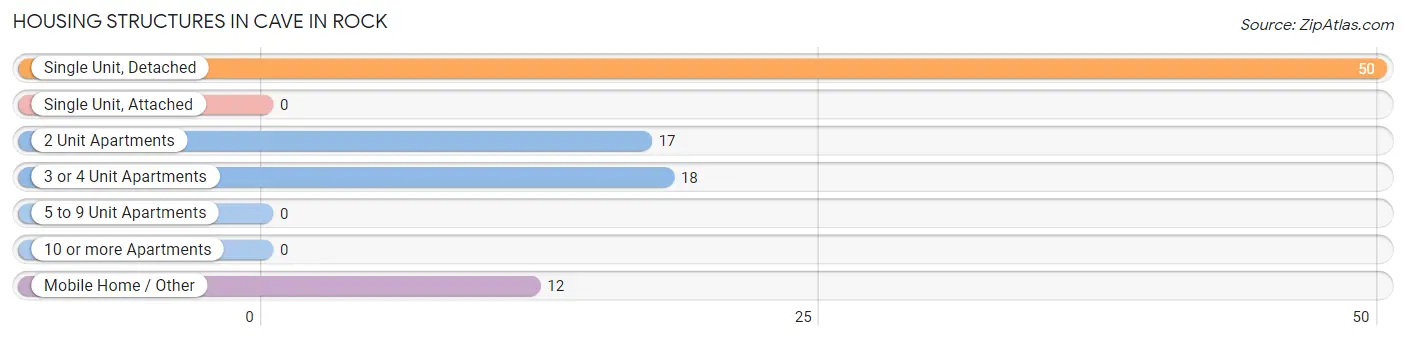
| Structure Type | # Housing Units | % Housing Units |
| Single Unit, Detached | 50 | 51.5% |
| Single Unit, Attached | 0 | 0.0% |
| 2 Unit Apartments | 17 | 17.5% |
| 3 or 4 Unit Apartments | 18 | 18.6% |
| 5 to 9 Unit Apartments | 0 | 0.0% |
| 10 or more Apartments | 0 | 0.0% |
| Mobile Home / Other | 12 | 12.4% |
| Total | 97 | 100.0% |
Housing Structures by Occupancy in Cave In Rock
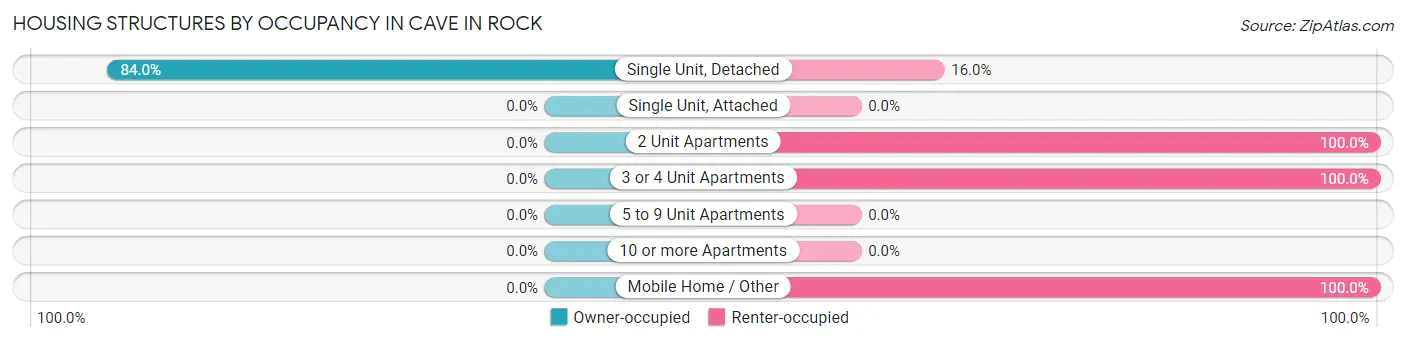
| Structure Type | Owner-occupied | Renter-occupied |
| Single Unit, Detached | 42 (84.0%) | 8 (16.0%) |
| Single Unit, Attached | 0 (0.0%) | 0 (0.0%) |
| 2 Unit Apartments | 0 (0.0%) | 17 (100.0%) |
| 3 or 4 Unit Apartments | 0 (0.0%) | 18 (100.0%) |
| 5 to 9 Unit Apartments | 0 (0.0%) | 0 (0.0%) |
| 10 or more Apartments | 0 (0.0%) | 0 (0.0%) |
| Mobile Home / Other | 0 (0.0%) | 12 (100.0%) |
| Total | 42 (43.3%) | 55 (56.7%) |
Housing Structures by Number of Rooms in Cave In Rock
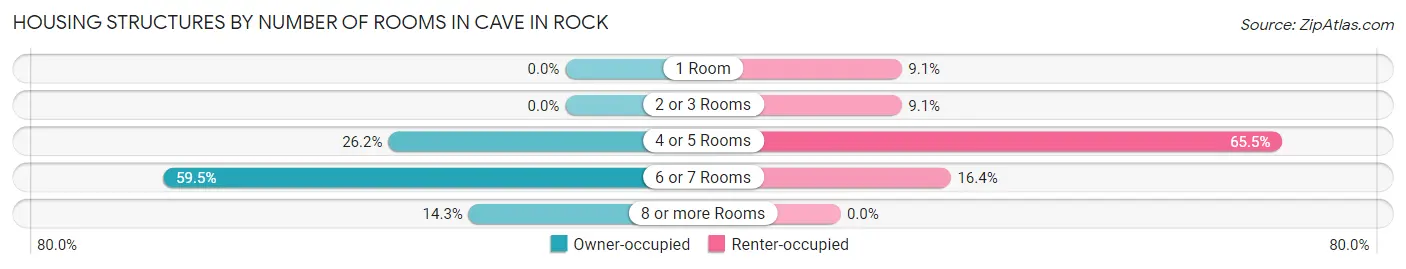
| Number of Rooms | Owner-occupied | Renter-occupied |
| 1 Room | 0 (0.0%) | 5 (9.1%) |
| 2 or 3 Rooms | 0 (0.0%) | 5 (9.1%) |
| 4 or 5 Rooms | 11 (26.2%) | 36 (65.4%) |
| 6 or 7 Rooms | 25 (59.5%) | 9 (16.4%) |
| 8 or more Rooms | 6 (14.3%) | 0 (0.0%) |
| Total | 42 (100.0%) | 55 (100.0%) |
Housing Structure by Heating Type in Cave In Rock
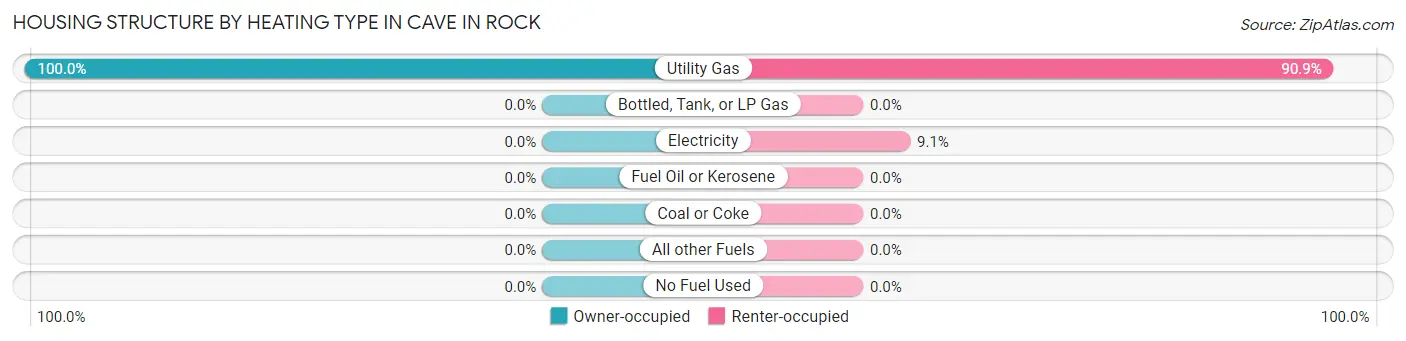
| Heating Type | Owner-occupied | Renter-occupied |
| Utility Gas | 42 (100.0%) | 50 (90.9%) |
| Bottled, Tank, or LP Gas | 0 (0.0%) | 0 (0.0%) |
| Electricity | 0 (0.0%) | 5 (9.1%) |
| Fuel Oil or Kerosene | 0 (0.0%) | 0 (0.0%) |
| Coal or Coke | 0 (0.0%) | 0 (0.0%) |
| All other Fuels | 0 (0.0%) | 0 (0.0%) |
| No Fuel Used | 0 (0.0%) | 0 (0.0%) |
| Total | 42 (100.0%) | 55 (100.0%) |
Household Vehicle Usage in Cave In Rock
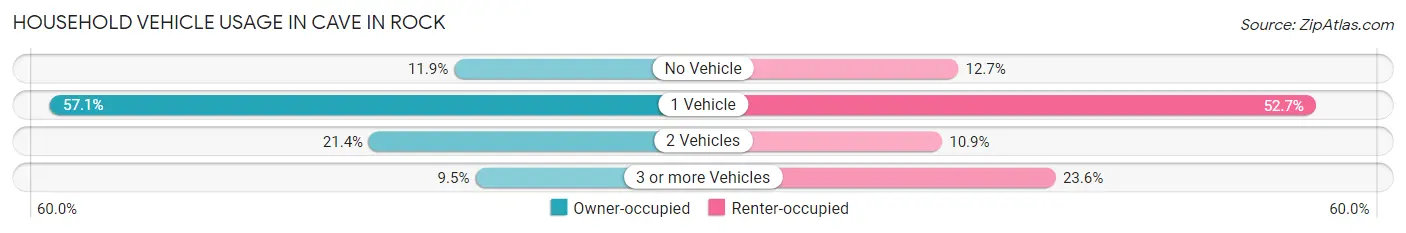
| Vehicles per Household | Owner-occupied | Renter-occupied |
| No Vehicle | 5 (11.9%) | 7 (12.7%) |
| 1 Vehicle | 24 (57.1%) | 29 (52.7%) |
| 2 Vehicles | 9 (21.4%) | 6 (10.9%) |
| 3 or more Vehicles | 4 (9.5%) | 13 (23.6%) |
| Total | 42 (100.0%) | 55 (100.0%) |
Real Estate & Mortgages in Cave In Rock
Real Estate and Mortgage Overview in Cave In Rock
| Characteristic | Without Mortgage | With Mortgage |
| Housing Units | 33 | 9 |
| Median Property Value | $35,400 | $0 |
| Median Household Income | $46,042 | $2 |
| Monthly Housing Costs | $425 | $0 |
| Real Estate Taxes | - | - |
Property Value by Mortgage Status in Cave In Rock
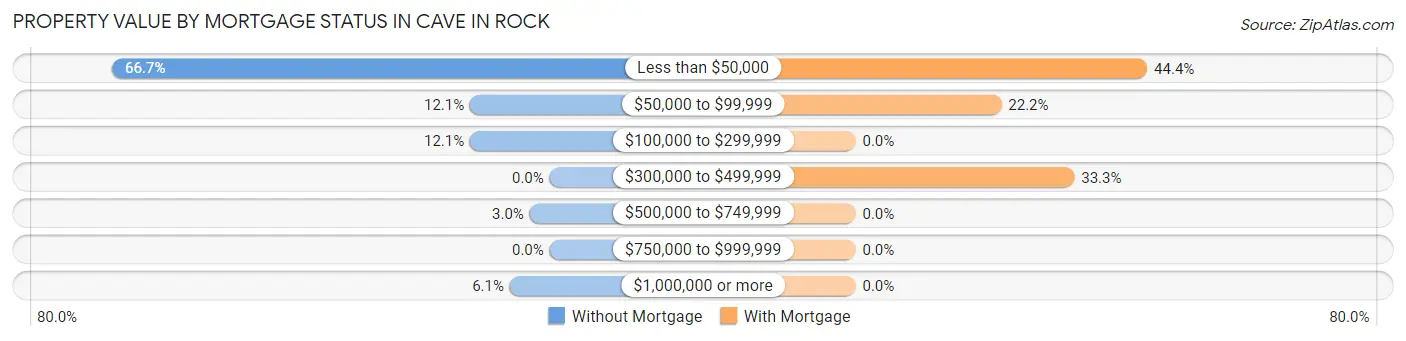
| Property Value | Without Mortgage | With Mortgage |
| Less than $50,000 | 22 (66.7%) | 4 (44.4%) |
| $50,000 to $99,999 | 4 (12.1%) | 2 (22.2%) |
| $100,000 to $299,999 | 4 (12.1%) | 0 (0.0%) |
| $300,000 to $499,999 | 0 (0.0%) | 3 (33.3%) |
| $500,000 to $749,999 | 1 (3.0%) | 0 (0.0%) |
| $750,000 to $999,999 | 0 (0.0%) | 0 (0.0%) |
| $1,000,000 or more | 2 (6.1%) | 0 (0.0%) |
| Total | 33 (100.0%) | 9 (100.0%) |
Household Income by Mortgage Status in Cave In Rock
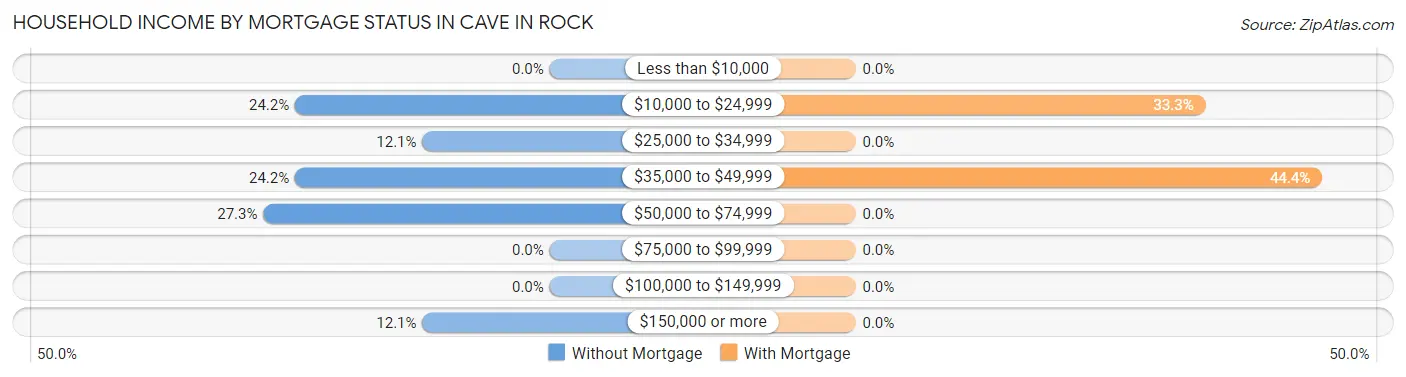
| Household Income | Without Mortgage | With Mortgage |
| Less than $10,000 | 0 (0.0%) | 0 (0.0%) |
| $10,000 to $24,999 | 8 (24.2%) | 3 (33.3%) |
| $25,000 to $34,999 | 4 (12.1%) | 0 (0.0%) |
| $35,000 to $49,999 | 8 (24.2%) | 4 (44.4%) |
| $50,000 to $74,999 | 9 (27.3%) | 0 (0.0%) |
| $75,000 to $99,999 | 0 (0.0%) | 0 (0.0%) |
| $100,000 to $149,999 | 0 (0.0%) | 0 (0.0%) |
| $150,000 or more | 4 (12.1%) | 0 (0.0%) |
| Total | 33 (100.0%) | 9 (100.0%) |
Property Value to Household Income Ratio in Cave In Rock
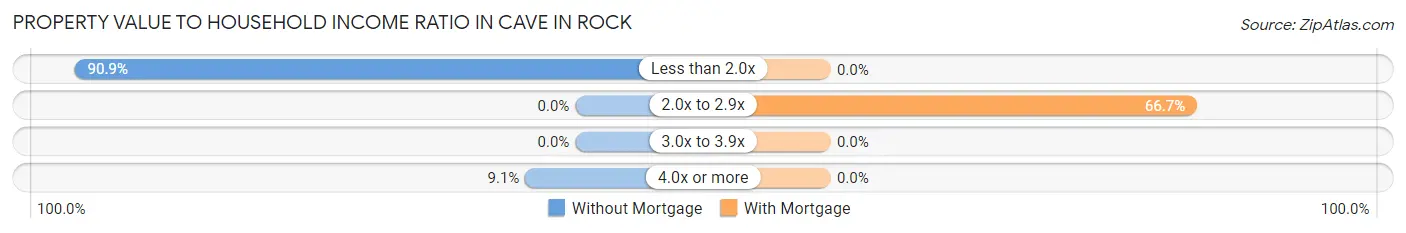
| Value-to-Income Ratio | Without Mortgage | With Mortgage |
| Less than 2.0x | 30 (90.9%) | 0 (0.0%) |
| 2.0x to 2.9x | 0 (0.0%) | 6 (66.7%) |
| 3.0x to 3.9x | 0 (0.0%) | 0 (0.0%) |
| 4.0x or more | 3 (9.1%) | 0 (0.0%) |
| Total | 33 (100.0%) | 9 (100.0%) |
Real Estate Taxes by Mortgage Status in Cave In Rock
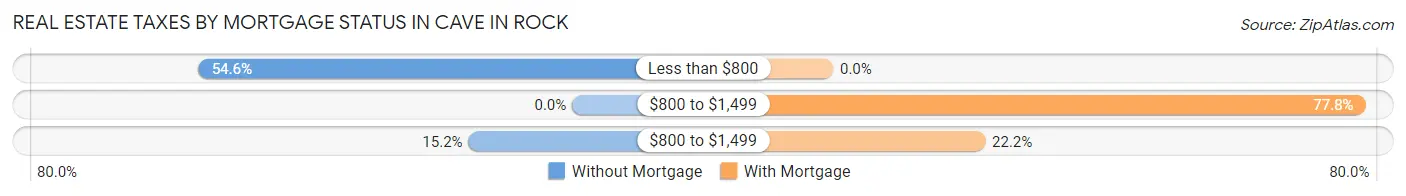
| Property Taxes | Without Mortgage | With Mortgage |
| Less than $800 | 18 (54.5%) | 0 (0.0%) |
| $800 to $1,499 | 0 (0.0%) | 7 (77.8%) |
| $800 to $1,499 | 5 (15.1%) | 2 (22.2%) |
| Total | 33 (100.0%) | 9 (100.0%) |
Health & Disability in Cave In Rock
Health Insurance Coverage by Age in Cave In Rock
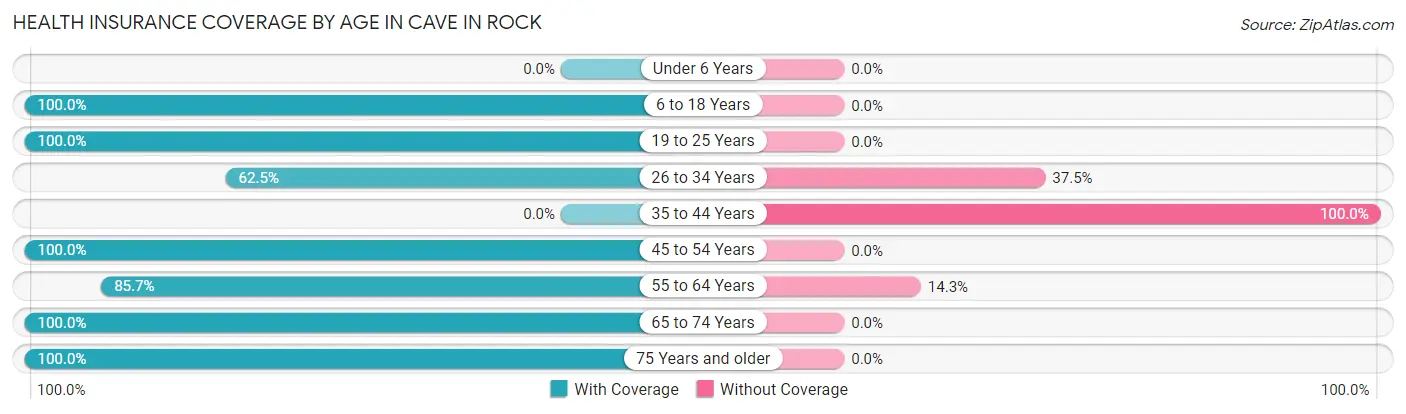
| Age Bracket | With Coverage | Without Coverage |
| Under 6 Years | 0 (0.0%) | 0 (0.0%) |
| 6 to 18 Years | 20 (100.0%) | 0 (0.0%) |
| 19 to 25 Years | 12 (100.0%) | 0 (0.0%) |
| 26 to 34 Years | 20 (62.5%) | 12 (37.5%) |
| 35 to 44 Years | 0 (0.0%) | 22 (100.0%) |
| 45 to 54 Years | 15 (100.0%) | 0 (0.0%) |
| 55 to 64 Years | 24 (85.7%) | 4 (14.3%) |
| 65 to 74 Years | 35 (100.0%) | 0 (0.0%) |
| 75 Years and older | 33 (100.0%) | 0 (0.0%) |
| Total | 159 (80.7%) | 38 (19.3%) |
Health Insurance Coverage by Citizenship Status in Cave In Rock
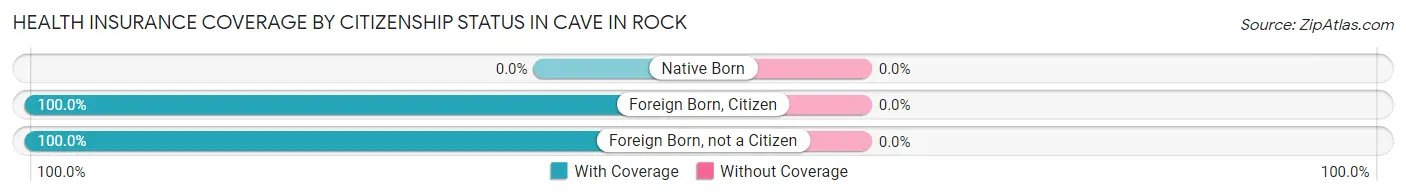
| Citizenship Status | With Coverage | Without Coverage |
| Native Born | 0 (0.0%) | 0 (0.0%) |
| Foreign Born, Citizen | 20 (100.0%) | 0 (0.0%) |
| Foreign Born, not a Citizen | 12 (100.0%) | 0 (0.0%) |
Health Insurance Coverage by Household Income in Cave In Rock
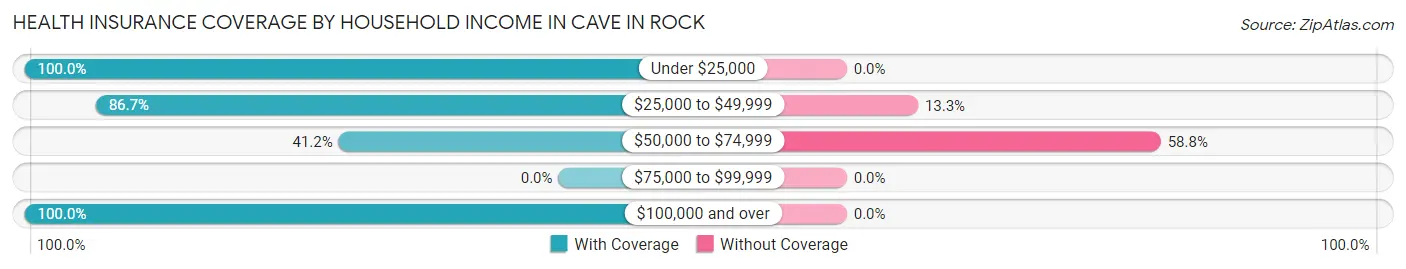
| Household Income | With Coverage | Without Coverage |
| Under $25,000 | 62 (100.0%) | 0 (0.0%) |
| $25,000 to $49,999 | 52 (86.7%) | 8 (13.3%) |
| $50,000 to $74,999 | 21 (41.2%) | 30 (58.8%) |
| $75,000 to $99,999 | 0 (0.0%) | 0 (0.0%) |
| $100,000 and over | 24 (100.0%) | 0 (0.0%) |
Public vs Private Health Insurance Coverage by Age in Cave In Rock
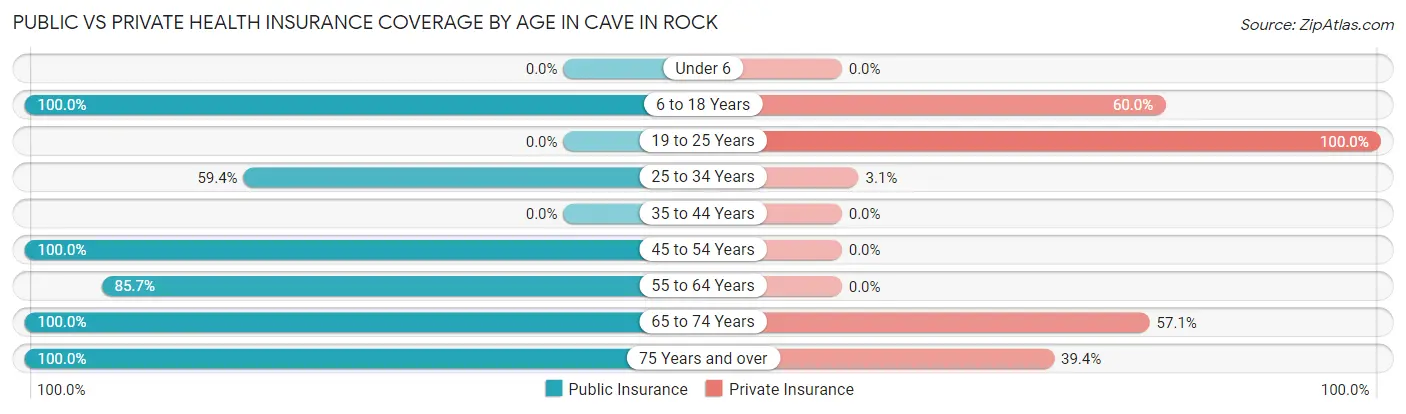
| Age Bracket | Public Insurance | Private Insurance |
| Under 6 | 0 (0.0%) | 0 (0.0%) |
| 6 to 18 Years | 20 (100.0%) | 12 (60.0%) |
| 19 to 25 Years | 0 (0.0%) | 12 (100.0%) |
| 25 to 34 Years | 19 (59.4%) | 1 (3.1%) |
| 35 to 44 Years | 0 (0.0%) | 0 (0.0%) |
| 45 to 54 Years | 15 (100.0%) | 0 (0.0%) |
| 55 to 64 Years | 24 (85.7%) | 0 (0.0%) |
| 65 to 74 Years | 35 (100.0%) | 20 (57.1%) |
| 75 Years and over | 33 (100.0%) | 13 (39.4%) |
| Total | 146 (74.1%) | 58 (29.4%) |
Disability Status by Sex by Age in Cave In Rock
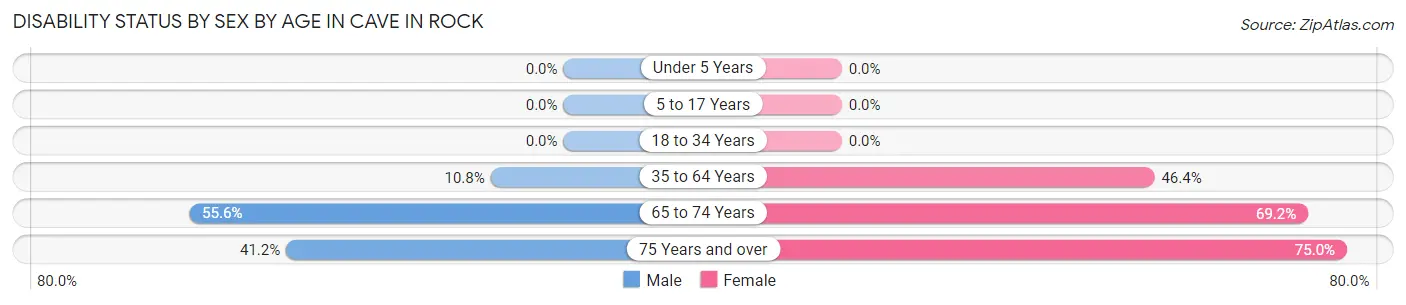
| Age Bracket | Male | Female |
| Under 5 Years | 0 (0.0%) | 0 (0.0%) |
| 5 to 17 Years | 0 (0.0%) | 0 (0.0%) |
| 18 to 34 Years | 0 (0.0%) | 0 (0.0%) |
| 35 to 64 Years | 4 (10.8%) | 13 (46.4%) |
| 65 to 74 Years | 5 (55.6%) | 18 (69.2%) |
| 75 Years and over | 7 (41.2%) | 12 (75.0%) |
Disability Class by Sex by Age in Cave In Rock
Disability Class: Hearing Difficulty
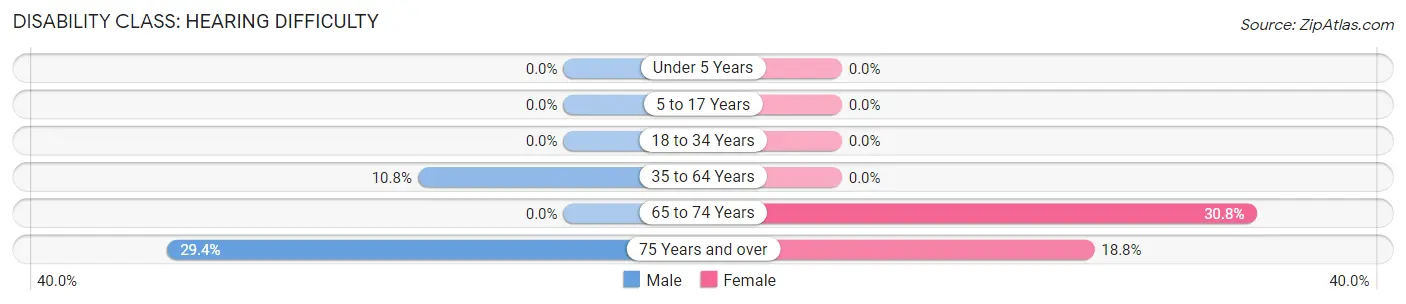
| Age Bracket | Male | Female |
| Under 5 Years | 0 (0.0%) | 0 (0.0%) |
| 5 to 17 Years | 0 (0.0%) | 0 (0.0%) |
| 18 to 34 Years | 0 (0.0%) | 0 (0.0%) |
| 35 to 64 Years | 4 (10.8%) | 0 (0.0%) |
| 65 to 74 Years | 0 (0.0%) | 8 (30.8%) |
| 75 Years and over | 5 (29.4%) | 3 (18.8%) |
Disability Class: Vision Difficulty
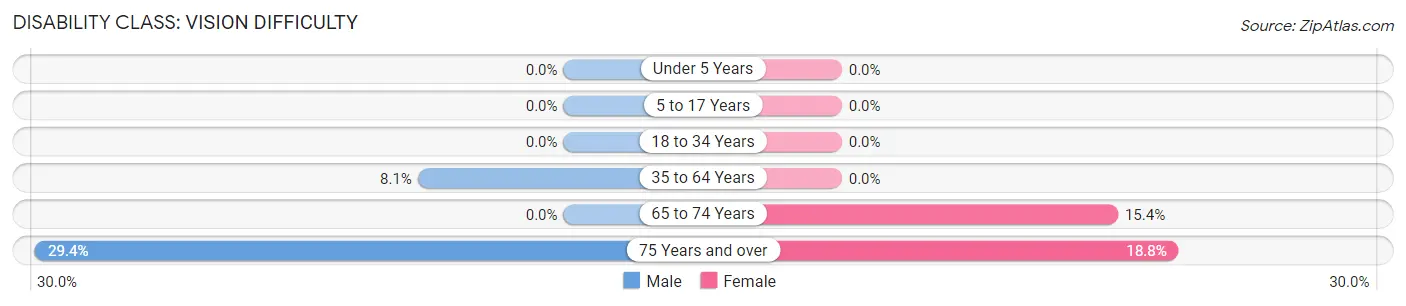
| Age Bracket | Male | Female |
| Under 5 Years | 0 (0.0%) | 0 (0.0%) |
| 5 to 17 Years | 0 (0.0%) | 0 (0.0%) |
| 18 to 34 Years | 0 (0.0%) | 0 (0.0%) |
| 35 to 64 Years | 3 (8.1%) | 0 (0.0%) |
| 65 to 74 Years | 0 (0.0%) | 4 (15.4%) |
| 75 Years and over | 5 (29.4%) | 3 (18.8%) |
Disability Class: Cognitive Difficulty
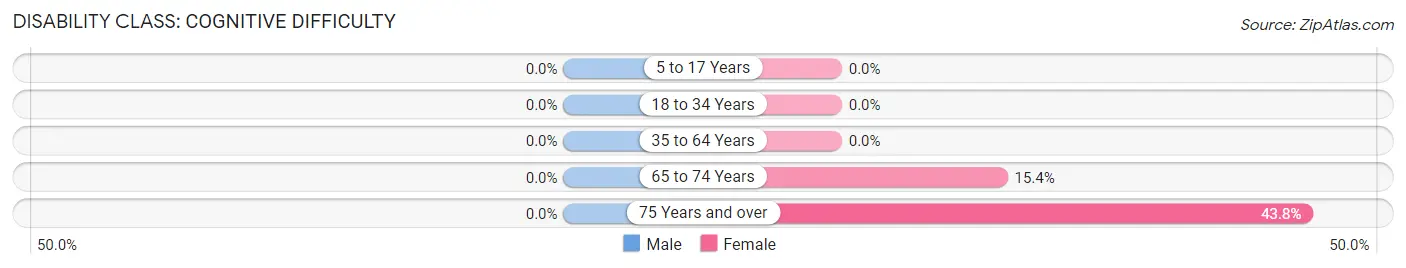
| Age Bracket | Male | Female |
| 5 to 17 Years | 0 (0.0%) | 0 (0.0%) |
| 18 to 34 Years | 0 (0.0%) | 0 (0.0%) |
| 35 to 64 Years | 0 (0.0%) | 0 (0.0%) |
| 65 to 74 Years | 0 (0.0%) | 4 (15.4%) |
| 75 Years and over | 0 (0.0%) | 7 (43.8%) |
Disability Class: Ambulatory Difficulty
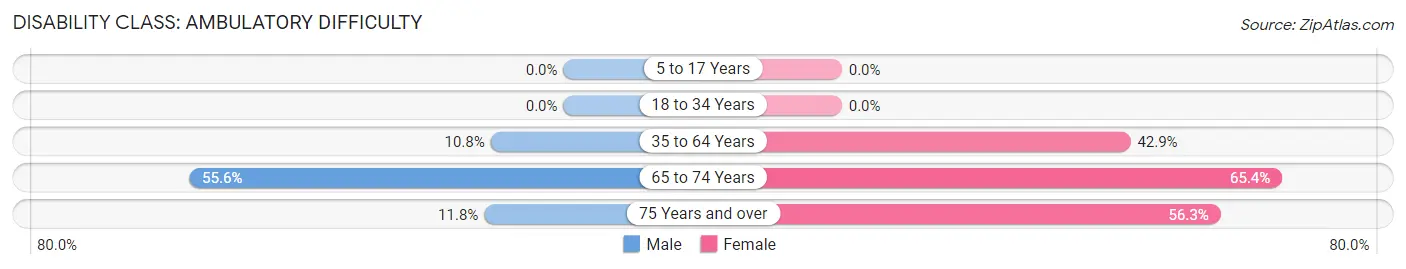
| Age Bracket | Male | Female |
| 5 to 17 Years | 0 (0.0%) | 0 (0.0%) |
| 18 to 34 Years | 0 (0.0%) | 0 (0.0%) |
| 35 to 64 Years | 4 (10.8%) | 12 (42.9%) |
| 65 to 74 Years | 5 (55.6%) | 17 (65.4%) |
| 75 Years and over | 2 (11.8%) | 9 (56.2%) |
Disability Class: Self-Care Difficulty
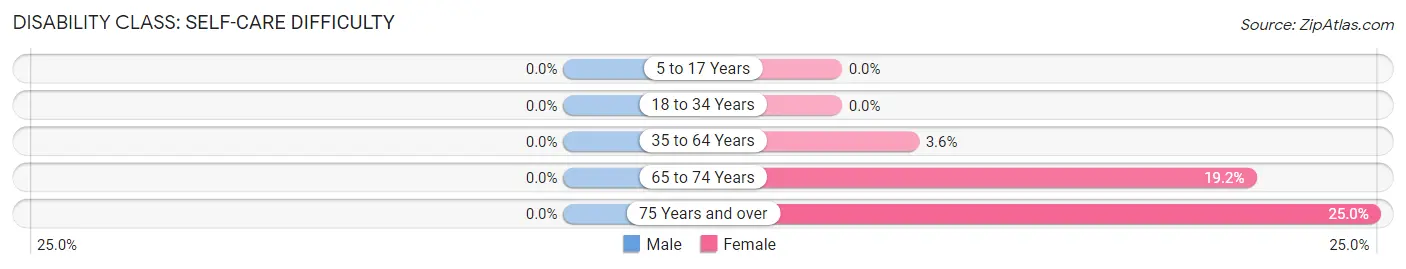
| Age Bracket | Male | Female |
| 5 to 17 Years | 0 (0.0%) | 0 (0.0%) |
| 18 to 34 Years | 0 (0.0%) | 0 (0.0%) |
| 35 to 64 Years | 0 (0.0%) | 1 (3.6%) |
| 65 to 74 Years | 0 (0.0%) | 5 (19.2%) |
| 75 Years and over | 0 (0.0%) | 4 (25.0%) |
Technology Access in Cave In Rock
Computing Device Access in Cave In Rock
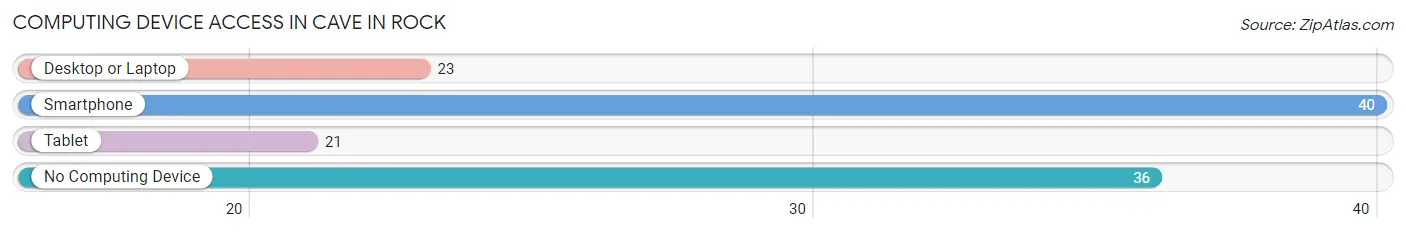
| Device Type | # Households | % Households |
| Desktop or Laptop | 23 | 23.7% |
| Smartphone | 40 | 41.2% |
| Tablet | 21 | 21.6% |
| No Computing Device | 36 | 37.1% |
| Total | 97 | 100.0% |
Internet Access in Cave In Rock
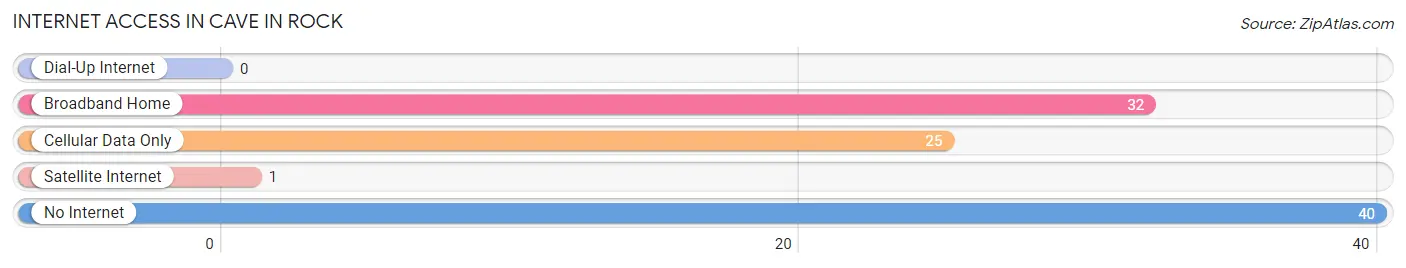
| Internet Type | # Households | % Households |
| Dial-Up Internet | 0 | 0.0% |
| Broadband Home | 32 | 33.0% |
| Cellular Data Only | 25 | 25.8% |
| Satellite Internet | 1 | 1.0% |
| No Internet | 40 | 41.2% |
| Total | 97 | 100.0% |
Cave In Rock Summary
Cave In Rock is a small unincorporated community located in Hardin County, Illinois. It is situated on the banks of the Ohio River, just south of the Illinois-Kentucky border. The town is named for a large cave located in the bluffs of the river, which was used by Native Americans and early settlers as a shelter.
History
The area around Cave In Rock has been inhabited for thousands of years. Native Americans used the cave as a shelter and a place to store food. The first European settlers arrived in the area in the late 1700s. They used the cave as a shelter from the elements and as a place to store goods.
In the early 1800s, the area around Cave In Rock became a popular spot for riverboat travelers. The cave provided a safe haven for travelers to rest and store their goods. It also became a popular spot for outlaws and criminals, who used the cave as a hideout.
In the late 1800s, the area around Cave In Rock became a popular tourist destination. The cave was a popular spot for sightseers, and the town became a popular spot for riverboat gambling.
Geography
Cave In Rock is located in Hardin County, Illinois, on the banks of the Ohio River. The town is situated on the Illinois-Kentucky border, just south of the town of Elizabethtown. The town is surrounded by rolling hills and bluffs, and the Ohio River provides a scenic backdrop.
The climate in Cave In Rock is humid continental, with hot summers and cold winters. The average annual temperature is around 55 degrees Fahrenheit, and the average annual precipitation is around 40 inches.
Economy
The economy of Cave In Rock is largely based on tourism. The town is a popular destination for sightseers, and the cave is a popular spot for visitors. The town also has a few small businesses, including a general store, a gas station, and a few restaurants.
Demographics
As of the 2010 census, the population of Cave In Rock was 545. The racial makeup of the town was 97.3% White, 0.2% African American, 0.2% Native American, 0.2% Asian, 0.2% from other races, and 1.9% from two or more races. Hispanic or Latino of any race were 0.7% of the population.
The median household income in Cave In Rock was $30,000, and the median family income was $35,000. The per capita income was $14,000. About 17.5% of the population was below the poverty line.
Conclusion
Cave In Rock is a small unincorporated community located in Hardin County, Illinois. It is situated on the banks of the Ohio River, just south of the Illinois-Kentucky border. The town is named for a large cave located in the bluffs of the river, which was used by Native Americans and early settlers as a shelter. The economy of Cave In Rock is largely based on tourism, and the town is a popular destination for sightseers. As of the 2010 census, the population of Cave In Rock was 545. The racial makeup of the town was 97.3% White, 0.2% African American, 0.2% Native American, 0.2% Asian, 0.2% from other races, and 1.9% from two or more races. The median household income in Cave In Rock was $30,000, and the median family income was $35,000.
Common Questions
What is Per Capita Income in Cave In Rock?
Per Capita income in Cave In Rock is $27,841.
What is the Median Family Income in Cave In Rock?
Median Family Income in Cave In Rock is $29,250.
What is the Median Household income in Cave In Rock?
Median Household Income in Cave In Rock is $27,625.
What is Income or Wage Gap in Cave In Rock?
Income or Wage Gap in Cave In Rock is 0.3%.
Women in Cave In Rock earn 99.7 cents for every dollar earned by a man.
What is Inequality or Gini Index in Cave In Rock?
Inequality or Gini Index in Cave In Rock is 0.63.
What is the Total Population of Cave In Rock?
Total Population of Cave In Rock is 197.
What is the Total Male Population of Cave In Rock?
Total Male Population of Cave In Rock is 90.
What is the Total Female Population of Cave In Rock?
Total Female Population of Cave In Rock is 107.
What is the Ratio of Males per 100 Females in Cave In Rock?
There are 84.11 Males per 100 Females in Cave In Rock.
What is the Ratio of Females per 100 Males in Cave In Rock?
There are 118.89 Females per 100 Males in Cave In Rock.
What is the Median Population Age in Cave In Rock?
Median Population Age in Cave In Rock is 50.6 Years.
What is the Average Family Size in Cave In Rock
Average Family Size in Cave In Rock is 2.7 People.
What is the Average Household Size in Cave In Rock
Average Household Size in Cave In Rock is 2.0 People.
How Large is the Labor Force in Cave In Rock?
There are 76 People in the Labor Forcein in Cave In Rock.
What is the Percentage of People in the Labor Force in Cave In Rock?
42.9% of People are in the Labor Force in Cave In Rock.