Park Forest, IL Map & Demographics
Park Forest Map
Park Forest Overview
$26,590
PER CAPITA INCOME
$67,816
AVG FAMILY INCOME
$58,907
AVG HOUSEHOLD INCOME
8.5%
WAGE / INCOME GAP [ % ]
91.5¢/ $1
WAGE / INCOME GAP [ $ ]
$10,970
FAMILY INCOME DEFICIT
0.40
INEQUALITY / GINI INDEX
21,042
TOTAL POPULATION
9,582
MALE POPULATION
11,460
FEMALE POPULATION
83.61
MALES / 100 FEMALES
119.60
FEMALES / 100 MALES
37.4
MEDIAN AGE
3.5
AVG FAMILY SIZE
2.6
AVG HOUSEHOLD SIZE
10,372
LABOR FORCE [ PEOPLE ]
62.9%
PERCENT IN LABOR FORCE
8.4%
UNEMPLOYMENT RATE
Park Forest Zip Codes
Park Forest Area Codes
Income in Park Forest
Income Overview in Park Forest
Per Capita Income in Park Forest is $26,590, while median incomes of families and households are $67,816 and $58,907 respectively.
| Characteristic | Number | Measure |
| Per Capita Income | 21,042 | $26,590 |
| Median Family Income | 4,787 | $67,816 |
| Mean Family Income | 4,787 | $80,223 |
| Median Household Income | 7,976 | $58,907 |
| Mean Household Income | 7,976 | $66,788 |
| Income Deficit | 4,787 | $10,970 |
| Wage / Income Gap (%) | 21,042 | 8.51% |
| Wage / Income Gap ($) | 21,042 | 91.49¢ per $1 |
| Gini / Inequality Index | 21,042 | 0.40 |
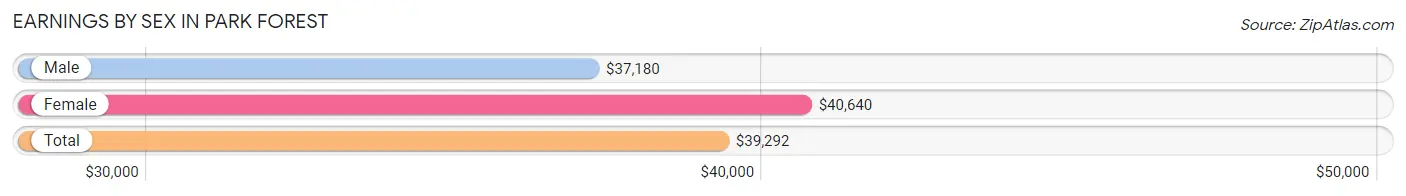
Earnings by Sex in Park Forest
Average Earnings in Park Forest are $39,292, $37,180 for men and $40,640 for women, a difference of 8.5%.
| Sex | Number | Average Earnings |
| Male | 4,847 (47.0%) | $37,180 |
| Female | 5,462 (53.0%) | $40,640 |
| Total | 10,309 (100.0%) | $39,292 |
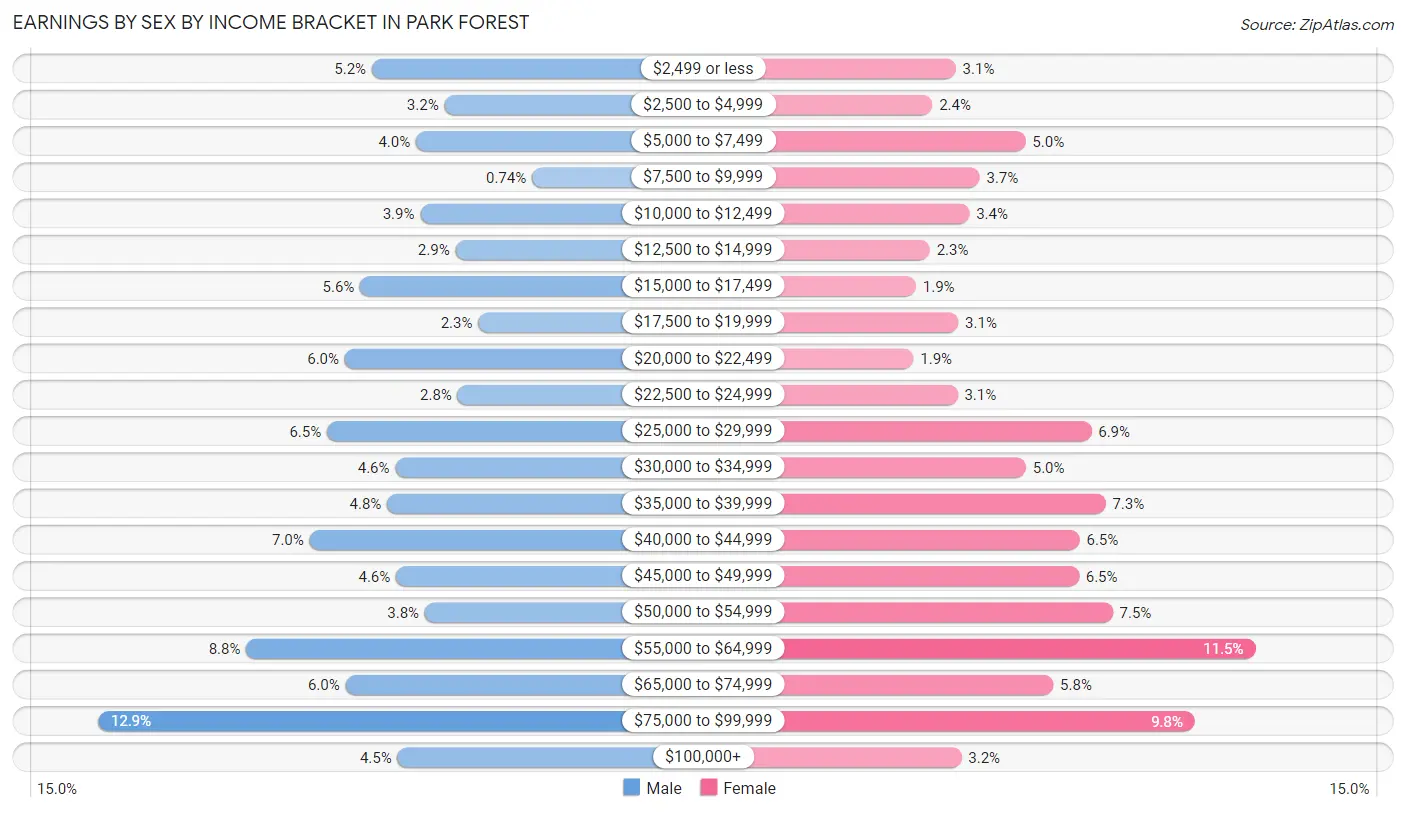
Earnings by Sex by Income Bracket in Park Forest
The most common earnings brackets in Park Forest are $75,000 to $99,999 for men (627 | 12.9%) and $55,000 to $64,999 for women (627 | 11.5%).
| Income | Male | Female |
| $2,499 or less | 254 (5.2%) | 167 (3.1%) |
| $2,500 to $4,999 | 155 (3.2%) | 131 (2.4%) |
| $5,000 to $7,499 | 194 (4.0%) | 274 (5.0%) |
| $7,500 to $9,999 | 36 (0.7%) | 204 (3.7%) |
| $10,000 to $12,499 | 188 (3.9%) | 188 (3.4%) |
| $12,500 to $14,999 | 140 (2.9%) | 127 (2.3%) |
| $15,000 to $17,499 | 270 (5.6%) | 106 (1.9%) |
| $17,500 to $19,999 | 109 (2.2%) | 171 (3.1%) |
| $20,000 to $22,499 | 291 (6.0%) | 102 (1.9%) |
| $22,500 to $24,999 | 137 (2.8%) | 170 (3.1%) |
| $25,000 to $29,999 | 315 (6.5%) | 375 (6.9%) |
| $30,000 to $34,999 | 222 (4.6%) | 275 (5.0%) |
| $35,000 to $39,999 | 233 (4.8%) | 397 (7.3%) |
| $40,000 to $44,999 | 339 (7.0%) | 357 (6.5%) |
| $45,000 to $49,999 | 221 (4.6%) | 356 (6.5%) |
| $50,000 to $54,999 | 182 (3.7%) | 408 (7.5%) |
| $55,000 to $64,999 | 425 (8.8%) | 627 (11.5%) |
| $65,000 to $74,999 | 290 (6.0%) | 317 (5.8%) |
| $75,000 to $99,999 | 627 (12.9%) | 534 (9.8%) |
| $100,000+ | 219 (4.5%) | 176 (3.2%) |
| Total | 4,847 (100.0%) | 5,462 (100.0%) |
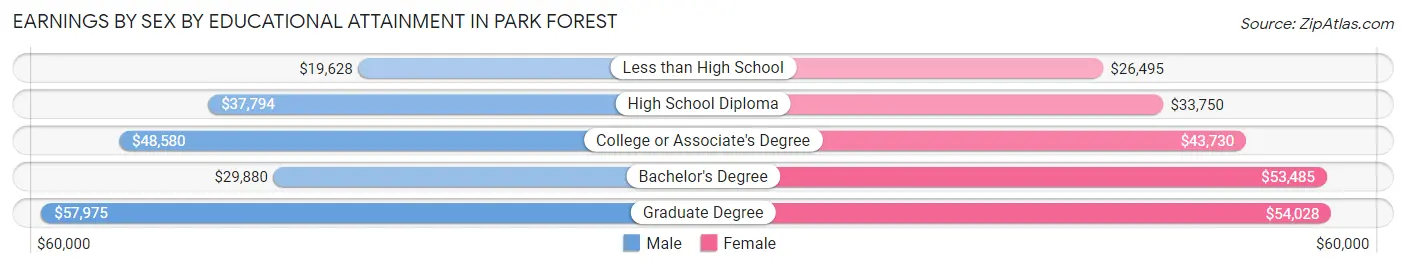
Earnings by Sex by Educational Attainment in Park Forest
Average earnings in Park Forest are $42,022 for men and $44,439 for women, a difference of 5.4%. Men with an educational attainment of graduate degree enjoy the highest average annual earnings of $57,975, while those with less than high school education earn the least with $19,628. Women with an educational attainment of graduate degree earn the most with the average annual earnings of $54,028, while those with less than high school education have the smallest earnings of $26,495.
| Educational Attainment | Male Income | Female Income |
| Less than High School | $19,628 | $26,495 |
| High School Diploma | $37,794 | $33,750 |
| College or Associate's Degree | $48,580 | $43,730 |
| Bachelor's Degree | $29,880 | $53,485 |
| Graduate Degree | $57,975 | $54,028 |
| Total | $42,022 | $44,439 |
Family Income in Park Forest
Family Income Brackets in Park Forest
According to the Park Forest family income data, there are 1,063 families falling into the $50,000 to $74,999 income range, which is the most common income bracket and makes up 22.2% of all families. Conversely, the $10,000 to $14,999 income bracket is the least frequent group with only 38 families (0.8%) belonging to this category.
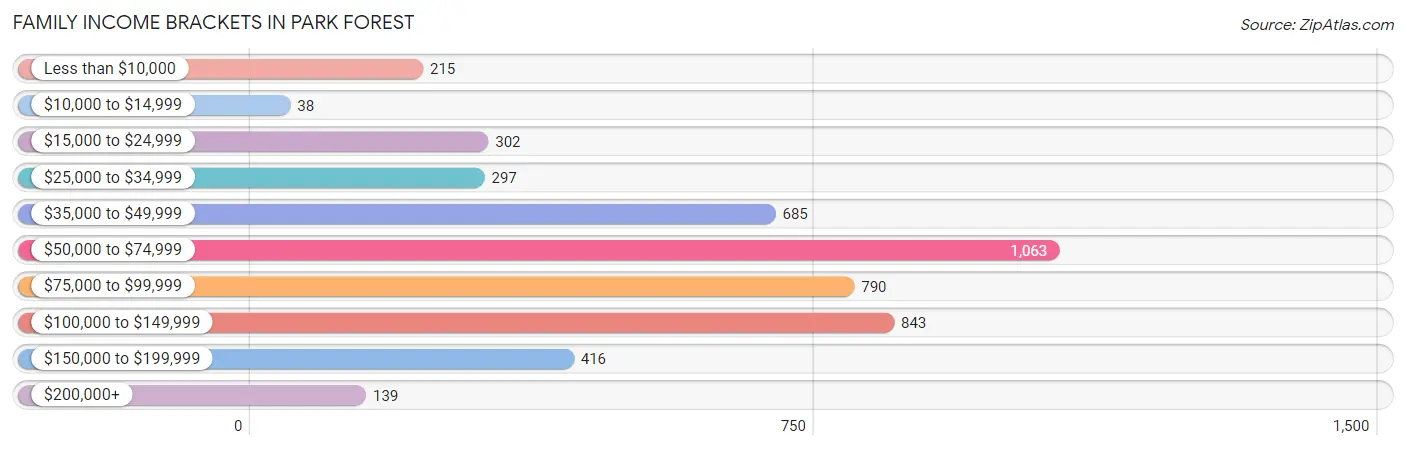
| Income Bracket | # Families | % Families |
| Less than $10,000 | 215 | 4.5% |
| $10,000 to $14,999 | 38 | 0.8% |
| $15,000 to $24,999 | 302 | 6.3% |
| $25,000 to $34,999 | 297 | 6.2% |
| $35,000 to $49,999 | 685 | 14.3% |
| $50,000 to $74,999 | 1,063 | 22.2% |
| $75,000 to $99,999 | 790 | 16.5% |
| $100,000 to $149,999 | 843 | 17.6% |
| $150,000 to $199,999 | 416 | 8.7% |
| $200,000+ | 139 | 2.9% |
Family Income by Famaliy Size in Park Forest
6-person families (150 | 3.1%) account for the highest median family income in Park Forest with $110,887 per family, while 2-person families (1,925 | 40.2%) have the highest median income of $31,998 per family member.
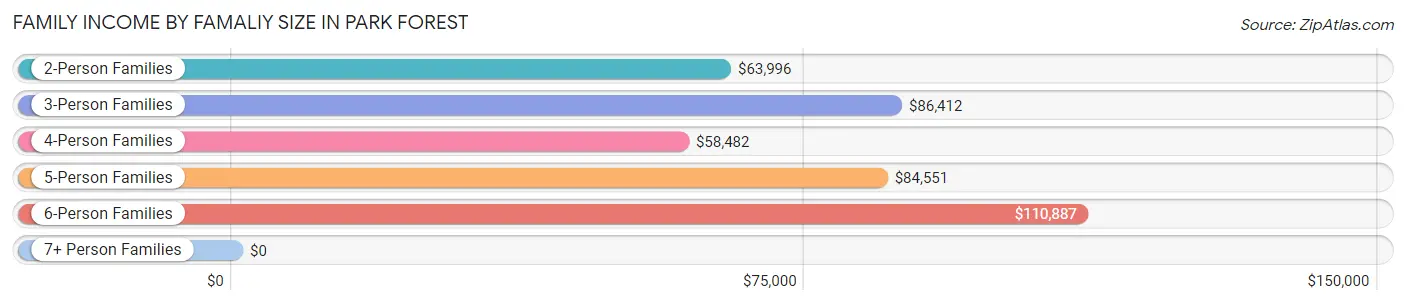
| Income Bracket | # Families | Median Income |
| 2-Person Families | 1,925 (40.2%) | $63,996 |
| 3-Person Families | 1,201 (25.1%) | $86,412 |
| 4-Person Families | 895 (18.7%) | $58,482 |
| 5-Person Families | 498 (10.4%) | $84,551 |
| 6-Person Families | 150 (3.1%) | $110,887 |
| 7+ Person Families | 118 (2.5%) | $0 |
| Total | 4,787 (100.0%) | $67,816 |
Family Income by Number of Earners in Park Forest
The median family income in Park Forest is $67,816, with families comprising 3+ earners (566) having the highest median family income of $135,600, while families with no earners (385) have the lowest median family income of $33,813, accounting for 11.8% and 8.0% of families, respectively.
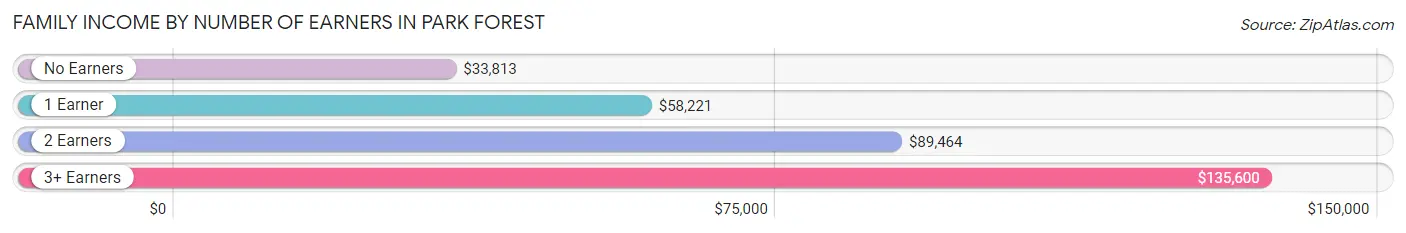
| Number of Earners | # Families | Median Income |
| No Earners | 385 (8.0%) | $33,813 |
| 1 Earner | 1,882 (39.3%) | $58,221 |
| 2 Earners | 1,954 (40.8%) | $89,464 |
| 3+ Earners | 566 (11.8%) | $135,600 |
| Total | 4,787 (100.0%) | $67,816 |
Household Income in Park Forest
Household Income Brackets in Park Forest
With 1,715 households falling in the category, the $50,000 to $74,999 income range is the most frequent in Park Forest, accounting for 21.5% of all households. In contrast, only 152 households (1.9%) fall into the $200,000+ income bracket, making it the least populous group.
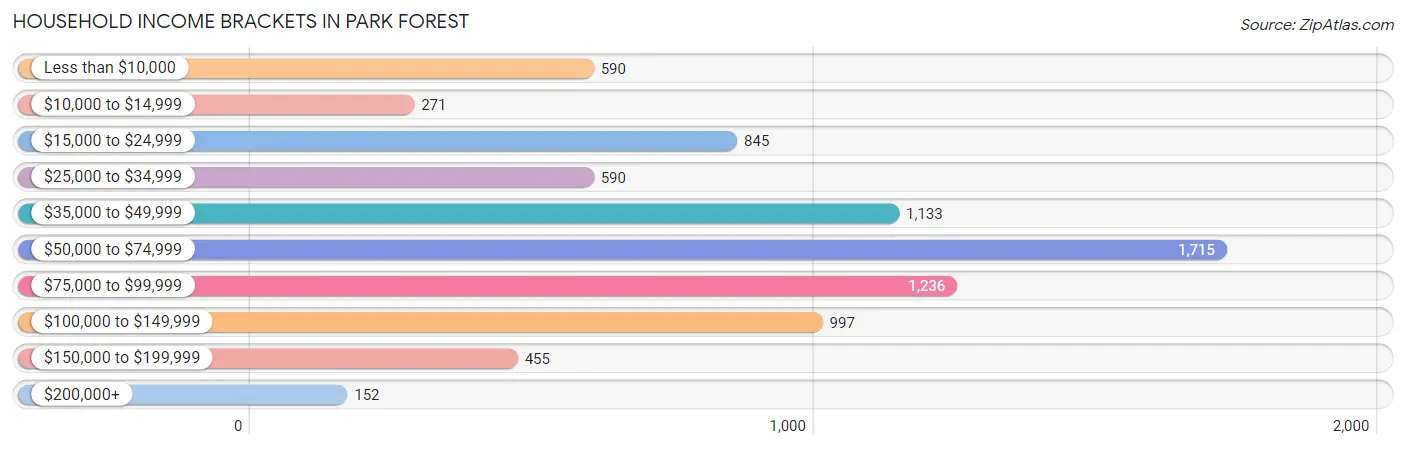
| Income Bracket | # Households | % Households |
| Less than $10,000 | 590 | 7.4% |
| $10,000 to $14,999 | 271 | 3.4% |
| $15,000 to $24,999 | 845 | 10.6% |
| $25,000 to $34,999 | 590 | 7.4% |
| $35,000 to $49,999 | 1,133 | 14.2% |
| $50,000 to $74,999 | 1,715 | 21.5% |
| $75,000 to $99,999 | 1,236 | 15.5% |
| $100,000 to $149,999 | 997 | 12.5% |
| $150,000 to $199,999 | 455 | 5.7% |
| $200,000+ | 152 | 1.9% |
Household Income by Householder Age in Park Forest
The median household income in Park Forest is $58,907, with the highest median household income of $63,447 found in the 25 to 44 years age bracket for the primary householder. A total of 2,499 households (31.3%) fall into this category. Meanwhile, the 15 to 24 years age bracket for the primary householder has the lowest median household income of $0, with 128 households (1.6%) in this group.
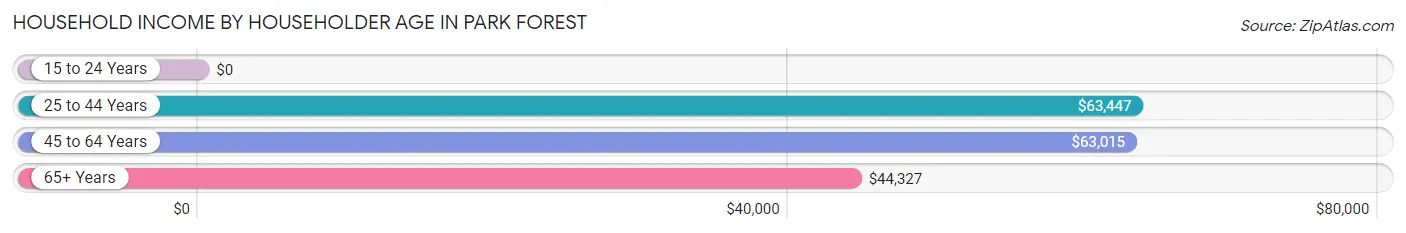
| Income Bracket | # Households | Median Income |
| 15 to 24 Years | 128 (1.6%) | $0 |
| 25 to 44 Years | 2,499 (31.3%) | $63,447 |
| 45 to 64 Years | 2,943 (36.9%) | $63,015 |
| 65+ Years | 2,406 (30.2%) | $44,327 |
| Total | 7,976 (100.0%) | $58,907 |
Poverty in Park Forest
Income Below Poverty by Sex and Age in Park Forest
With 15.6% poverty level for males and 18.8% for females among the residents of Park Forest, 5 year old males and 5 year old females are the most vulnerable to poverty, with 33 males (71.7%) and 39 females (55.7%) in their respective age groups living below the poverty level.
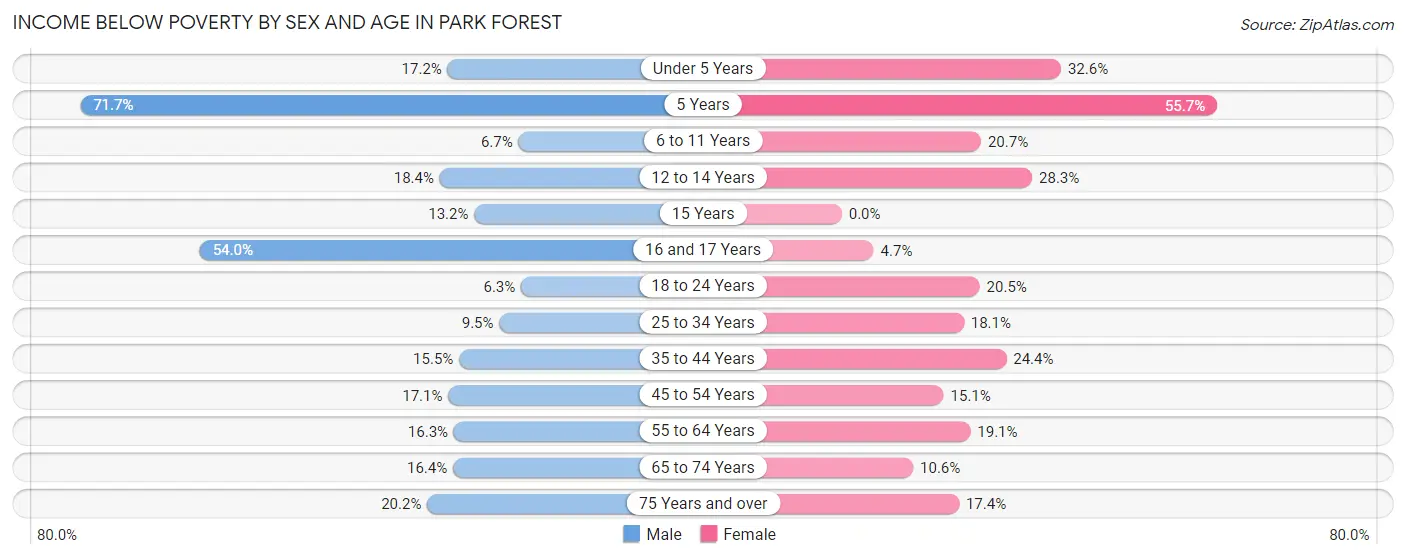
| Age Bracket | Male | Female |
| Under 5 Years | 73 (17.2%) | 166 (32.6%) |
| 5 Years | 33 (71.7%) | 39 (55.7%) |
| 6 to 11 Years | 75 (6.7%) | 205 (20.7%) |
| 12 to 14 Years | 69 (18.3%) | 128 (28.3%) |
| 15 Years | 46 (13.2%) | 0 (0.0%) |
| 16 and 17 Years | 257 (54.0%) | 14 (4.7%) |
| 18 to 24 Years | 58 (6.3%) | 158 (20.5%) |
| 25 to 34 Years | 113 (9.5%) | 299 (18.1%) |
| 35 to 44 Years | 240 (15.5%) | 373 (24.4%) |
| 45 to 54 Years | 173 (17.1%) | 219 (15.1%) |
| 55 to 64 Years | 151 (16.3%) | 267 (19.1%) |
| 65 to 74 Years | 103 (16.4%) | 163 (10.6%) |
| 75 Years and over | 77 (20.2%) | 118 (17.4%) |
| Total | 1,468 (15.6%) | 2,149 (18.8%) |
Income Above Poverty by Sex and Age in Park Forest
According to the poverty statistics in Park Forest, males aged 18 to 24 years and females aged 15 years are the age groups that are most secure financially, with 93.7% of males and 100.0% of females in these age groups living above the poverty line.
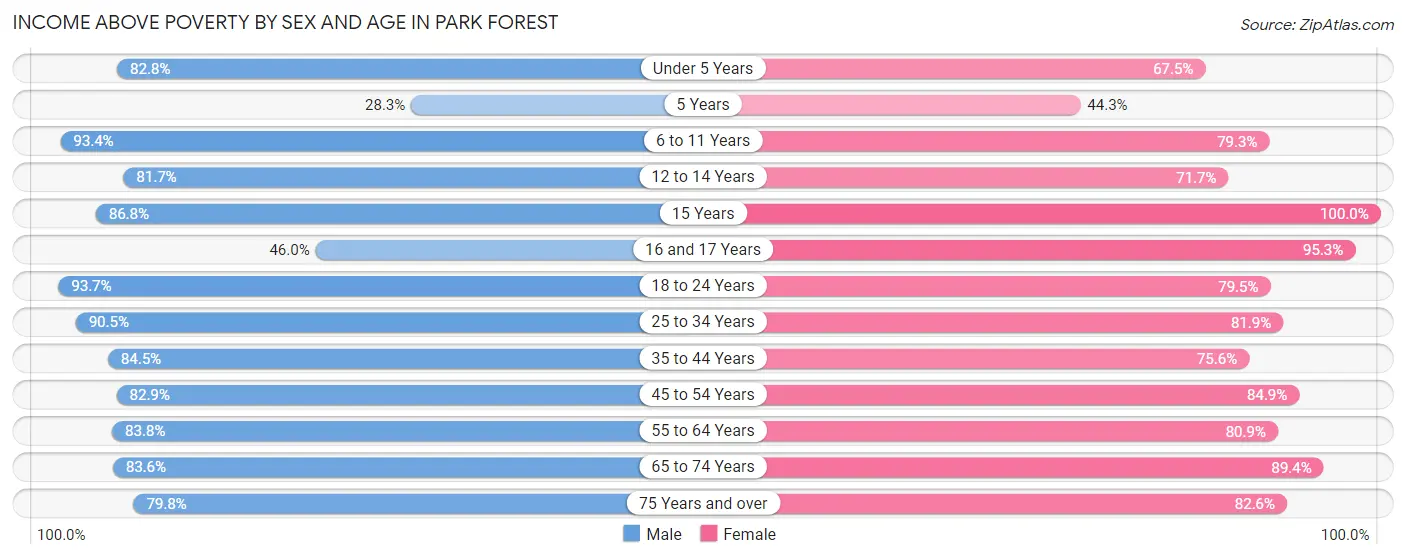
| Age Bracket | Male | Female |
| Under 5 Years | 352 (82.8%) | 344 (67.4%) |
| 5 Years | 13 (28.3%) | 31 (44.3%) |
| 6 to 11 Years | 1,052 (93.3%) | 787 (79.3%) |
| 12 to 14 Years | 307 (81.7%) | 325 (71.7%) |
| 15 Years | 302 (86.8%) | 117 (100.0%) |
| 16 and 17 Years | 219 (46.0%) | 282 (95.3%) |
| 18 to 24 Years | 867 (93.7%) | 614 (79.5%) |
| 25 to 34 Years | 1,077 (90.5%) | 1,352 (81.9%) |
| 35 to 44 Years | 1,311 (84.5%) | 1,154 (75.6%) |
| 45 to 54 Years | 840 (82.9%) | 1,229 (84.9%) |
| 55 to 64 Years | 778 (83.8%) | 1,132 (80.9%) |
| 65 to 74 Years | 526 (83.6%) | 1,376 (89.4%) |
| 75 Years and over | 304 (79.8%) | 560 (82.6%) |
| Total | 7,948 (84.4%) | 9,303 (81.2%) |
Income Below Poverty Among Married-Couple Families in Park Forest
The poverty statistics for married-couple families in Park Forest show that 4.0% or 101 of the total 2,528 families live below the poverty line. Families with 3 or 4 children have the highest poverty rate of 24.6%, comprising of 89 families. On the other hand, families with 1 or 2 children have the lowest poverty rate of 0.0%, which includes 0 families.
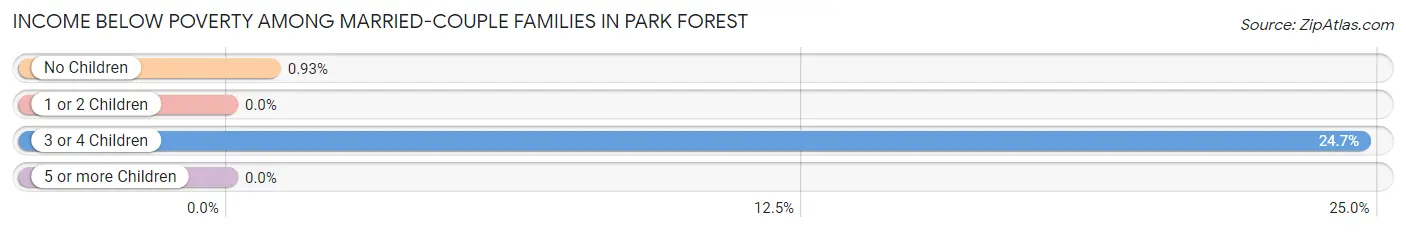
| Children | Above Poverty | Below Poverty |
| No Children | 1,283 (99.1%) | 12 (0.9%) |
| 1 or 2 Children | 858 (100.0%) | 0 (0.0%) |
| 3 or 4 Children | 272 (75.3%) | 89 (24.6%) |
| 5 or more Children | 14 (100.0%) | 0 (0.0%) |
| Total | 2,427 (96.0%) | 101 (4.0%) |
Income Below Poverty Among Single-Parent Households in Park Forest
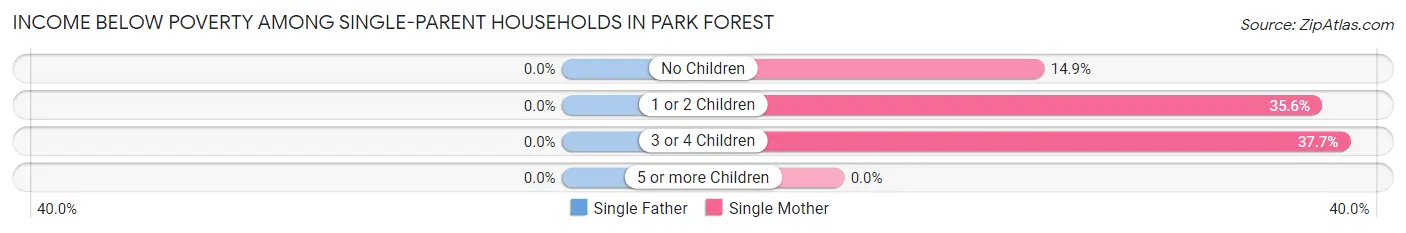
| Children | Single Father | Single Mother |
| No Children | 0 (0.0%) | 123 (14.9%) |
| 1 or 2 Children | 0 (0.0%) | 296 (35.6%) |
| 3 or 4 Children | 0 (0.0%) | 63 (37.7%) |
| 5 or more Children | 0 (0.0%) | 0 (0.0%) |
| Total | 0 (0.0%) | 482 (26.4%) |
Income Below Poverty Among Married-Couple vs Single-Parent Households in Park Forest
The poverty data for Park Forest shows that 101 of the married-couple family households (4.0%) and 482 of the single-parent households (21.3%) are living below the poverty level. Within the married-couple family households, those with 3 or 4 children have the highest poverty rate, with 89 households (24.6%) falling below the poverty line. Among the single-parent households, those with 1 or 2 children have the highest poverty rate, with 296 household (28.5%) living below poverty.
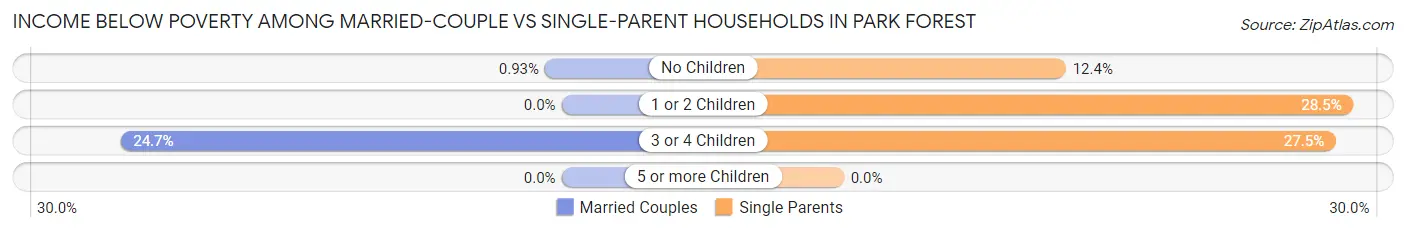
| Children | Married-Couple Families | Single-Parent Households |
| No Children | 12 (0.9%) | 123 (12.4%) |
| 1 or 2 Children | 0 (0.0%) | 296 (28.5%) |
| 3 or 4 Children | 89 (24.6%) | 63 (27.5%) |
| 5 or more Children | 0 (0.0%) | 0 (0.0%) |
| Total | 101 (4.0%) | 482 (21.3%) |
Race in Park Forest
The most populous races in Park Forest are Black / African American (15,007 | 71.3%), White / Caucasian (4,073 | 19.4%), and Hispanic or Latino (1,529 | 7.3%).
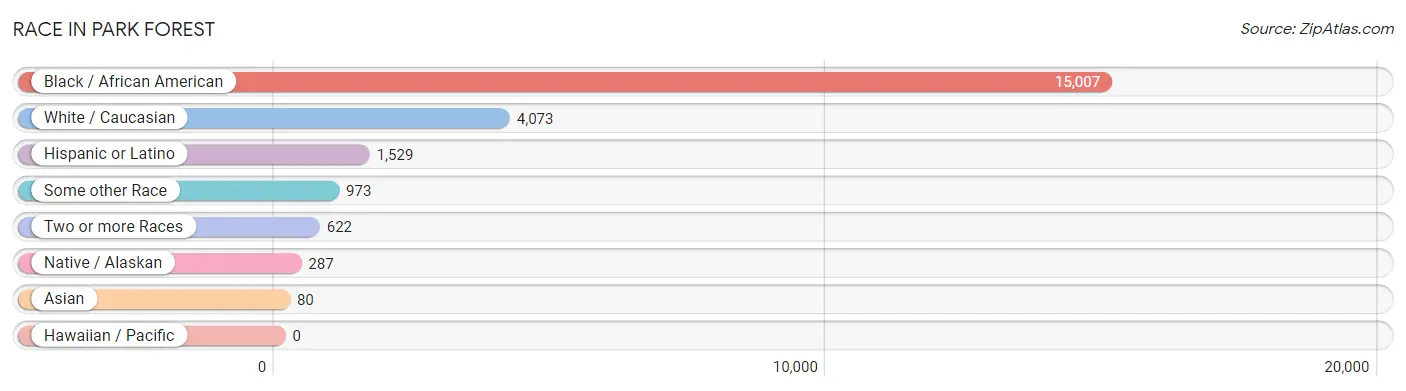
| Race | # Population | % Population |
| Asian | 80 | 0.4% |
| Black / African American | 15,007 | 71.3% |
| Hawaiian / Pacific | 0 | 0.0% |
| Hispanic or Latino | 1,529 | 7.3% |
| Native / Alaskan | 287 | 1.4% |
| White / Caucasian | 4,073 | 19.4% |
| Two or more Races | 622 | 3.0% |
| Some other Race | 973 | 4.6% |
| Total | 21,042 | 100.0% |
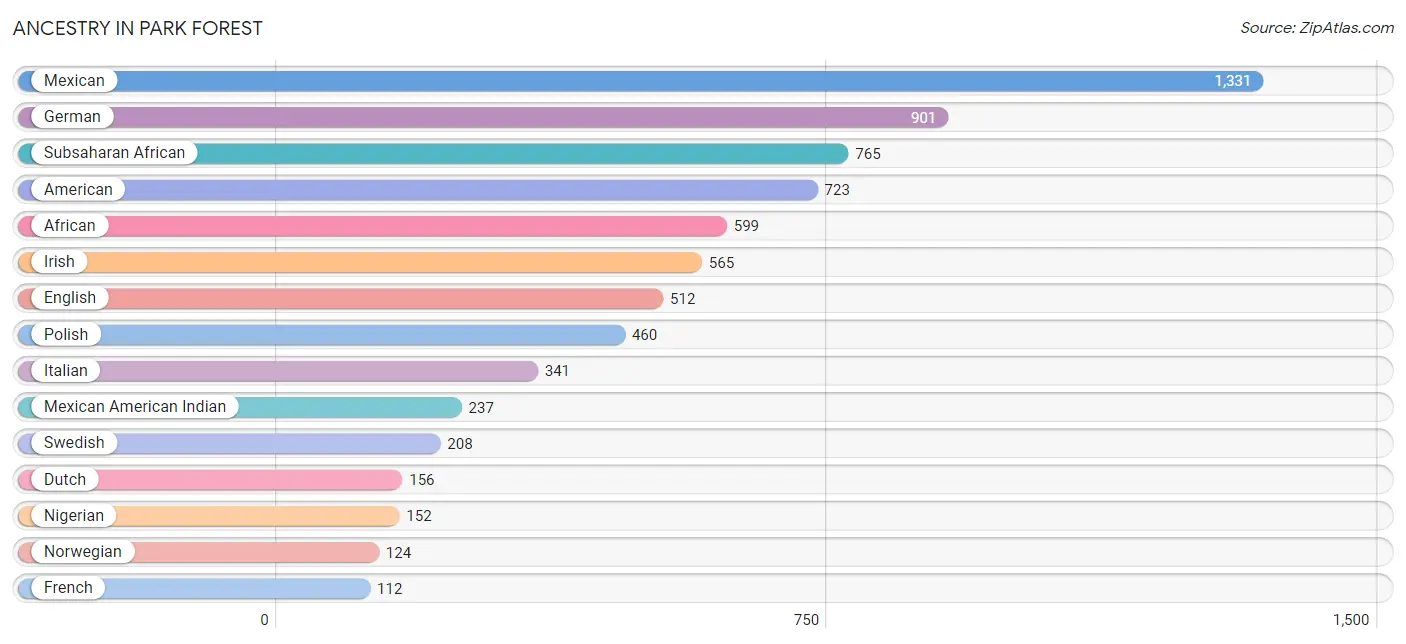
Ancestry in Park Forest
The most populous ancestries reported in Park Forest are Mexican (1,331 | 6.3%), German (901 | 4.3%), Subsaharan African (765 | 3.6%), American (723 | 3.4%), and African (599 | 2.9%), together accounting for 20.5% of all Park Forest residents.
| Ancestry | # Population | % Population |
| African | 599 | 2.9% |
| American | 723 | 3.4% |
| Assyrian / Chaldean / Syriac | 11 | 0.1% |
| Austrian | 19 | 0.1% |
| British | 58 | 0.3% |
| Bulgarian | 10 | 0.1% |
| Burmese | 11 | 0.1% |
| Central American | 64 | 0.3% |
| Central American Indian | 19 | 0.1% |
| Cherokee | 28 | 0.1% |
| Costa Rican | 17 | 0.1% |
| Cuban | 14 | 0.1% |
| Czech | 49 | 0.2% |
| Danish | 24 | 0.1% |
| Dutch | 156 | 0.7% |
| Eastern European | 10 | 0.1% |
| English | 512 | 2.4% |
| European | 40 | 0.2% |
| French | 112 | 0.5% |
| French Canadian | 24 | 0.1% |
| German | 901 | 4.3% |
| Ghanaian | 14 | 0.1% |
| Greek | 22 | 0.1% |
| Haitian | 6 | 0.0% |
| Hungarian | 57 | 0.3% |
| Indian (Asian) | 41 | 0.2% |
| Iranian | 39 | 0.2% |
| Irish | 565 | 2.7% |
| Italian | 341 | 1.6% |
| Jamaican | 30 | 0.1% |
| Lithuanian | 101 | 0.5% |
| Luxembourger | 11 | 0.1% |
| Mexican | 1,331 | 6.3% |
| Mexican American Indian | 237 | 1.1% |
| Nigerian | 152 | 0.7% |
| Norwegian | 124 | 0.6% |
| Pakistani | 11 | 0.1% |
| Panamanian | 27 | 0.1% |
| Pennsylvania German | 11 | 0.1% |
| Polish | 460 | 2.2% |
| Puerto Rican | 74 | 0.4% |
| Russian | 88 | 0.4% |
| Salvadoran | 20 | 0.1% |
| Samoan | 10 | 0.1% |
| Scandinavian | 38 | 0.2% |
| Scotch-Irish | 104 | 0.5% |
| Scottish | 50 | 0.2% |
| Slovak | 30 | 0.1% |
| Spaniard | 12 | 0.1% |
| Subsaharan African | 765 | 3.6% |
| Swedish | 208 | 1.0% |
| Swiss | 28 | 0.1% |
| Thai | 39 | 0.2% |
| Ukrainian | 5 | 0.0% |
| Welsh | 29 | 0.1% |
| Yugoslavian | 82 | 0.4% | View All 56 Rows |
Immigrants in Park Forest
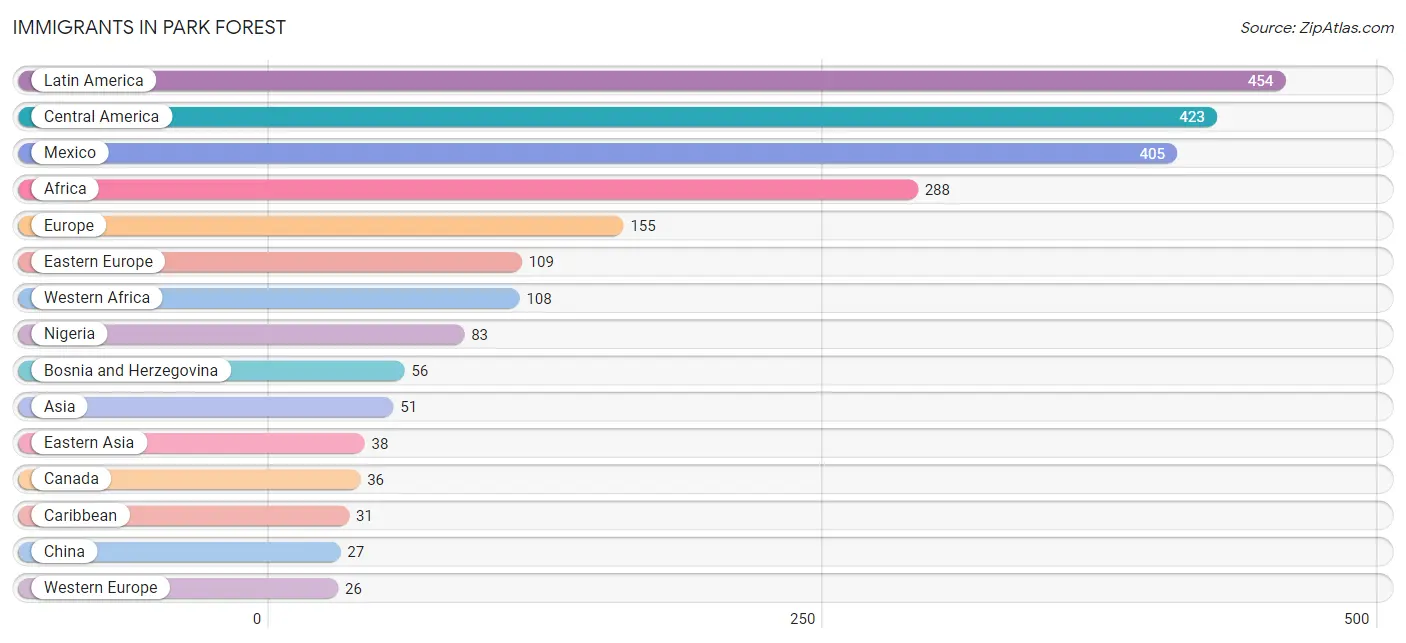
The most numerous immigrant groups reported in Park Forest came from Latin America (454 | 2.2%), Central America (423 | 2.0%), Mexico (405 | 1.9%), Africa (288 | 1.4%), and Europe (155 | 0.7%), together accounting for 8.2% of all Park Forest residents.
| Immigration Origin | # Population | % Population |
| Africa | 288 | 1.4% |
| Asia | 51 | 0.2% |
| Bosnia and Herzegovina | 56 | 0.3% |
| Bulgaria | 10 | 0.1% |
| Canada | 36 | 0.2% |
| Caribbean | 31 | 0.2% |
| Central America | 423 | 2.0% |
| China | 27 | 0.1% |
| Costa Rica | 17 | 0.1% |
| Cuba | 14 | 0.1% |
| Eastern Asia | 38 | 0.2% |
| Eastern Europe | 109 | 0.5% |
| El Salvador | 1 | 0.0% |
| England | 5 | 0.0% |
| Europe | 155 | 0.7% |
| Germany | 5 | 0.0% |
| Ghana | 25 | 0.1% |
| Hong Kong | 6 | 0.0% |
| India | 8 | 0.0% |
| Italy | 10 | 0.1% |
| Jamaica | 17 | 0.1% |
| Korea | 11 | 0.1% |
| Latin America | 454 | 2.2% |
| Mexico | 405 | 1.9% |
| Nigeria | 83 | 0.4% |
| Northern Europe | 10 | 0.1% |
| Poland | 17 | 0.1% |
| Scotland | 5 | 0.0% |
| South Central Asia | 8 | 0.0% |
| South Eastern Asia | 5 | 0.0% |
| Southern Europe | 10 | 0.1% |
| Switzerland | 21 | 0.1% |
| Taiwan | 16 | 0.1% |
| Thailand | 5 | 0.0% |
| Western Africa | 108 | 0.5% |
| Western Europe | 26 | 0.1% | View All 36 Rows |
Sex and Age in Park Forest
Sex and Age in Park Forest
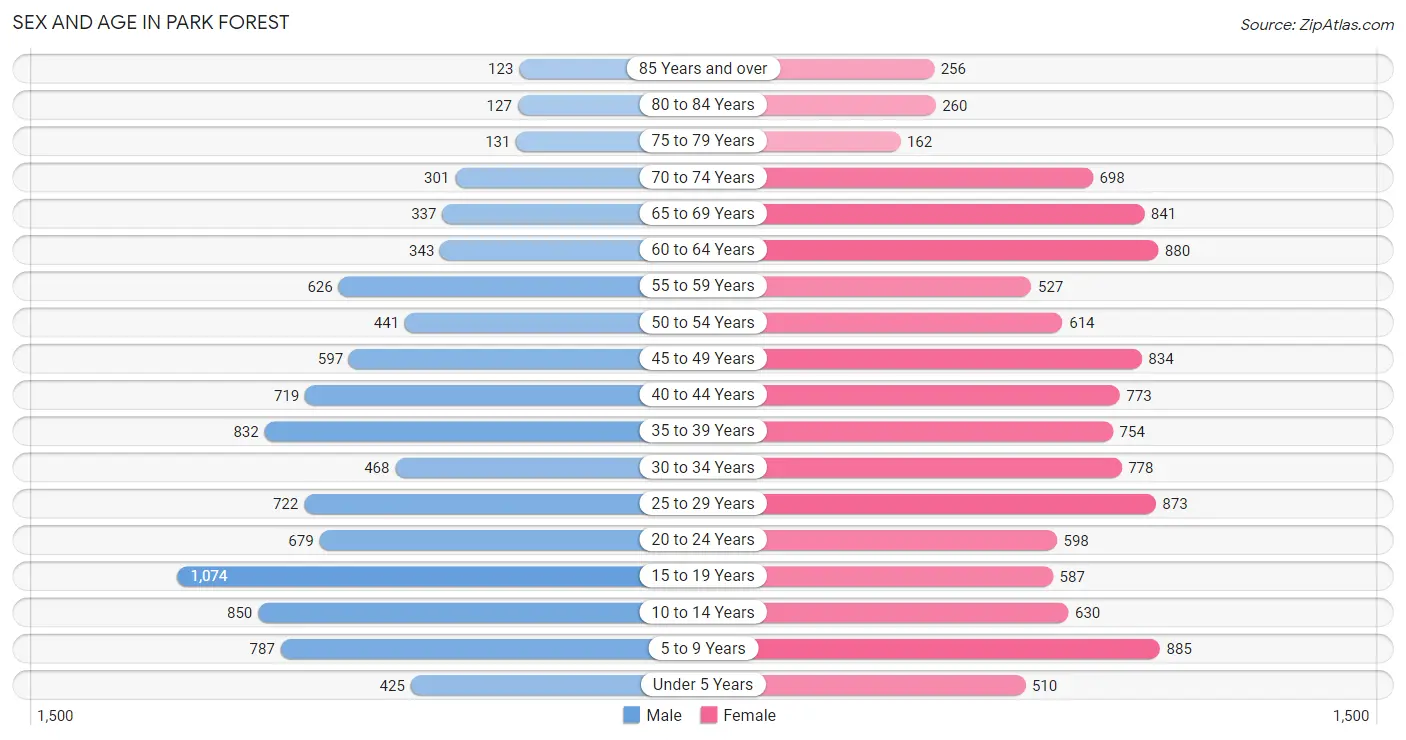
The most populous age groups in Park Forest are 15 to 19 Years (1,074 | 11.2%) for men and 5 to 9 Years (885 | 7.7%) for women.
| Age Bracket | Male | Female |
| Under 5 Years | 425 (4.4%) | 510 (4.4%) |
| 5 to 9 Years | 787 (8.2%) | 885 (7.7%) |
| 10 to 14 Years | 850 (8.9%) | 630 (5.5%) |
| 15 to 19 Years | 1,074 (11.2%) | 587 (5.1%) |
| 20 to 24 Years | 679 (7.1%) | 598 (5.2%) |
| 25 to 29 Years | 722 (7.5%) | 873 (7.6%) |
| 30 to 34 Years | 468 (4.9%) | 778 (6.8%) |
| 35 to 39 Years | 832 (8.7%) | 754 (6.6%) |
| 40 to 44 Years | 719 (7.5%) | 773 (6.8%) |
| 45 to 49 Years | 597 (6.2%) | 834 (7.3%) |
| 50 to 54 Years | 441 (4.6%) | 614 (5.4%) |
| 55 to 59 Years | 626 (6.5%) | 527 (4.6%) |
| 60 to 64 Years | 343 (3.6%) | 880 (7.7%) |
| 65 to 69 Years | 337 (3.5%) | 841 (7.3%) |
| 70 to 74 Years | 301 (3.1%) | 698 (6.1%) |
| 75 to 79 Years | 131 (1.4%) | 162 (1.4%) |
| 80 to 84 Years | 127 (1.3%) | 260 (2.3%) |
| 85 Years and over | 123 (1.3%) | 256 (2.2%) |
| Total | 9,582 (100.0%) | 11,460 (100.0%) |
Families and Households in Park Forest
Median Family Size in Park Forest
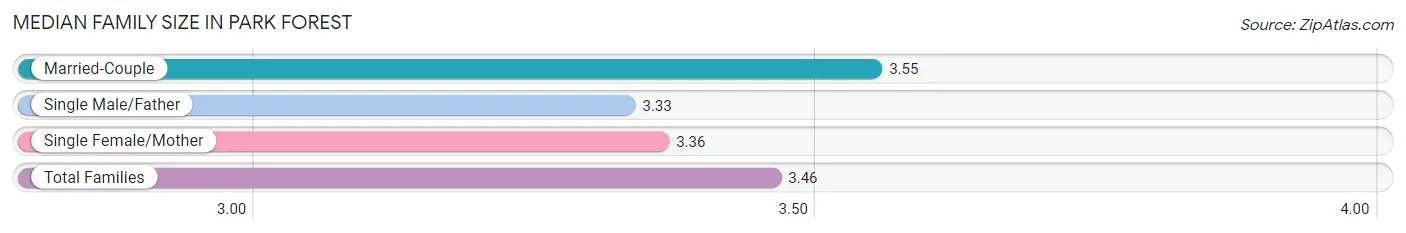
The median family size in Park Forest is 3.46 persons per family, with married-couple families (2,528 | 52.8%) accounting for the largest median family size of 3.55 persons per family. On the other hand, single male/father families (436 | 9.1%) represent the smallest median family size with 3.33 persons per family.
| Family Type | # Families | Family Size |
| Married-Couple | 2,528 (52.8%) | 3.55 |
| Single Male/Father | 436 (9.1%) | 3.33 |
| Single Female/Mother | 1,823 (38.1%) | 3.36 |
| Total Families | 4,787 (100.0%) | 3.46 |
Median Household Size in Park Forest
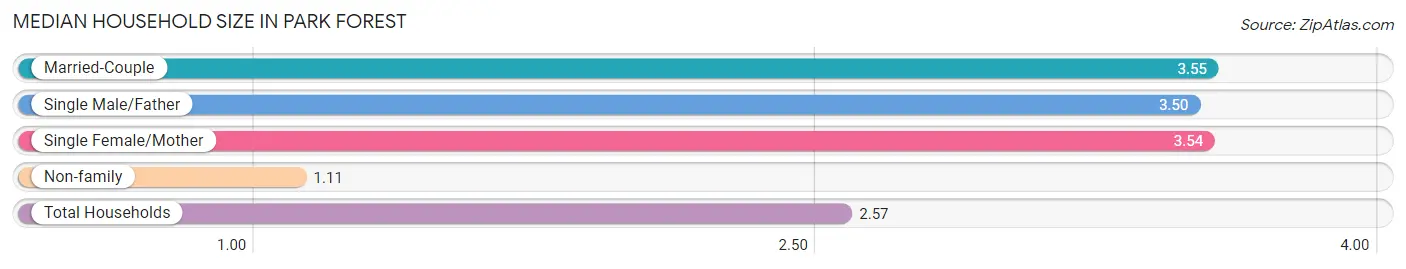
The median household size in Park Forest is 2.57 persons per household, with married-couple households (2,528 | 31.7%) accounting for the largest median household size of 3.55 persons per household. non-family households (3,189 | 40.0%) represent the smallest median household size with 1.11 persons per household.
| Household Type | # Households | Household Size |
| Married-Couple | 2,528 (31.7%) | 3.55 |
| Single Male/Father | 436 (5.5%) | 3.50 |
| Single Female/Mother | 1,823 (22.9%) | 3.54 |
| Non-family | 3,189 (40.0%) | 1.11 |
| Total Households | 7,976 (100.0%) | 2.57 |
Household Size by Marriage Status in Park Forest
Out of a total of 7,976 households in Park Forest, 4,787 (60.0%) are family households, while 3,189 (40.0%) are nonfamily households. The most numerous type of family households are 2-person households, comprising 1,760, and the most common type of nonfamily households are 1-person households, comprising 2,891.
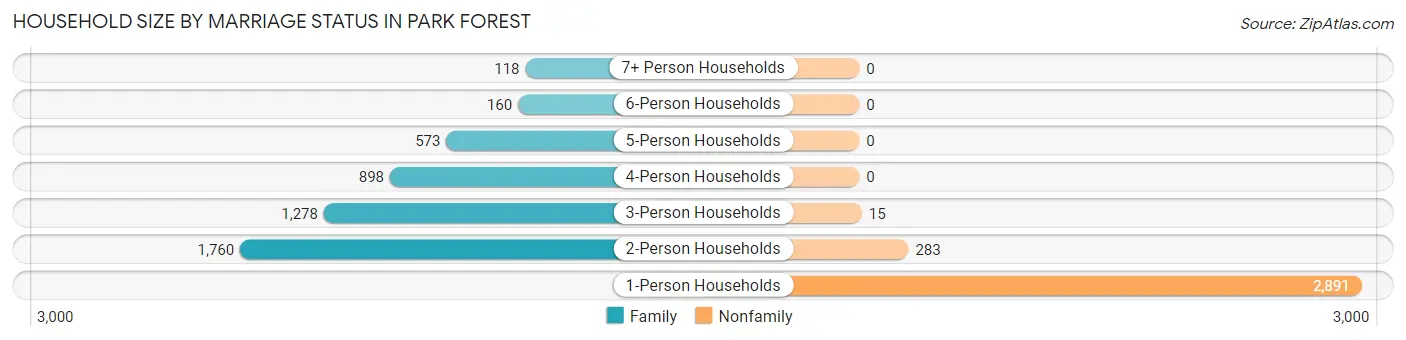
| Household Size | Family Households | Nonfamily Households |
| 1-Person Households | - | 2,891 (36.2%) |
| 2-Person Households | 1,760 (22.1%) | 283 (3.5%) |
| 3-Person Households | 1,278 (16.0%) | 15 (0.2%) |
| 4-Person Households | 898 (11.3%) | 0 (0.0%) |
| 5-Person Households | 573 (7.2%) | 0 (0.0%) |
| 6-Person Households | 160 (2.0%) | 0 (0.0%) |
| 7+ Person Households | 118 (1.5%) | 0 (0.0%) |
| Total | 4,787 (60.0%) | 3,189 (40.0%) |
Female Fertility in Park Forest
Fertility by Age in Park Forest
Average fertility rate in Park Forest is 23.0 births per 1,000 women. Women in the age bracket of 20 to 34 years have the highest fertility rate with 52.0 births per 1,000 women. Women in the age bracket of 20 to 34 years acount for 92.1% of all women with births.
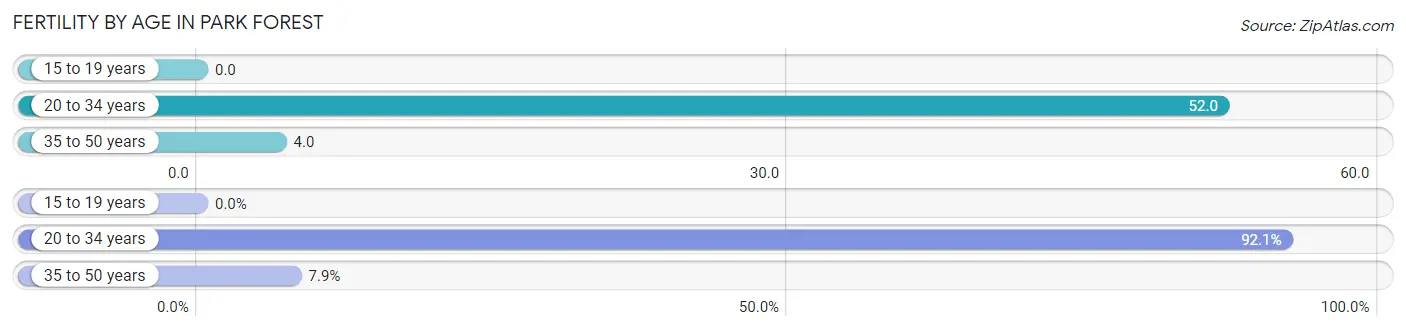
| Age Bracket | Women with Births | Births / 1,000 Women |
| 15 to 19 years | 0 (0.0%) | 0.0 |
| 20 to 34 years | 116 (92.1%) | 52.0 |
| 35 to 50 years | 10 (7.9%) | 4.0 |
| Total | 126 (100.0%) | 23.0 |
Fertility by Age by Marriage Status in Park Forest
92.1% of women with births (126) in Park Forest are married. The highest percentage of unmarried women with births falls into 35 to 50 years age bracket with 100.0% of them unmarried at the time of birth, while the lowest percentage of unmarried women with births belong to 20 to 34 years age bracket with 0.0% of them unmarried.
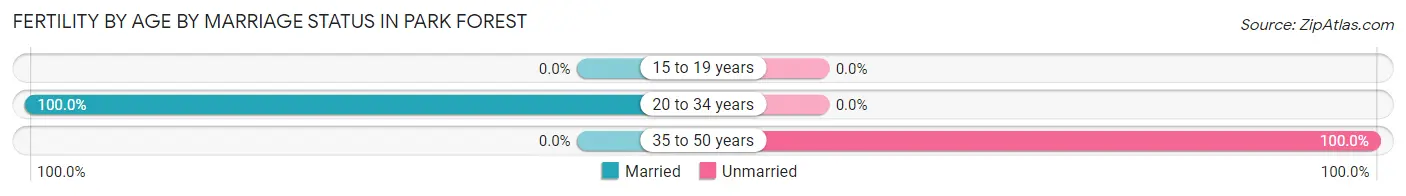
| Age Bracket | Married | Unmarried |
| 15 to 19 years | 0 (0.0%) | 0 (0.0%) |
| 20 to 34 years | 116 (100.0%) | 0 (0.0%) |
| 35 to 50 years | 0 (0.0%) | 10 (100.0%) |
| Total | 116 (92.1%) | 10 (7.9%) |
Fertility by Education in Park Forest
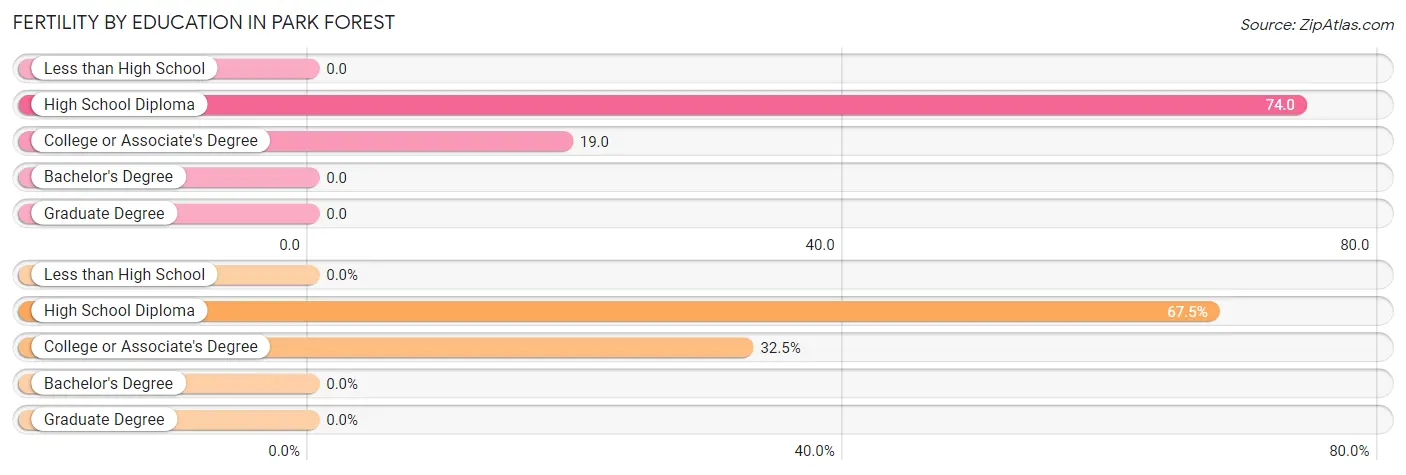
| Educational Attainment | Women with Births | Births / 1,000 Women |
| Less than High School | 0 (0.0%) | 0.0 |
| High School Diploma | 85 (67.5%) | 74.0 |
| College or Associate's Degree | 41 (32.5%) | 19.0 |
| Bachelor's Degree | 0 (0.0%) | 0.0 |
| Graduate Degree | 0 (0.0%) | 0.0 |
| Total | 126 (100.0%) | 23.0 |
Fertility by Education by Marriage Status in Park Forest
7.9% of women with births in Park Forest are unmarried. Women with the educational attainment of college or associate's degree are most likely to be married with 100.0% of them married at childbirth, while women with the educational attainment of high school diploma are least likely to be married with 11.8% of them unmarried at childbirth.
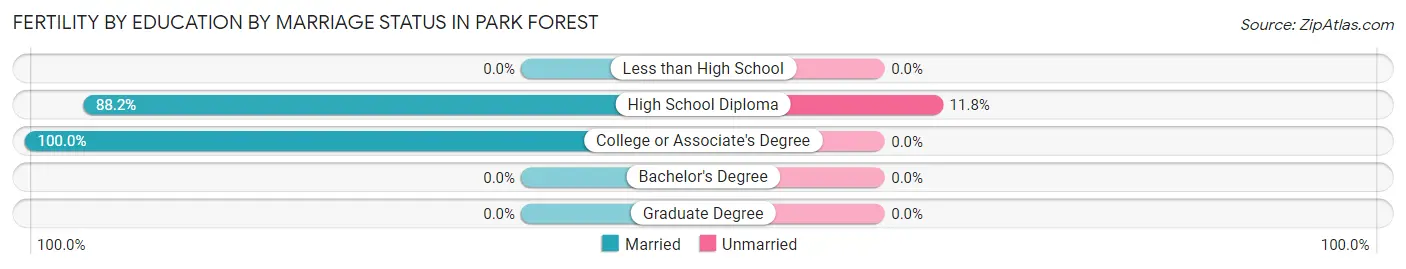
| Educational Attainment | Married | Unmarried |
| Less than High School | 0 (0.0%) | 0 (0.0%) |
| High School Diploma | 75 (88.2%) | 10 (11.8%) |
| College or Associate's Degree | 41 (100.0%) | 0 (0.0%) |
| Bachelor's Degree | 0 (0.0%) | 0 (0.0%) |
| Graduate Degree | 0 (0.0%) | 0 (0.0%) |
| Total | 116 (92.1%) | 10 (7.9%) |
Employment Characteristics in Park Forest
Employment by Class of Employer in Park Forest
Among the 9,151 employed individuals in Park Forest, private company employees (5,658 | 61.8%), local government employees (1,049 | 11.5%), and not-for-profit organizations (866 | 9.5%) make up the most common classes of employment.
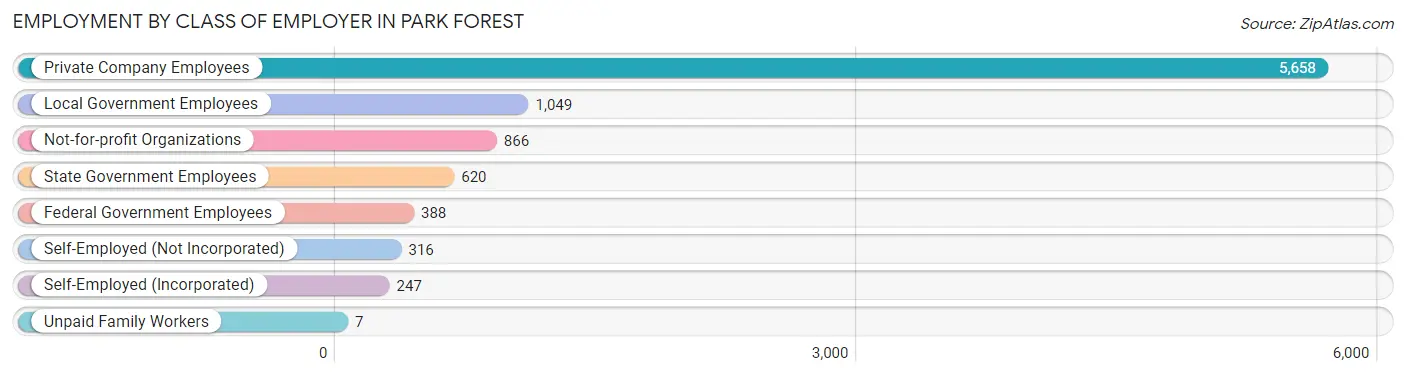
| Employer Class | # Employees | % Employees |
| Private Company Employees | 5,658 | 61.8% |
| Self-Employed (Incorporated) | 247 | 2.7% |
| Self-Employed (Not Incorporated) | 316 | 3.5% |
| Not-for-profit Organizations | 866 | 9.5% |
| Local Government Employees | 1,049 | 11.5% |
| State Government Employees | 620 | 6.8% |
| Federal Government Employees | 388 | 4.2% |
| Unpaid Family Workers | 7 | 0.1% |
| Total | 9,151 | 100.0% |
Employment Status by Age in Park Forest
According to the labor force statistics for Park Forest, out of the total population over 16 years of age (16,489), 62.9% or 10,372 individuals are in the labor force, with 8.4% or 871 of them unemployed. The age group with the highest labor force participation rate is 25 to 29 years, with 85.4% or 1,362 individuals in the labor force. Within the labor force, the 16 to 19 years age range has the highest percentage of unemployed individuals, with 23.8% or 80 of them being unemployed.
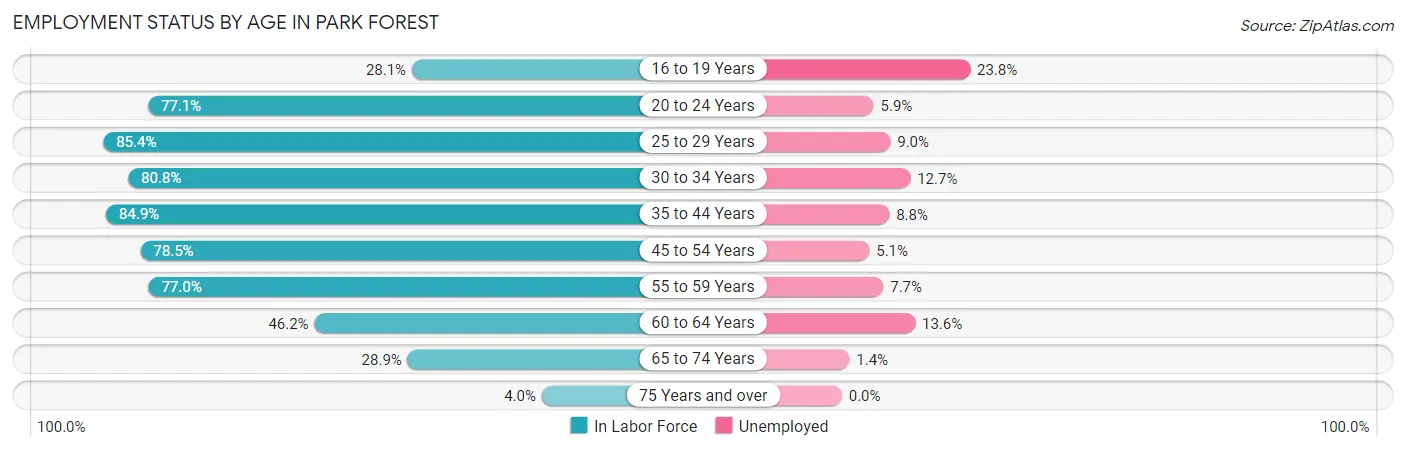
| Age Bracket | In Labor Force | Unemployed |
| 16 to 19 Years | 336 (28.1%) | 80 (23.8%) |
| 20 to 24 Years | 985 (77.1%) | 58 (5.9%) |
| 25 to 29 Years | 1,362 (85.4%) | 123 (9.0%) |
| 30 to 34 Years | 1,007 (80.8%) | 128 (12.7%) |
| 35 to 44 Years | 2,613 (84.9%) | 230 (8.8%) |
| 45 to 54 Years | 1,952 (78.5%) | 100 (5.1%) |
| 55 to 59 Years | 888 (77.0%) | 68 (7.7%) |
| 60 to 64 Years | 565 (46.2%) | 77 (13.6%) |
| 65 to 74 Years | 629 (28.9%) | 9 (1.4%) |
| 75 Years and over | 42 (4.0%) | 0 (0.0%) |
| Total | 10,372 (62.9%) | 871 (8.4%) |
Employment Status by Educational Attainment in Park Forest
According to labor force statistics for Park Forest, 77.8% of individuals (8,388) out of the total population between 25 and 64 years of age (10,781) are in the labor force, with 8.7% or 730 of them being unemployed. The group with the highest labor force participation rate are those with the educational attainment of bachelor's degree or higher, with 87.2% or 2,302 individuals in the labor force. Within the labor force, individuals with college / associate degree education have the highest percentage of unemployment, with 13.5% or 490 of them being unemployed.
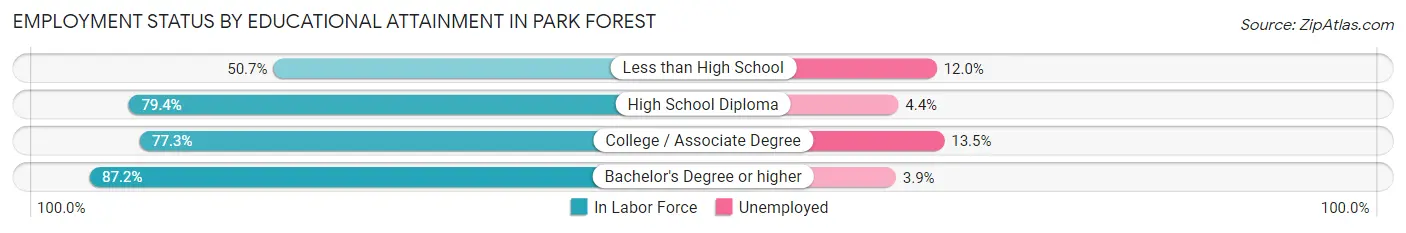
| Educational Attainment | In Labor Force | Unemployed |
| Less than High School | 499 (50.7%) | 118 (12.0%) |
| High School Diploma | 1,958 (79.4%) | 109 (4.4%) |
| College / Associate Degree | 3,626 (77.3%) | 633 (13.5%) |
| Bachelor's Degree or higher | 2,302 (87.2%) | 103 (3.9%) |
| Total | 8,388 (77.8%) | 938 (8.7%) |
Employment Occupations by Sex in Park Forest
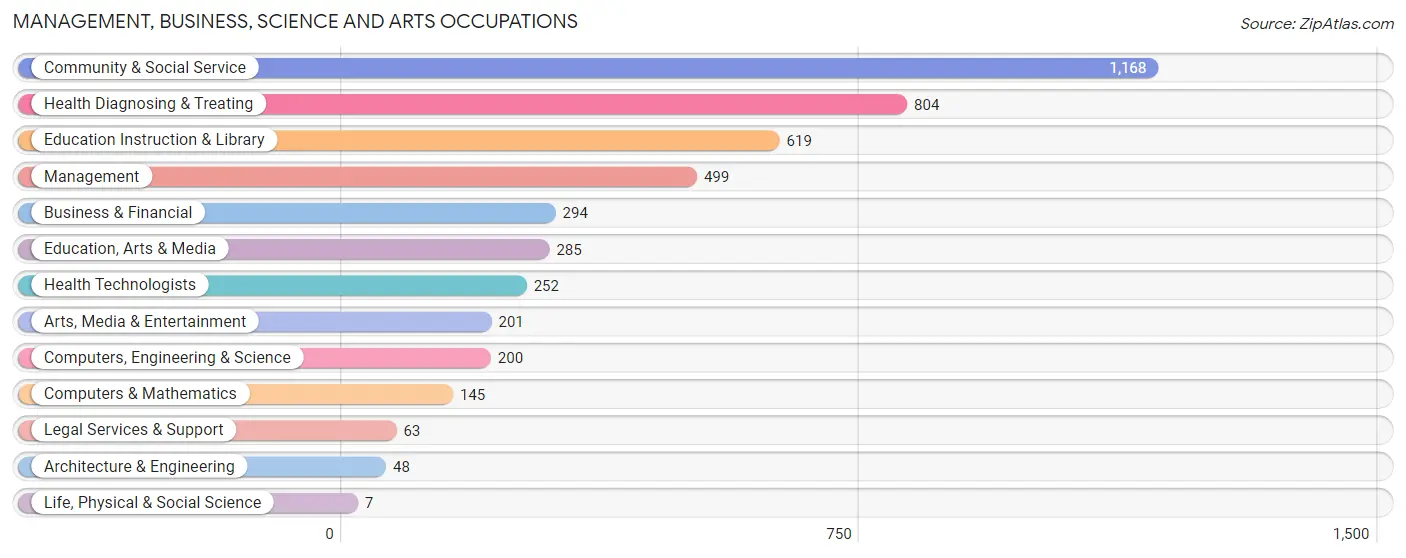
Management, Business, Science and Arts Occupations
The most common Management, Business, Science and Arts occupations in Park Forest are Community & Social Service (1,168 | 12.3%), Health Diagnosing & Treating (804 | 8.5%), Education Instruction & Library (619 | 6.5%), Management (499 | 5.2%), and Business & Financial (294 | 3.1%).
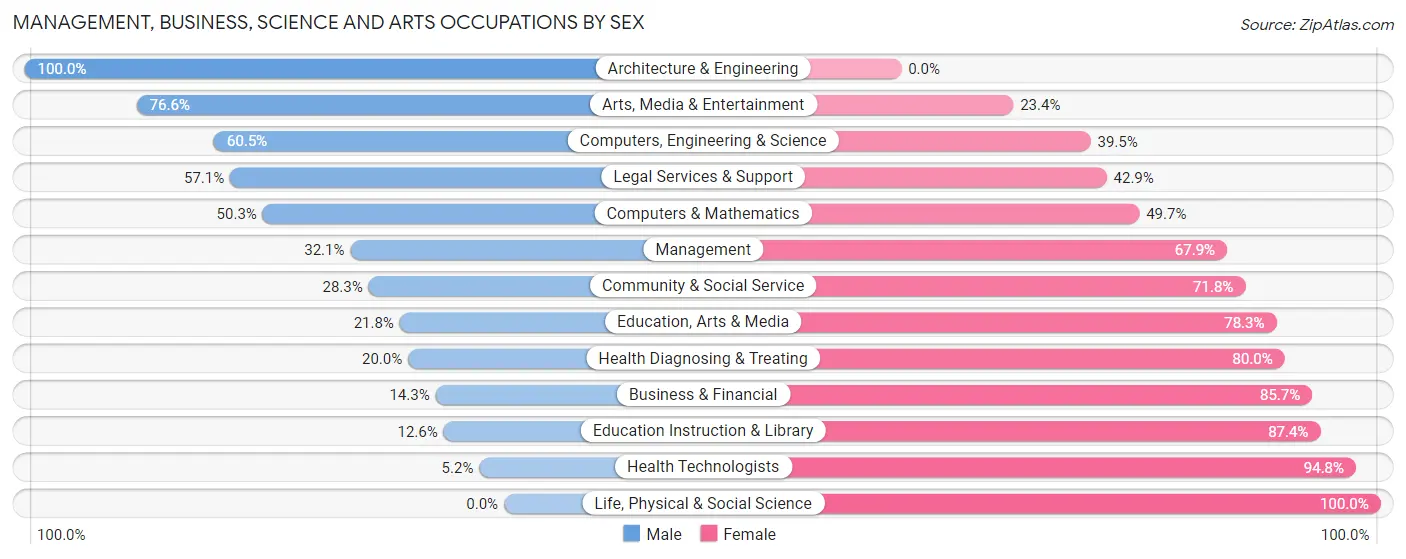
Management, Business, Science and Arts Occupations by Sex
Within the Management, Business, Science and Arts occupations in Park Forest, the most male-oriented occupations are Architecture & Engineering (100.0%), Arts, Media & Entertainment (76.6%), and Computers, Engineering & Science (60.5%), while the most female-oriented occupations are Life, Physical & Social Science (100.0%), Health Technologists (94.8%), and Education Instruction & Library (87.4%).
| Occupation | Male | Female |
| Management | 160 (32.1%) | 339 (67.9%) |
| Business & Financial | 42 (14.3%) | 252 (85.7%) |
| Computers, Engineering & Science | 121 (60.5%) | 79 (39.5%) |
| Computers & Mathematics | 73 (50.3%) | 72 (49.7%) |
| Architecture & Engineering | 48 (100.0%) | 0 (0.0%) |
| Life, Physical & Social Science | 0 (0.0%) | 7 (100.0%) |
| Community & Social Service | 330 (28.2%) | 838 (71.8%) |
| Education, Arts & Media | 62 (21.7%) | 223 (78.2%) |
| Legal Services & Support | 36 (57.1%) | 27 (42.9%) |
| Education Instruction & Library | 78 (12.6%) | 541 (87.4%) |
| Arts, Media & Entertainment | 154 (76.6%) | 47 (23.4%) |
| Health Diagnosing & Treating | 161 (20.0%) | 643 (80.0%) |
| Health Technologists | 13 (5.2%) | 239 (94.8%) |
| Total (Category) | 814 (27.5%) | 2,151 (72.6%) |
| Total (Overall) | 4,468 (47.0%) | 5,038 (53.0%) |
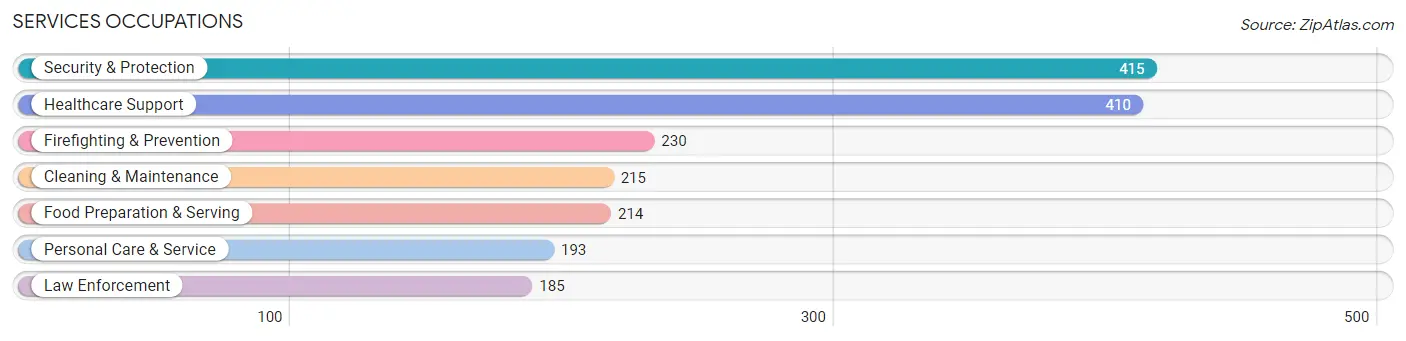
Services Occupations
The most common Services occupations in Park Forest are Security & Protection (415 | 4.4%), Healthcare Support (410 | 4.3%), Firefighting & Prevention (230 | 2.4%), Cleaning & Maintenance (215 | 2.3%), and Food Preparation & Serving (214 | 2.2%).
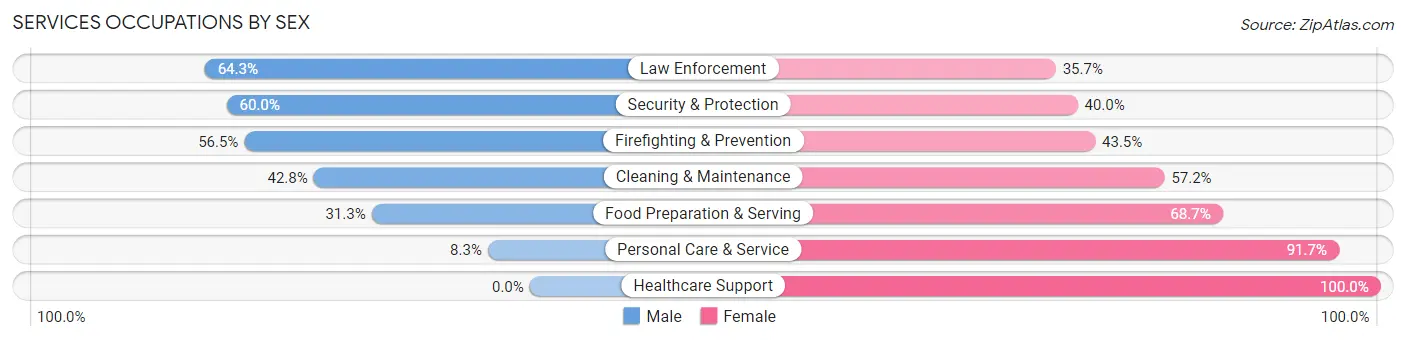
Services Occupations by Sex
Within the Services occupations in Park Forest, the most male-oriented occupations are Law Enforcement (64.3%), Security & Protection (60.0%), and Firefighting & Prevention (56.5%), while the most female-oriented occupations are Healthcare Support (100.0%), Personal Care & Service (91.7%), and Food Preparation & Serving (68.7%).
| Occupation | Male | Female |
| Healthcare Support | 0 (0.0%) | 410 (100.0%) |
| Security & Protection | 249 (60.0%) | 166 (40.0%) |
| Firefighting & Prevention | 130 (56.5%) | 100 (43.5%) |
| Law Enforcement | 119 (64.3%) | 66 (35.7%) |
| Food Preparation & Serving | 67 (31.3%) | 147 (68.7%) |
| Cleaning & Maintenance | 92 (42.8%) | 123 (57.2%) |
| Personal Care & Service | 16 (8.3%) | 177 (91.7%) |
| Total (Category) | 424 (29.3%) | 1,023 (70.7%) |
| Total (Overall) | 4,468 (47.0%) | 5,038 (53.0%) |
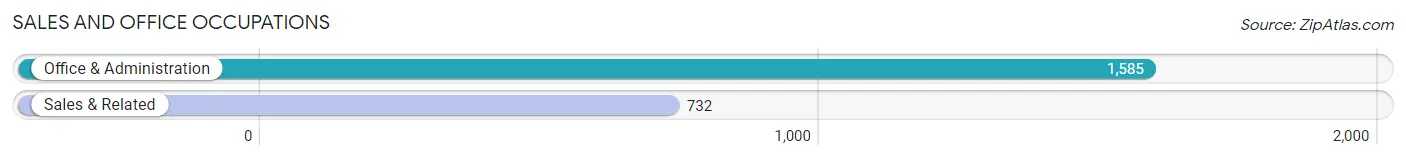
Sales and Office Occupations
The most common Sales and Office occupations in Park Forest are Office & Administration (1,585 | 16.7%), and Sales & Related (732 | 7.7%).
Sales and Office Occupations by Sex
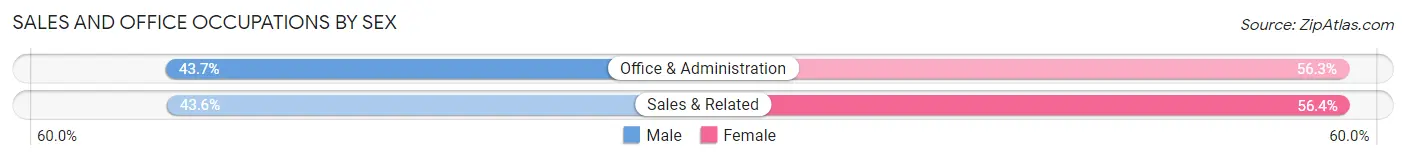
| Occupation | Male | Female |
| Sales & Related | 319 (43.6%) | 413 (56.4%) |
| Office & Administration | 692 (43.7%) | 893 (56.3%) |
| Total (Category) | 1,011 (43.6%) | 1,306 (56.4%) |
| Total (Overall) | 4,468 (47.0%) | 5,038 (53.0%) |
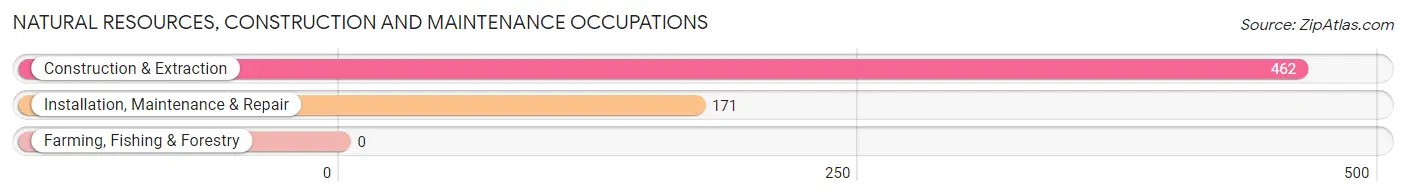
Natural Resources, Construction and Maintenance Occupations
The most common Natural Resources, Construction and Maintenance occupations in Park Forest are Construction & Extraction (462 | 4.9%), and Installation, Maintenance & Repair (171 | 1.8%).
Natural Resources, Construction and Maintenance Occupations by Sex
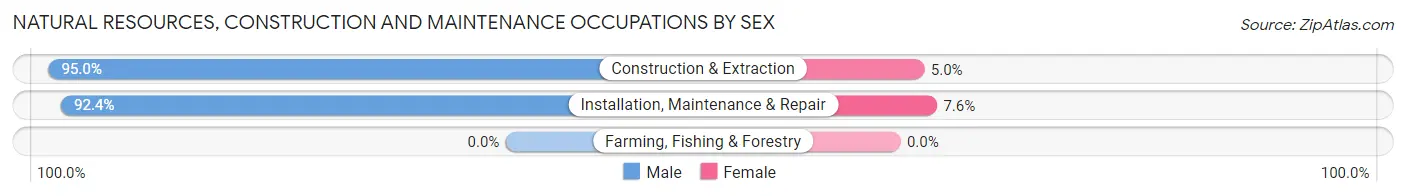
| Occupation | Male | Female |
| Farming, Fishing & Forestry | 0 (0.0%) | 0 (0.0%) |
| Construction & Extraction | 439 (95.0%) | 23 (5.0%) |
| Installation, Maintenance & Repair | 158 (92.4%) | 13 (7.6%) |
| Total (Category) | 597 (94.3%) | 36 (5.7%) |
| Total (Overall) | 4,468 (47.0%) | 5,038 (53.0%) |
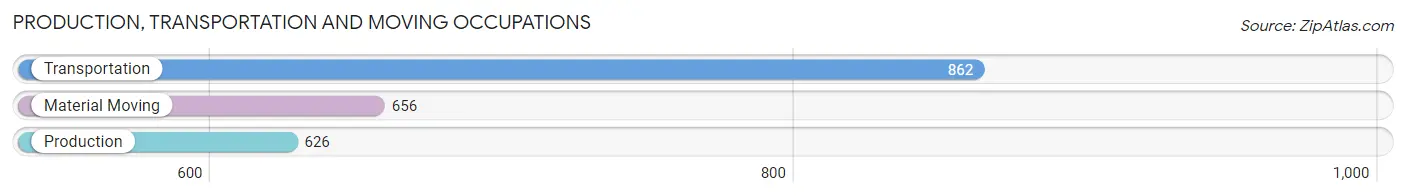
Production, Transportation and Moving Occupations
The most common Production, Transportation and Moving occupations in Park Forest are Transportation (862 | 9.1%), Material Moving (656 | 6.9%), and Production (626 | 6.6%).
Production, Transportation and Moving Occupations by Sex
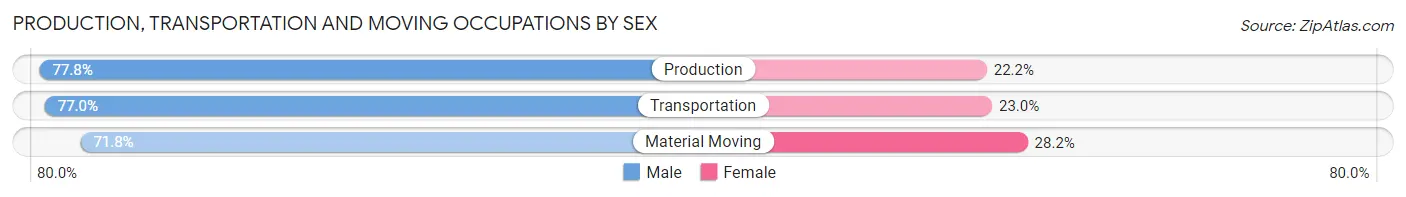
| Occupation | Male | Female |
| Production | 487 (77.8%) | 139 (22.2%) |
| Transportation | 664 (77.0%) | 198 (23.0%) |
| Material Moving | 471 (71.8%) | 185 (28.2%) |
| Total (Category) | 1,622 (75.6%) | 522 (24.3%) |
| Total (Overall) | 4,468 (47.0%) | 5,038 (53.0%) |
Employment Industries by Sex in Park Forest
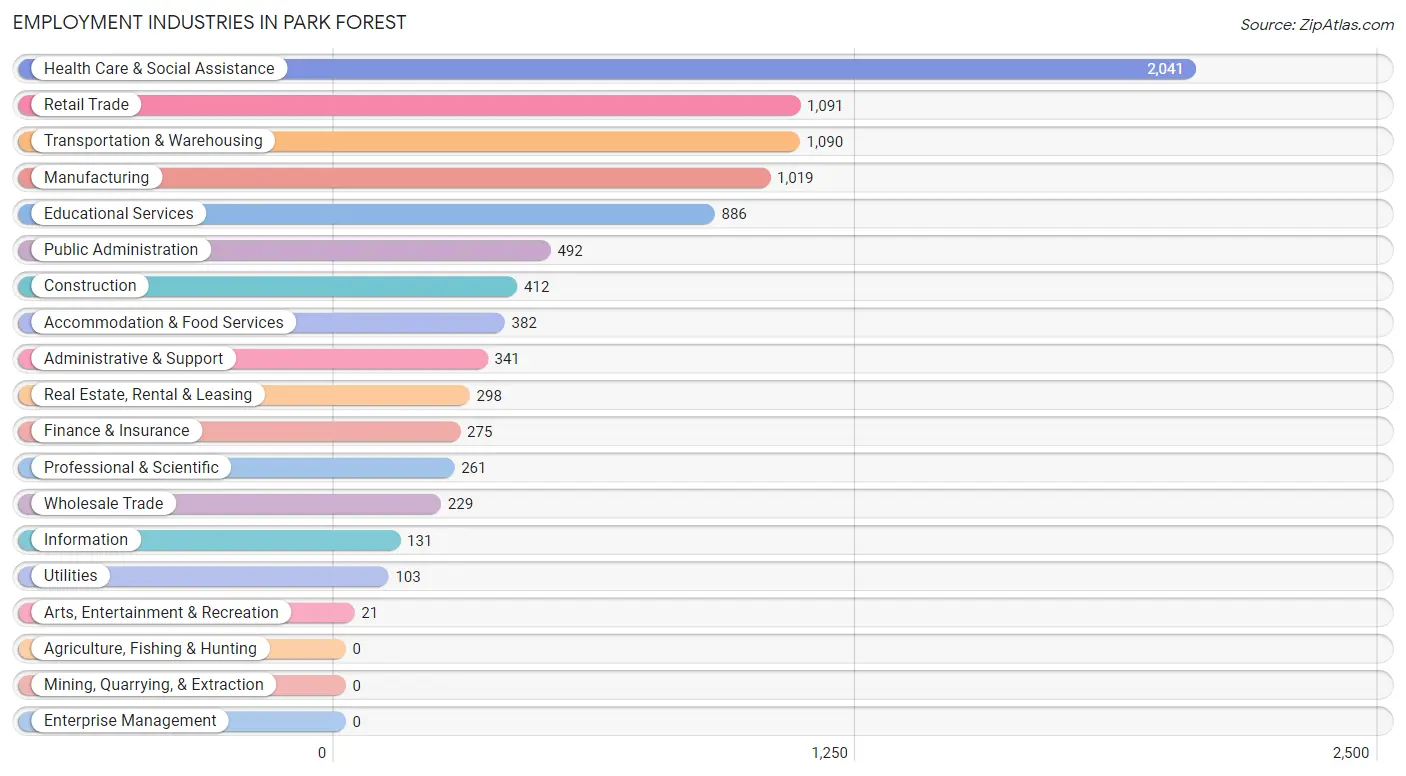
Employment Industries in Park Forest
The major employment industries in Park Forest include Health Care & Social Assistance (2,041 | 21.5%), Retail Trade (1,091 | 11.5%), Transportation & Warehousing (1,090 | 11.5%), Manufacturing (1,019 | 10.7%), and Educational Services (886 | 9.3%).
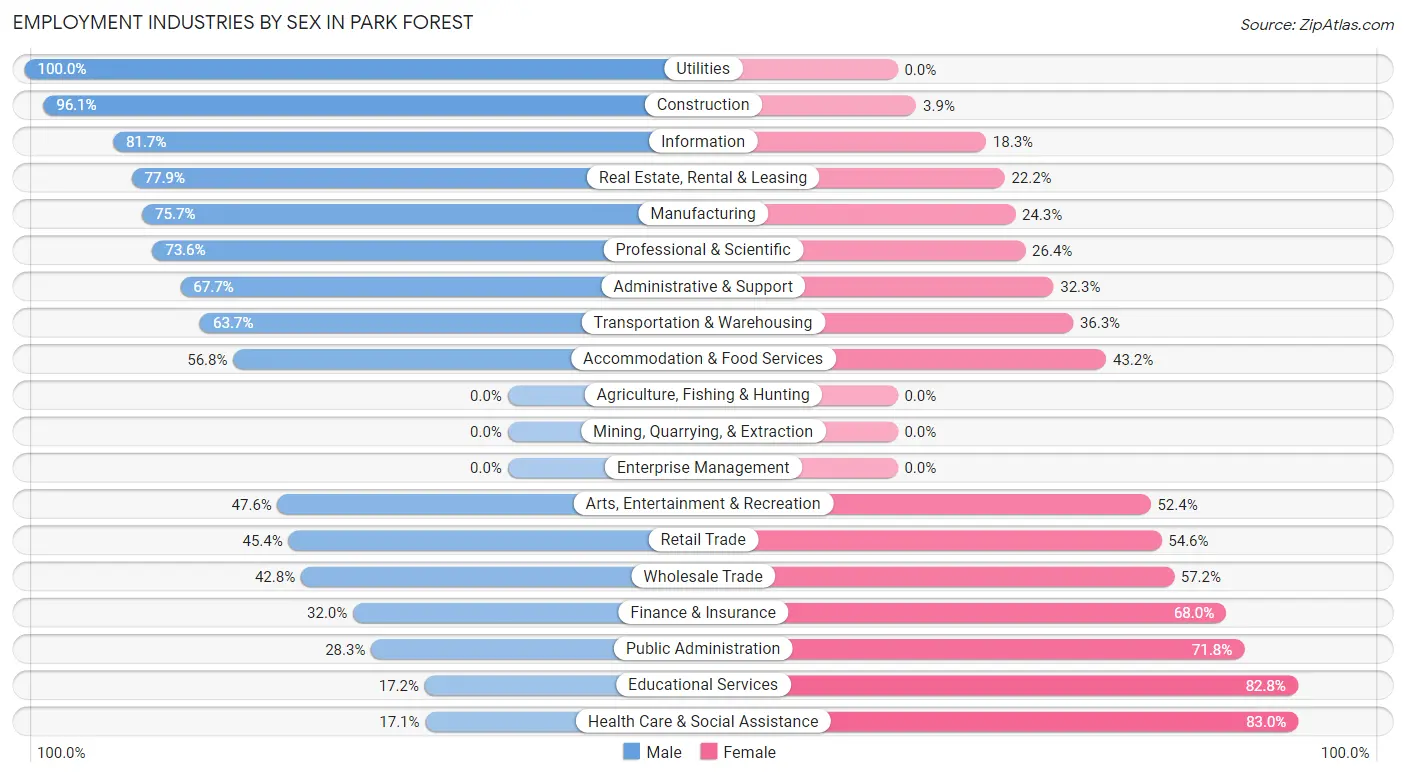
Employment Industries by Sex in Park Forest
The Park Forest industries that see more men than women are Utilities (100.0%), Construction (96.1%), and Information (81.7%), whereas the industries that tend to have a higher number of women are Health Care & Social Assistance (83.0%), Educational Services (82.8%), and Public Administration (71.8%).
| Industry | Male | Female |
| Agriculture, Fishing & Hunting | 0 (0.0%) | 0 (0.0%) |
| Mining, Quarrying, & Extraction | 0 (0.0%) | 0 (0.0%) |
| Construction | 396 (96.1%) | 16 (3.9%) |
| Manufacturing | 771 (75.7%) | 248 (24.3%) |
| Wholesale Trade | 98 (42.8%) | 131 (57.2%) |
| Retail Trade | 495 (45.4%) | 596 (54.6%) |
| Transportation & Warehousing | 694 (63.7%) | 396 (36.3%) |
| Utilities | 103 (100.0%) | 0 (0.0%) |
| Information | 107 (81.7%) | 24 (18.3%) |
| Finance & Insurance | 88 (32.0%) | 187 (68.0%) |
| Real Estate, Rental & Leasing | 232 (77.8%) | 66 (22.2%) |
| Professional & Scientific | 192 (73.6%) | 69 (26.4%) |
| Enterprise Management | 0 (0.0%) | 0 (0.0%) |
| Administrative & Support | 231 (67.7%) | 110 (32.3%) |
| Educational Services | 152 (17.2%) | 734 (82.8%) |
| Health Care & Social Assistance | 348 (17.1%) | 1,693 (83.0%) |
| Arts, Entertainment & Recreation | 10 (47.6%) | 11 (52.4%) |
| Accommodation & Food Services | 217 (56.8%) | 165 (43.2%) |
| Public Administration | 139 (28.2%) | 353 (71.8%) |
| Total | 4,468 (47.0%) | 5,038 (53.0%) |
Education in Park Forest
School Enrollment in Park Forest
The most common levels of schooling among the 5,526 students in Park Forest are high school (1,550 | 28.1%), elementary school (1,388 | 25.1%), and middle school (1,080 | 19.5%).
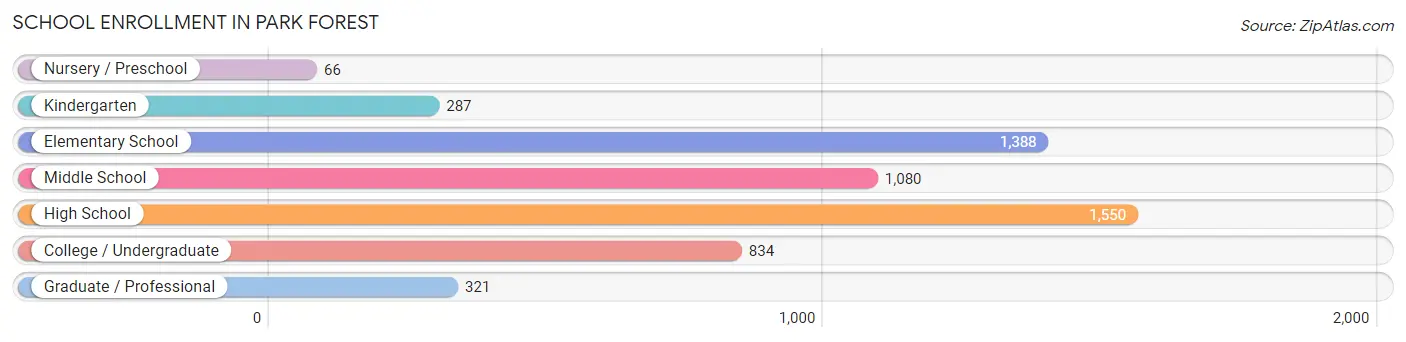
| School Level | # Students | % Students |
| Nursery / Preschool | 66 | 1.2% |
| Kindergarten | 287 | 5.2% |
| Elementary School | 1,388 | 25.1% |
| Middle School | 1,080 | 19.5% |
| High School | 1,550 | 28.1% |
| College / Undergraduate | 834 | 15.1% |
| Graduate / Professional | 321 | 5.8% |
| Total | 5,526 | 100.0% |
School Enrollment by Age by Funding Source in Park Forest
Out of a total of 5,526 students who are enrolled in schools in Park Forest, 558 (10.1%) attend a private institution, while the remaining 4,968 (89.9%) are enrolled in public schools. The age group of 18 to 19 year olds has the highest likelihood of being enrolled in private schools, with 92 (38.3% in the age bracket) enrolled. Conversely, the age group of 3 to 4 year olds has the lowest likelihood of being enrolled in a private school, with 49 (100.0% in the age bracket) attending a public institution.
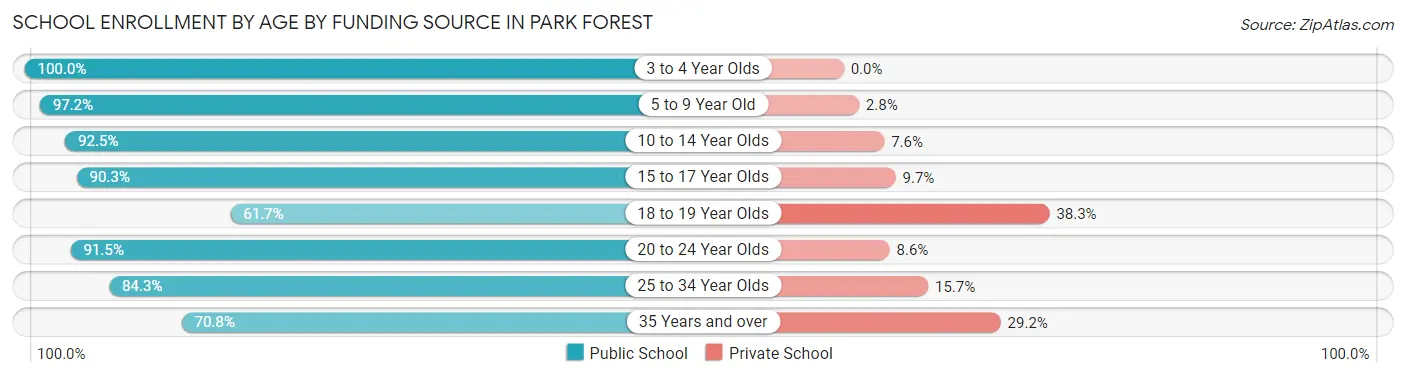
| Age Bracket | Public School | Private School |
| 3 to 4 Year Olds | 49 (100.0%) | 0 (0.0%) |
| 5 to 9 Year Old | 1,538 (97.2%) | 45 (2.8%) |
| 10 to 14 Year Olds | 1,212 (92.4%) | 99 (7.5%) |
| 15 to 17 Year Olds | 1,120 (90.3%) | 120 (9.7%) |
| 18 to 19 Year Olds | 148 (61.7%) | 92 (38.3%) |
| 20 to 24 Year Olds | 321 (91.4%) | 30 (8.6%) |
| 25 to 34 Year Olds | 311 (84.3%) | 58 (15.7%) |
| 35 Years and over | 271 (70.8%) | 112 (29.2%) |
| Total | 4,968 (89.9%) | 558 (10.1%) |
Educational Attainment by Field of Study in Park Forest
Business (944 | 24.9%), education (567 | 15.0%), arts & humanities (363 | 9.6%), psychology (305 | 8.1%), and science & technology (300 | 7.9%) are the most common fields of study among 3,784 individuals in Park Forest who have obtained a bachelor's degree or higher.
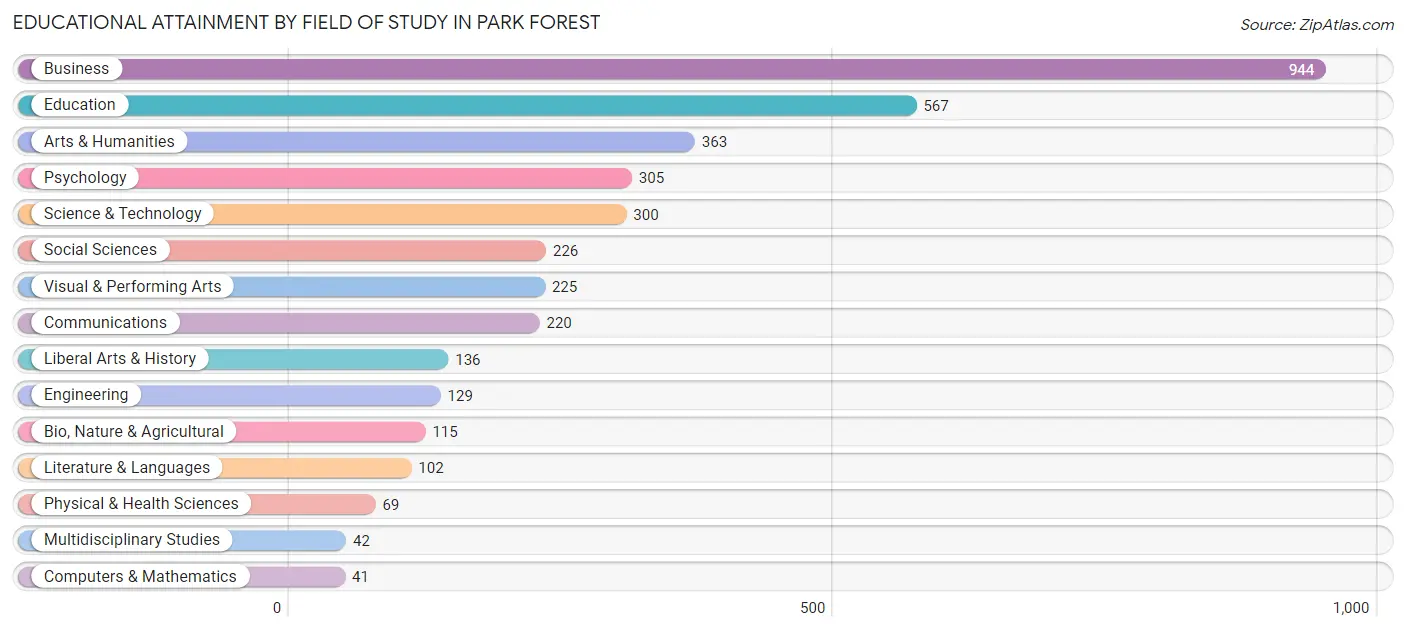
| Field of Study | # Graduates | % Graduates |
| Computers & Mathematics | 41 | 1.1% |
| Bio, Nature & Agricultural | 115 | 3.0% |
| Physical & Health Sciences | 69 | 1.8% |
| Psychology | 305 | 8.1% |
| Social Sciences | 226 | 6.0% |
| Engineering | 129 | 3.4% |
| Multidisciplinary Studies | 42 | 1.1% |
| Science & Technology | 300 | 7.9% |
| Business | 944 | 24.9% |
| Education | 567 | 15.0% |
| Literature & Languages | 102 | 2.7% |
| Liberal Arts & History | 136 | 3.6% |
| Visual & Performing Arts | 225 | 5.9% |
| Communications | 220 | 5.8% |
| Arts & Humanities | 363 | 9.6% |
| Total | 3,784 | 100.0% |
Transportation & Commute in Park Forest
Vehicle Availability by Sex in Park Forest
The most prevalent vehicle ownership categories in Park Forest are males with 2 vehicles (2,030, accounting for 46.6%) and females with 2 vehicles (1,858, making up 42.5%).
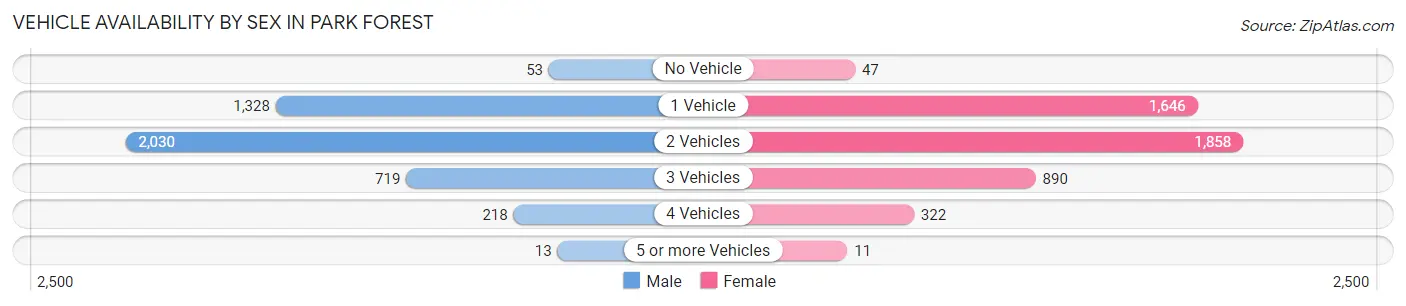
| Vehicles Available | Male | Female |
| No Vehicle | 53 (1.2%) | 47 (1.0%) |
| 1 Vehicle | 1,328 (30.4%) | 1,646 (34.5%) |
| 2 Vehicles | 2,030 (46.6%) | 1,858 (38.9%) |
| 3 Vehicles | 719 (16.5%) | 890 (18.6%) |
| 4 Vehicles | 218 (5.0%) | 322 (6.7%) |
| 5 or more Vehicles | 13 (0.3%) | 11 (0.2%) |
| Total | 4,361 (100.0%) | 4,774 (100.0%) |
Commute Time in Park Forest
The most frequently occuring commute durations in Park Forest are 10 to 14 minutes (1,448 commuters, 16.7%), 45 to 59 minutes (1,276 commuters, 14.7%), and 20 to 24 minutes (971 commuters, 11.2%).
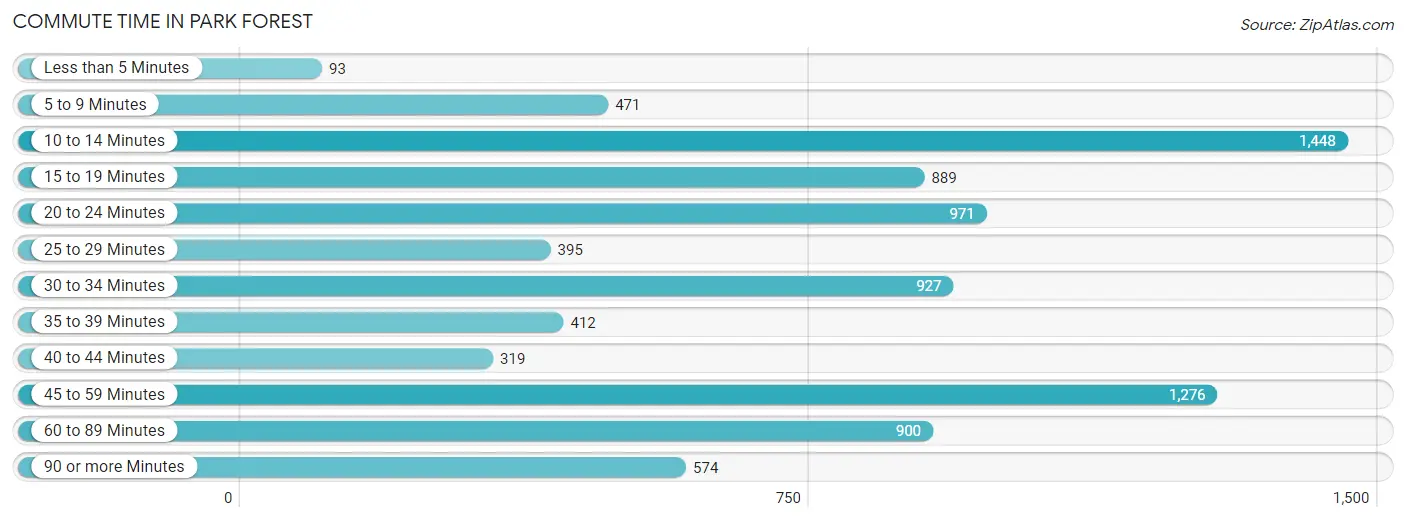
| Commute Time | # Commuters | % Commuters |
| Less than 5 Minutes | 93 | 1.1% |
| 5 to 9 Minutes | 471 | 5.4% |
| 10 to 14 Minutes | 1,448 | 16.7% |
| 15 to 19 Minutes | 889 | 10.2% |
| 20 to 24 Minutes | 971 | 11.2% |
| 25 to 29 Minutes | 395 | 4.5% |
| 30 to 34 Minutes | 927 | 10.7% |
| 35 to 39 Minutes | 412 | 4.8% |
| 40 to 44 Minutes | 319 | 3.7% |
| 45 to 59 Minutes | 1,276 | 14.7% |
| 60 to 89 Minutes | 900 | 10.4% |
| 90 or more Minutes | 574 | 6.6% |
Commute Time by Sex in Park Forest
The most common commute times in Park Forest are 10 to 14 minutes (805 commuters, 19.0%) for males and 45 to 59 minutes (655 commuters, 14.7%) for females.
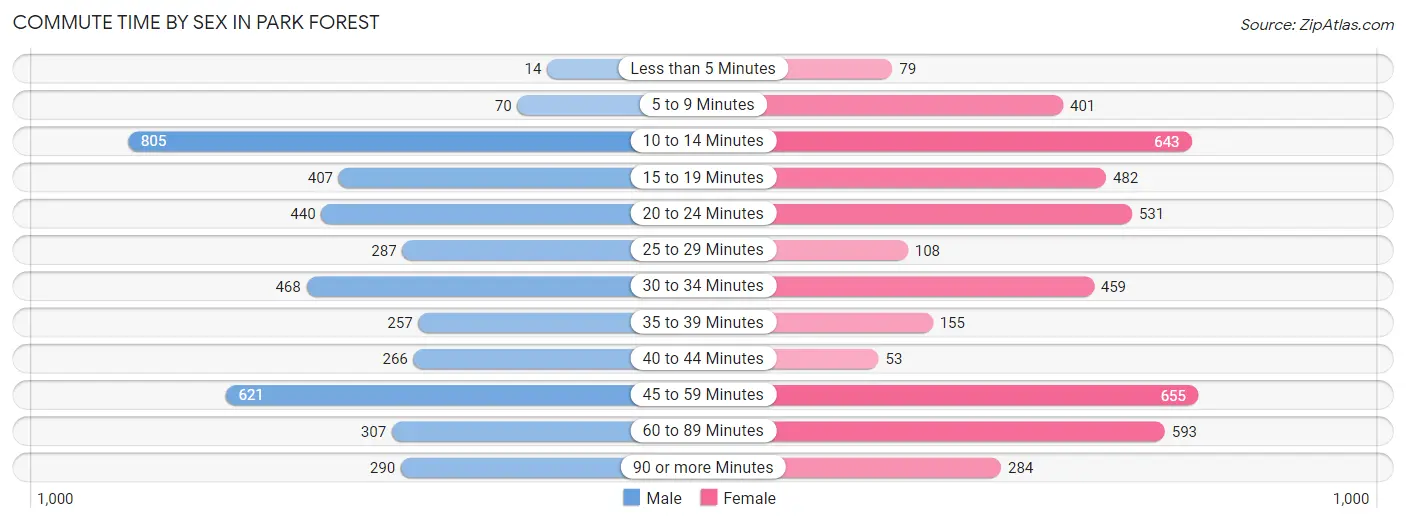
| Commute Time | Male | Female |
| Less than 5 Minutes | 14 (0.3%) | 79 (1.8%) |
| 5 to 9 Minutes | 70 (1.7%) | 401 (9.0%) |
| 10 to 14 Minutes | 805 (19.0%) | 643 (14.5%) |
| 15 to 19 Minutes | 407 (9.6%) | 482 (10.8%) |
| 20 to 24 Minutes | 440 (10.4%) | 531 (11.9%) |
| 25 to 29 Minutes | 287 (6.8%) | 108 (2.4%) |
| 30 to 34 Minutes | 468 (11.1%) | 459 (10.3%) |
| 35 to 39 Minutes | 257 (6.1%) | 155 (3.5%) |
| 40 to 44 Minutes | 266 (6.3%) | 53 (1.2%) |
| 45 to 59 Minutes | 621 (14.7%) | 655 (14.7%) |
| 60 to 89 Minutes | 307 (7.2%) | 593 (13.4%) |
| 90 or more Minutes | 290 (6.9%) | 284 (6.4%) |
Time of Departure to Work by Sex in Park Forest
The most frequent times of departure to work in Park Forest are 12:00 PM to 3:59 PM (569, 13.5%) for males and 7:00 AM to 7:29 AM (768, 17.3%) for females.
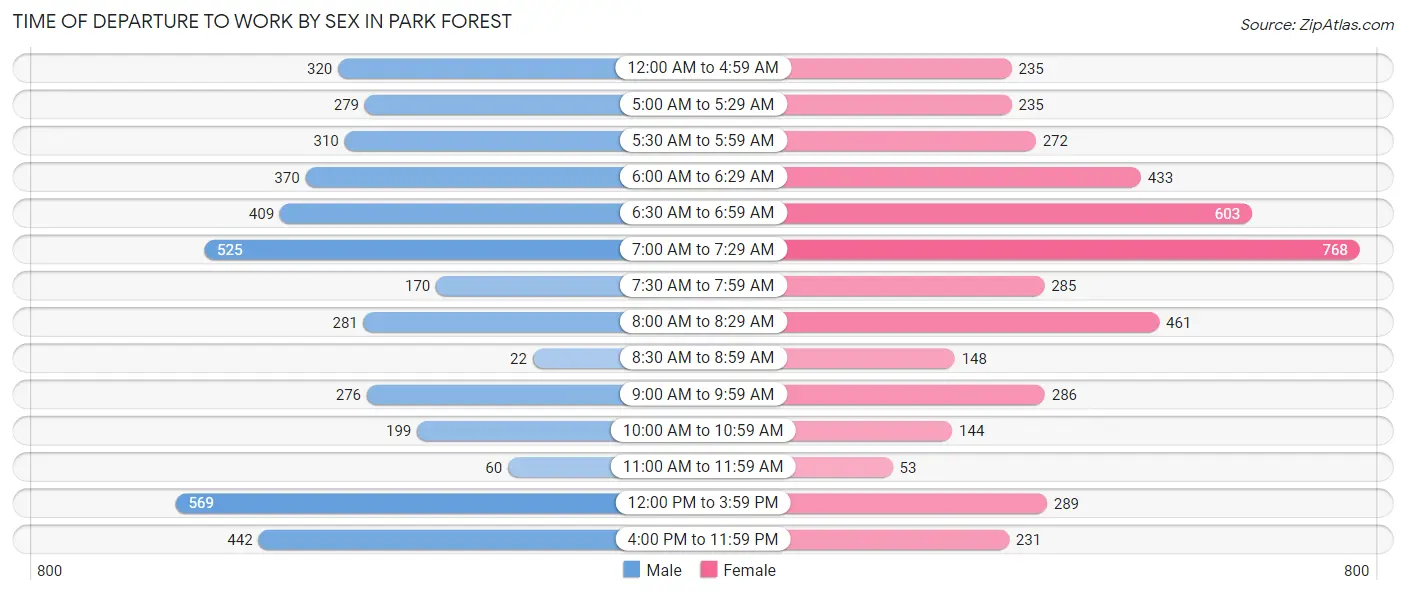
| Time of Departure | Male | Female |
| 12:00 AM to 4:59 AM | 320 (7.6%) | 235 (5.3%) |
| 5:00 AM to 5:29 AM | 279 (6.6%) | 235 (5.3%) |
| 5:30 AM to 5:59 AM | 310 (7.3%) | 272 (6.1%) |
| 6:00 AM to 6:29 AM | 370 (8.7%) | 433 (9.8%) |
| 6:30 AM to 6:59 AM | 409 (9.7%) | 603 (13.6%) |
| 7:00 AM to 7:29 AM | 525 (12.4%) | 768 (17.3%) |
| 7:30 AM to 7:59 AM | 170 (4.0%) | 285 (6.4%) |
| 8:00 AM to 8:29 AM | 281 (6.6%) | 461 (10.4%) |
| 8:30 AM to 8:59 AM | 22 (0.5%) | 148 (3.3%) |
| 9:00 AM to 9:59 AM | 276 (6.5%) | 286 (6.4%) |
| 10:00 AM to 10:59 AM | 199 (4.7%) | 144 (3.2%) |
| 11:00 AM to 11:59 AM | 60 (1.4%) | 53 (1.2%) |
| 12:00 PM to 3:59 PM | 569 (13.5%) | 289 (6.5%) |
| 4:00 PM to 11:59 PM | 442 (10.4%) | 231 (5.2%) |
| Total | 4,232 (100.0%) | 4,443 (100.0%) |
Housing Occupancy in Park Forest
Occupancy by Ownership in Park Forest
Of the total 7,976 dwellings in Park Forest, owner-occupied units account for 4,888 (61.3%), while renter-occupied units make up 3,088 (38.7%).
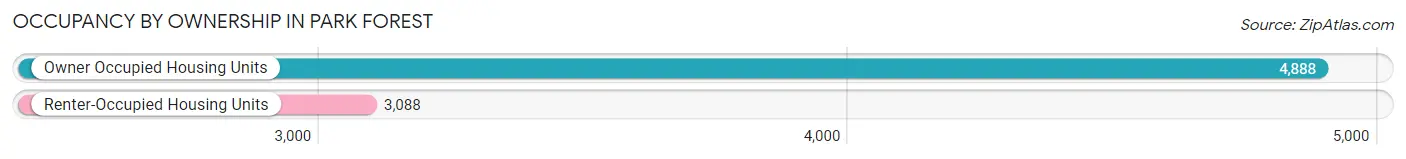
| Occupancy | # Housing Units | % Housing Units |
| Owner Occupied Housing Units | 4,888 | 61.3% |
| Renter-Occupied Housing Units | 3,088 | 38.7% |
| Total Occupied Housing Units | 7,976 | 100.0% |
Occupancy by Household Size in Park Forest
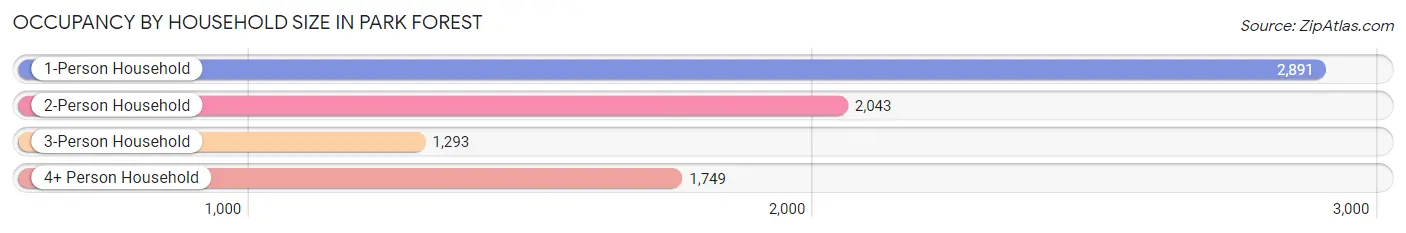
| Household Size | # Housing Units | % Housing Units |
| 1-Person Household | 2,891 | 36.2% |
| 2-Person Household | 2,043 | 25.6% |
| 3-Person Household | 1,293 | 16.2% |
| 4+ Person Household | 1,749 | 21.9% |
| Total Housing Units | 7,976 | 100.0% |
Occupancy by Ownership by Household Size in Park Forest
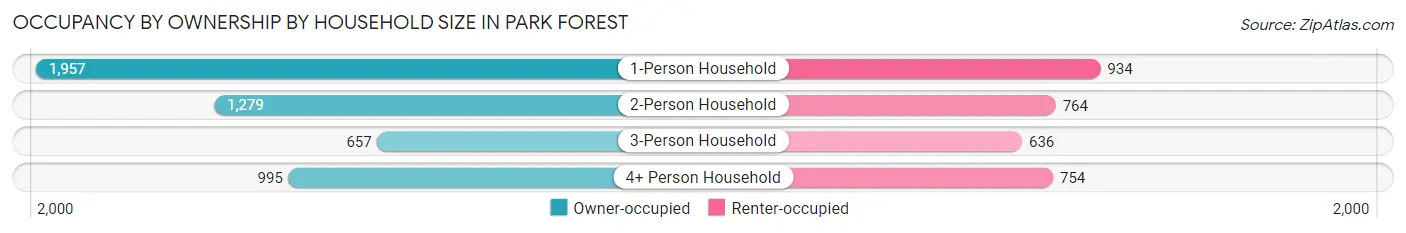
| Household Size | Owner-occupied | Renter-occupied |
| 1-Person Household | 1,957 (67.7%) | 934 (32.3%) |
| 2-Person Household | 1,279 (62.6%) | 764 (37.4%) |
| 3-Person Household | 657 (50.8%) | 636 (49.2%) |
| 4+ Person Household | 995 (56.9%) | 754 (43.1%) |
| Total Housing Units | 4,888 (61.3%) | 3,088 (38.7%) |
Occupancy by Educational Attainment in Park Forest
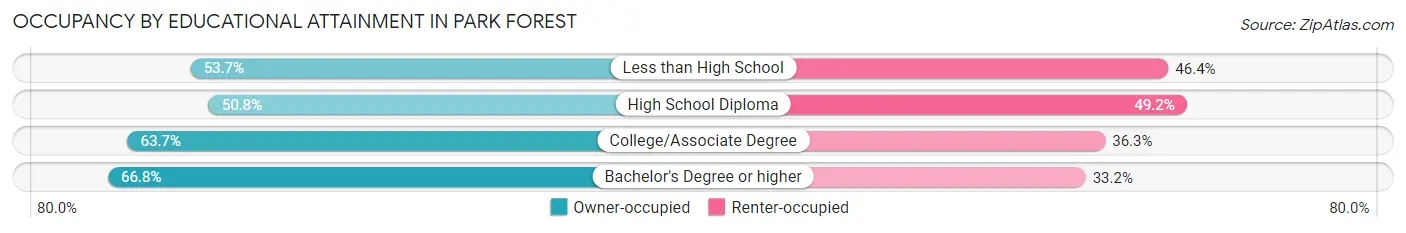
| Household Size | Owner-occupied | Renter-occupied |
| Less than High School | 235 (53.6%) | 203 (46.4%) |
| High School Diploma | 876 (50.8%) | 849 (49.2%) |
| College/Associate Degree | 2,130 (63.7%) | 1,216 (36.3%) |
| Bachelor's Degree or higher | 1,647 (66.8%) | 820 (33.2%) |
Occupancy by Age of Householder in Park Forest
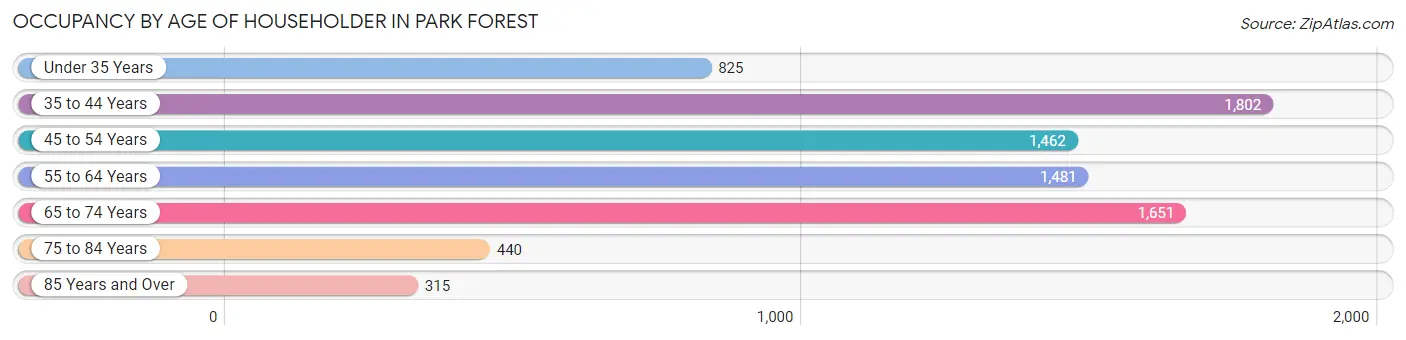
| Age Bracket | # Households | % Households |
| Under 35 Years | 825 | 10.3% |
| 35 to 44 Years | 1,802 | 22.6% |
| 45 to 54 Years | 1,462 | 18.3% |
| 55 to 64 Years | 1,481 | 18.6% |
| 65 to 74 Years | 1,651 | 20.7% |
| 75 to 84 Years | 440 | 5.5% |
| 85 Years and Over | 315 | 4.0% |
| Total | 7,976 | 100.0% |
Housing Finances in Park Forest
Median Income by Occupancy in Park Forest
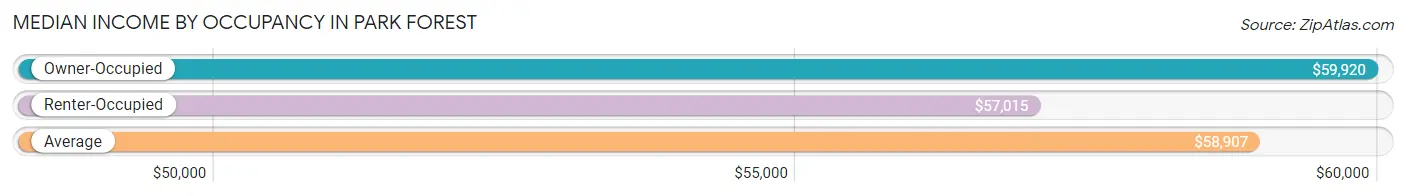
| Occupancy Type | # Households | Median Income |
| Owner-Occupied | 4,888 (61.3%) | $59,920 |
| Renter-Occupied | 3,088 (38.7%) | $57,015 |
| Average | 7,976 (100.0%) | $58,907 |
Occupancy by Householder Income Bracket in Park Forest
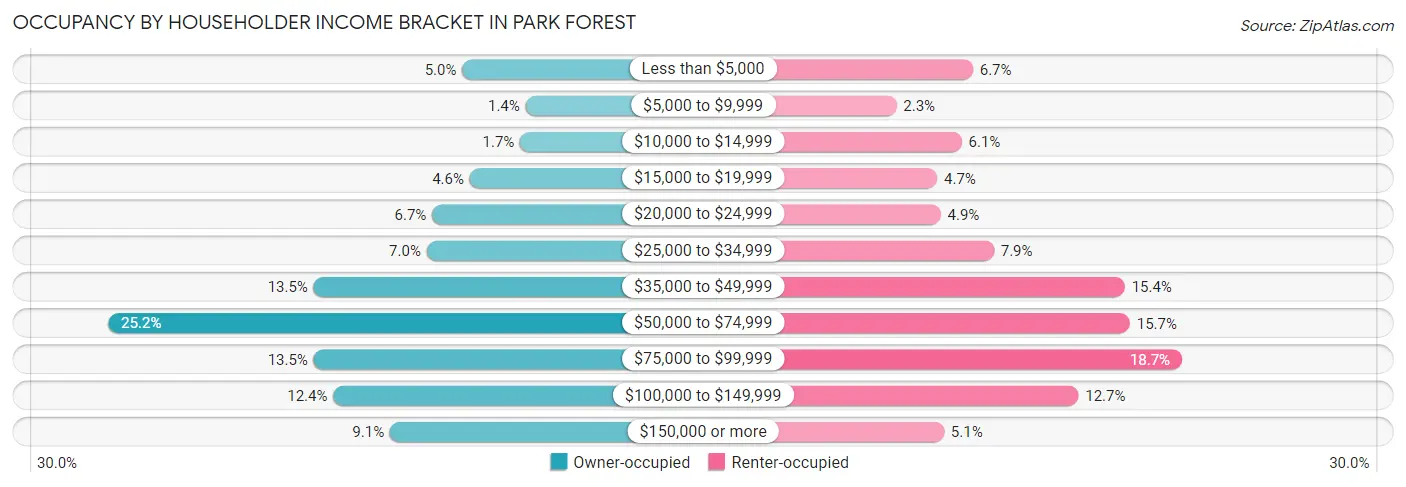
| Income Bracket | Owner-occupied | Renter-occupied |
| Less than $5,000 | 244 (5.0%) | 207 (6.7%) |
| $5,000 to $9,999 | 67 (1.4%) | 72 (2.3%) |
| $10,000 to $14,999 | 82 (1.7%) | 187 (6.1%) |
| $15,000 to $19,999 | 223 (4.6%) | 144 (4.7%) |
| $20,000 to $24,999 | 328 (6.7%) | 150 (4.9%) |
| $25,000 to $34,999 | 343 (7.0%) | 244 (7.9%) |
| $35,000 to $49,999 | 659 (13.5%) | 475 (15.4%) |
| $50,000 to $74,999 | 1,233 (25.2%) | 484 (15.7%) |
| $75,000 to $99,999 | 659 (13.5%) | 576 (18.6%) |
| $100,000 to $149,999 | 604 (12.4%) | 393 (12.7%) |
| $150,000 or more | 446 (9.1%) | 156 (5.1%) |
| Total | 4,888 (100.0%) | 3,088 (100.0%) |
Monthly Housing Cost Tiers in Park Forest
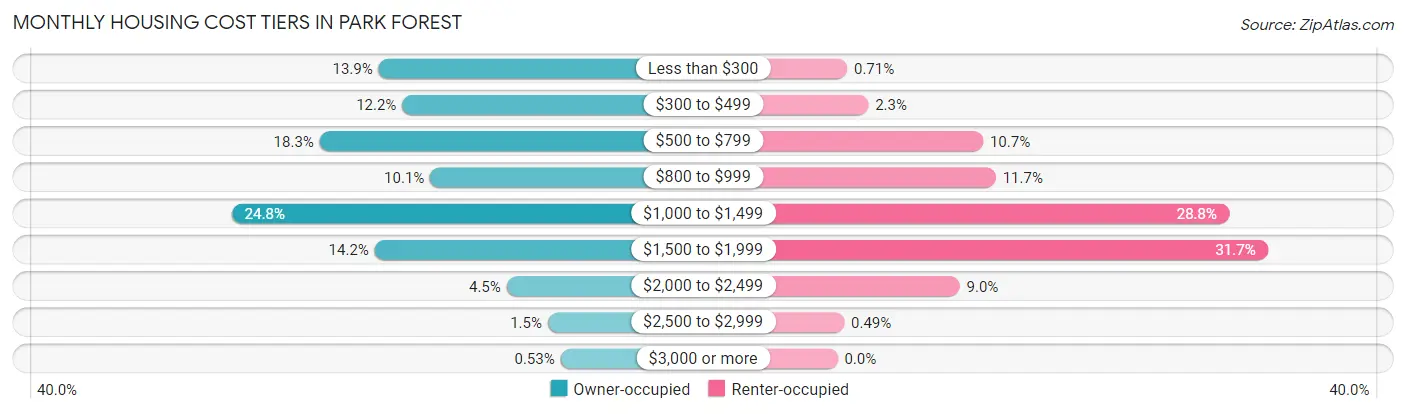
| Monthly Cost | Owner-occupied | Renter-occupied |
| Less than $300 | 681 (13.9%) | 22 (0.7%) |
| $300 to $499 | 596 (12.2%) | 70 (2.3%) |
| $500 to $799 | 893 (18.3%) | 331 (10.7%) |
| $800 to $999 | 495 (10.1%) | 360 (11.7%) |
| $1,000 to $1,499 | 1,210 (24.7%) | 890 (28.8%) |
| $1,500 to $1,999 | 695 (14.2%) | 978 (31.7%) |
| $2,000 to $2,499 | 220 (4.5%) | 278 (9.0%) |
| $2,500 to $2,999 | 72 (1.5%) | 15 (0.5%) |
| $3,000 or more | 26 (0.5%) | 0 (0.0%) |
| Total | 4,888 (100.0%) | 3,088 (100.0%) |
Physical Housing Characteristics in Park Forest
Housing Structures in Park Forest
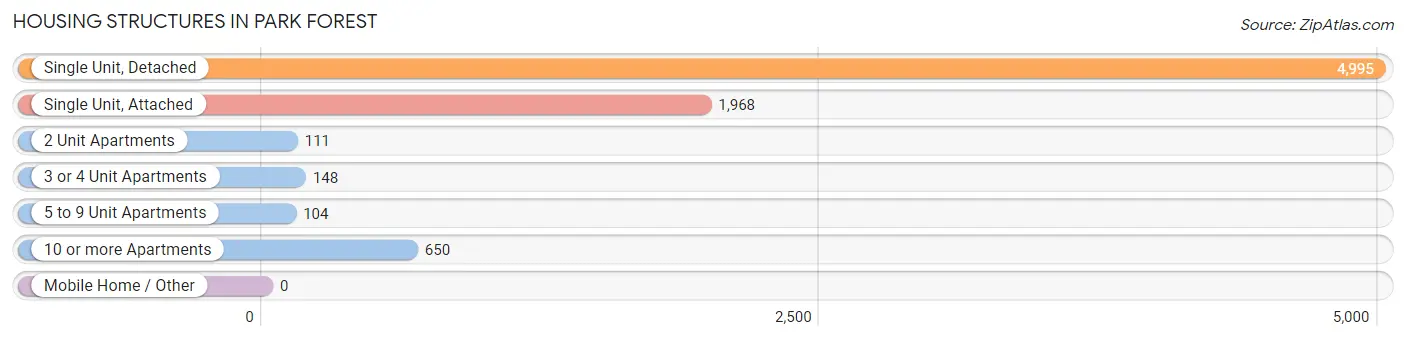
| Structure Type | # Housing Units | % Housing Units |
| Single Unit, Detached | 4,995 | 62.6% |
| Single Unit, Attached | 1,968 | 24.7% |
| 2 Unit Apartments | 111 | 1.4% |
| 3 or 4 Unit Apartments | 148 | 1.9% |
| 5 to 9 Unit Apartments | 104 | 1.3% |
| 10 or more Apartments | 650 | 8.2% |
| Mobile Home / Other | 0 | 0.0% |
| Total | 7,976 | 100.0% |
Housing Structures by Occupancy in Park Forest
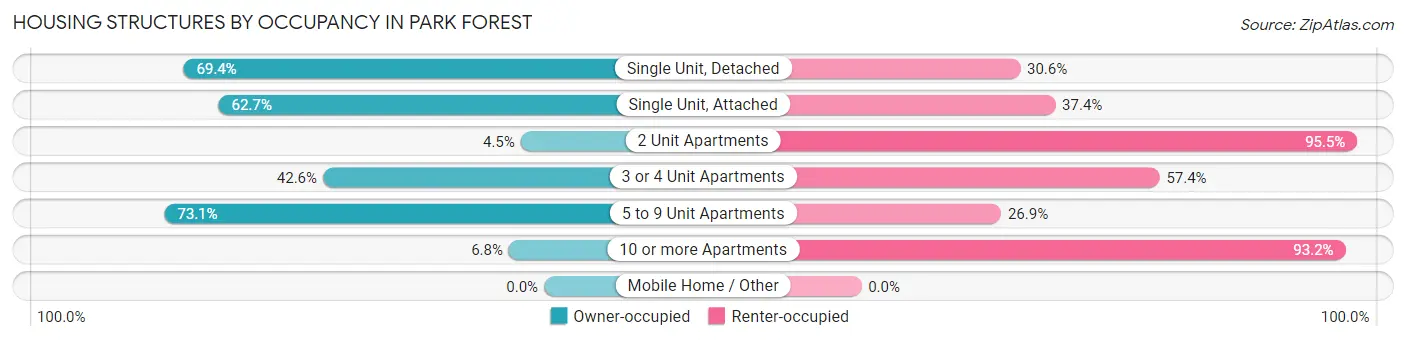
| Structure Type | Owner-occupied | Renter-occupied |
| Single Unit, Detached | 3,467 (69.4%) | 1,528 (30.6%) |
| Single Unit, Attached | 1,233 (62.6%) | 735 (37.3%) |
| 2 Unit Apartments | 5 (4.5%) | 106 (95.5%) |
| 3 or 4 Unit Apartments | 63 (42.6%) | 85 (57.4%) |
| 5 to 9 Unit Apartments | 76 (73.1%) | 28 (26.9%) |
| 10 or more Apartments | 44 (6.8%) | 606 (93.2%) |
| Mobile Home / Other | 0 (0.0%) | 0 (0.0%) |
| Total | 4,888 (61.3%) | 3,088 (38.7%) |
Housing Structures by Number of Rooms in Park Forest
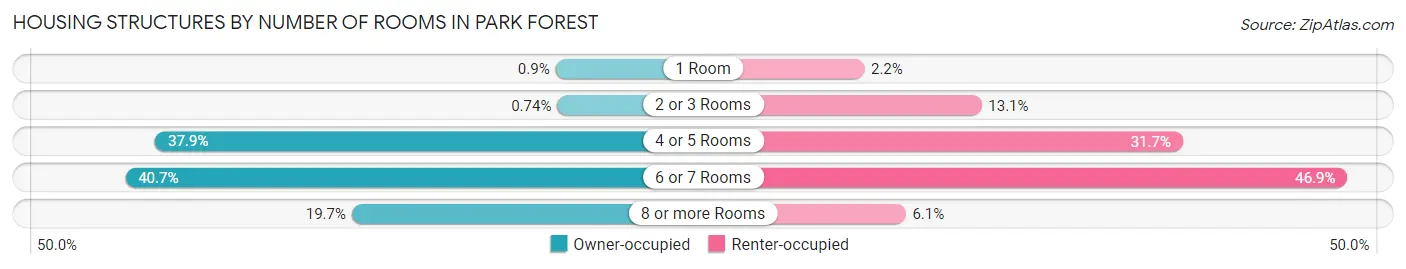
| Number of Rooms | Owner-occupied | Renter-occupied |
| 1 Room | 44 (0.9%) | 69 (2.2%) |
| 2 or 3 Rooms | 36 (0.7%) | 404 (13.1%) |
| 4 or 5 Rooms | 1,854 (37.9%) | 979 (31.7%) |
| 6 or 7 Rooms | 1,989 (40.7%) | 1,449 (46.9%) |
| 8 or more Rooms | 965 (19.7%) | 187 (6.1%) |
| Total | 4,888 (100.0%) | 3,088 (100.0%) |
Housing Structure by Heating Type in Park Forest
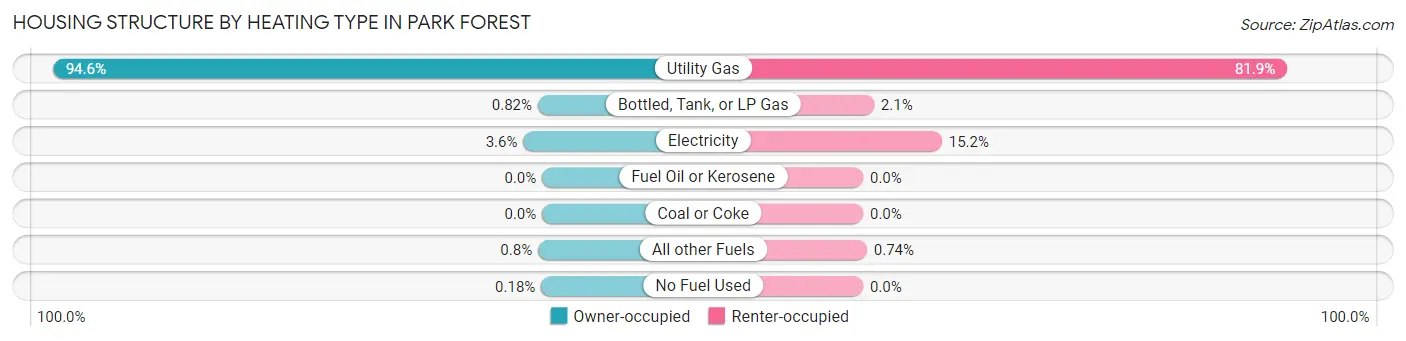
| Heating Type | Owner-occupied | Renter-occupied |
| Utility Gas | 4,622 (94.6%) | 2,530 (81.9%) |
| Bottled, Tank, or LP Gas | 40 (0.8%) | 65 (2.1%) |
| Electricity | 178 (3.6%) | 470 (15.2%) |
| Fuel Oil or Kerosene | 0 (0.0%) | 0 (0.0%) |
| Coal or Coke | 0 (0.0%) | 0 (0.0%) |
| All other Fuels | 39 (0.8%) | 23 (0.7%) |
| No Fuel Used | 9 (0.2%) | 0 (0.0%) |
| Total | 4,888 (100.0%) | 3,088 (100.0%) |
Household Vehicle Usage in Park Forest
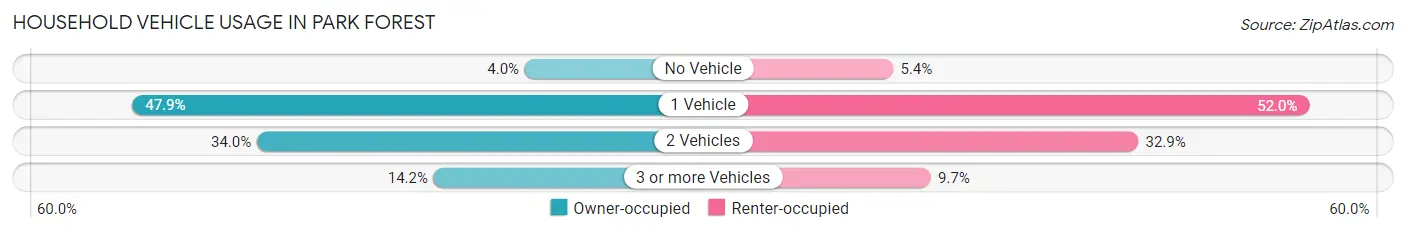
| Vehicles per Household | Owner-occupied | Renter-occupied |
| No Vehicle | 193 (4.0%) | 168 (5.4%) |
| 1 Vehicle | 2,343 (47.9%) | 1,606 (52.0%) |
| 2 Vehicles | 1,660 (34.0%) | 1,016 (32.9%) |
| 3 or more Vehicles | 692 (14.2%) | 298 (9.7%) |
| Total | 4,888 (100.0%) | 3,088 (100.0%) |
Real Estate & Mortgages in Park Forest
Real Estate and Mortgage Overview in Park Forest
| Characteristic | Without Mortgage | With Mortgage |
| Housing Units | 2,554 | 2,334 |
| Median Property Value | $68,900 | $111,400 |
| Median Household Income | $56,905 | $346 |
| Monthly Housing Costs | $530 | $26 |
| Real Estate Taxes | $3,067 | $243 |
Property Value by Mortgage Status in Park Forest
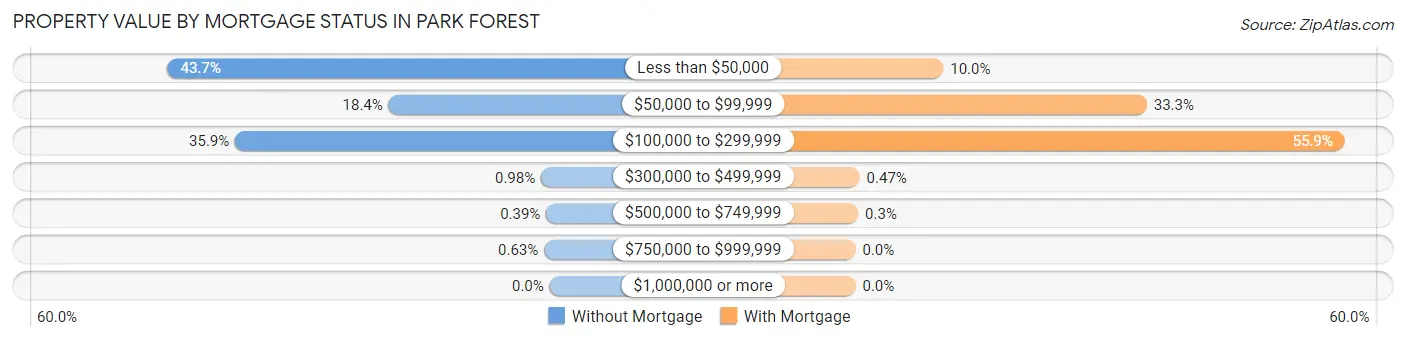
| Property Value | Without Mortgage | With Mortgage |
| Less than $50,000 | 1,115 (43.7%) | 234 (10.0%) |
| $50,000 to $99,999 | 470 (18.4%) | 777 (33.3%) |
| $100,000 to $299,999 | 918 (35.9%) | 1,305 (55.9%) |
| $300,000 to $499,999 | 25 (1.0%) | 11 (0.5%) |
| $500,000 to $749,999 | 10 (0.4%) | 7 (0.3%) |
| $750,000 to $999,999 | 16 (0.6%) | 0 (0.0%) |
| $1,000,000 or more | 0 (0.0%) | 0 (0.0%) |
| Total | 2,554 (100.0%) | 2,334 (100.0%) |
Household Income by Mortgage Status in Park Forest
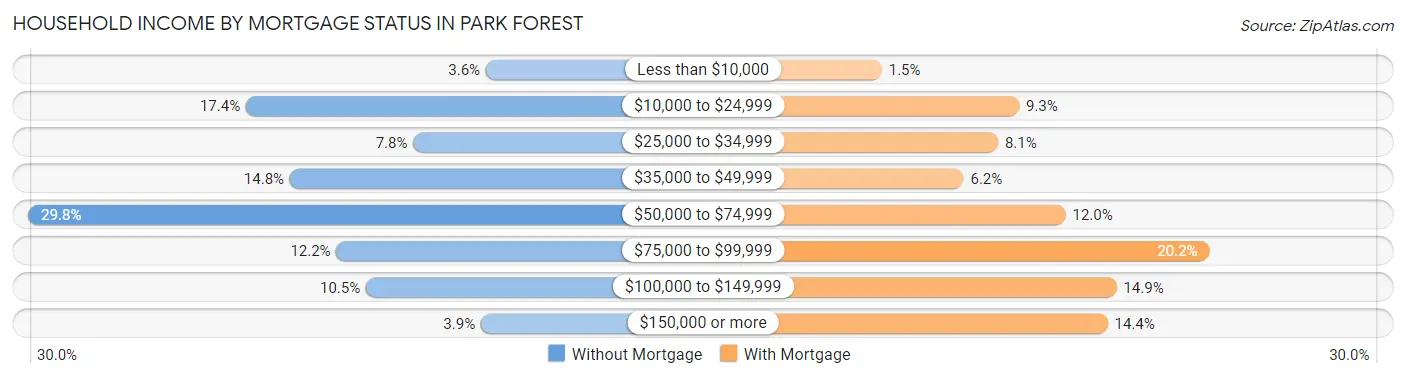
| Household Income | Without Mortgage | With Mortgage |
| Less than $10,000 | 93 (3.6%) | 35 (1.5%) |
| $10,000 to $24,999 | 443 (17.3%) | 218 (9.3%) |
| $25,000 to $34,999 | 199 (7.8%) | 190 (8.1%) |
| $35,000 to $49,999 | 379 (14.8%) | 144 (6.2%) |
| $50,000 to $74,999 | 761 (29.8%) | 280 (12.0%) |
| $75,000 to $99,999 | 311 (12.2%) | 472 (20.2%) |
| $100,000 to $149,999 | 268 (10.5%) | 348 (14.9%) |
| $150,000 or more | 100 (3.9%) | 336 (14.4%) |
| Total | 2,554 (100.0%) | 2,334 (100.0%) |
Property Value to Household Income Ratio in Park Forest
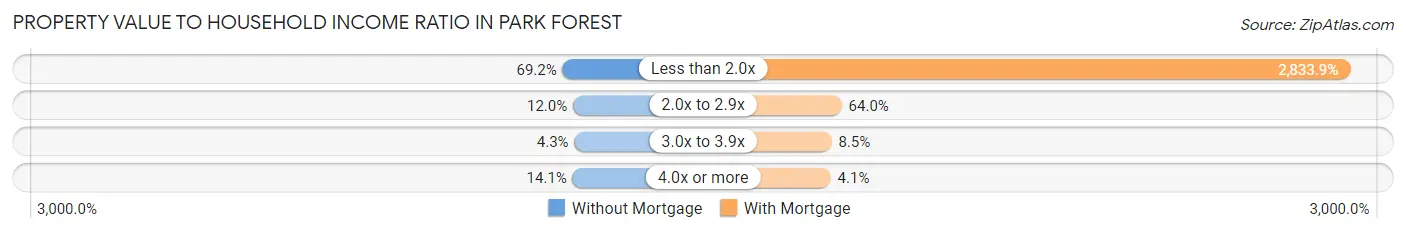
| Value-to-Income Ratio | Without Mortgage | With Mortgage |
| Less than 2.0x | 1,768 (69.2%) | 66,142 (2,833.8%) |
| 2.0x to 2.9x | 306 (12.0%) | 1,493 (64.0%) |
| 3.0x to 3.9x | 110 (4.3%) | 199 (8.5%) |
| 4.0x or more | 360 (14.1%) | 96 (4.1%) |
| Total | 2,554 (100.0%) | 2,334 (100.0%) |
Real Estate Taxes by Mortgage Status in Park Forest
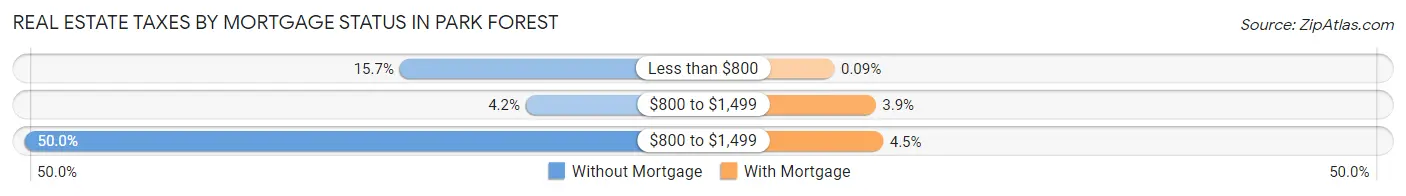
| Property Taxes | Without Mortgage | With Mortgage |
| Less than $800 | 402 (15.7%) | 2 (0.1%) |
| $800 to $1,499 | 108 (4.2%) | 90 (3.9%) |
| $800 to $1,499 | 1,277 (50.0%) | 106 (4.5%) |
| Total | 2,554 (100.0%) | 2,334 (100.0%) |
Health & Disability in Park Forest
Health Insurance Coverage by Age in Park Forest
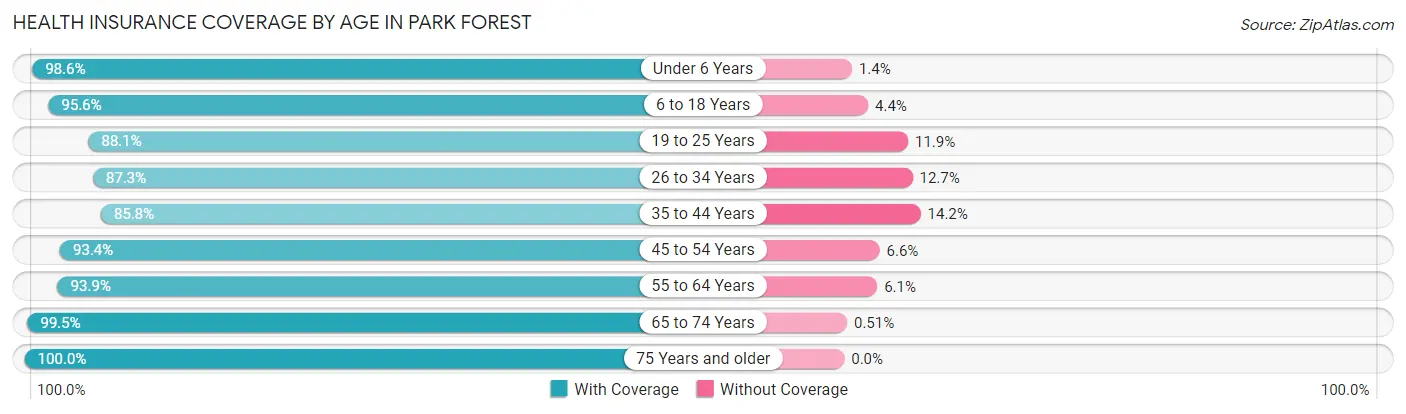
| Age Bracket | With Coverage | Without Coverage |
| Under 6 Years | 1,036 (98.6%) | 15 (1.4%) |
| 6 to 18 Years | 4,240 (95.6%) | 197 (4.4%) |
| 19 to 25 Years | 1,556 (88.1%) | 210 (11.9%) |
| 26 to 34 Years | 2,275 (87.3%) | 332 (12.7%) |
| 35 to 44 Years | 2,640 (85.8%) | 438 (14.2%) |
| 45 to 54 Years | 2,299 (93.4%) | 162 (6.6%) |
| 55 to 64 Years | 2,185 (93.9%) | 143 (6.1%) |
| 65 to 74 Years | 2,157 (99.5%) | 11 (0.5%) |
| 75 Years and older | 1,059 (100.0%) | 0 (0.0%) |
| Total | 19,447 (92.8%) | 1,508 (7.2%) |
Health Insurance Coverage by Citizenship Status in Park Forest
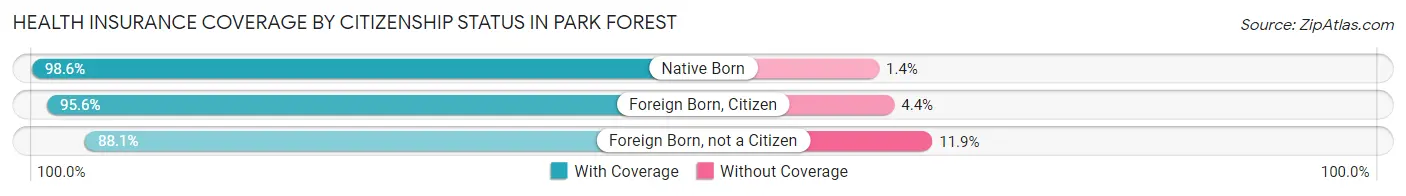
| Citizenship Status | With Coverage | Without Coverage |
| Native Born | 1,036 (98.6%) | 15 (1.4%) |
| Foreign Born, Citizen | 4,240 (95.6%) | 197 (4.4%) |
| Foreign Born, not a Citizen | 1,556 (88.1%) | 210 (11.9%) |
Health Insurance Coverage by Household Income in Park Forest
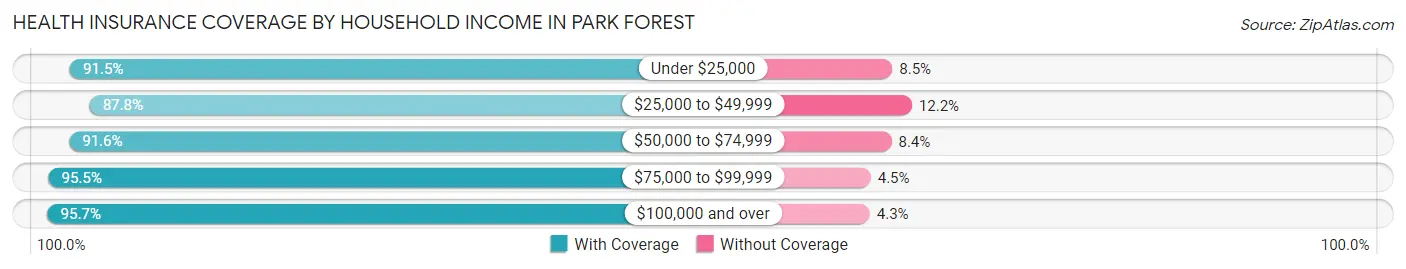
| Household Income | With Coverage | Without Coverage |
| Under $25,000 | 2,794 (91.5%) | 261 (8.5%) |
| $25,000 to $49,999 | 3,502 (87.8%) | 487 (12.2%) |
| $50,000 to $74,999 | 3,858 (91.6%) | 353 (8.4%) |
| $75,000 to $99,999 | 3,173 (95.5%) | 149 (4.5%) |
| $100,000 and over | 5,652 (95.7%) | 255 (4.3%) |
Public vs Private Health Insurance Coverage by Age in Park Forest
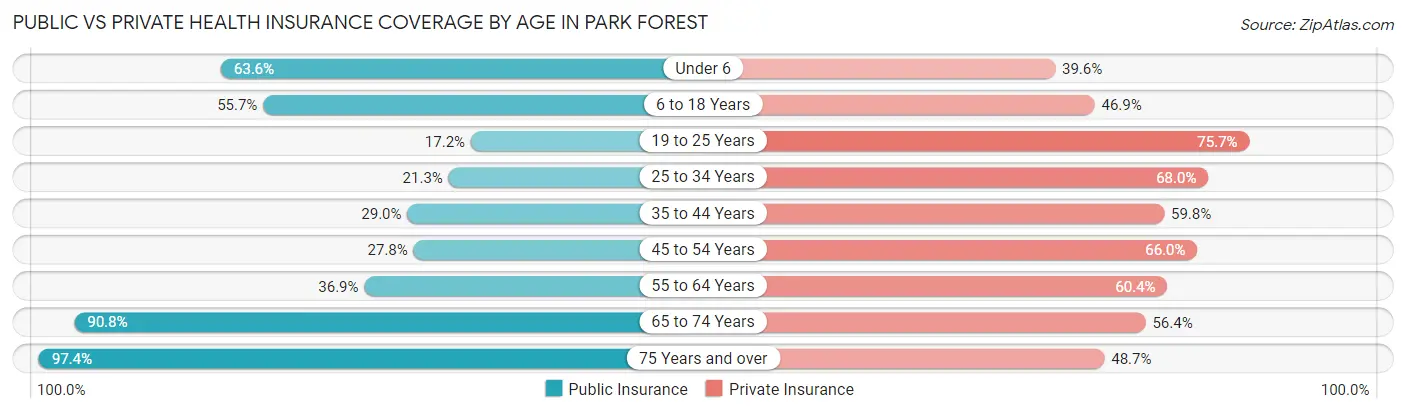
| Age Bracket | Public Insurance | Private Insurance |
| Under 6 | 668 (63.6%) | 416 (39.6%) |
| 6 to 18 Years | 2,472 (55.7%) | 2,082 (46.9%) |
| 19 to 25 Years | 303 (17.2%) | 1,336 (75.6%) |
| 25 to 34 Years | 555 (21.3%) | 1,773 (68.0%) |
| 35 to 44 Years | 891 (28.9%) | 1,841 (59.8%) |
| 45 to 54 Years | 684 (27.8%) | 1,624 (66.0%) |
| 55 to 64 Years | 860 (36.9%) | 1,407 (60.4%) |
| 65 to 74 Years | 1,968 (90.8%) | 1,222 (56.4%) |
| 75 Years and over | 1,031 (97.4%) | 516 (48.7%) |
| Total | 9,432 (45.0%) | 12,217 (58.3%) |
Disability Status by Sex by Age in Park Forest
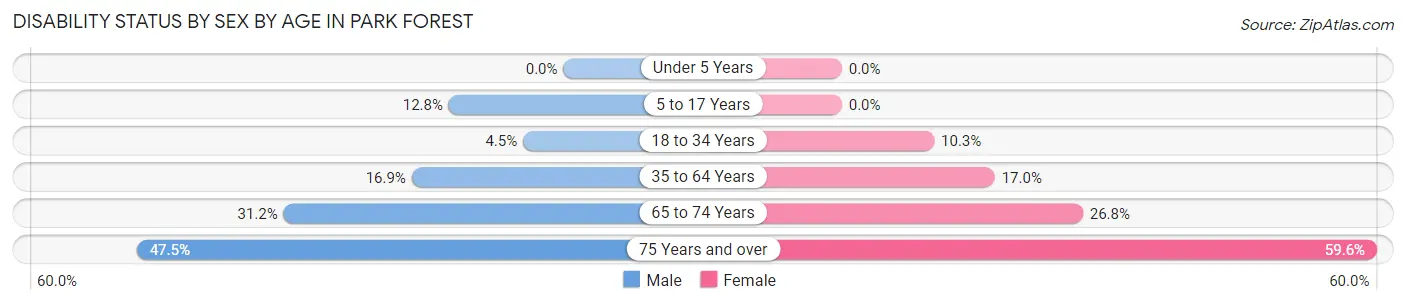
| Age Bracket | Male | Female |
| Under 5 Years | 0 (0.0%) | 0 (0.0%) |
| 5 to 17 Years | 314 (12.8%) | 0 (0.0%) |
| 18 to 34 Years | 95 (4.5%) | 249 (10.3%) |
| 35 to 64 Years | 590 (16.9%) | 745 (17.0%) |
| 65 to 74 Years | 196 (31.2%) | 413 (26.8%) |
| 75 Years and over | 181 (47.5%) | 404 (59.6%) |
Disability Class by Sex by Age in Park Forest
Disability Class: Hearing Difficulty
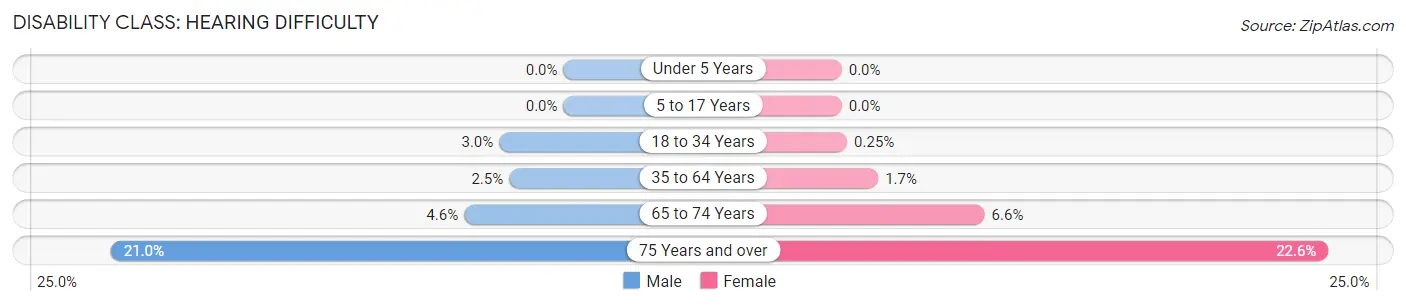
| Age Bracket | Male | Female |
| Under 5 Years | 0 (0.0%) | 0 (0.0%) |
| 5 to 17 Years | 0 (0.0%) | 0 (0.0%) |
| 18 to 34 Years | 63 (3.0%) | 6 (0.3%) |
| 35 to 64 Years | 88 (2.5%) | 74 (1.7%) |
| 65 to 74 Years | 29 (4.6%) | 102 (6.6%) |
| 75 Years and over | 80 (21.0%) | 153 (22.6%) |
Disability Class: Vision Difficulty
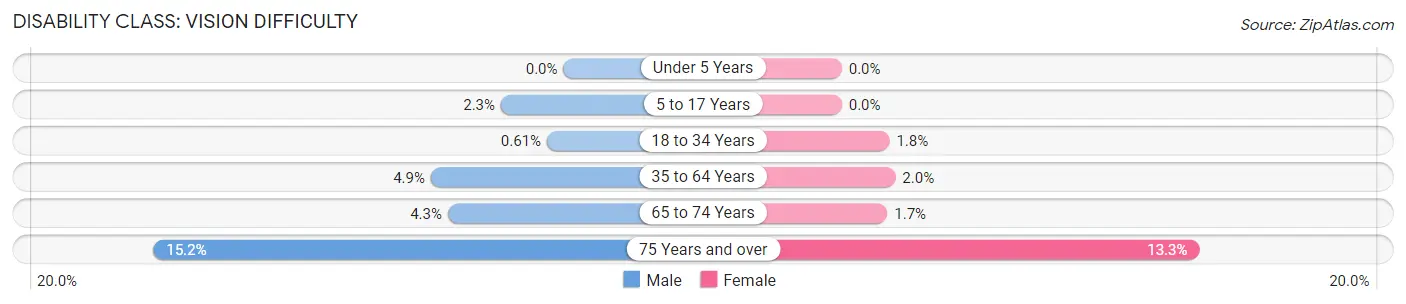
| Age Bracket | Male | Female |
| Under 5 Years | 0 (0.0%) | 0 (0.0%) |
| 5 to 17 Years | 57 (2.3%) | 0 (0.0%) |
| 18 to 34 Years | 13 (0.6%) | 43 (1.8%) |
| 35 to 64 Years | 172 (4.9%) | 87 (2.0%) |
| 65 to 74 Years | 27 (4.3%) | 26 (1.7%) |
| 75 Years and over | 58 (15.2%) | 90 (13.3%) |
Disability Class: Cognitive Difficulty
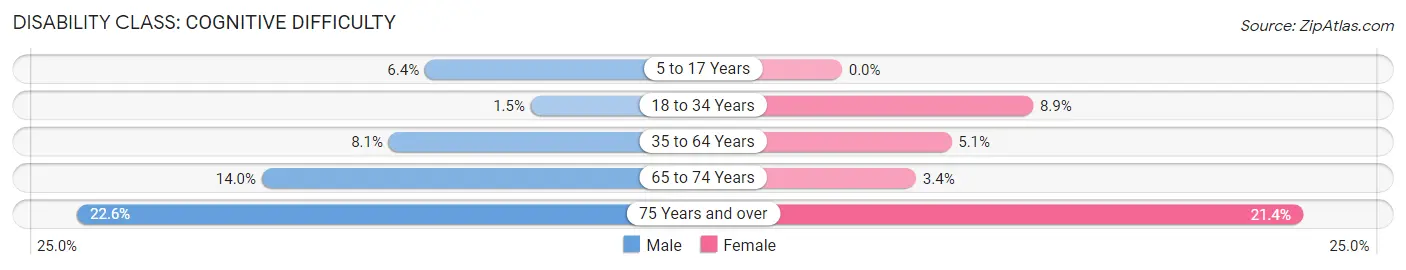
| Age Bracket | Male | Female |
| 5 to 17 Years | 158 (6.4%) | 0 (0.0%) |
| 18 to 34 Years | 32 (1.5%) | 215 (8.9%) |
| 35 to 64 Years | 283 (8.1%) | 222 (5.1%) |
| 65 to 74 Years | 88 (14.0%) | 53 (3.4%) |
| 75 Years and over | 86 (22.6%) | 145 (21.4%) |
Disability Class: Ambulatory Difficulty
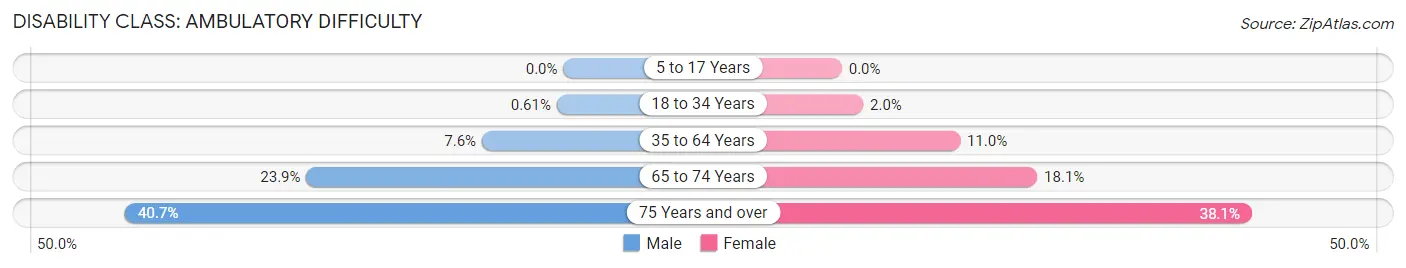
| Age Bracket | Male | Female |
| 5 to 17 Years | 0 (0.0%) | 0 (0.0%) |
| 18 to 34 Years | 13 (0.6%) | 48 (2.0%) |
| 35 to 64 Years | 264 (7.6%) | 480 (11.0%) |
| 65 to 74 Years | 150 (23.8%) | 279 (18.1%) |
| 75 Years and over | 155 (40.7%) | 258 (38.1%) |
Disability Class: Self-Care Difficulty
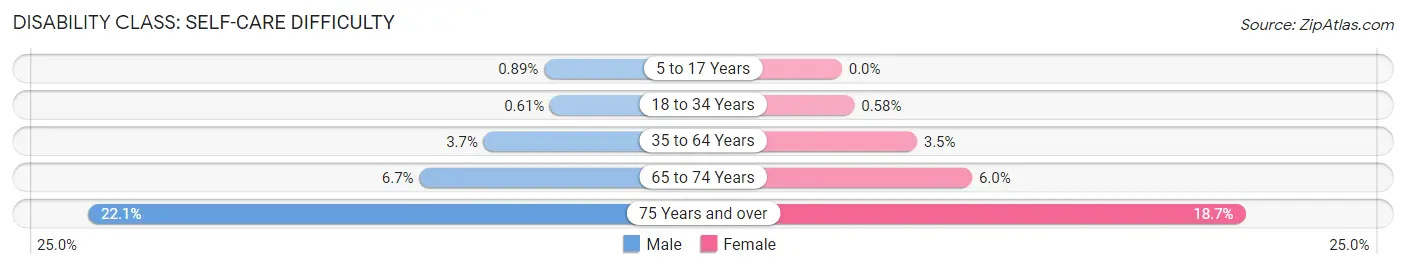
| Age Bracket | Male | Female |
| 5 to 17 Years | 22 (0.9%) | 0 (0.0%) |
| 18 to 34 Years | 13 (0.6%) | 14 (0.6%) |
| 35 to 64 Years | 129 (3.7%) | 152 (3.5%) |
| 65 to 74 Years | 42 (6.7%) | 93 (6.0%) |
| 75 Years and over | 84 (22.1%) | 127 (18.7%) |
Technology Access in Park Forest
Computing Device Access in Park Forest
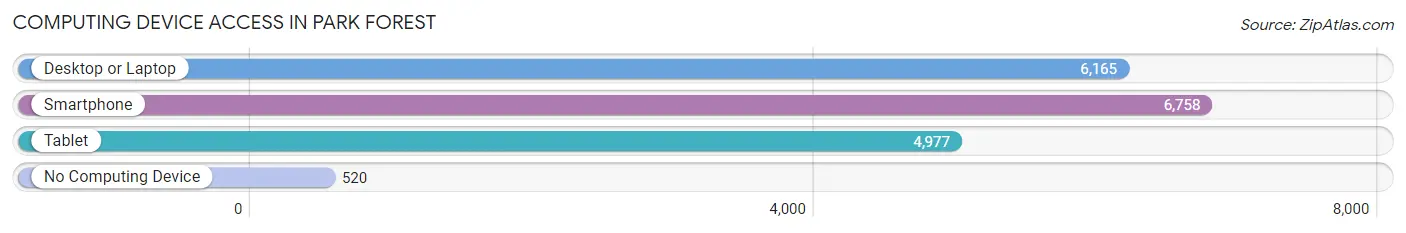
| Device Type | # Households | % Households |
| Desktop or Laptop | 6,165 | 77.3% |
| Smartphone | 6,758 | 84.7% |
| Tablet | 4,977 | 62.4% |
| No Computing Device | 520 | 6.5% |
| Total | 7,976 | 100.0% |
Internet Access in Park Forest
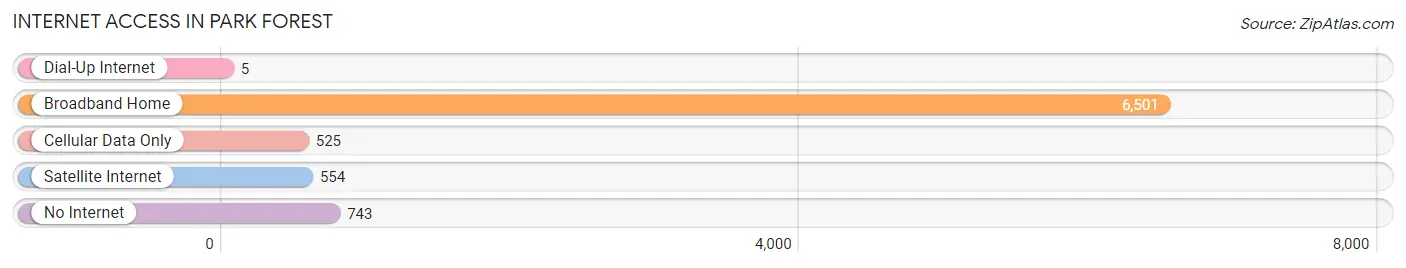
| Internet Type | # Households | % Households |
| Dial-Up Internet | 5 | 0.1% |
| Broadband Home | 6,501 | 81.5% |
| Cellular Data Only | 525 | 6.6% |
| Satellite Internet | 554 | 7.0% |
| No Internet | 743 | 9.3% |
| Total | 7,976 | 100.0% |
Park Forest Summary
History
Park Forest is a village located in Cook and Will counties in the state of Illinois. It is a suburb of Chicago and is located about 30 miles south of the city. The village was founded in 1948 and was the first planned community of its kind in the United States. It was designed to provide affordable housing for veterans returning from World War II. The village was designed to be a self-contained community with its own schools, shopping centers, parks, and other amenities.
The village was originally planned by the American Community Builders, a company founded by developer Philip M. Klutznick. The village was designed to be a model community, with a focus on providing affordable housing for veterans and their families. The village was designed to be a racially integrated community, with a mix of single-family homes, apartments, and townhouses.
The village was officially incorporated in 1949 and the first mayor was elected in 1950. The village has grown steadily since then, and today it is home to over 22,000 people.
Geography
Park Forest is located in Cook and Will counties in the state of Illinois. It is located about 30 miles south of Chicago and is part of the Chicago metropolitan area. The village is bordered by Matteson to the north, Richton Park to the east, University Park to the south, and Olympia Fields to the west.
The village covers an area of 8.3 square miles and has a population density of 2,717 people per square mile. The village is located in the Kankakee River watershed and is home to several small lakes and ponds.
Economy
Park Forest has a diverse economy, with a mix of retail, manufacturing, and service-based businesses. The village is home to several large employers, including the University of Chicago Medical Center, the University of Chicago Hospitals, and the University of Chicago Medical Center.
The village is also home to several small businesses, including restaurants, retail stores, and professional services. The village is also home to several industrial parks, which provide employment opportunities for local residents.
Demographics
As of the 2010 census, Park Forest had a population of 21,975. The racial makeup of the village was 57.3% White, 28.2% African American, 0.3% Native American, 2.2% Asian, 0.1% Pacific Islander, 8.2% from other races, and 3.9% from two or more races. Hispanic or Latino of any race were 16.7% of the population.
The median income for a household in the village was $50,945, and the median income for a family was $60,945. The per capita income for the village was $24,945. About 8.2% of families and 10.3% of the population were below the poverty line, including 14.2% of those under age 18 and 6.2% of those age 65 or over.
Park Forest is a diverse community, with a mix of races, ethnicities, and incomes. The village is home to a variety of businesses, from large employers to small businesses, and provides employment opportunities for local residents. The village is also home to several parks and recreational facilities, providing residents with a variety of activities and amenities.
Common Questions
What is Per Capita Income in Park Forest?
Per Capita income in Park Forest is $26,590.
What is the Median Family Income in Park Forest?
Median Family Income in Park Forest is $67,816.
What is the Median Household income in Park Forest?
Median Household Income in Park Forest is $58,907.
What is Income or Wage Gap in Park Forest?
Income or Wage Gap in Park Forest is 8.5%.
Women in Park Forest earn 91.5 cents for every dollar earned by a man.
What is Family Income Deficit in Park Forest?
Family Income Deficit in Park Forest is $10,970.
Families that are below poverty line in Park Forest earn $10,970 less on average than the poverty threshold level.
What is Inequality or Gini Index in Park Forest?
Inequality or Gini Index in Park Forest is 0.40.
What is the Total Population of Park Forest?
Total Population of Park Forest is 21,042.
What is the Total Male Population of Park Forest?
Total Male Population of Park Forest is 9,582.
What is the Total Female Population of Park Forest?
Total Female Population of Park Forest is 11,460.
What is the Ratio of Males per 100 Females in Park Forest?
There are 83.61 Males per 100 Females in Park Forest.
What is the Ratio of Females per 100 Males in Park Forest?
There are 119.60 Females per 100 Males in Park Forest.
What is the Median Population Age in Park Forest?
Median Population Age in Park Forest is 37.4 Years.
What is the Average Family Size in Park Forest
Average Family Size in Park Forest is 3.5 People.
What is the Average Household Size in Park Forest
Average Household Size in Park Forest is 2.6 People.
How Large is the Labor Force in Park Forest?
There are 10,372 People in the Labor Forcein in Park Forest.
What is the Percentage of People in the Labor Force in Park Forest?
62.9% of People are in the Labor Force in Park Forest.
What is the Unemployment Rate in Park Forest?
Unemployment Rate in Park Forest is 8.4%.