Murphysboro, IL Map & Demographics
Murphysboro Map
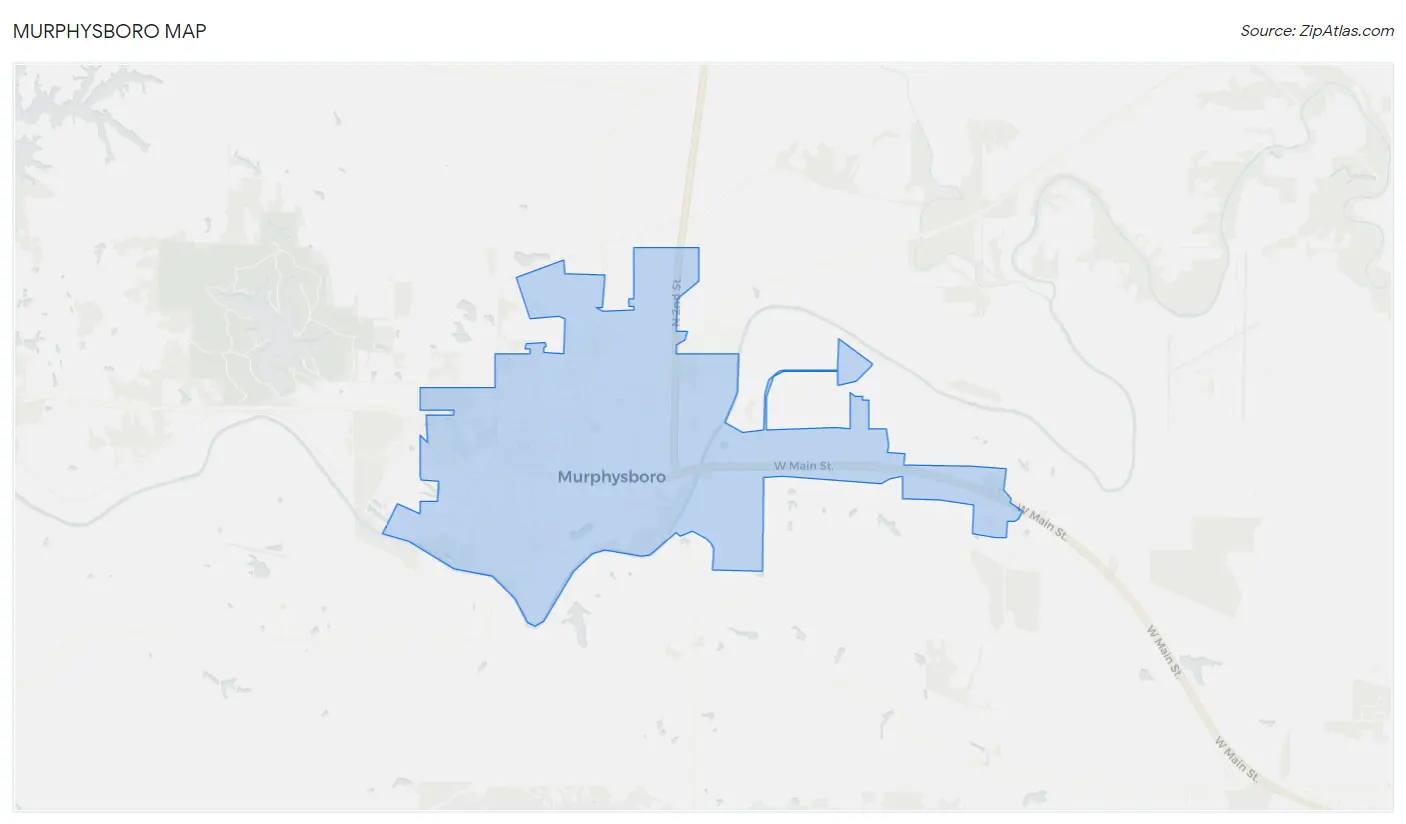
Murphysboro Overview
$26,571
PER CAPITA INCOME
$50,750
AVG FAMILY INCOME
$41,535
AVG HOUSEHOLD INCOME
17.1%
WAGE / INCOME GAP [ % ]
82.9¢/ $1
WAGE / INCOME GAP [ $ ]
0.40
INEQUALITY / GINI INDEX
7,101
TOTAL POPULATION
3,158
MALE POPULATION
3,943
FEMALE POPULATION
80.09
MALES / 100 FEMALES
124.86
FEMALES / 100 MALES
40.0
MEDIAN AGE
2.8
AVG FAMILY SIZE
2.0
AVG HOUSEHOLD SIZE
3,201
LABOR FORCE [ PEOPLE ]
57.2%
PERCENT IN LABOR FORCE
8.8%
UNEMPLOYMENT RATE
Murphysboro Zip Codes
Murphysboro Area Codes
Income in Murphysboro
Income Overview in Murphysboro
Per Capita Income in Murphysboro is $26,571, while median incomes of families and households are $50,750 and $41,535 respectively.
| Characteristic | Number | Measure |
| Per Capita Income | 7,101 | $26,571 |
| Median Family Income | 1,775 | $50,750 |
| Mean Family Income | 1,775 | $63,383 |
| Median Household Income | 3,466 | $41,535 |
| Mean Household Income | 3,466 | $53,409 |
| Income Deficit | 1,775 | $0 |
| Wage / Income Gap (%) | 7,101 | 17.10% |
| Wage / Income Gap ($) | 7,101 | 82.90¢ per $1 |
| Gini / Inequality Index | 7,101 | 0.40 |
Earnings by Sex in Murphysboro
Average Earnings in Murphysboro are $30,048, $35,417 for men and $29,362 for women, a difference of 17.1%.
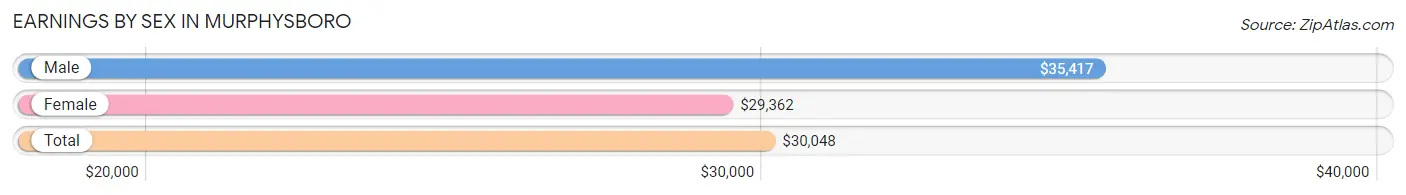
| Sex | Number | Average Earnings |
| Male | 1,650 (49.3%) | $35,417 |
| Female | 1,698 (50.7%) | $29,362 |
| Total | 3,348 (100.0%) | $30,048 |
Earnings by Sex by Income Bracket in Murphysboro
The most common earnings brackets in Murphysboro are $100,000+ for men (206 | 12.5%) and $30,000 to $34,999 for women (217 | 12.8%).
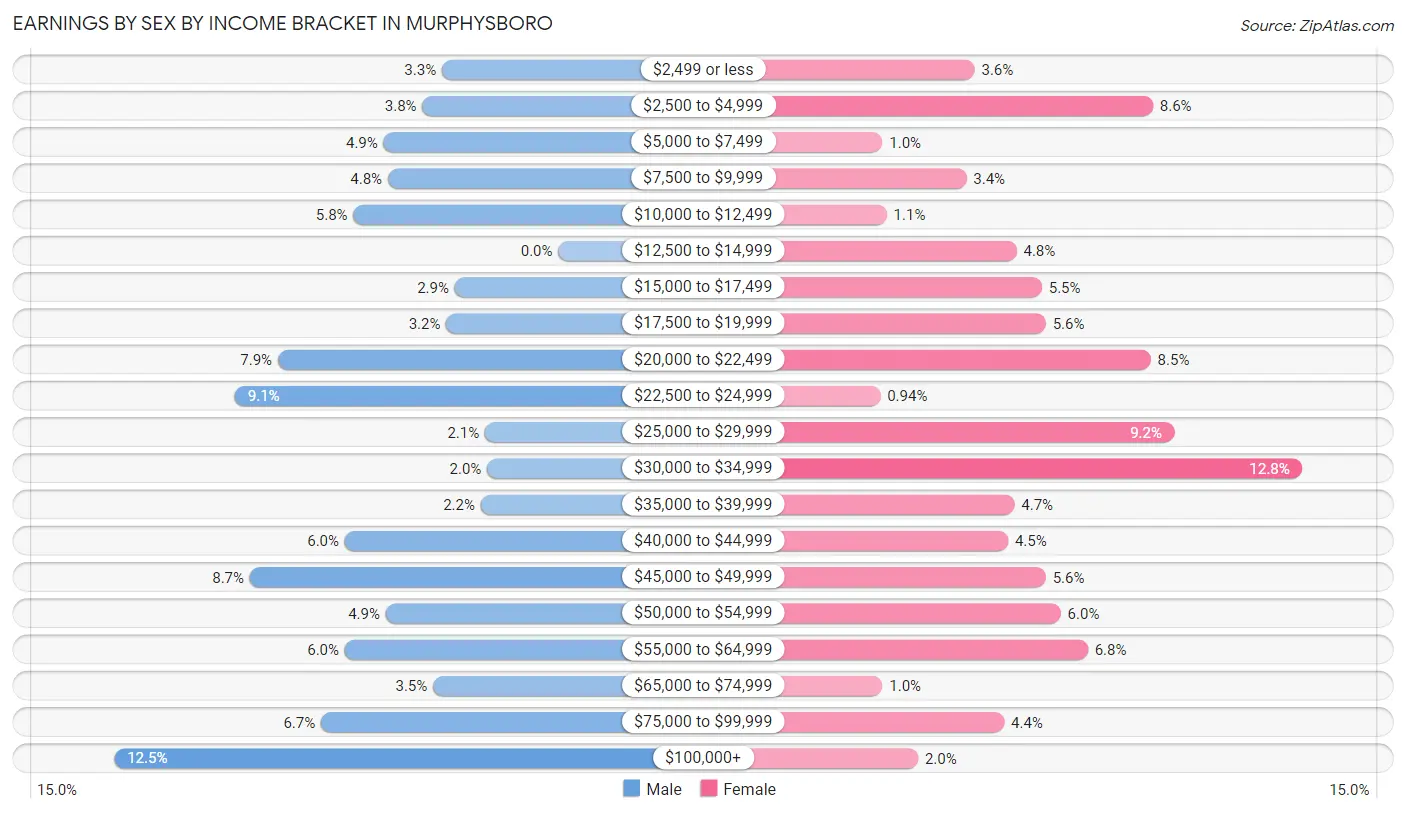
| Income | Male | Female |
| $2,499 or less | 54 (3.3%) | 61 (3.6%) |
| $2,500 to $4,999 | 63 (3.8%) | 146 (8.6%) |
| $5,000 to $7,499 | 81 (4.9%) | 17 (1.0%) |
| $7,500 to $9,999 | 79 (4.8%) | 57 (3.4%) |
| $10,000 to $12,499 | 95 (5.8%) | 19 (1.1%) |
| $12,500 to $14,999 | 0 (0.0%) | 81 (4.8%) |
| $15,000 to $17,499 | 48 (2.9%) | 93 (5.5%) |
| $17,500 to $19,999 | 52 (3.2%) | 95 (5.6%) |
| $20,000 to $22,499 | 130 (7.9%) | 145 (8.5%) |
| $22,500 to $24,999 | 150 (9.1%) | 16 (0.9%) |
| $25,000 to $29,999 | 34 (2.1%) | 156 (9.2%) |
| $30,000 to $34,999 | 33 (2.0%) | 217 (12.8%) |
| $35,000 to $39,999 | 36 (2.2%) | 80 (4.7%) |
| $40,000 to $44,999 | 99 (6.0%) | 77 (4.5%) |
| $45,000 to $49,999 | 143 (8.7%) | 95 (5.6%) |
| $50,000 to $54,999 | 80 (4.9%) | 102 (6.0%) |
| $55,000 to $64,999 | 99 (6.0%) | 115 (6.8%) |
| $65,000 to $74,999 | 58 (3.5%) | 17 (1.0%) |
| $75,000 to $99,999 | 110 (6.7%) | 75 (4.4%) |
| $100,000+ | 206 (12.5%) | 34 (2.0%) |
| Total | 1,650 (100.0%) | 1,698 (100.0%) |
Earnings by Sex by Educational Attainment in Murphysboro
Average earnings in Murphysboro are $40,556 for men and $31,131 for women, a difference of 23.2%. Men with an educational attainment of bachelor's degree enjoy the highest average annual earnings of $50,441, while those with college or associate's degree education earn the least with $40,147. Women with an educational attainment of graduate degree earn the most with the average annual earnings of $53,393, while those with high school diploma education have the smallest earnings of $19,435.
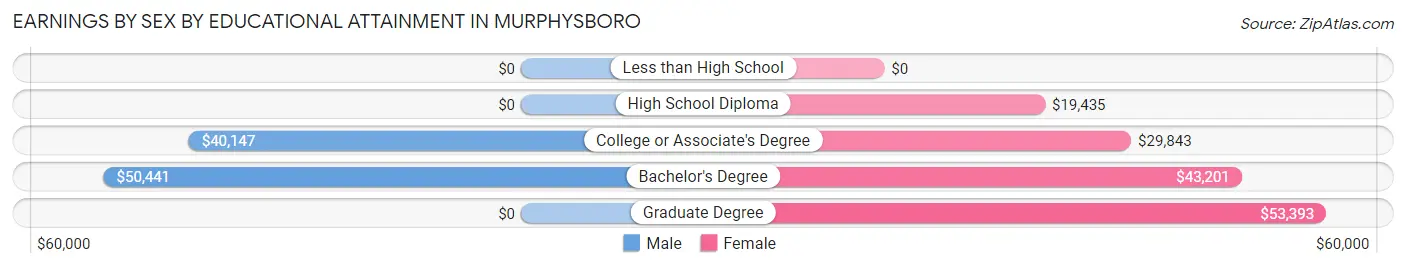
| Educational Attainment | Male Income | Female Income |
| Less than High School | - | - |
| High School Diploma | - | - |
| College or Associate's Degree | $40,147 | $29,843 |
| Bachelor's Degree | $50,441 | $43,201 |
| Graduate Degree | - | - |
| Total | $40,556 | $31,131 |
Family Income in Murphysboro
Family Income Brackets in Murphysboro
According to the Murphysboro family income data, there are 346 families falling into the $50,000 to $74,999 income range, which is the most common income bracket and makes up 19.5% of all families. Conversely, the $150,000 to $199,999 income bracket is the least frequent group with only 34 families (1.9%) belonging to this category.
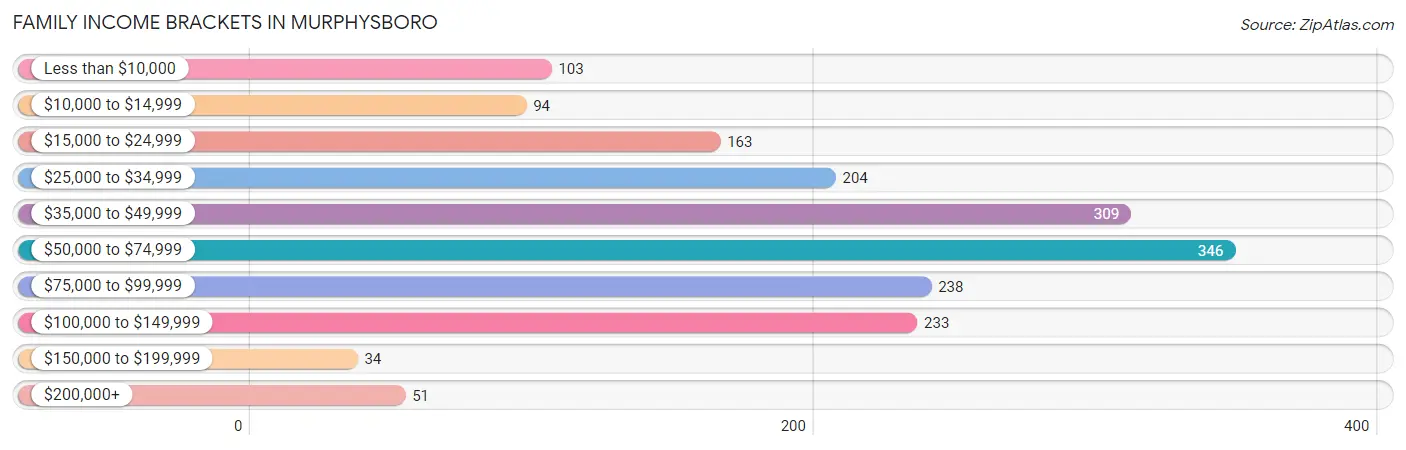
| Income Bracket | # Families | % Families |
| Less than $10,000 | 103 | 5.8% |
| $10,000 to $14,999 | 94 | 5.3% |
| $15,000 to $24,999 | 163 | 9.2% |
| $25,000 to $34,999 | 204 | 11.5% |
| $35,000 to $49,999 | 309 | 17.4% |
| $50,000 to $74,999 | 346 | 19.5% |
| $75,000 to $99,999 | 238 | 13.4% |
| $100,000 to $149,999 | 233 | 13.1% |
| $150,000 to $199,999 | 34 | 1.9% |
| $200,000+ | 51 | 2.9% |
Family Income by Famaliy Size in Murphysboro
5-person families (84 | 4.7%) account for the highest median family income in Murphysboro with $79,907 per family, while 2-person families (1,058 | 59.6%) have the highest median income of $25,028 per family member.
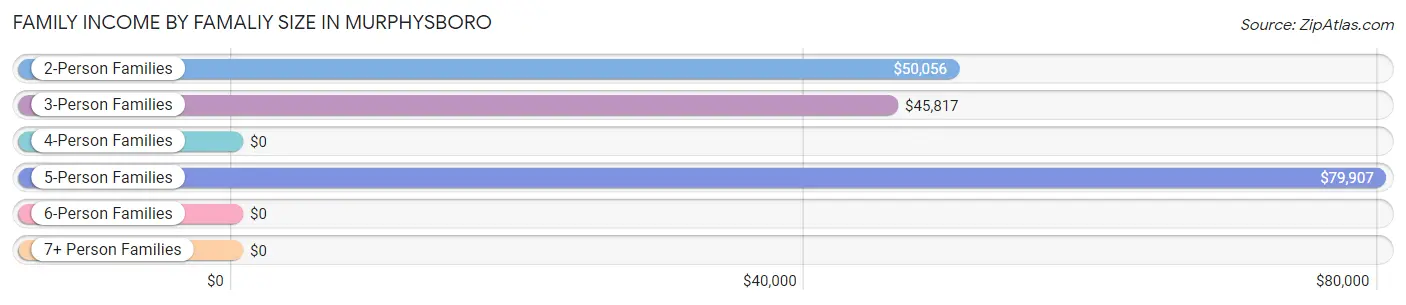
| Income Bracket | # Families | Median Income |
| 2-Person Families | 1,058 (59.6%) | $50,056 |
| 3-Person Families | 389 (21.9%) | $45,817 |
| 4-Person Families | 211 (11.9%) | $0 |
| 5-Person Families | 84 (4.7%) | $79,907 |
| 6-Person Families | 33 (1.9%) | $0 |
| 7+ Person Families | 0 (0.0%) | $0 |
| Total | 1,775 (100.0%) | $50,750 |
Family Income by Number of Earners in Murphysboro
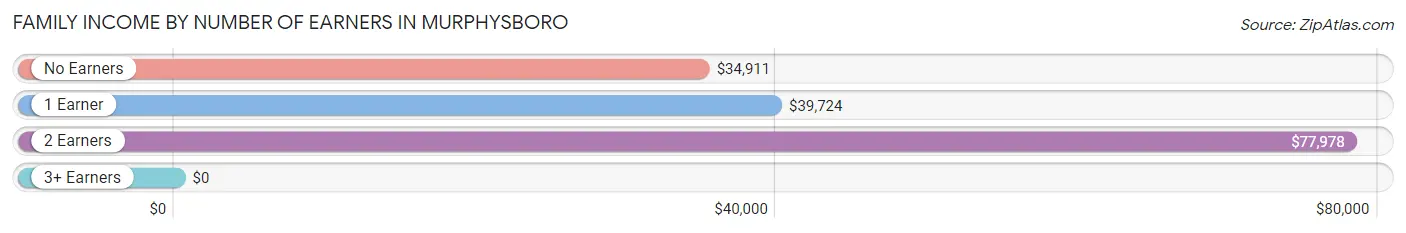
| Number of Earners | # Families | Median Income |
| No Earners | 297 (16.7%) | $34,911 |
| 1 Earner | 823 (46.4%) | $39,724 |
| 2 Earners | 631 (35.5%) | $77,978 |
| 3+ Earners | 24 (1.3%) | $0 |
| Total | 1,775 (100.0%) | $50,750 |
Household Income in Murphysboro
Household Income Brackets in Murphysboro
With 752 households falling in the category, the $50,000 to $74,999 income range is the most frequent in Murphysboro, accounting for 21.7% of all households. In contrast, only 59 households (1.7%) fall into the $200,000+ income bracket, making it the least populous group.
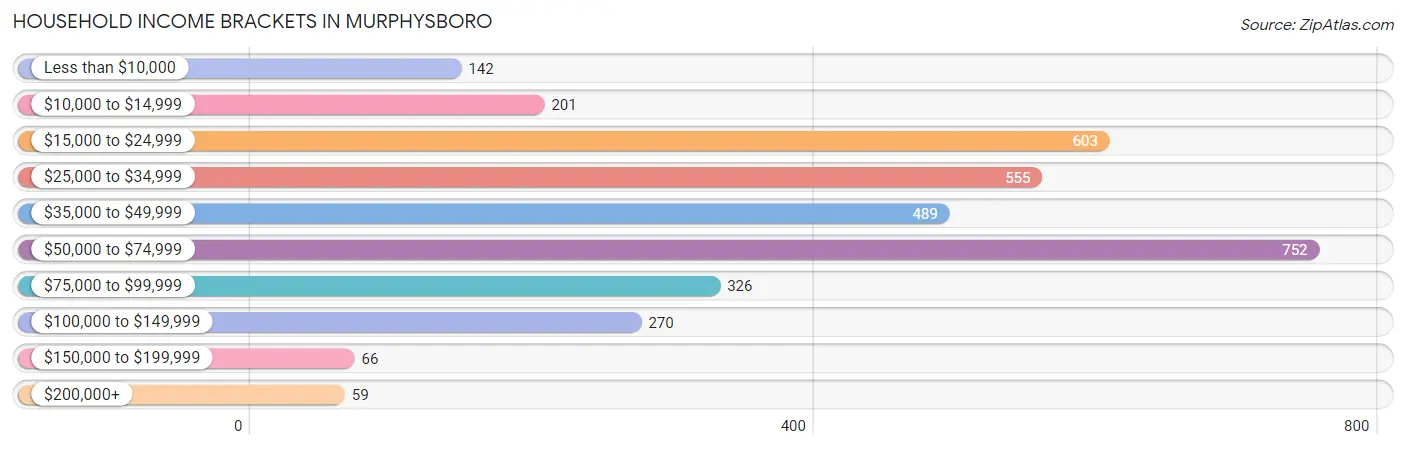
| Income Bracket | # Households | % Households |
| Less than $10,000 | 142 | 4.1% |
| $10,000 to $14,999 | 201 | 5.8% |
| $15,000 to $24,999 | 603 | 17.4% |
| $25,000 to $34,999 | 555 | 16.0% |
| $35,000 to $49,999 | 489 | 14.1% |
| $50,000 to $74,999 | 752 | 21.7% |
| $75,000 to $99,999 | 326 | 9.4% |
| $100,000 to $149,999 | 270 | 7.8% |
| $150,000 to $199,999 | 66 | 1.9% |
| $200,000+ | 59 | 1.7% |
Household Income by Householder Age in Murphysboro
The median household income in Murphysboro is $41,535, with the highest median household income of $45,781 found in the 25 to 44 years age bracket for the primary householder. A total of 1,242 households (35.8%) fall into this category. Meanwhile, the 15 to 24 years age bracket for the primary householder has the lowest median household income of $33,328, with 151 households (4.4%) in this group.
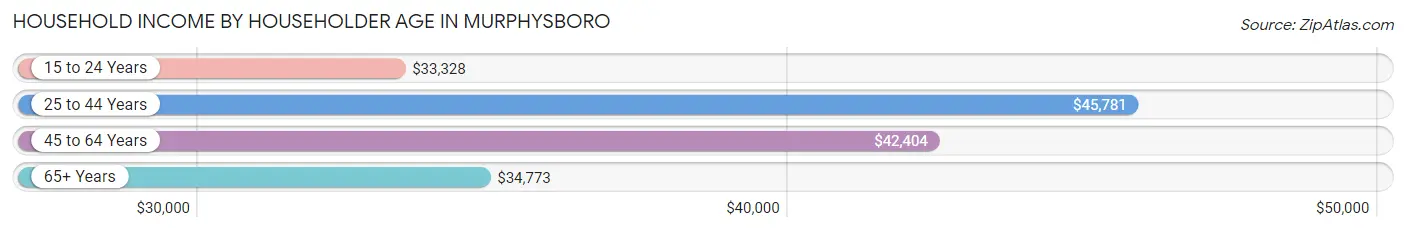
| Income Bracket | # Households | Median Income |
| 15 to 24 Years | 151 (4.4%) | $33,328 |
| 25 to 44 Years | 1,242 (35.8%) | $45,781 |
| 45 to 64 Years | 873 (25.2%) | $42,404 |
| 65+ Years | 1,200 (34.6%) | $34,773 |
| Total | 3,466 (100.0%) | $41,535 |
Poverty in Murphysboro
Income Below Poverty by Sex and Age in Murphysboro
With 16.0% poverty level for males and 19.1% for females among the residents of Murphysboro, 5 year old males and under 5 year old females are the most vulnerable to poverty, with 67 males (85.9%) and 214 females (65.2%) in their respective age groups living below the poverty level.
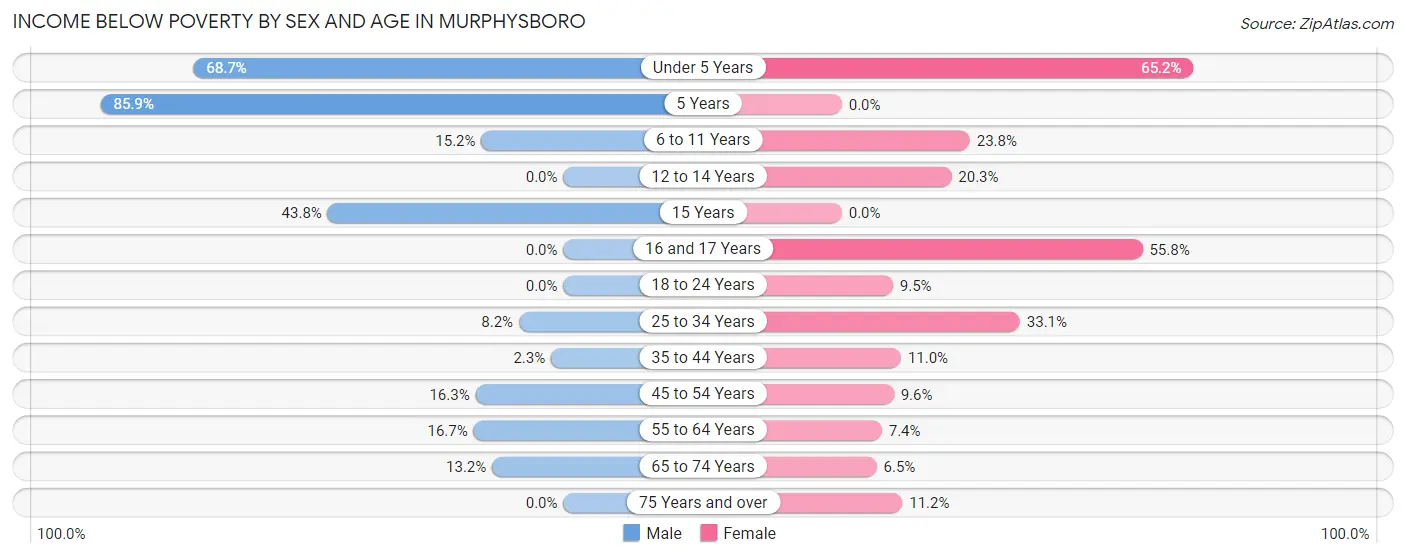
| Age Bracket | Male | Female |
| Under 5 Years | 138 (68.7%) | 214 (65.2%) |
| 5 Years | 67 (85.9%) | 0 (0.0%) |
| 6 to 11 Years | 35 (15.2%) | 67 (23.8%) |
| 12 to 14 Years | 0 (0.0%) | 48 (20.3%) |
| 15 Years | 21 (43.8%) | 0 (0.0%) |
| 16 and 17 Years | 0 (0.0%) | 24 (55.8%) |
| 18 to 24 Years | 0 (0.0%) | 34 (9.5%) |
| 25 to 34 Years | 28 (8.2%) | 155 (33.1%) |
| 35 to 44 Years | 11 (2.3%) | 58 (11.0%) |
| 45 to 54 Years | 54 (16.3%) | 29 (9.6%) |
| 55 to 64 Years | 76 (16.7%) | 25 (7.4%) |
| 65 to 74 Years | 53 (13.2%) | 29 (6.5%) |
| 75 Years and over | 0 (0.0%) | 64 (11.2%) |
| Total | 483 (16.0%) | 747 (19.1%) |
Income Above Poverty by Sex and Age in Murphysboro
According to the poverty statistics in Murphysboro, males aged 12 to 14 years and females aged 15 years are the age groups that are most secure financially, with 100.0% of males and 100.0% of females in these age groups living above the poverty line.
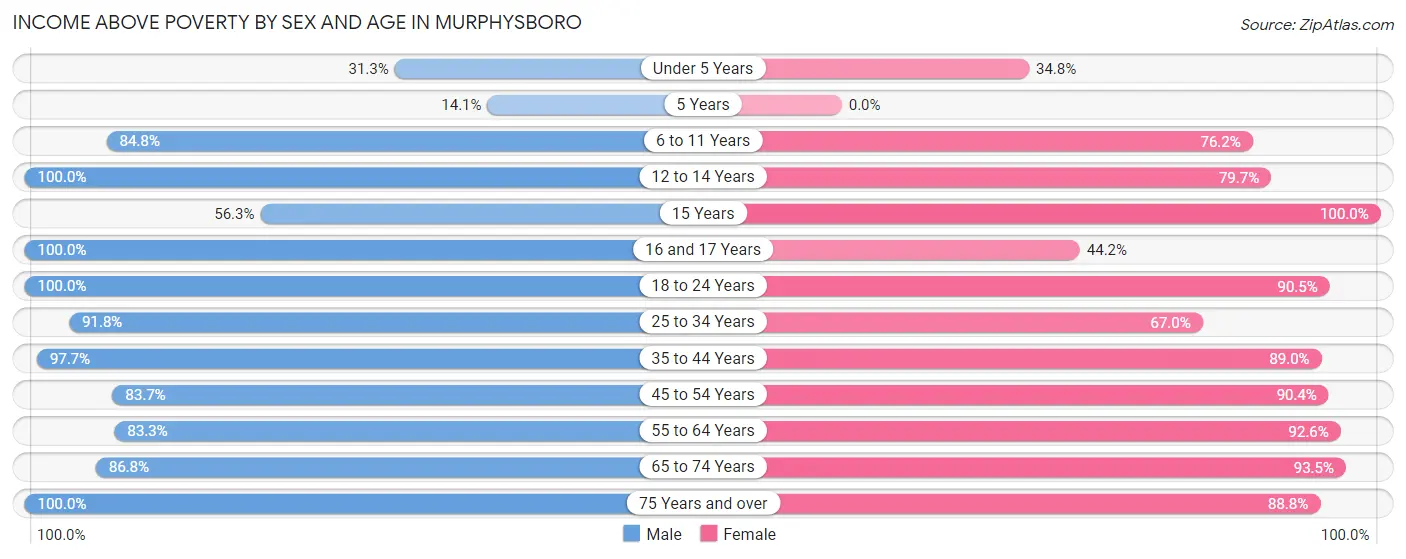
| Age Bracket | Male | Female |
| Under 5 Years | 63 (31.3%) | 114 (34.8%) |
| 5 Years | 11 (14.1%) | 0 (0.0%) |
| 6 to 11 Years | 195 (84.8%) | 215 (76.2%) |
| 12 to 14 Years | 75 (100.0%) | 188 (79.7%) |
| 15 Years | 27 (56.2%) | 15 (100.0%) |
| 16 and 17 Years | 77 (100.0%) | 19 (44.2%) |
| 18 to 24 Years | 122 (100.0%) | 325 (90.5%) |
| 25 to 34 Years | 312 (91.8%) | 314 (66.9%) |
| 35 to 44 Years | 471 (97.7%) | 470 (89.0%) |
| 45 to 54 Years | 277 (83.7%) | 272 (90.4%) |
| 55 to 64 Years | 380 (83.3%) | 312 (92.6%) |
| 65 to 74 Years | 348 (86.8%) | 420 (93.5%) |
| 75 Years and over | 186 (100.0%) | 506 (88.8%) |
| Total | 2,544 (84.0%) | 3,170 (80.9%) |
Income Below Poverty Among Married-Couple Families in Murphysboro
The poverty statistics for married-couple families in Murphysboro show that 4.9% or 44 of the total 908 families live below the poverty line. Families with 1 or 2 children have the highest poverty rate of 8.8%, comprising of 18 families. On the other hand, families with 3 or 4 children have the lowest poverty rate of 0.0%, which includes 0 families.
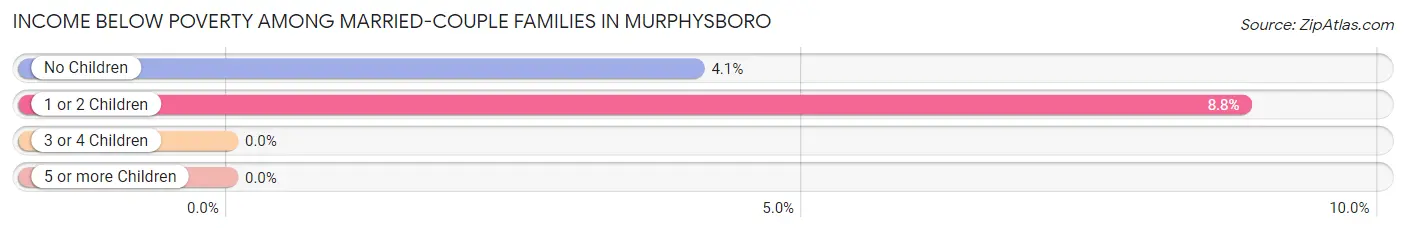
| Children | Above Poverty | Below Poverty |
| No Children | 614 (95.9%) | 26 (4.1%) |
| 1 or 2 Children | 186 (91.2%) | 18 (8.8%) |
| 3 or 4 Children | 64 (100.0%) | 0 (0.0%) |
| 5 or more Children | 0 (0.0%) | 0 (0.0%) |
| Total | 864 (95.2%) | 44 (4.9%) |
Income Below Poverty Among Single-Parent Households in Murphysboro
According to the poverty data in Murphysboro, 15.2% or 30 single-father households and 38.5% or 258 single-mother households are living below the poverty line. Among single-father households, those with 1 or 2 children have the highest poverty rate, with 11 households (45.8%) experiencing poverty. Likewise, among single-mother households, those with 3 or 4 children have the highest poverty rate, with 74 households (71.8%) falling below the poverty line.
| Children | Single Father | Single Mother |
| No Children | 19 (11.0%) | 0 (0.0%) |
| 1 or 2 Children | 11 (45.8%) | 184 (46.2%) |
| 3 or 4 Children | 0 (0.0%) | 74 (71.8%) |
| 5 or more Children | 0 (0.0%) | 0 (0.0%) |
| Total | 30 (15.2%) | 258 (38.5%) |
Income Below Poverty Among Married-Couple vs Single-Parent Households in Murphysboro
The poverty data for Murphysboro shows that 44 of the married-couple family households (4.9%) and 288 of the single-parent households (33.2%) are living below the poverty level. Within the married-couple family households, those with 1 or 2 children have the highest poverty rate, with 18 households (8.8%) falling below the poverty line. Among the single-parent households, those with 3 or 4 children have the highest poverty rate, with 74 household (71.8%) living below poverty.
| Children | Married-Couple Families | Single-Parent Households |
| No Children | 26 (4.1%) | 19 (5.6%) |
| 1 or 2 Children | 18 (8.8%) | 195 (46.2%) |
| 3 or 4 Children | 0 (0.0%) | 74 (71.8%) |
| 5 or more Children | 0 (0.0%) | 0 (0.0%) |
| Total | 44 (4.9%) | 288 (33.2%) |
Race in Murphysboro
The most populous races in Murphysboro are White / Caucasian (5,070 | 71.4%), Black / African American (1,059 | 14.9%), and Hispanic or Latino (624 | 8.8%).
| Race | # Population | % Population |
| Asian | 24 | 0.3% |
| Black / African American | 1,059 | 14.9% |
| Hawaiian / Pacific | 0 | 0.0% |
| Hispanic or Latino | 624 | 8.8% |
| Native / Alaskan | 0 | 0.0% |
| White / Caucasian | 5,070 | 71.4% |
| Two or more Races | 374 | 5.3% |
| Some other Race | 574 | 8.1% |
| Total | 7,101 | 100.0% |
Ancestry in Murphysboro
The most populous ancestries reported in Murphysboro are German (1,658 | 23.4%), Irish (959 | 13.5%), English (815 | 11.5%), American (378 | 5.3%), and Central American (317 | 4.5%), together accounting for 58.1% of all Murphysboro residents.
| Ancestry | # Population | % Population |
| American | 378 | 5.3% |
| Apache | 7 | 0.1% |
| Bermudan | 5 | 0.1% |
| British | 10 | 0.1% |
| Bulgarian | 129 | 1.8% |
| Burmese | 24 | 0.3% |
| Central American | 317 | 4.5% |
| Cherokee | 37 | 0.5% |
| Croatian | 11 | 0.2% |
| Czechoslovakian | 35 | 0.5% |
| Dutch | 143 | 2.0% |
| English | 815 | 11.5% |
| Ethiopian | 55 | 0.8% |
| European | 165 | 2.3% |
| French | 275 | 3.9% |
| French Canadian | 7 | 0.1% |
| German | 1,658 | 23.4% |
| Greek | 13 | 0.2% |
| Guatemalan | 109 | 1.5% |
| Haitian | 13 | 0.2% |
| Irish | 959 | 13.5% |
| Italian | 265 | 3.7% |
| Jamaican | 32 | 0.4% |
| Mexican | 282 | 4.0% |
| Native Hawaiian | 1 | 0.0% |
| Northern European | 5 | 0.1% |
| Norwegian | 76 | 1.1% |
| Polish | 21 | 0.3% |
| Salvadoran | 208 | 2.9% |
| Scandinavian | 10 | 0.1% |
| Scotch-Irish | 237 | 3.3% |
| Scottish | 265 | 3.7% |
| Spaniard | 25 | 0.4% |
| Subsaharan African | 55 | 0.8% |
| Swedish | 31 | 0.4% |
| Swiss | 22 | 0.3% |
| Welsh | 66 | 0.9% | View All 37 Rows |
Immigrants in Murphysboro
The most numerous immigrant groups reported in Murphysboro came from Central America (224 | 3.2%), Latin America (224 | 3.2%), El Salvador (109 | 1.5%), Mexico (78 | 1.1%), and Bulgaria (52 | 0.7%), together accounting for 9.7% of all Murphysboro residents.
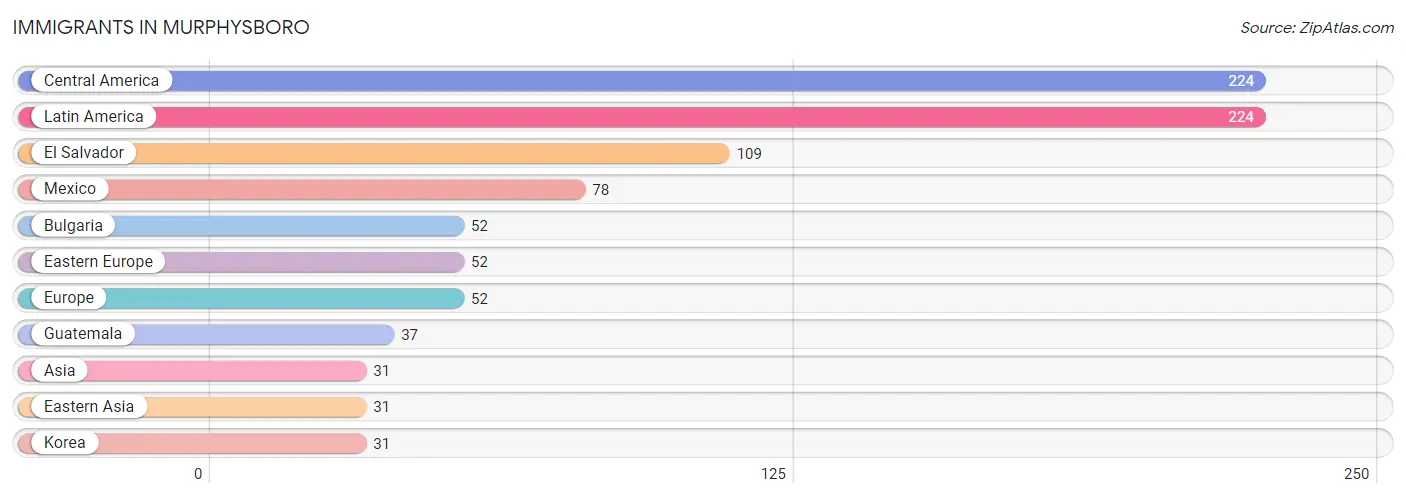
| Immigration Origin | # Population | % Population |
| Asia | 31 | 0.4% |
| Bulgaria | 52 | 0.7% |
| Central America | 224 | 3.2% |
| Eastern Asia | 31 | 0.4% |
| Eastern Europe | 52 | 0.7% |
| El Salvador | 109 | 1.5% |
| Europe | 52 | 0.7% |
| Guatemala | 37 | 0.5% |
| Korea | 31 | 0.4% |
| Latin America | 224 | 3.2% |
| Mexico | 78 | 1.1% | View All 11 Rows |
Sex and Age in Murphysboro
Sex and Age in Murphysboro
The most populous age groups in Murphysboro are 35 to 39 Years (297 | 9.4%) for men and Under 5 Years (328 | 8.3%) for women.
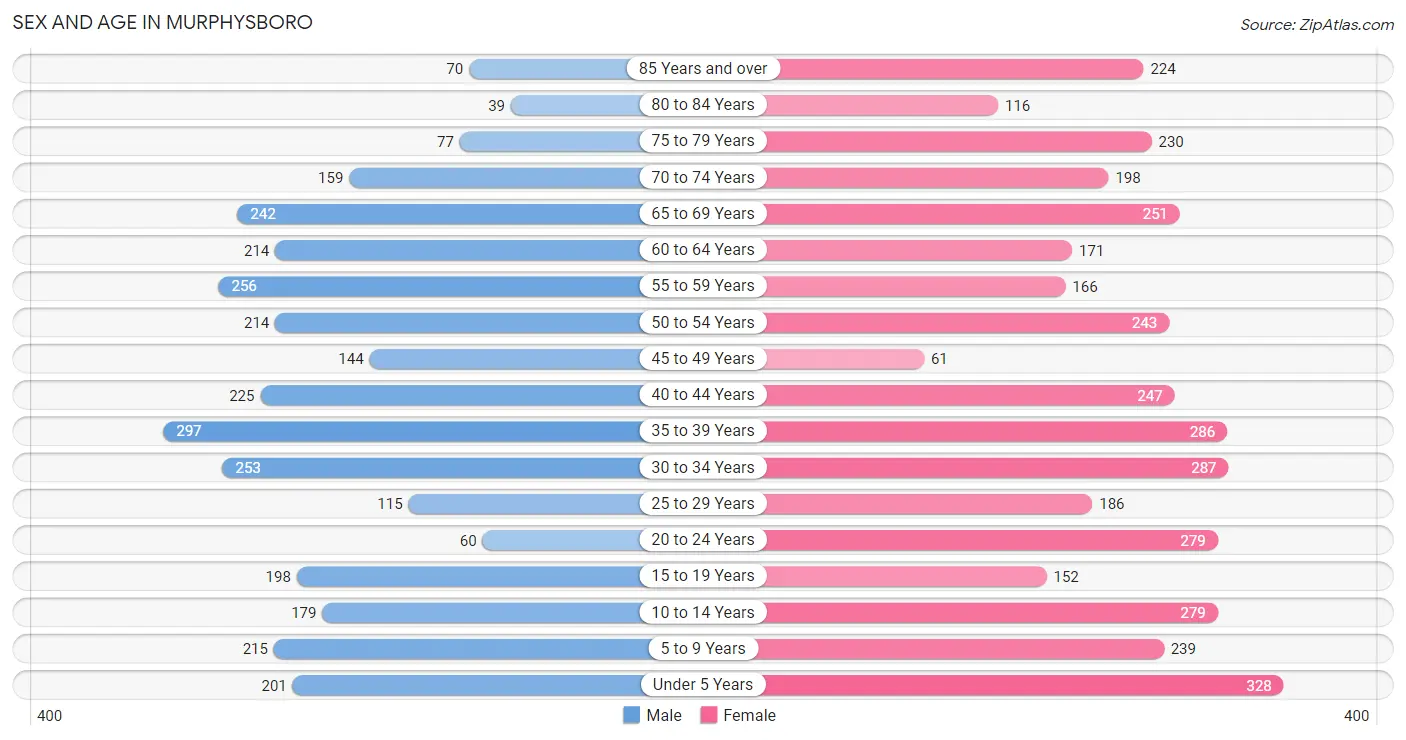
| Age Bracket | Male | Female |
| Under 5 Years | 201 (6.4%) | 328 (8.3%) |
| 5 to 9 Years | 215 (6.8%) | 239 (6.1%) |
| 10 to 14 Years | 179 (5.7%) | 279 (7.1%) |
| 15 to 19 Years | 198 (6.3%) | 152 (3.8%) |
| 20 to 24 Years | 60 (1.9%) | 279 (7.1%) |
| 25 to 29 Years | 115 (3.6%) | 186 (4.7%) |
| 30 to 34 Years | 253 (8.0%) | 287 (7.3%) |
| 35 to 39 Years | 297 (9.4%) | 286 (7.2%) |
| 40 to 44 Years | 225 (7.1%) | 247 (6.3%) |
| 45 to 49 Years | 144 (4.6%) | 61 (1.5%) |
| 50 to 54 Years | 214 (6.8%) | 243 (6.2%) |
| 55 to 59 Years | 256 (8.1%) | 166 (4.2%) |
| 60 to 64 Years | 214 (6.8%) | 171 (4.3%) |
| 65 to 69 Years | 242 (7.7%) | 251 (6.4%) |
| 70 to 74 Years | 159 (5.0%) | 198 (5.0%) |
| 75 to 79 Years | 77 (2.4%) | 230 (5.8%) |
| 80 to 84 Years | 39 (1.2%) | 116 (2.9%) |
| 85 Years and over | 70 (2.2%) | 224 (5.7%) |
| Total | 3,158 (100.0%) | 3,943 (100.0%) |
Families and Households in Murphysboro
Median Family Size in Murphysboro
The median family size in Murphysboro is 2.81 persons per family, with married-couple families (908 | 51.1%) accounting for the largest median family size of 3.02 persons per family. On the other hand, single male/father families (197 | 11.1%) represent the smallest median family size with 2.23 persons per family.
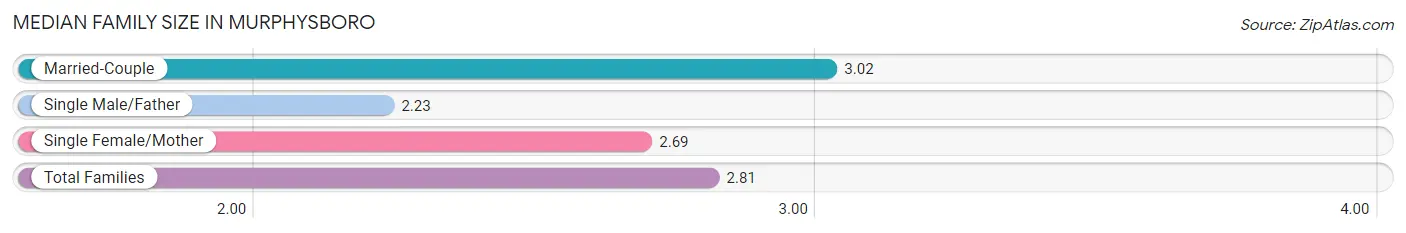
| Family Type | # Families | Family Size |
| Married-Couple | 908 (51.1%) | 3.02 |
| Single Male/Father | 197 (11.1%) | 2.23 |
| Single Female/Mother | 670 (37.8%) | 2.69 |
| Total Families | 1,775 (100.0%) | 2.81 |
Median Household Size in Murphysboro
The median household size in Murphysboro is 1.99 persons per household, with married-couple households (908 | 26.2%) accounting for the largest median household size of 3.02 persons per household. non-family households (1,691 | 48.8%) represent the smallest median household size with 1.07 persons per household.
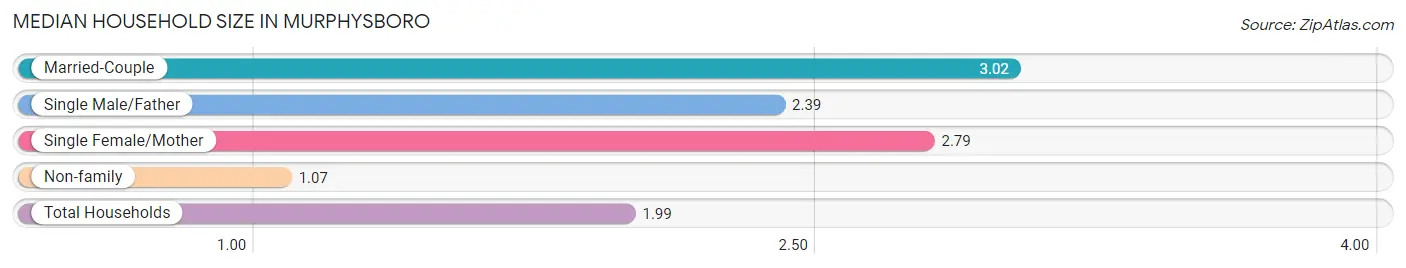
| Household Type | # Households | Household Size |
| Married-Couple | 908 (26.2%) | 3.02 |
| Single Male/Father | 197 (5.7%) | 2.39 |
| Single Female/Mother | 670 (19.3%) | 2.79 |
| Non-family | 1,691 (48.8%) | 1.07 |
| Total Households | 3,466 (100.0%) | 1.99 |
Household Size by Marriage Status in Murphysboro
Out of a total of 3,466 households in Murphysboro, 1,775 (51.2%) are family households, while 1,691 (48.8%) are nonfamily households. The most numerous type of family households are 2-person households, comprising 1,040, and the most common type of nonfamily households are 1-person households, comprising 1,598.
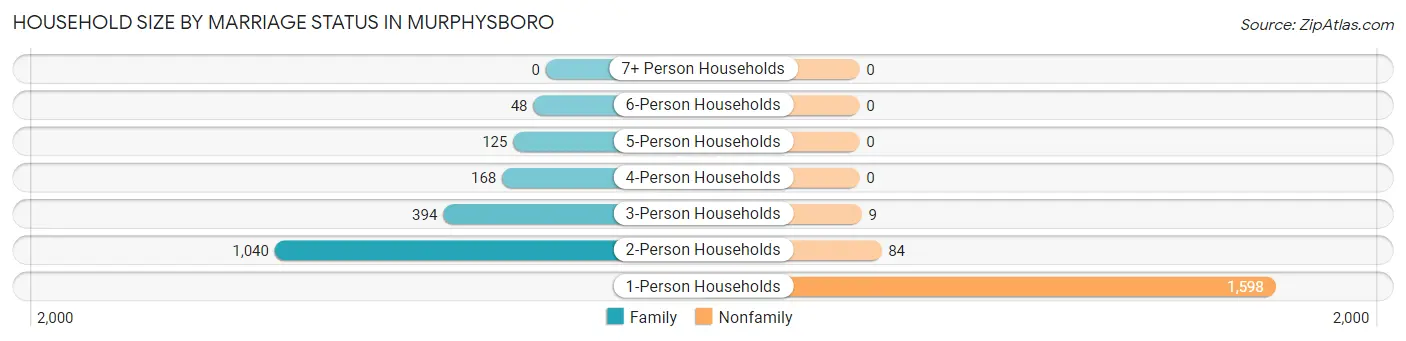
| Household Size | Family Households | Nonfamily Households |
| 1-Person Households | - | 1,598 (46.1%) |
| 2-Person Households | 1,040 (30.0%) | 84 (2.4%) |
| 3-Person Households | 394 (11.4%) | 9 (0.3%) |
| 4-Person Households | 168 (4.9%) | 0 (0.0%) |
| 5-Person Households | 125 (3.6%) | 0 (0.0%) |
| 6-Person Households | 48 (1.4%) | 0 (0.0%) |
| 7+ Person Households | 0 (0.0%) | 0 (0.0%) |
| Total | 1,775 (51.2%) | 1,691 (48.8%) |
Female Fertility in Murphysboro
Fertility by Age in Murphysboro
Average fertility rate in Murphysboro is 54.0 births per 1,000 women. Women in the age bracket of 20 to 34 years have the highest fertility rate with 108.0 births per 1,000 women. Women in the age bracket of 20 to 34 years acount for 100.0% of all women with births.
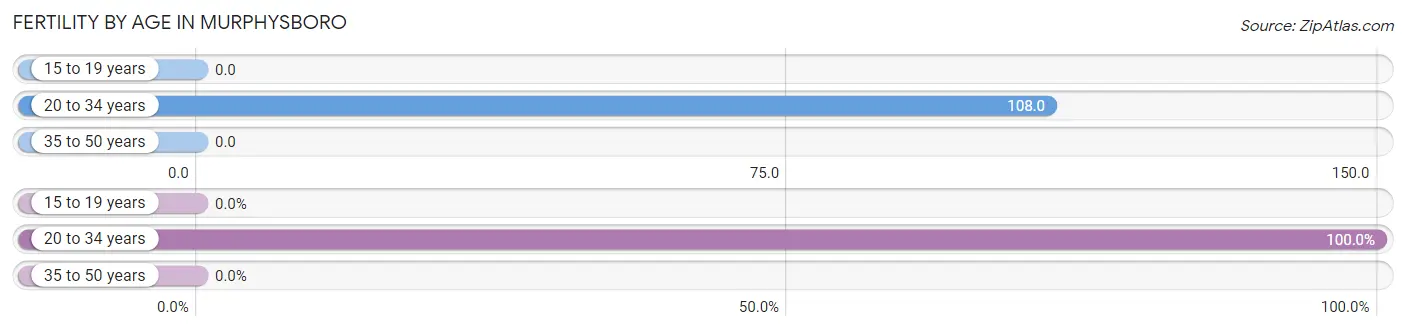
| Age Bracket | Women with Births | Births / 1,000 Women |
| 15 to 19 years | 0 (0.0%) | 0.0 |
| 20 to 34 years | 81 (100.0%) | 108.0 |
| 35 to 50 years | 0 (0.0%) | 0.0 |
| Total | 81 (100.0%) | 54.0 |
Fertility by Age by Marriage Status in Murphysboro
18.5% of women with births (81) in Murphysboro are married. The highest percentage of unmarried women with births falls into 20 to 34 years age bracket with 81.5% of them unmarried at the time of birth, while the lowest percentage of unmarried women with births belong to 20 to 34 years age bracket with 81.5% of them unmarried.
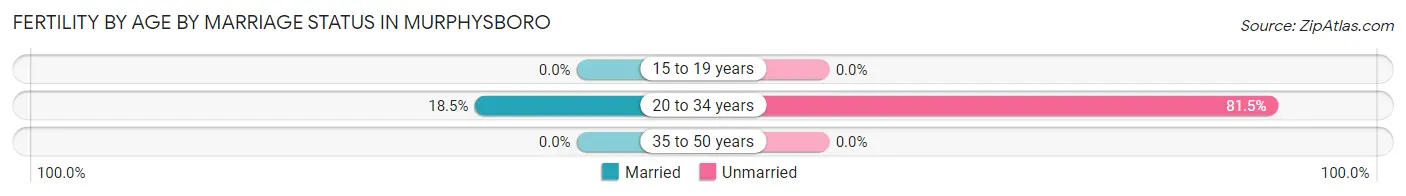
| Age Bracket | Married | Unmarried |
| 15 to 19 years | 0 (0.0%) | 0 (0.0%) |
| 20 to 34 years | 15 (18.5%) | 66 (81.5%) |
| 35 to 50 years | 0 (0.0%) | 0 (0.0%) |
| Total | 15 (18.5%) | 66 (81.5%) |
Fertility by Education in Murphysboro
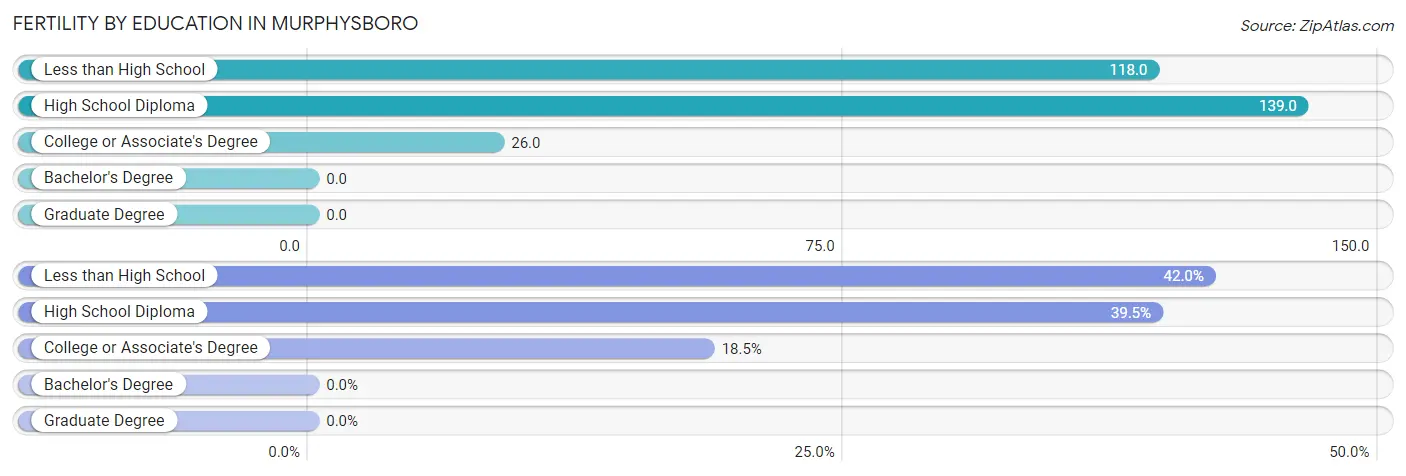
| Educational Attainment | Women with Births | Births / 1,000 Women |
| Less than High School | 34 (42.0%) | 118.0 |
| High School Diploma | 32 (39.5%) | 139.0 |
| College or Associate's Degree | 15 (18.5%) | 26.0 |
| Bachelor's Degree | 0 (0.0%) | 0.0 |
| Graduate Degree | 0 (0.0%) | 0.0 |
| Total | 81 (100.0%) | 54.0 |
Fertility by Education by Marriage Status in Murphysboro
81.5% of women with births in Murphysboro are unmarried. Women with the educational attainment of college or associate's degree are most likely to be married with 100.0% of them married at childbirth, while women with the educational attainment of less than high school are least likely to be married with 100.0% of them unmarried at childbirth.
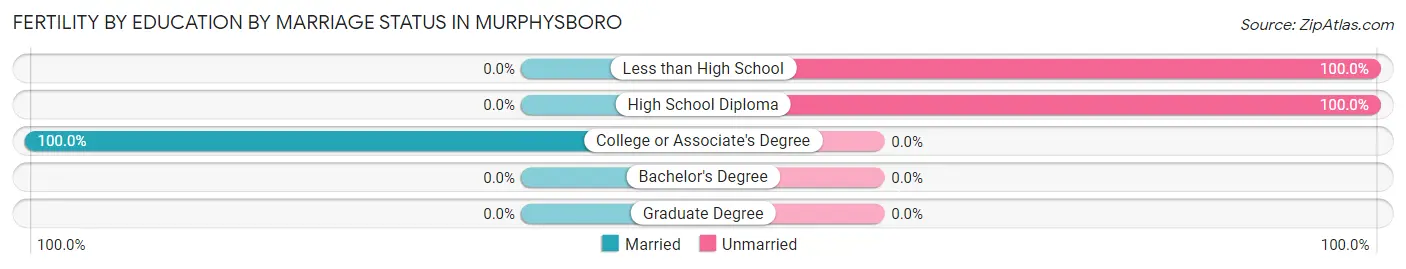
| Educational Attainment | Married | Unmarried |
| Less than High School | 0 (0.0%) | 34 (100.0%) |
| High School Diploma | 0 (0.0%) | 32 (100.0%) |
| College or Associate's Degree | 15 (100.0%) | 0 (0.0%) |
| Bachelor's Degree | 0 (0.0%) | 0 (0.0%) |
| Graduate Degree | 0 (0.0%) | 0 (0.0%) |
| Total | 15 (18.5%) | 66 (81.5%) |
Employment Characteristics in Murphysboro
Employment by Class of Employer in Murphysboro
Among the 2,809 employed individuals in Murphysboro, private company employees (1,650 | 58.7%), not-for-profit organizations (404 | 14.4%), and state government employees (338 | 12.0%) make up the most common classes of employment.
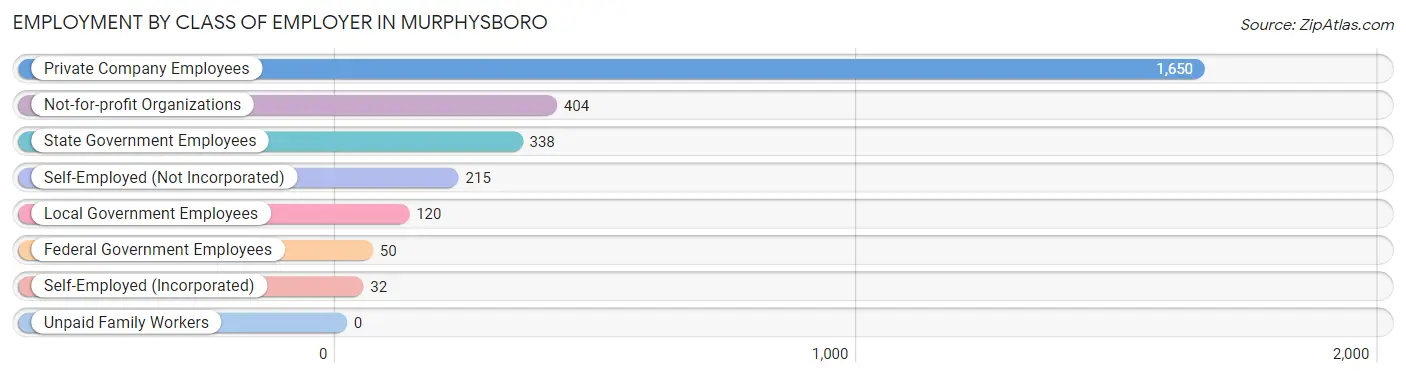
| Employer Class | # Employees | % Employees |
| Private Company Employees | 1,650 | 58.7% |
| Self-Employed (Incorporated) | 32 | 1.1% |
| Self-Employed (Not Incorporated) | 215 | 7.6% |
| Not-for-profit Organizations | 404 | 14.4% |
| Local Government Employees | 120 | 4.3% |
| State Government Employees | 338 | 12.0% |
| Federal Government Employees | 50 | 1.8% |
| Unpaid Family Workers | 0 | 0.0% |
| Total | 2,809 | 100.0% |
Employment Status by Age in Murphysboro
According to the labor force statistics for Murphysboro, out of the total population over 16 years of age (5,597), 57.2% or 3,201 individuals are in the labor force, with 8.8% or 282 of them unemployed. The age group with the highest labor force participation rate is 20 to 24 years, with 89.4% or 303 individuals in the labor force. Within the labor force, the 16 to 19 years age range has the highest percentage of unemployed individuals, with 60.4% or 55 of them being unemployed.
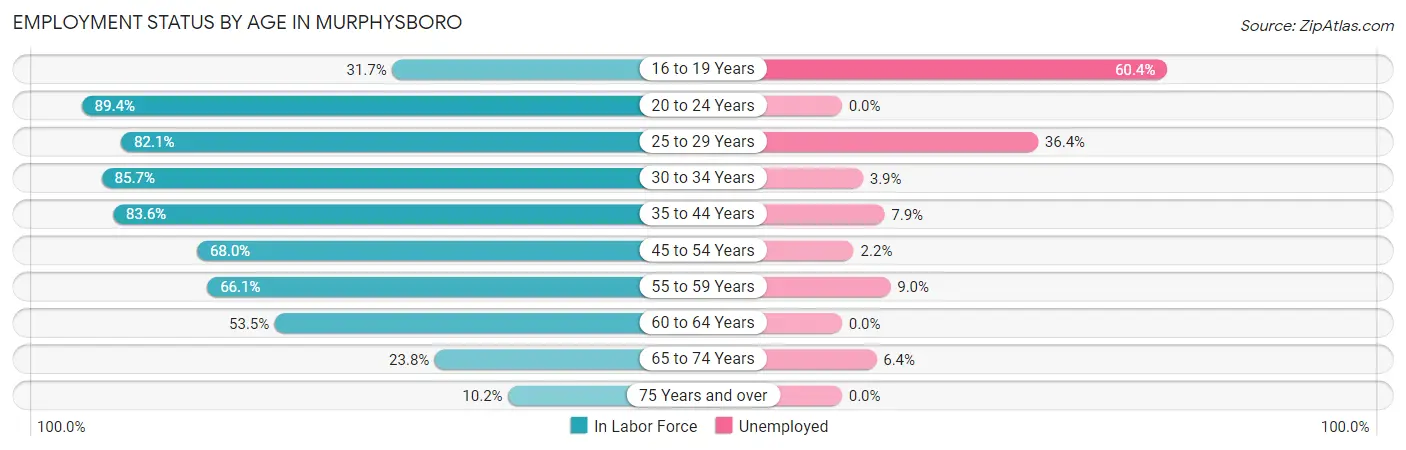
| Age Bracket | In Labor Force | Unemployed |
| 16 to 19 Years | 91 (31.7%) | 55 (60.4%) |
| 20 to 24 Years | 303 (89.4%) | 0 (0.0%) |
| 25 to 29 Years | 247 (82.1%) | 90 (36.4%) |
| 30 to 34 Years | 463 (85.7%) | 18 (3.9%) |
| 35 to 44 Years | 882 (83.6%) | 70 (7.9%) |
| 45 to 54 Years | 450 (68.0%) | 10 (2.2%) |
| 55 to 59 Years | 279 (66.1%) | 25 (9.0%) |
| 60 to 64 Years | 206 (53.5%) | 0 (0.0%) |
| 65 to 74 Years | 202 (23.8%) | 13 (6.4%) |
| 75 Years and over | 77 (10.2%) | 0 (0.0%) |
| Total | 3,201 (57.2%) | 282 (8.8%) |
Employment Status by Educational Attainment in Murphysboro
According to labor force statistics for Murphysboro, 75.1% of individuals (2,527) out of the total population between 25 and 64 years of age (3,365) are in the labor force, with 8.4% or 212 of them being unemployed. The group with the highest labor force participation rate are those with the educational attainment of bachelor's degree or higher, with 88.5% or 631 individuals in the labor force. Within the labor force, individuals with less than high school education have the highest percentage of unemployment, with 24.7% or 53 of them being unemployed.
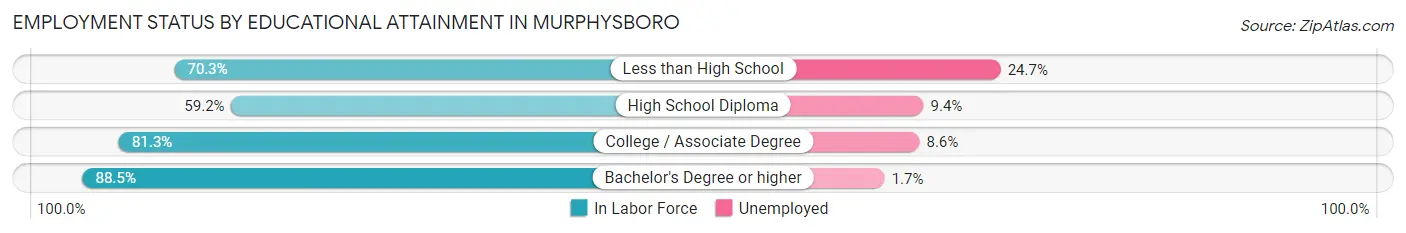
| Educational Attainment | In Labor Force | Unemployed |
| Less than High School | 215 (70.3%) | 76 (24.7%) |
| High School Diploma | 605 (59.2%) | 96 (9.4%) |
| College / Associate Degree | 1,076 (81.3%) | 114 (8.6%) |
| Bachelor's Degree or higher | 631 (88.5%) | 12 (1.7%) |
| Total | 2,527 (75.1%) | 283 (8.4%) |
Employment Occupations by Sex in Murphysboro
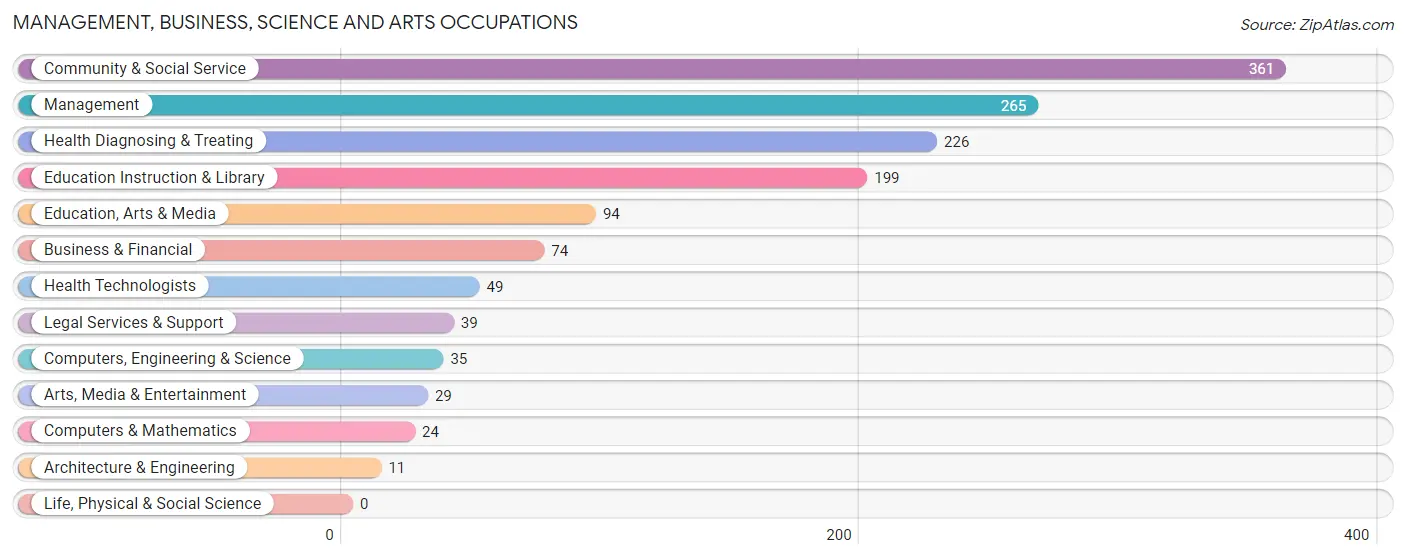
Management, Business, Science and Arts Occupations
The most common Management, Business, Science and Arts occupations in Murphysboro are Community & Social Service (361 | 12.4%), Management (265 | 9.1%), Health Diagnosing & Treating (226 | 7.7%), Education Instruction & Library (199 | 6.8%), and Education, Arts & Media (94 | 3.2%).
Management, Business, Science and Arts Occupations by Sex
Within the Management, Business, Science and Arts occupations in Murphysboro, the most male-oriented occupations are Computers, Engineering & Science (100.0%), Computers & Mathematics (100.0%), and Architecture & Engineering (100.0%), while the most female-oriented occupations are Health Diagnosing & Treating (100.0%), Health Technologists (100.0%), and Legal Services & Support (82.1%).
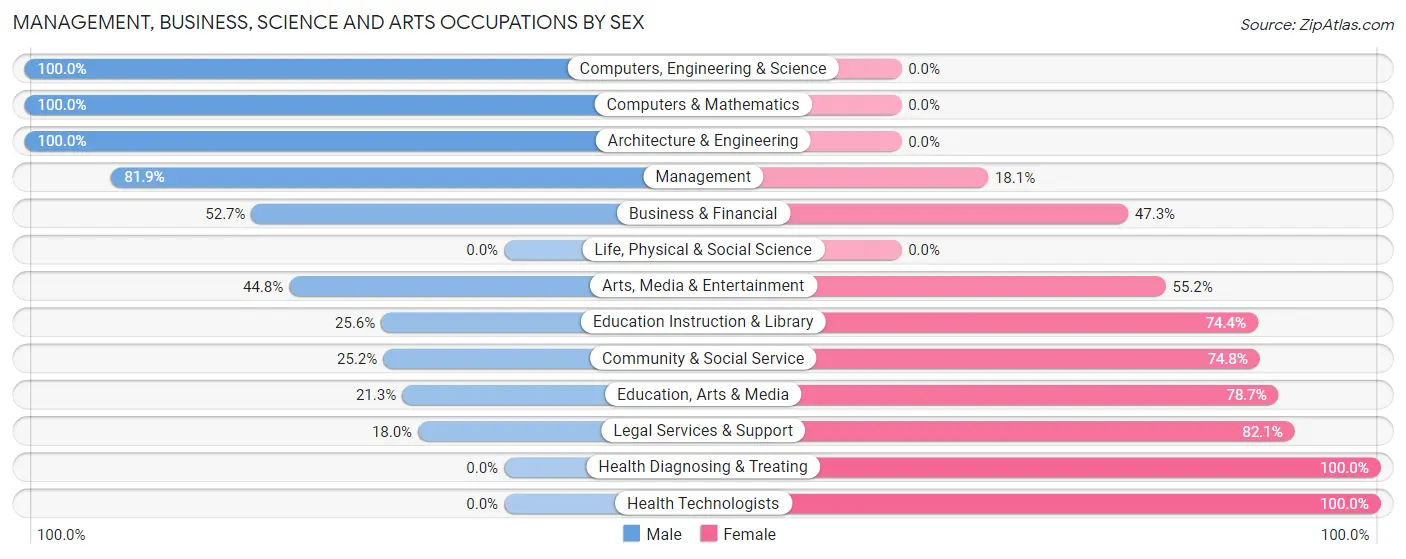
| Occupation | Male | Female |
| Management | 217 (81.9%) | 48 (18.1%) |
| Business & Financial | 39 (52.7%) | 35 (47.3%) |
| Computers, Engineering & Science | 35 (100.0%) | 0 (0.0%) |
| Computers & Mathematics | 24 (100.0%) | 0 (0.0%) |
| Architecture & Engineering | 11 (100.0%) | 0 (0.0%) |
| Life, Physical & Social Science | 0 (0.0%) | 0 (0.0%) |
| Community & Social Service | 91 (25.2%) | 270 (74.8%) |
| Education, Arts & Media | 20 (21.3%) | 74 (78.7%) |
| Legal Services & Support | 7 (17.9%) | 32 (82.1%) |
| Education Instruction & Library | 51 (25.6%) | 148 (74.4%) |
| Arts, Media & Entertainment | 13 (44.8%) | 16 (55.2%) |
| Health Diagnosing & Treating | 0 (0.0%) | 226 (100.0%) |
| Health Technologists | 0 (0.0%) | 49 (100.0%) |
| Total (Category) | 382 (39.8%) | 579 (60.3%) |
| Total (Overall) | 1,425 (48.8%) | 1,494 (51.2%) |
Services Occupations
The most common Services occupations in Murphysboro are Healthcare Support (224 | 7.7%), Food Preparation & Serving (176 | 6.0%), Security & Protection (155 | 5.3%), Cleaning & Maintenance (150 | 5.1%), and Law Enforcement (85 | 2.9%).
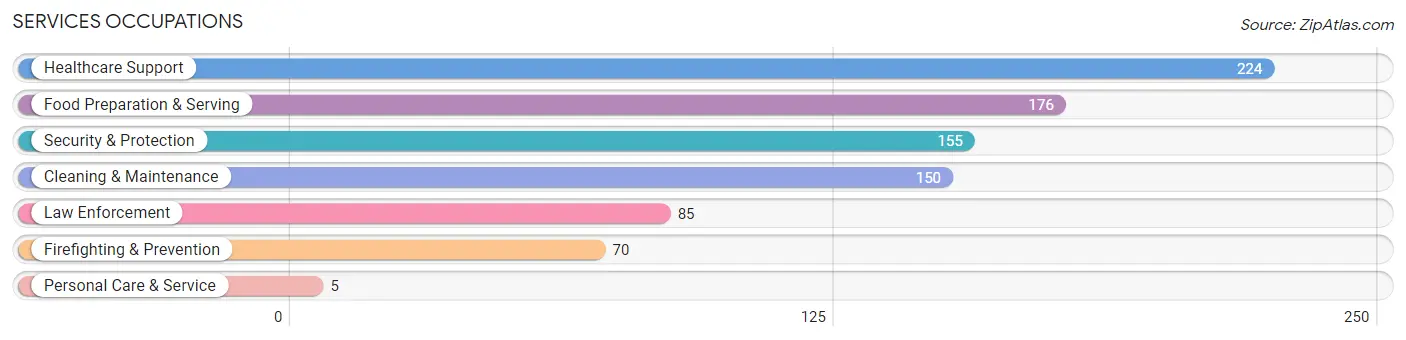
Services Occupations by Sex
Within the Services occupations in Murphysboro, the most male-oriented occupations are Firefighting & Prevention (100.0%), Personal Care & Service (100.0%), and Security & Protection (83.9%), while the most female-oriented occupations are Healthcare Support (100.0%), Food Preparation & Serving (88.6%), and Law Enforcement (29.4%).
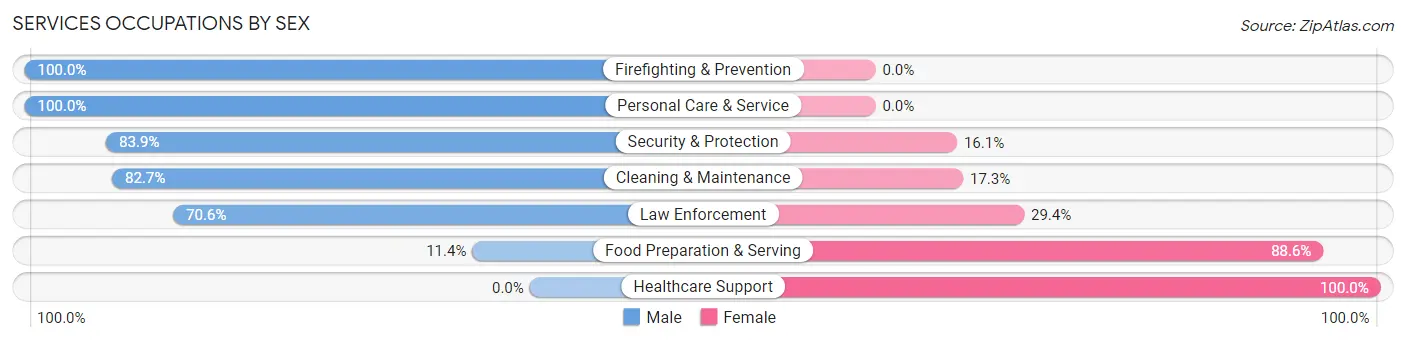
| Occupation | Male | Female |
| Healthcare Support | 0 (0.0%) | 224 (100.0%) |
| Security & Protection | 130 (83.9%) | 25 (16.1%) |
| Firefighting & Prevention | 70 (100.0%) | 0 (0.0%) |
| Law Enforcement | 60 (70.6%) | 25 (29.4%) |
| Food Preparation & Serving | 20 (11.4%) | 156 (88.6%) |
| Cleaning & Maintenance | 124 (82.7%) | 26 (17.3%) |
| Personal Care & Service | 5 (100.0%) | 0 (0.0%) |
| Total (Category) | 279 (39.3%) | 431 (60.7%) |
| Total (Overall) | 1,425 (48.8%) | 1,494 (51.2%) |
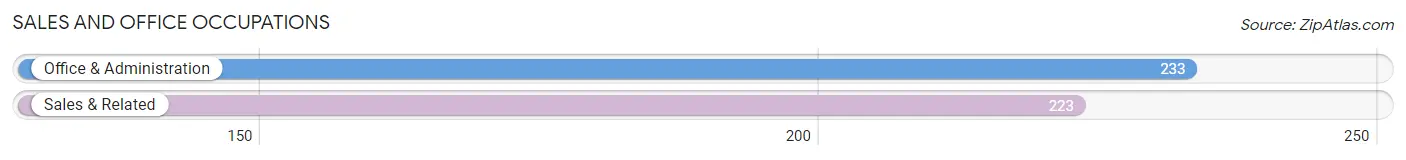
Sales and Office Occupations
The most common Sales and Office occupations in Murphysboro are Office & Administration (233 | 8.0%), and Sales & Related (223 | 7.6%).
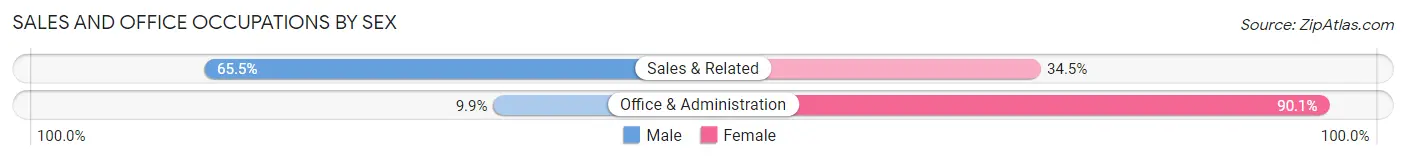
Sales and Office Occupations by Sex
| Occupation | Male | Female |
| Sales & Related | 146 (65.5%) | 77 (34.5%) |
| Office & Administration | 23 (9.9%) | 210 (90.1%) |
| Total (Category) | 169 (37.1%) | 287 (62.9%) |
| Total (Overall) | 1,425 (48.8%) | 1,494 (51.2%) |
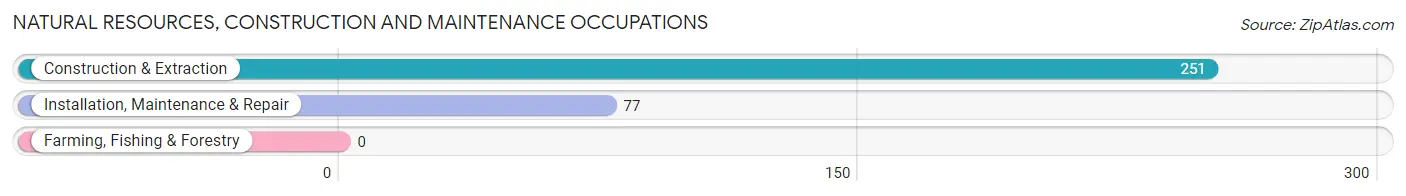
Natural Resources, Construction and Maintenance Occupations
The most common Natural Resources, Construction and Maintenance occupations in Murphysboro are Construction & Extraction (251 | 8.6%), and Installation, Maintenance & Repair (77 | 2.6%).
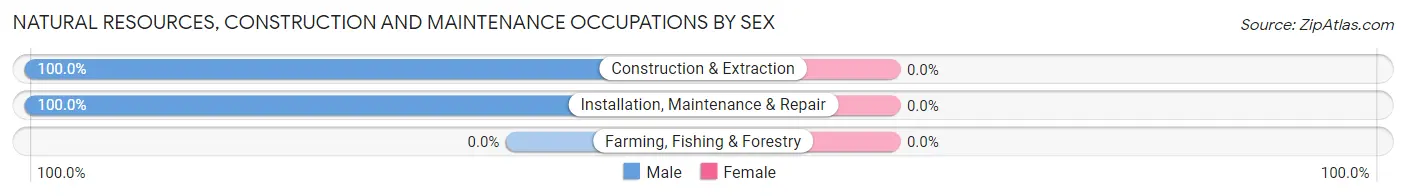
Natural Resources, Construction and Maintenance Occupations by Sex
| Occupation | Male | Female |
| Farming, Fishing & Forestry | 0 (0.0%) | 0 (0.0%) |
| Construction & Extraction | 251 (100.0%) | 0 (0.0%) |
| Installation, Maintenance & Repair | 77 (100.0%) | 0 (0.0%) |
| Total (Category) | 328 (100.0%) | 0 (0.0%) |
| Total (Overall) | 1,425 (48.8%) | 1,494 (51.2%) |
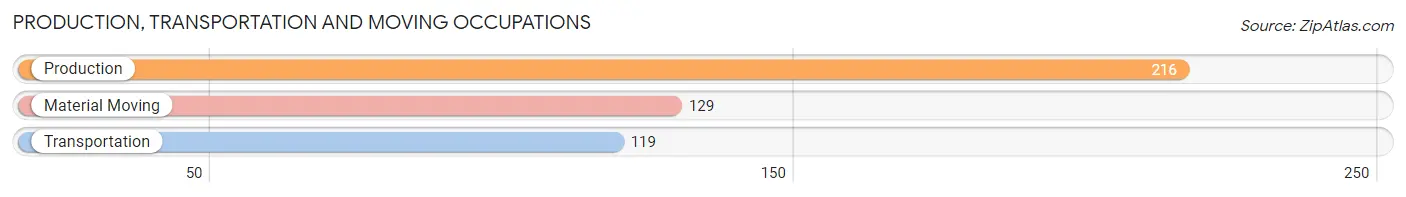
Production, Transportation and Moving Occupations
The most common Production, Transportation and Moving occupations in Murphysboro are Production (216 | 7.4%), Material Moving (129 | 4.4%), and Transportation (119 | 4.1%).
Production, Transportation and Moving Occupations by Sex
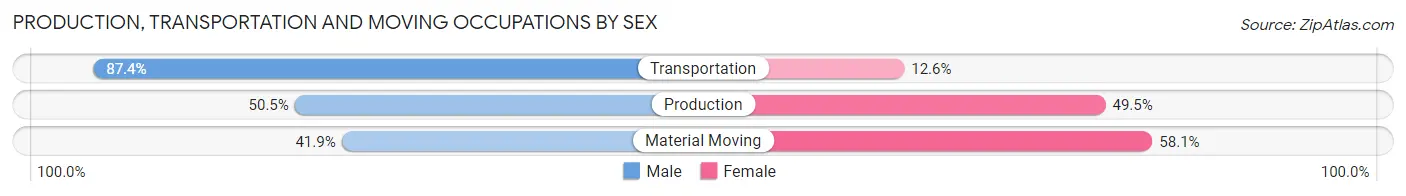
| Occupation | Male | Female |
| Production | 109 (50.5%) | 107 (49.5%) |
| Transportation | 104 (87.4%) | 15 (12.6%) |
| Material Moving | 54 (41.9%) | 75 (58.1%) |
| Total (Category) | 267 (57.5%) | 197 (42.5%) |
| Total (Overall) | 1,425 (48.8%) | 1,494 (51.2%) |
Employment Industries by Sex in Murphysboro
Employment Industries in Murphysboro
The major employment industries in Murphysboro include Health Care & Social Assistance (644 | 22.1%), Educational Services (334 | 11.4%), Retail Trade (297 | 10.2%), Manufacturing (261 | 8.9%), and Accommodation & Food Services (213 | 7.3%).
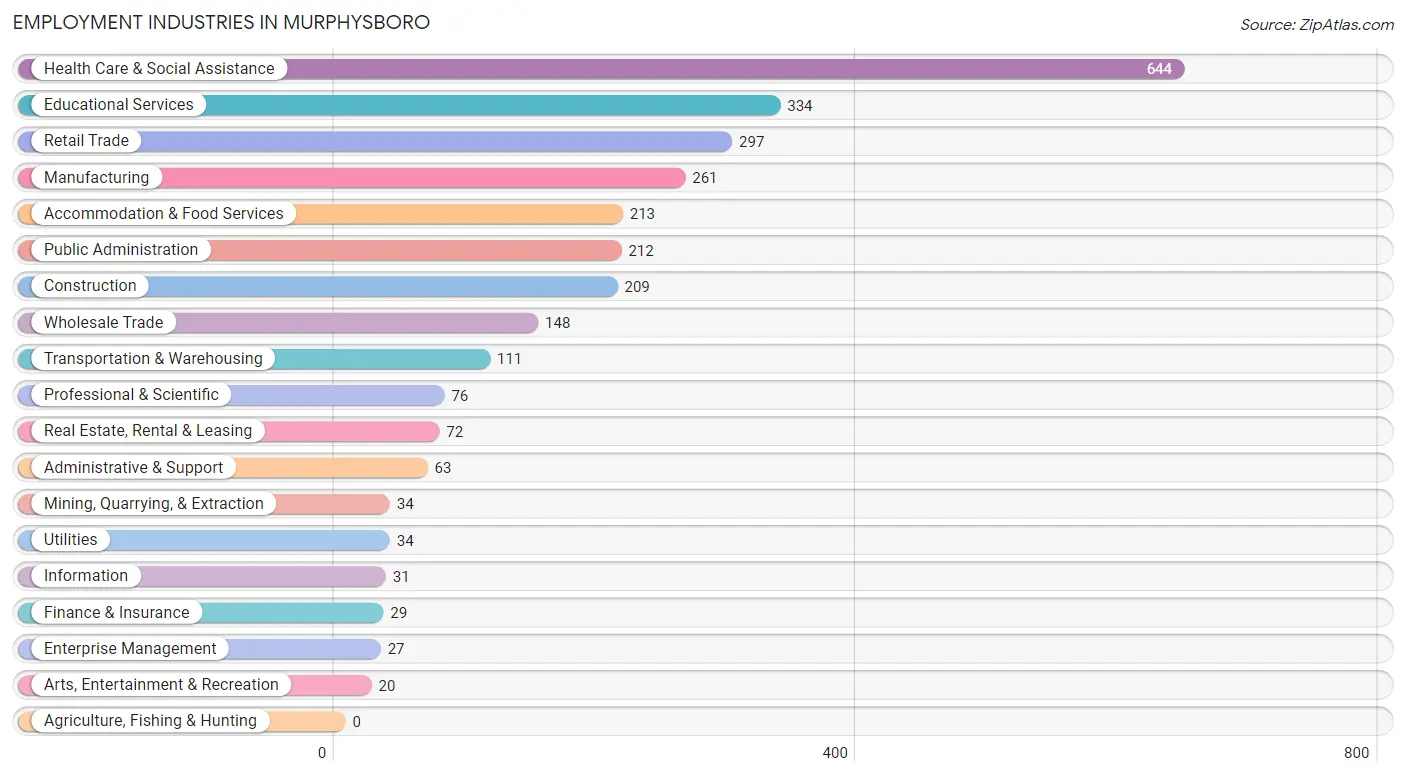
Employment Industries by Sex in Murphysboro
The Murphysboro industries that see more men than women are Mining, Quarrying, & Extraction (100.0%), Construction (100.0%), and Utilities (100.0%), whereas the industries that tend to have a higher number of women are Enterprise Management (100.0%), Health Care & Social Assistance (95.2%), and Administrative & Support (82.5%).
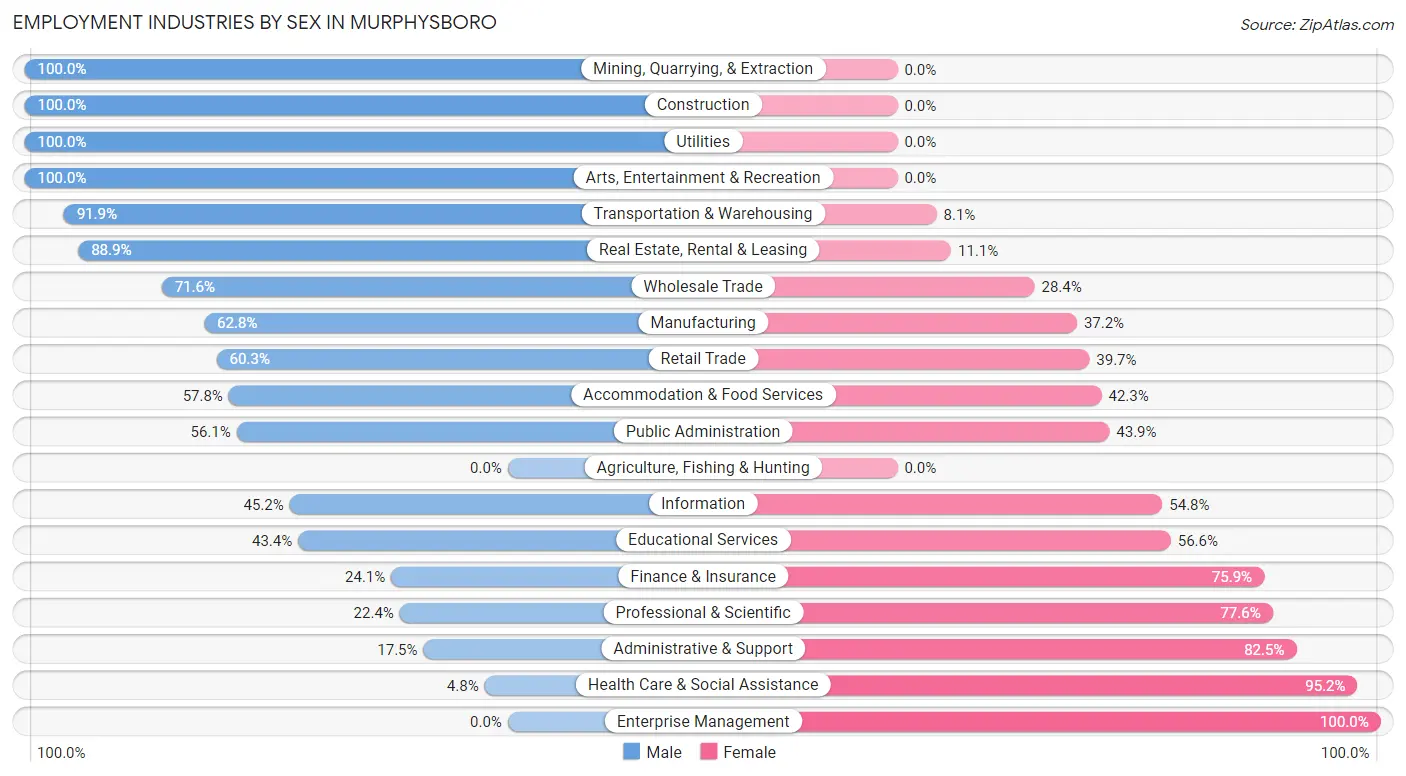
| Industry | Male | Female |
| Agriculture, Fishing & Hunting | 0 (0.0%) | 0 (0.0%) |
| Mining, Quarrying, & Extraction | 34 (100.0%) | 0 (0.0%) |
| Construction | 209 (100.0%) | 0 (0.0%) |
| Manufacturing | 164 (62.8%) | 97 (37.2%) |
| Wholesale Trade | 106 (71.6%) | 42 (28.4%) |
| Retail Trade | 179 (60.3%) | 118 (39.7%) |
| Transportation & Warehousing | 102 (91.9%) | 9 (8.1%) |
| Utilities | 34 (100.0%) | 0 (0.0%) |
| Information | 14 (45.2%) | 17 (54.8%) |
| Finance & Insurance | 7 (24.1%) | 22 (75.9%) |
| Real Estate, Rental & Leasing | 64 (88.9%) | 8 (11.1%) |
| Professional & Scientific | 17 (22.4%) | 59 (77.6%) |
| Enterprise Management | 0 (0.0%) | 27 (100.0%) |
| Administrative & Support | 11 (17.5%) | 52 (82.5%) |
| Educational Services | 145 (43.4%) | 189 (56.6%) |
| Health Care & Social Assistance | 31 (4.8%) | 613 (95.2%) |
| Arts, Entertainment & Recreation | 20 (100.0%) | 0 (0.0%) |
| Accommodation & Food Services | 123 (57.8%) | 90 (42.2%) |
| Public Administration | 119 (56.1%) | 93 (43.9%) |
| Total | 1,425 (48.8%) | 1,494 (51.2%) |
Education in Murphysboro
School Enrollment in Murphysboro
The most common levels of schooling among the 1,602 students in Murphysboro are middle school (411 | 25.7%), high school (268 | 16.7%), and elementary school (254 | 15.9%).
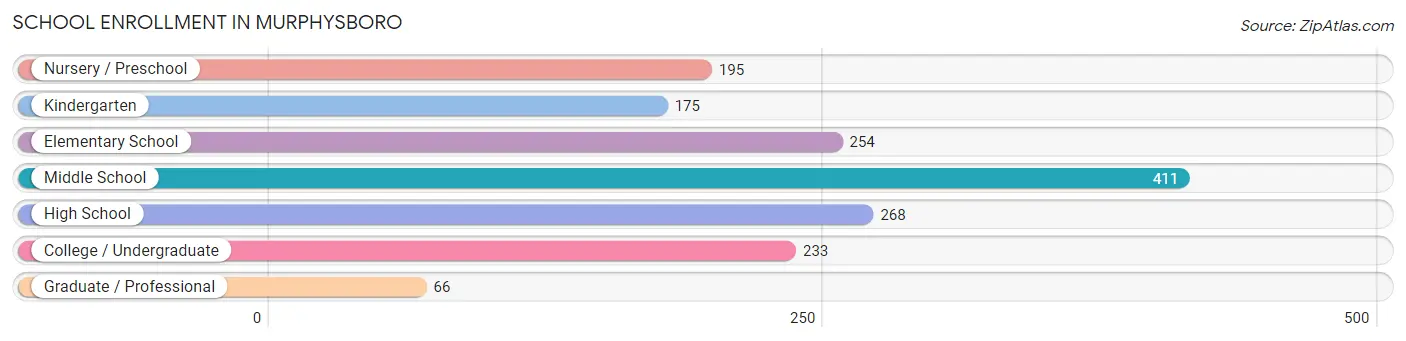
| School Level | # Students | % Students |
| Nursery / Preschool | 195 | 12.2% |
| Kindergarten | 175 | 10.9% |
| Elementary School | 254 | 15.9% |
| Middle School | 411 | 25.7% |
| High School | 268 | 16.7% |
| College / Undergraduate | 233 | 14.5% |
| Graduate / Professional | 66 | 4.1% |
| Total | 1,602 | 100.0% |
School Enrollment by Age by Funding Source in Murphysboro
Out of a total of 1,602 students who are enrolled in schools in Murphysboro, 245 (15.3%) attend a private institution, while the remaining 1,357 (84.7%) are enrolled in public schools. The age group of 3 to 4 year olds has the highest likelihood of being enrolled in private schools, with 55 (37.9% in the age bracket) enrolled. Conversely, the age group of 20 to 24 year olds has the lowest likelihood of being enrolled in a private school, with 113 (100.0% in the age bracket) attending a public institution.
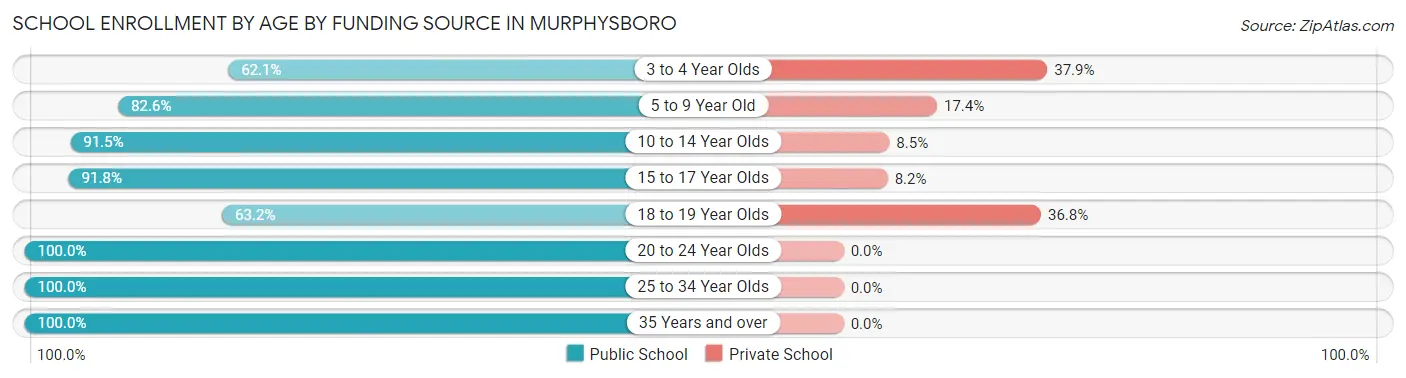
| Age Bracket | Public School | Private School |
| 3 to 4 Year Olds | 90 (62.1%) | 55 (37.9%) |
| 5 to 9 Year Old | 375 (82.6%) | 79 (17.4%) |
| 10 to 14 Year Olds | 419 (91.5%) | 39 (8.5%) |
| 15 to 17 Year Olds | 168 (91.8%) | 15 (8.2%) |
| 18 to 19 Year Olds | 98 (63.2%) | 57 (36.8%) |
| 20 to 24 Year Olds | 113 (100.0%) | 0 (0.0%) |
| 25 to 34 Year Olds | 48 (100.0%) | 0 (0.0%) |
| 35 Years and over | 46 (100.0%) | 0 (0.0%) |
| Total | 1,357 (84.7%) | 245 (15.3%) |
Educational Attainment by Field of Study in Murphysboro
Education (258 | 21.2%), science & technology (173 | 14.2%), arts & humanities (149 | 12.3%), social sciences (147 | 12.1%), and liberal arts & history (89 | 7.3%) are the most common fields of study among 1,215 individuals in Murphysboro who have obtained a bachelor's degree or higher.
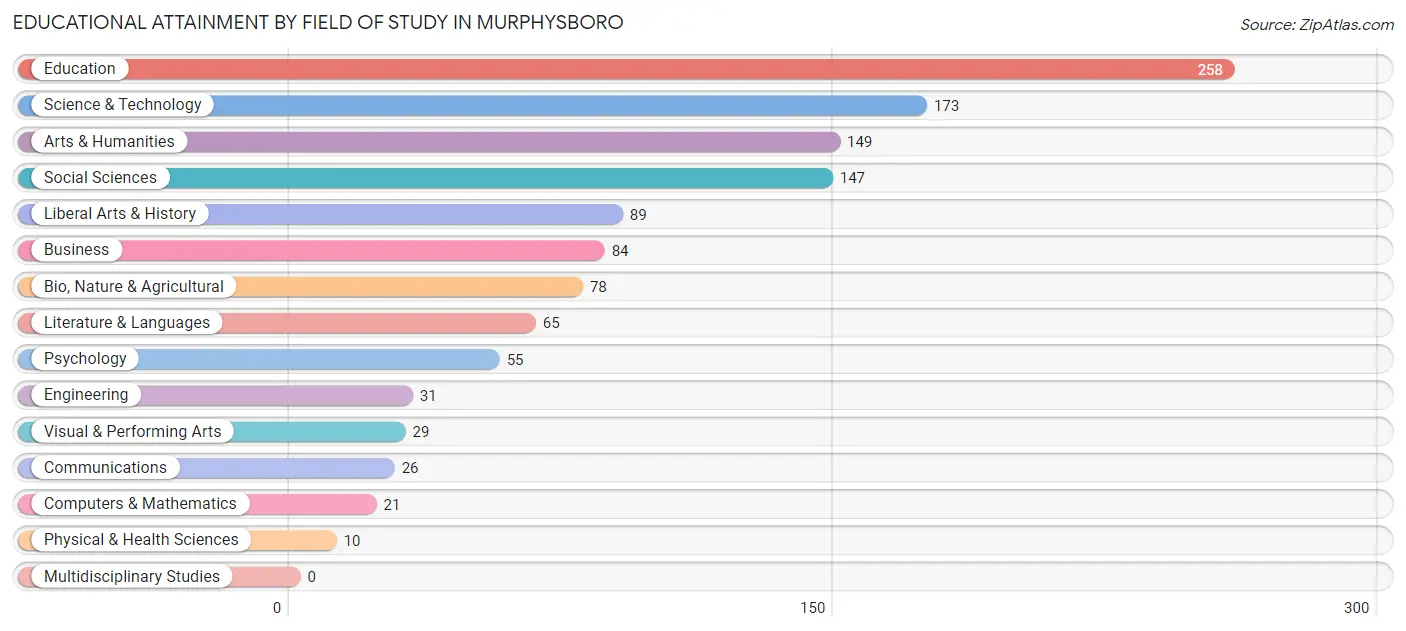
| Field of Study | # Graduates | % Graduates |
| Computers & Mathematics | 21 | 1.7% |
| Bio, Nature & Agricultural | 78 | 6.4% |
| Physical & Health Sciences | 10 | 0.8% |
| Psychology | 55 | 4.5% |
| Social Sciences | 147 | 12.1% |
| Engineering | 31 | 2.5% |
| Multidisciplinary Studies | 0 | 0.0% |
| Science & Technology | 173 | 14.2% |
| Business | 84 | 6.9% |
| Education | 258 | 21.2% |
| Literature & Languages | 65 | 5.3% |
| Liberal Arts & History | 89 | 7.3% |
| Visual & Performing Arts | 29 | 2.4% |
| Communications | 26 | 2.1% |
| Arts & Humanities | 149 | 12.3% |
| Total | 1,215 | 100.0% |
Transportation & Commute in Murphysboro
Vehicle Availability by Sex in Murphysboro
The most prevalent vehicle ownership categories in Murphysboro are males with 2 vehicles (532, accounting for 39.9%) and females with 2 vehicles (553, making up 36.4%).
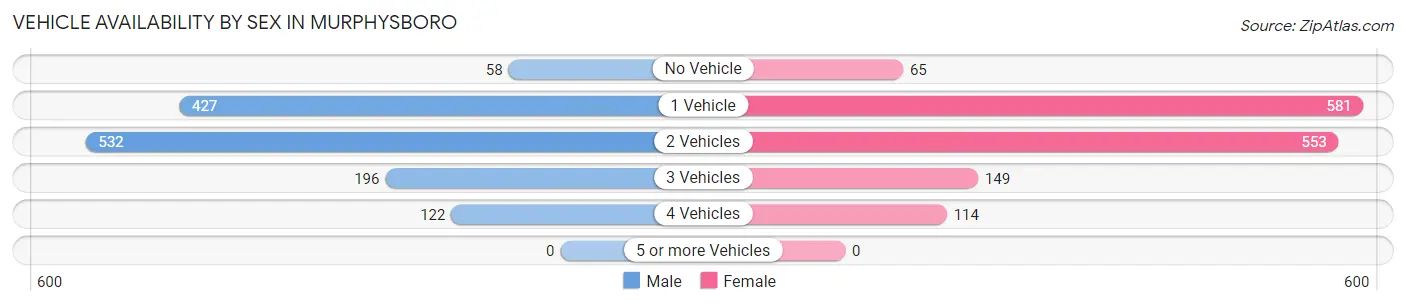
| Vehicles Available | Male | Female |
| No Vehicle | 58 (4.3%) | 65 (4.4%) |
| 1 Vehicle | 427 (32.0%) | 581 (39.7%) |
| 2 Vehicles | 532 (39.9%) | 553 (37.8%) |
| 3 Vehicles | 196 (14.7%) | 149 (10.2%) |
| 4 Vehicles | 122 (9.1%) | 114 (7.8%) |
| 5 or more Vehicles | 0 (0.0%) | 0 (0.0%) |
| Total | 1,335 (100.0%) | 1,462 (100.0%) |
Commute Time in Murphysboro
The most frequently occuring commute durations in Murphysboro are 15 to 19 minutes (560 commuters, 21.0%), 10 to 14 minutes (505 commuters, 18.9%), and 5 to 9 minutes (280 commuters, 10.5%).
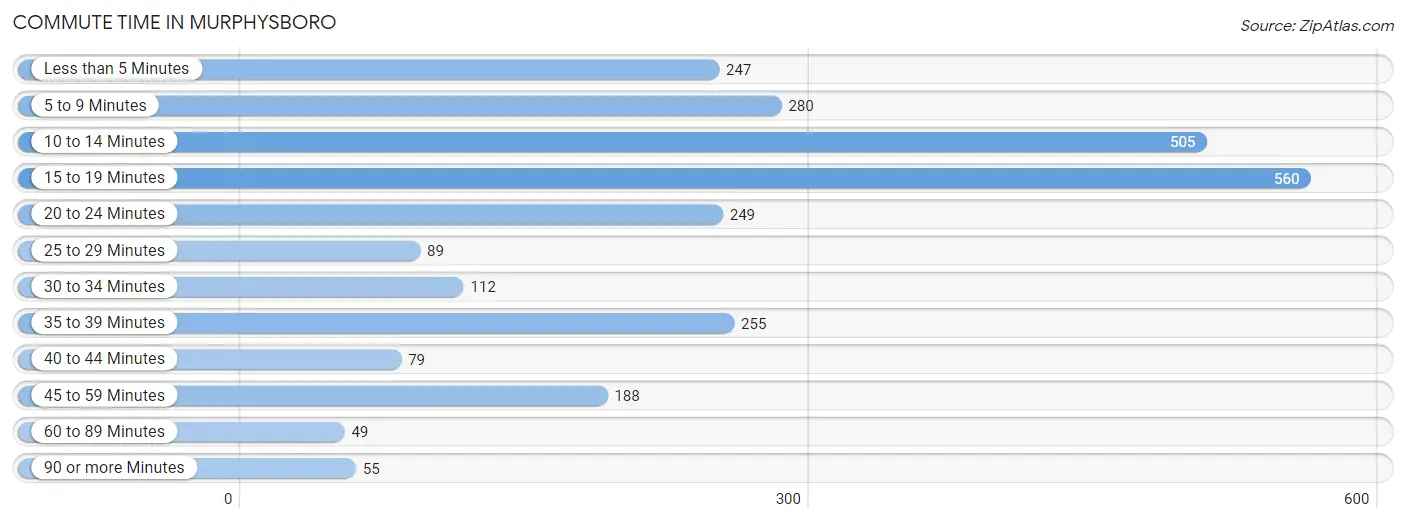
| Commute Time | # Commuters | % Commuters |
| Less than 5 Minutes | 247 | 9.3% |
| 5 to 9 Minutes | 280 | 10.5% |
| 10 to 14 Minutes | 505 | 18.9% |
| 15 to 19 Minutes | 560 | 21.0% |
| 20 to 24 Minutes | 249 | 9.3% |
| 25 to 29 Minutes | 89 | 3.3% |
| 30 to 34 Minutes | 112 | 4.2% |
| 35 to 39 Minutes | 255 | 9.6% |
| 40 to 44 Minutes | 79 | 3.0% |
| 45 to 59 Minutes | 188 | 7.0% |
| 60 to 89 Minutes | 49 | 1.8% |
| 90 or more Minutes | 55 | 2.1% |
Commute Time by Sex in Murphysboro
The most common commute times in Murphysboro are 15 to 19 minutes (235 commuters, 18.8%) for males and 15 to 19 minutes (325 commuters, 22.9%) for females.
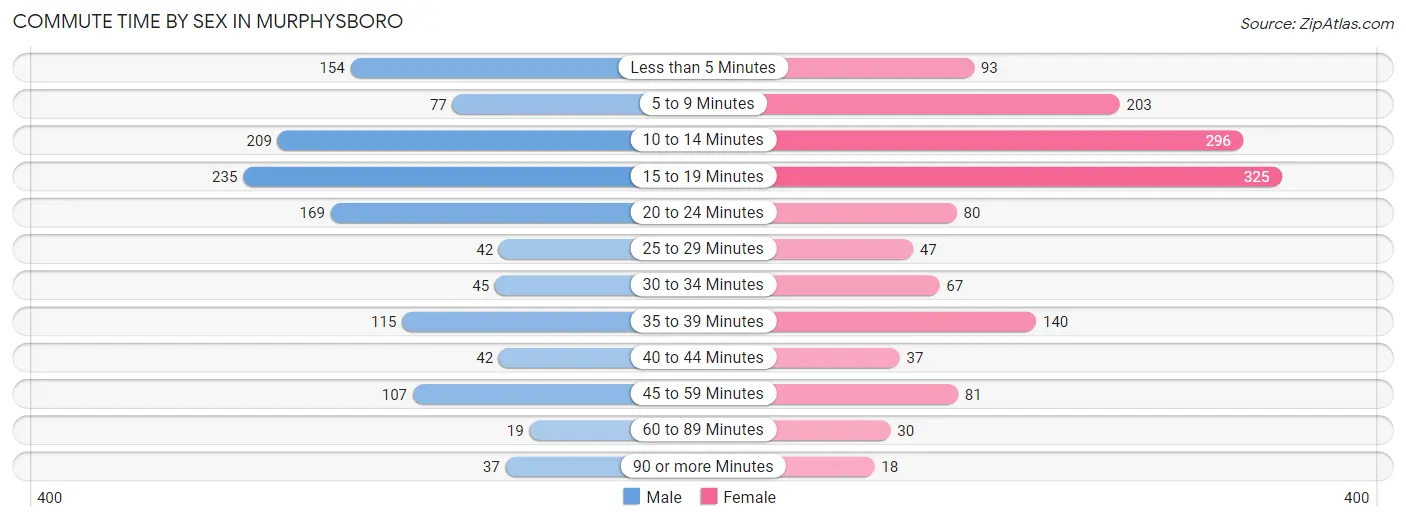
| Commute Time | Male | Female |
| Less than 5 Minutes | 154 (12.3%) | 93 (6.6%) |
| 5 to 9 Minutes | 77 (6.2%) | 203 (14.3%) |
| 10 to 14 Minutes | 209 (16.7%) | 296 (20.9%) |
| 15 to 19 Minutes | 235 (18.8%) | 325 (22.9%) |
| 20 to 24 Minutes | 169 (13.5%) | 80 (5.7%) |
| 25 to 29 Minutes | 42 (3.4%) | 47 (3.3%) |
| 30 to 34 Minutes | 45 (3.6%) | 67 (4.7%) |
| 35 to 39 Minutes | 115 (9.2%) | 140 (9.9%) |
| 40 to 44 Minutes | 42 (3.4%) | 37 (2.6%) |
| 45 to 59 Minutes | 107 (8.6%) | 81 (5.7%) |
| 60 to 89 Minutes | 19 (1.5%) | 30 (2.1%) |
| 90 or more Minutes | 37 (3.0%) | 18 (1.3%) |
Time of Departure to Work by Sex in Murphysboro
The most frequent times of departure to work in Murphysboro are 7:30 AM to 7:59 AM (191, 15.3%) for males and 12:00 PM to 3:59 PM (220, 15.5%) for females.
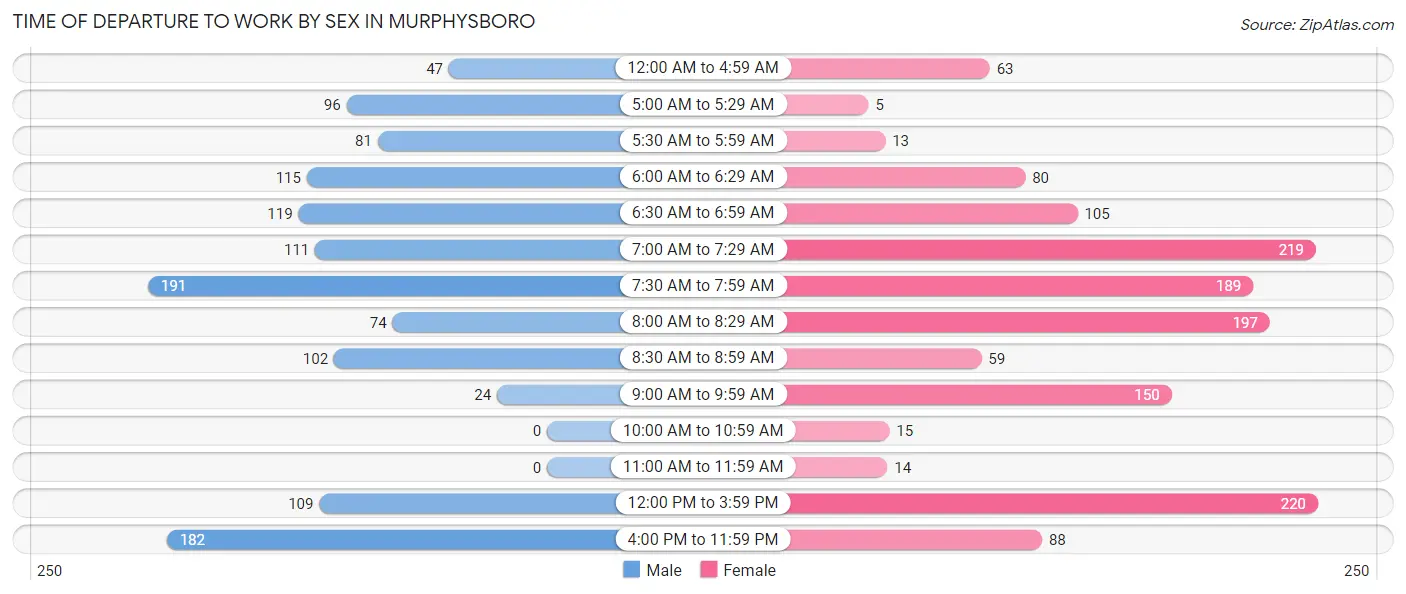
| Time of Departure | Male | Female |
| 12:00 AM to 4:59 AM | 47 (3.8%) | 63 (4.4%) |
| 5:00 AM to 5:29 AM | 96 (7.7%) | 5 (0.4%) |
| 5:30 AM to 5:59 AM | 81 (6.5%) | 13 (0.9%) |
| 6:00 AM to 6:29 AM | 115 (9.2%) | 80 (5.7%) |
| 6:30 AM to 6:59 AM | 119 (9.5%) | 105 (7.4%) |
| 7:00 AM to 7:29 AM | 111 (8.9%) | 219 (15.5%) |
| 7:30 AM to 7:59 AM | 191 (15.3%) | 189 (13.3%) |
| 8:00 AM to 8:29 AM | 74 (5.9%) | 197 (13.9%) |
| 8:30 AM to 8:59 AM | 102 (8.2%) | 59 (4.2%) |
| 9:00 AM to 9:59 AM | 24 (1.9%) | 150 (10.6%) |
| 10:00 AM to 10:59 AM | 0 (0.0%) | 15 (1.1%) |
| 11:00 AM to 11:59 AM | 0 (0.0%) | 14 (1.0%) |
| 12:00 PM to 3:59 PM | 109 (8.7%) | 220 (15.5%) |
| 4:00 PM to 11:59 PM | 182 (14.5%) | 88 (6.2%) |
| Total | 1,251 (100.0%) | 1,417 (100.0%) |
Housing Occupancy in Murphysboro
Occupancy by Ownership in Murphysboro
Of the total 3,466 dwellings in Murphysboro, owner-occupied units account for 1,653 (47.7%), while renter-occupied units make up 1,813 (52.3%).
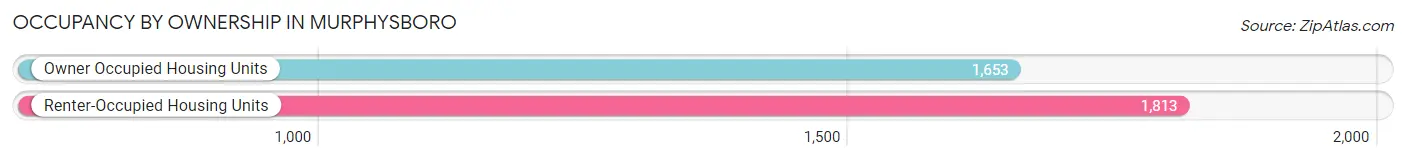
| Occupancy | # Housing Units | % Housing Units |
| Owner Occupied Housing Units | 1,653 | 47.7% |
| Renter-Occupied Housing Units | 1,813 | 52.3% |
| Total Occupied Housing Units | 3,466 | 100.0% |
Occupancy by Household Size in Murphysboro
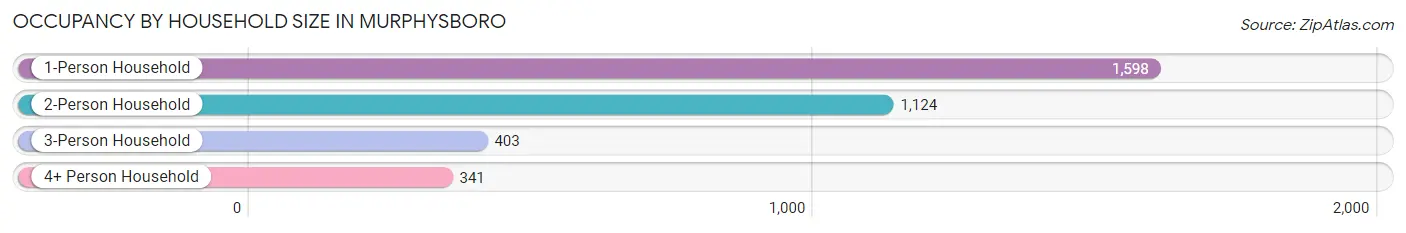
| Household Size | # Housing Units | % Housing Units |
| 1-Person Household | 1,598 | 46.1% |
| 2-Person Household | 1,124 | 32.4% |
| 3-Person Household | 403 | 11.6% |
| 4+ Person Household | 341 | 9.8% |
| Total Housing Units | 3,466 | 100.0% |
Occupancy by Ownership by Household Size in Murphysboro
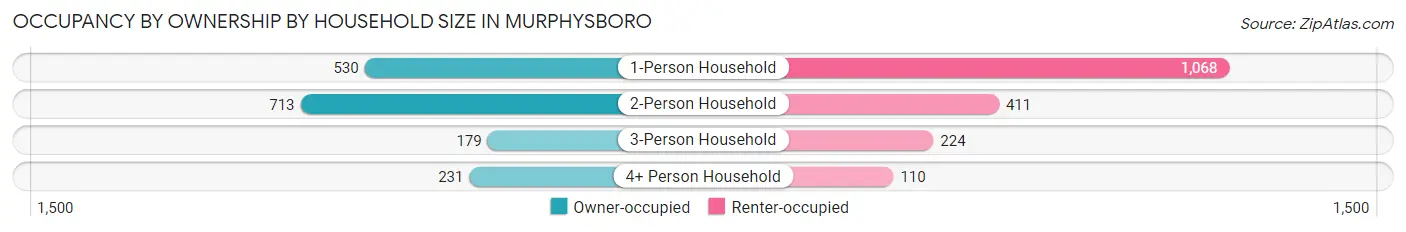
| Household Size | Owner-occupied | Renter-occupied |
| 1-Person Household | 530 (33.2%) | 1,068 (66.8%) |
| 2-Person Household | 713 (63.4%) | 411 (36.6%) |
| 3-Person Household | 179 (44.4%) | 224 (55.6%) |
| 4+ Person Household | 231 (67.7%) | 110 (32.3%) |
| Total Housing Units | 1,653 (47.7%) | 1,813 (52.3%) |
Occupancy by Educational Attainment in Murphysboro
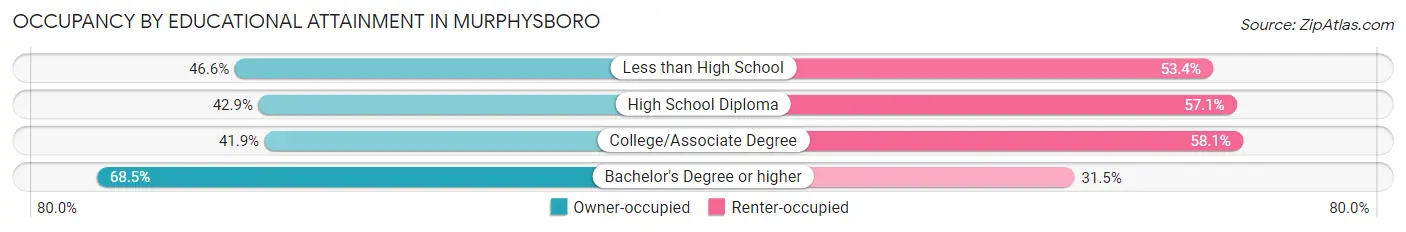
| Household Size | Owner-occupied | Renter-occupied |
| Less than High School | 152 (46.6%) | 174 (53.4%) |
| High School Diploma | 429 (42.9%) | 572 (57.1%) |
| College/Associate Degree | 619 (41.9%) | 859 (58.1%) |
| Bachelor's Degree or higher | 453 (68.5%) | 208 (31.5%) |
Occupancy by Age of Householder in Murphysboro
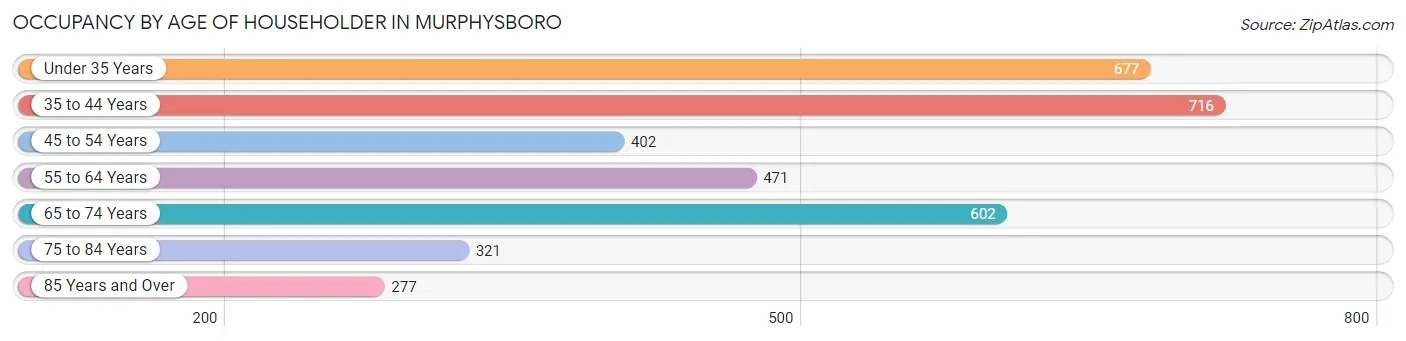
| Age Bracket | # Households | % Households |
| Under 35 Years | 677 | 19.5% |
| 35 to 44 Years | 716 | 20.7% |
| 45 to 54 Years | 402 | 11.6% |
| 55 to 64 Years | 471 | 13.6% |
| 65 to 74 Years | 602 | 17.4% |
| 75 to 84 Years | 321 | 9.3% |
| 85 Years and Over | 277 | 8.0% |
| Total | 3,466 | 100.0% |
Housing Finances in Murphysboro
Median Income by Occupancy in Murphysboro
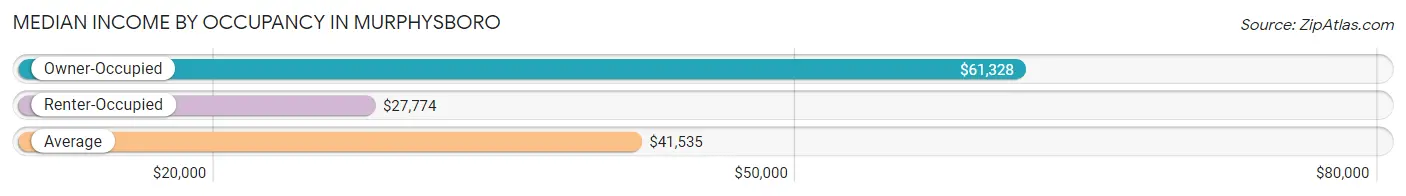
| Occupancy Type | # Households | Median Income |
| Owner-Occupied | 1,653 (47.7%) | $61,328 |
| Renter-Occupied | 1,813 (52.3%) | $27,774 |
| Average | 3,466 (100.0%) | $41,535 |
Occupancy by Householder Income Bracket in Murphysboro
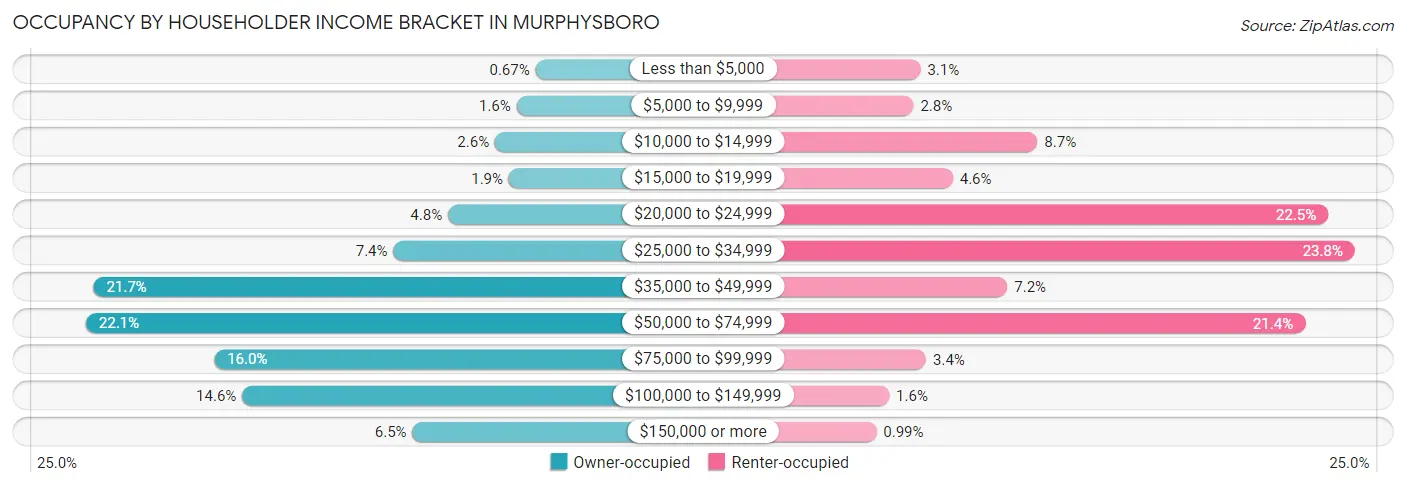
| Income Bracket | Owner-occupied | Renter-occupied |
| Less than $5,000 | 11 (0.7%) | 56 (3.1%) |
| $5,000 to $9,999 | 26 (1.6%) | 50 (2.8%) |
| $10,000 to $14,999 | 43 (2.6%) | 157 (8.7%) |
| $15,000 to $19,999 | 32 (1.9%) | 84 (4.6%) |
| $20,000 to $24,999 | 80 (4.8%) | 408 (22.5%) |
| $25,000 to $34,999 | 123 (7.4%) | 431 (23.8%) |
| $35,000 to $49,999 | 359 (21.7%) | 131 (7.2%) |
| $50,000 to $74,999 | 365 (22.1%) | 388 (21.4%) |
| $75,000 to $99,999 | 264 (16.0%) | 61 (3.4%) |
| $100,000 to $149,999 | 242 (14.6%) | 29 (1.6%) |
| $150,000 or more | 108 (6.5%) | 18 (1.0%) |
| Total | 1,653 (100.0%) | 1,813 (100.0%) |
Monthly Housing Cost Tiers in Murphysboro
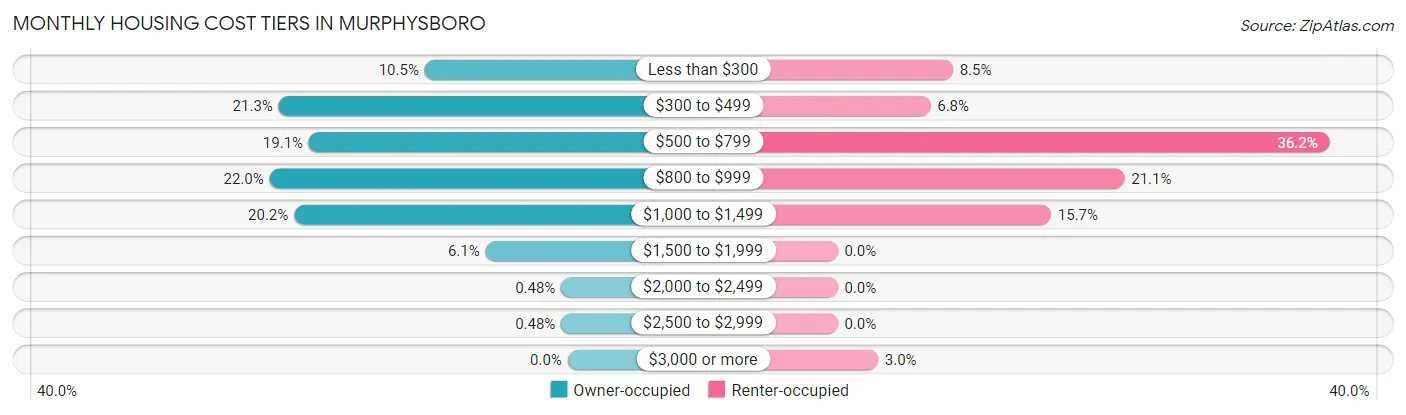
| Monthly Cost | Owner-occupied | Renter-occupied |
| Less than $300 | 174 (10.5%) | 154 (8.5%) |
| $300 to $499 | 352 (21.3%) | 124 (6.8%) |
| $500 to $799 | 315 (19.1%) | 657 (36.2%) |
| $800 to $999 | 363 (22.0%) | 383 (21.1%) |
| $1,000 to $1,499 | 333 (20.2%) | 285 (15.7%) |
| $1,500 to $1,999 | 100 (6.0%) | 0 (0.0%) |
| $2,000 to $2,499 | 8 (0.5%) | 0 (0.0%) |
| $2,500 to $2,999 | 8 (0.5%) | 0 (0.0%) |
| $3,000 or more | 0 (0.0%) | 54 (3.0%) |
| Total | 1,653 (100.0%) | 1,813 (100.0%) |
Physical Housing Characteristics in Murphysboro
Housing Structures in Murphysboro
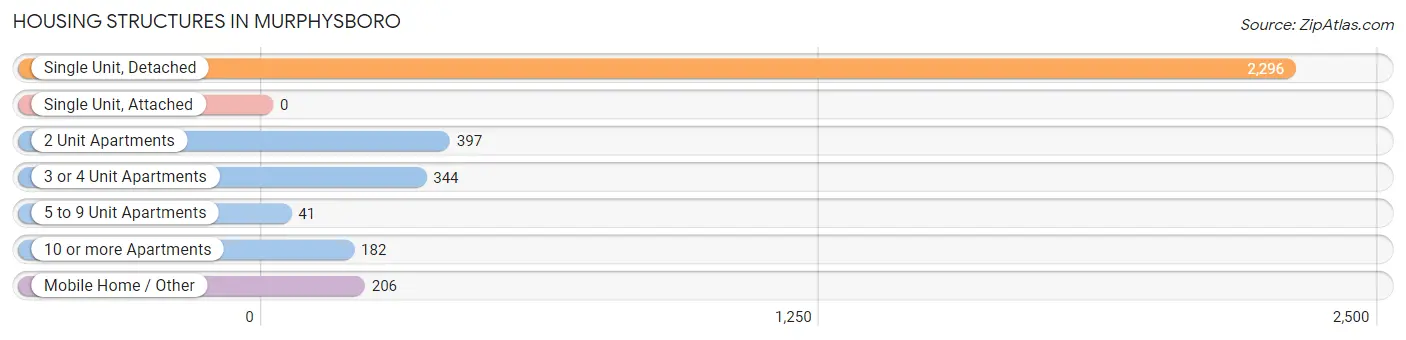
| Structure Type | # Housing Units | % Housing Units |
| Single Unit, Detached | 2,296 | 66.2% |
| Single Unit, Attached | 0 | 0.0% |
| 2 Unit Apartments | 397 | 11.5% |
| 3 or 4 Unit Apartments | 344 | 9.9% |
| 5 to 9 Unit Apartments | 41 | 1.2% |
| 10 or more Apartments | 182 | 5.2% |
| Mobile Home / Other | 206 | 5.9% |
| Total | 3,466 | 100.0% |
Housing Structures by Occupancy in Murphysboro
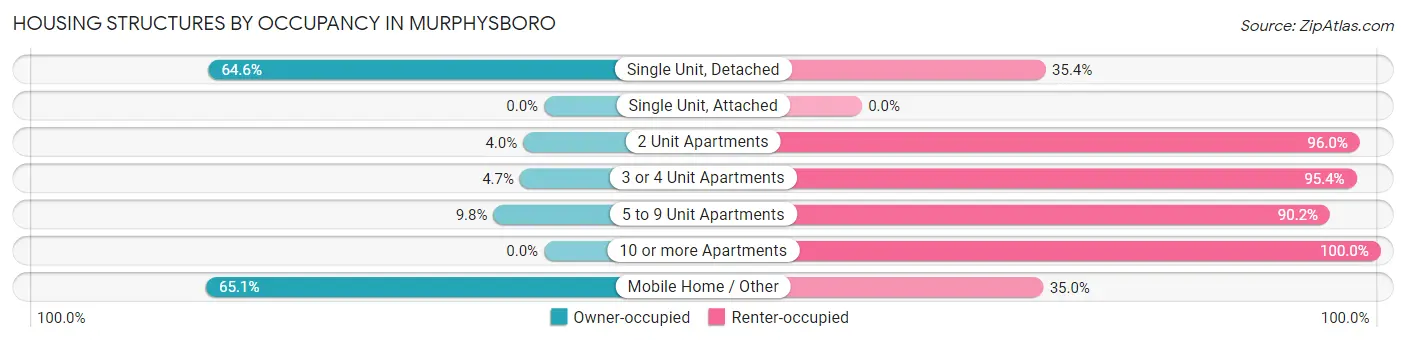
| Structure Type | Owner-occupied | Renter-occupied |
| Single Unit, Detached | 1,483 (64.6%) | 813 (35.4%) |
| Single Unit, Attached | 0 (0.0%) | 0 (0.0%) |
| 2 Unit Apartments | 16 (4.0%) | 381 (96.0%) |
| 3 or 4 Unit Apartments | 16 (4.6%) | 328 (95.4%) |
| 5 to 9 Unit Apartments | 4 (9.8%) | 37 (90.2%) |
| 10 or more Apartments | 0 (0.0%) | 182 (100.0%) |
| Mobile Home / Other | 134 (65.0%) | 72 (34.9%) |
| Total | 1,653 (47.7%) | 1,813 (52.3%) |
Housing Structures by Number of Rooms in Murphysboro
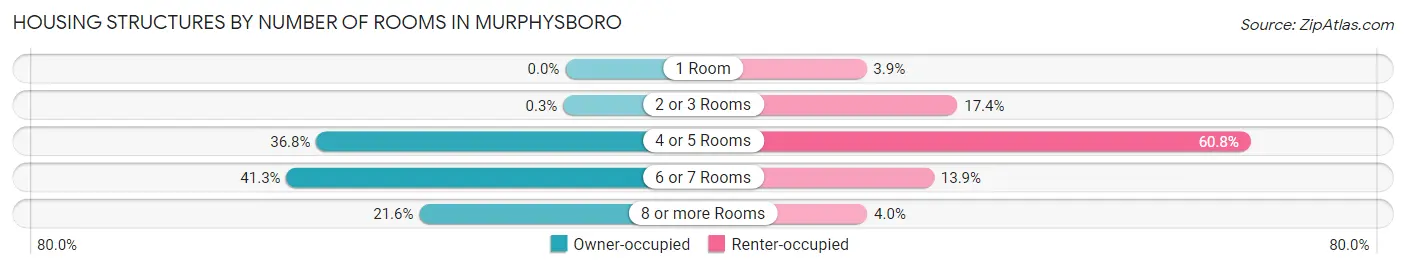
| Number of Rooms | Owner-occupied | Renter-occupied |
| 1 Room | 0 (0.0%) | 71 (3.9%) |
| 2 or 3 Rooms | 5 (0.3%) | 315 (17.4%) |
| 4 or 5 Rooms | 609 (36.8%) | 1,102 (60.8%) |
| 6 or 7 Rooms | 682 (41.3%) | 252 (13.9%) |
| 8 or more Rooms | 357 (21.6%) | 73 (4.0%) |
| Total | 1,653 (100.0%) | 1,813 (100.0%) |
Housing Structure by Heating Type in Murphysboro
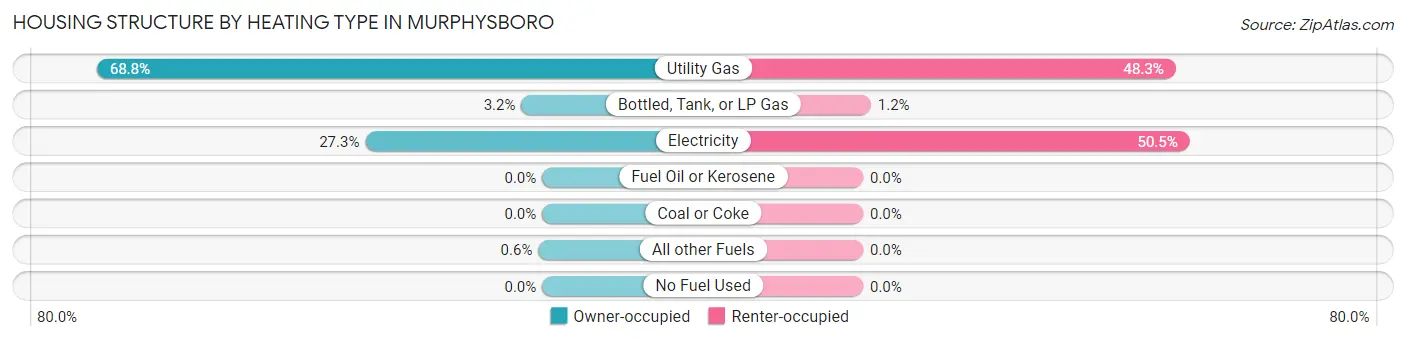
| Heating Type | Owner-occupied | Renter-occupied |
| Utility Gas | 1,138 (68.8%) | 876 (48.3%) |
| Bottled, Tank, or LP Gas | 53 (3.2%) | 22 (1.2%) |
| Electricity | 452 (27.3%) | 915 (50.5%) |
| Fuel Oil or Kerosene | 0 (0.0%) | 0 (0.0%) |
| Coal or Coke | 0 (0.0%) | 0 (0.0%) |
| All other Fuels | 10 (0.6%) | 0 (0.0%) |
| No Fuel Used | 0 (0.0%) | 0 (0.0%) |
| Total | 1,653 (100.0%) | 1,813 (100.0%) |
Household Vehicle Usage in Murphysboro
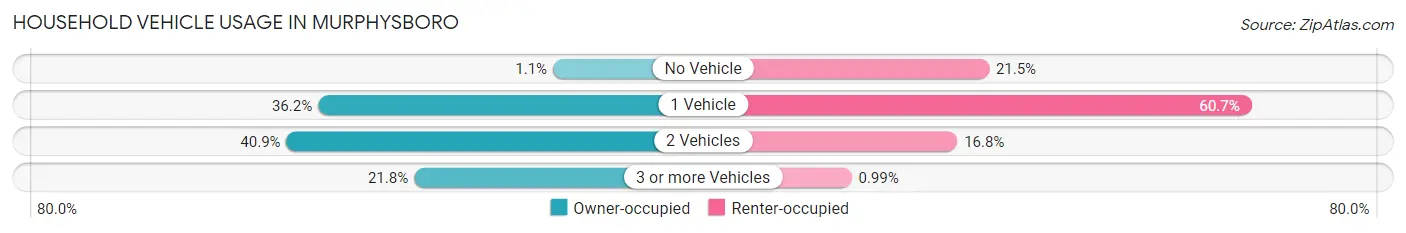
| Vehicles per Household | Owner-occupied | Renter-occupied |
| No Vehicle | 18 (1.1%) | 390 (21.5%) |
| 1 Vehicle | 598 (36.2%) | 1,101 (60.7%) |
| 2 Vehicles | 676 (40.9%) | 304 (16.8%) |
| 3 or more Vehicles | 361 (21.8%) | 18 (1.0%) |
| Total | 1,653 (100.0%) | 1,813 (100.0%) |
Real Estate & Mortgages in Murphysboro
Real Estate and Mortgage Overview in Murphysboro
| Characteristic | Without Mortgage | With Mortgage |
| Housing Units | 795 | 858 |
| Median Property Value | $71,400 | $84,200 |
| Median Household Income | $57,031 | $84 |
| Monthly Housing Costs | $449 | $0 |
| Real Estate Taxes | $1,361 | $38 |
Property Value by Mortgage Status in Murphysboro
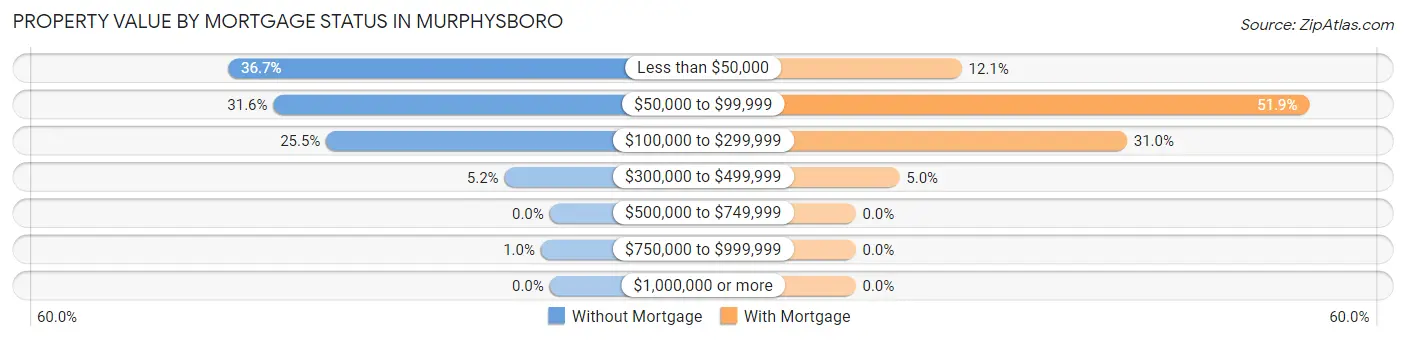
| Property Value | Without Mortgage | With Mortgage |
| Less than $50,000 | 292 (36.7%) | 104 (12.1%) |
| $50,000 to $99,999 | 251 (31.6%) | 445 (51.9%) |
| $100,000 to $299,999 | 203 (25.5%) | 266 (31.0%) |
| $300,000 to $499,999 | 41 (5.2%) | 43 (5.0%) |
| $500,000 to $749,999 | 0 (0.0%) | 0 (0.0%) |
| $750,000 to $999,999 | 8 (1.0%) | 0 (0.0%) |
| $1,000,000 or more | 0 (0.0%) | 0 (0.0%) |
| Total | 795 (100.0%) | 858 (100.0%) |
Household Income by Mortgage Status in Murphysboro
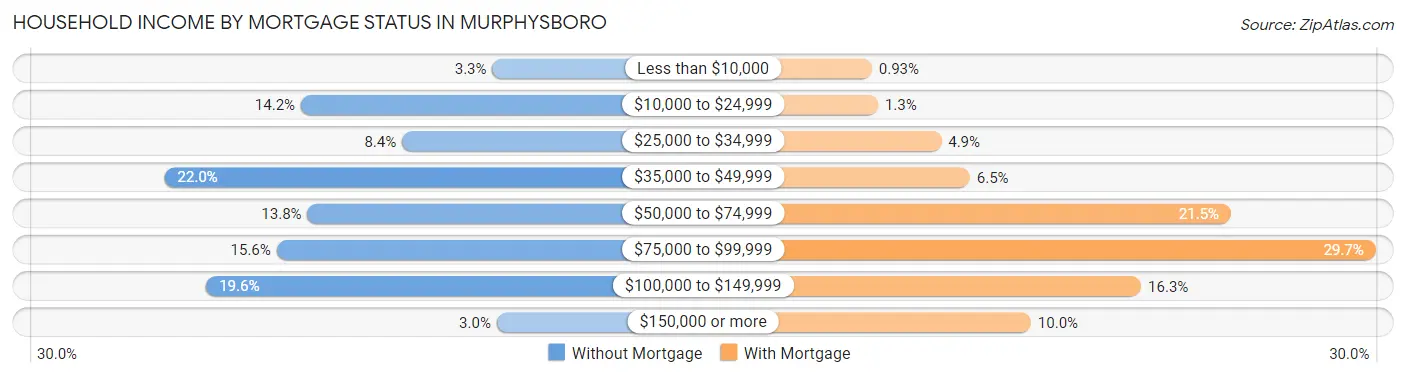
| Household Income | Without Mortgage | With Mortgage |
| Less than $10,000 | 26 (3.3%) | 8 (0.9%) |
| $10,000 to $24,999 | 113 (14.2%) | 11 (1.3%) |
| $25,000 to $34,999 | 67 (8.4%) | 42 (4.9%) |
| $35,000 to $49,999 | 175 (22.0%) | 56 (6.5%) |
| $50,000 to $74,999 | 110 (13.8%) | 184 (21.4%) |
| $75,000 to $99,999 | 124 (15.6%) | 255 (29.7%) |
| $100,000 to $149,999 | 156 (19.6%) | 140 (16.3%) |
| $150,000 or more | 24 (3.0%) | 86 (10.0%) |
| Total | 795 (100.0%) | 858 (100.0%) |
Property Value to Household Income Ratio in Murphysboro
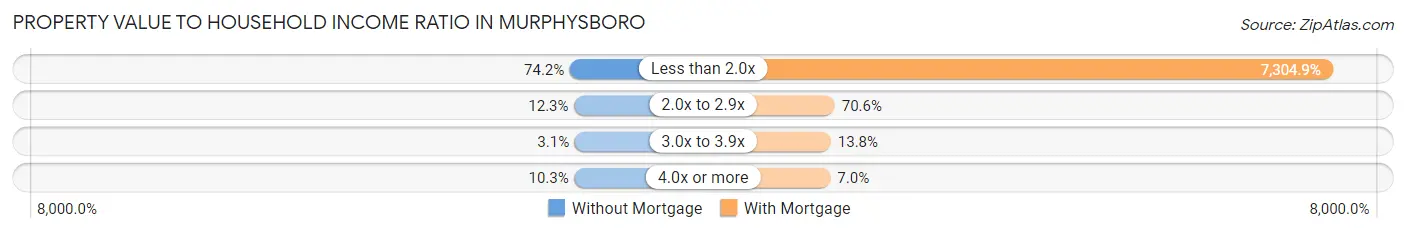
| Value-to-Income Ratio | Without Mortgage | With Mortgage |
| Less than 2.0x | 590 (74.2%) | 62,676 (7,304.9%) |
| 2.0x to 2.9x | 98 (12.3%) | 606 (70.6%) |
| 3.0x to 3.9x | 25 (3.1%) | 118 (13.8%) |
| 4.0x or more | 82 (10.3%) | 60 (7.0%) |
| Total | 795 (100.0%) | 858 (100.0%) |
Real Estate Taxes by Mortgage Status in Murphysboro
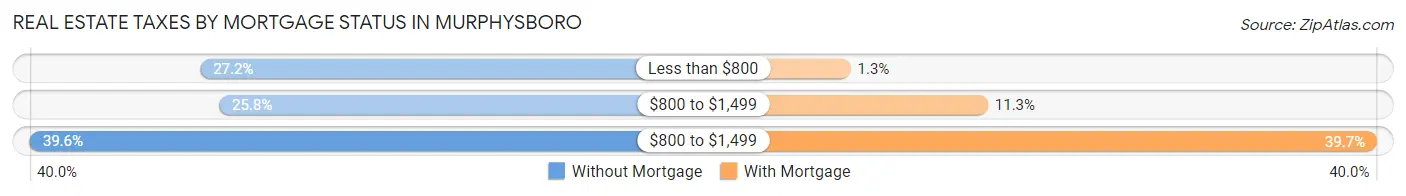
| Property Taxes | Without Mortgage | With Mortgage |
| Less than $800 | 216 (27.2%) | 11 (1.3%) |
| $800 to $1,499 | 205 (25.8%) | 97 (11.3%) |
| $800 to $1,499 | 315 (39.6%) | 341 (39.7%) |
| Total | 795 (100.0%) | 858 (100.0%) |
Health & Disability in Murphysboro
Health Insurance Coverage by Age in Murphysboro
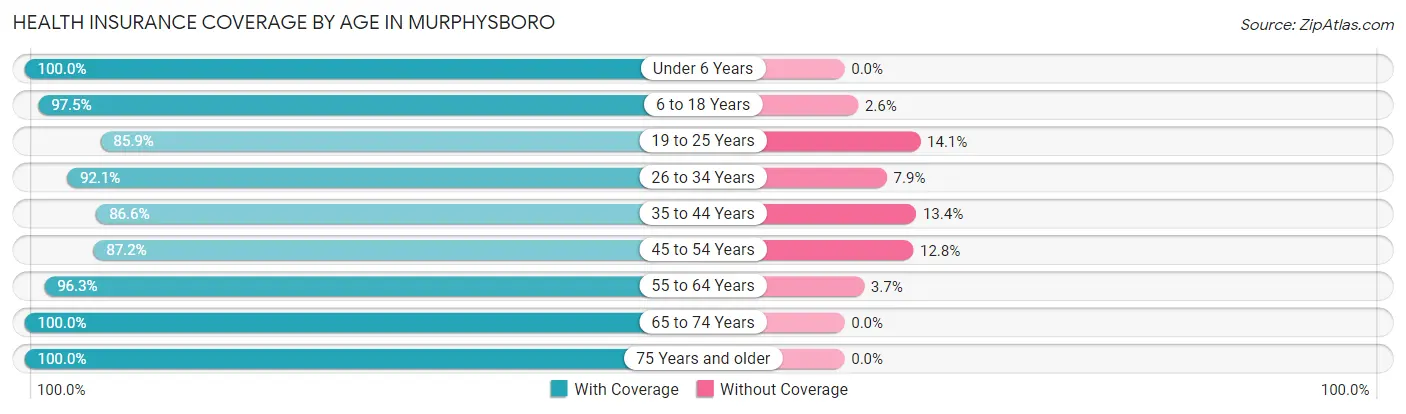
| Age Bracket | With Coverage | Without Coverage |
| Under 6 Years | 607 (100.0%) | 0 (0.0%) |
| 6 to 18 Years | 1,070 (97.5%) | 28 (2.5%) |
| 19 to 25 Years | 431 (85.9%) | 71 (14.1%) |
| 26 to 34 Years | 641 (92.1%) | 55 (7.9%) |
| 35 to 44 Years | 875 (86.6%) | 135 (13.4%) |
| 45 to 54 Years | 551 (87.2%) | 81 (12.8%) |
| 55 to 64 Years | 764 (96.3%) | 29 (3.7%) |
| 65 to 74 Years | 850 (100.0%) | 0 (0.0%) |
| 75 Years and older | 756 (100.0%) | 0 (0.0%) |
| Total | 6,545 (94.3%) | 399 (5.8%) |
Health Insurance Coverage by Citizenship Status in Murphysboro
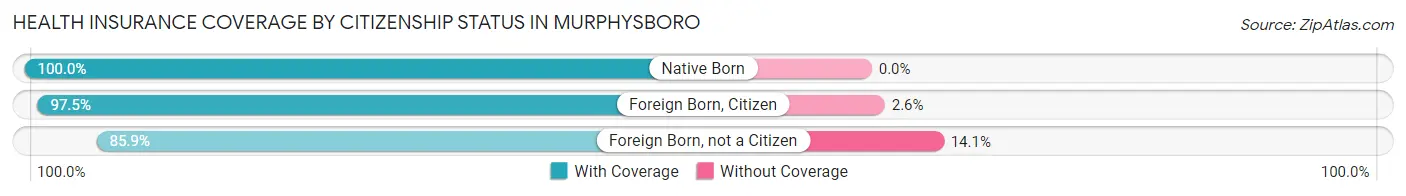
| Citizenship Status | With Coverage | Without Coverage |
| Native Born | 607 (100.0%) | 0 (0.0%) |
| Foreign Born, Citizen | 1,070 (97.5%) | 28 (2.5%) |
| Foreign Born, not a Citizen | 431 (85.9%) | 71 (14.1%) |
Health Insurance Coverage by Household Income in Murphysboro
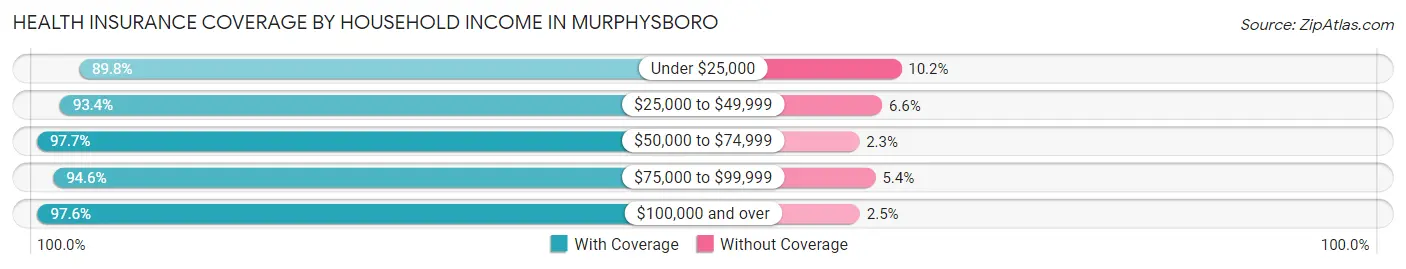
| Household Income | With Coverage | Without Coverage |
| Under $25,000 | 1,380 (89.8%) | 157 (10.2%) |
| $25,000 to $49,999 | 1,784 (93.4%) | 126 (6.6%) |
| $50,000 to $74,999 | 1,300 (97.7%) | 31 (2.3%) |
| $75,000 to $99,999 | 1,074 (94.6%) | 61 (5.4%) |
| $100,000 and over | 956 (97.6%) | 24 (2.5%) |
Public vs Private Health Insurance Coverage by Age in Murphysboro
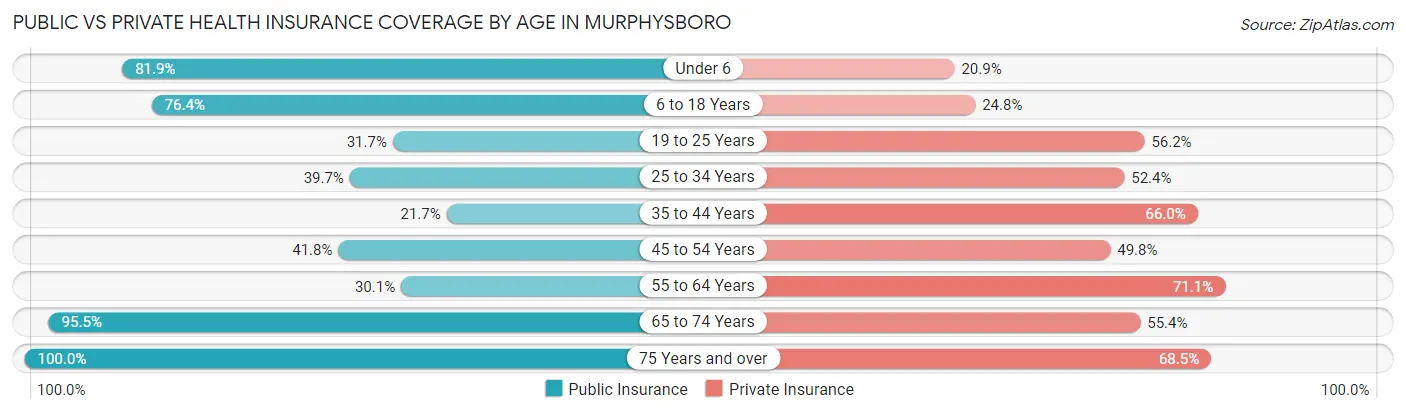
| Age Bracket | Public Insurance | Private Insurance |
| Under 6 | 497 (81.9%) | 127 (20.9%) |
| 6 to 18 Years | 839 (76.4%) | 272 (24.8%) |
| 19 to 25 Years | 159 (31.7%) | 282 (56.2%) |
| 25 to 34 Years | 276 (39.7%) | 365 (52.4%) |
| 35 to 44 Years | 219 (21.7%) | 667 (66.0%) |
| 45 to 54 Years | 264 (41.8%) | 315 (49.8%) |
| 55 to 64 Years | 239 (30.1%) | 564 (71.1%) |
| 65 to 74 Years | 812 (95.5%) | 471 (55.4%) |
| 75 Years and over | 756 (100.0%) | 518 (68.5%) |
| Total | 4,061 (58.5%) | 3,581 (51.6%) |
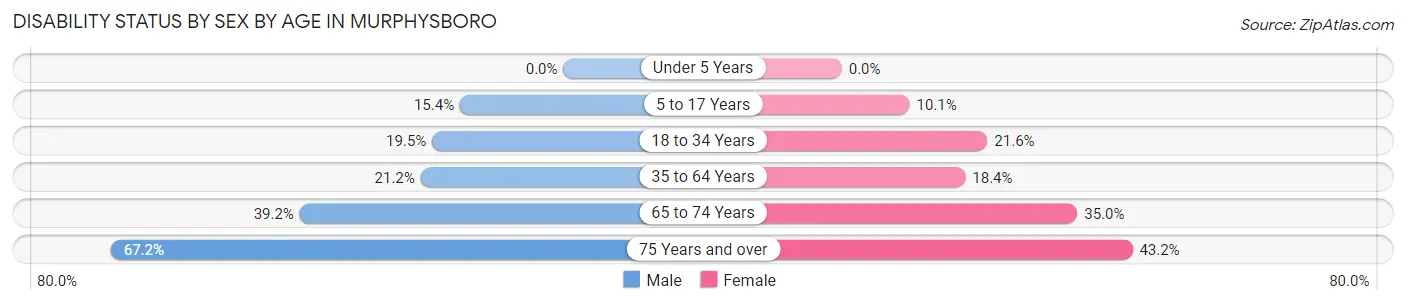
Disability Status by Sex by Age in Murphysboro
| Age Bracket | Male | Female |
| Under 5 Years | 0 (0.0%) | 0 (0.0%) |
| 5 to 17 Years | 78 (15.3%) | 58 (10.1%) |
| 18 to 34 Years | 90 (19.5%) | 179 (21.6%) |
| 35 to 64 Years | 269 (21.2%) | 214 (18.3%) |
| 65 to 74 Years | 157 (39.2%) | 157 (35.0%) |
| 75 Years and over | 125 (67.2%) | 246 (43.2%) |
Disability Class by Sex by Age in Murphysboro
Disability Class: Hearing Difficulty
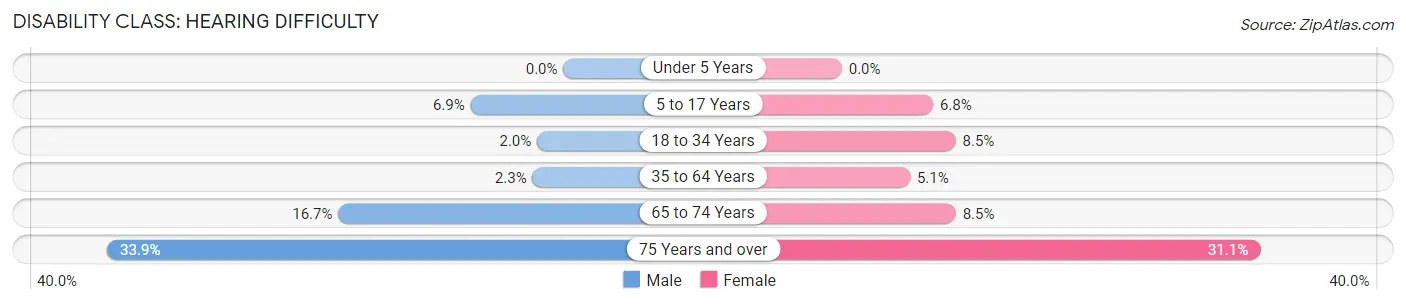
| Age Bracket | Male | Female |
| Under 5 Years | 0 (0.0%) | 0 (0.0%) |
| 5 to 17 Years | 35 (6.9%) | 39 (6.8%) |
| 18 to 34 Years | 9 (1.9%) | 70 (8.5%) |
| 35 to 64 Years | 29 (2.3%) | 59 (5.1%) |
| 65 to 74 Years | 67 (16.7%) | 38 (8.5%) |
| 75 Years and over | 63 (33.9%) | 177 (31.0%) |
Disability Class: Vision Difficulty
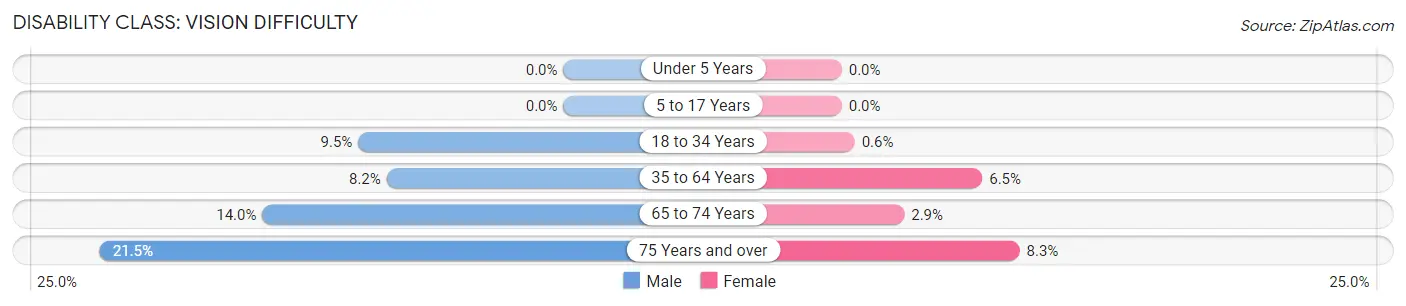
| Age Bracket | Male | Female |
| Under 5 Years | 0 (0.0%) | 0 (0.0%) |
| 5 to 17 Years | 0 (0.0%) | 0 (0.0%) |
| 18 to 34 Years | 44 (9.5%) | 5 (0.6%) |
| 35 to 64 Years | 104 (8.2%) | 76 (6.5%) |
| 65 to 74 Years | 56 (14.0%) | 13 (2.9%) |
| 75 Years and over | 40 (21.5%) | 47 (8.3%) |
Disability Class: Cognitive Difficulty
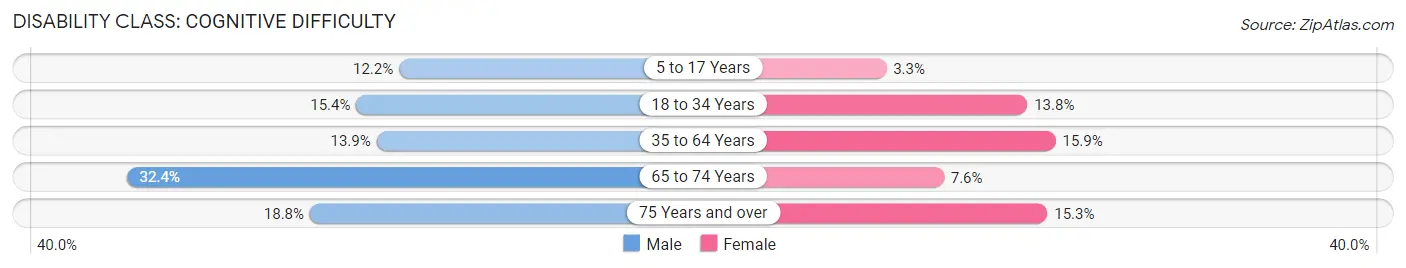
| Age Bracket | Male | Female |
| 5 to 17 Years | 62 (12.2%) | 19 (3.3%) |
| 18 to 34 Years | 71 (15.4%) | 114 (13.8%) |
| 35 to 64 Years | 176 (13.9%) | 185 (15.9%) |
| 65 to 74 Years | 130 (32.4%) | 34 (7.6%) |
| 75 Years and over | 35 (18.8%) | 87 (15.3%) |
Disability Class: Ambulatory Difficulty
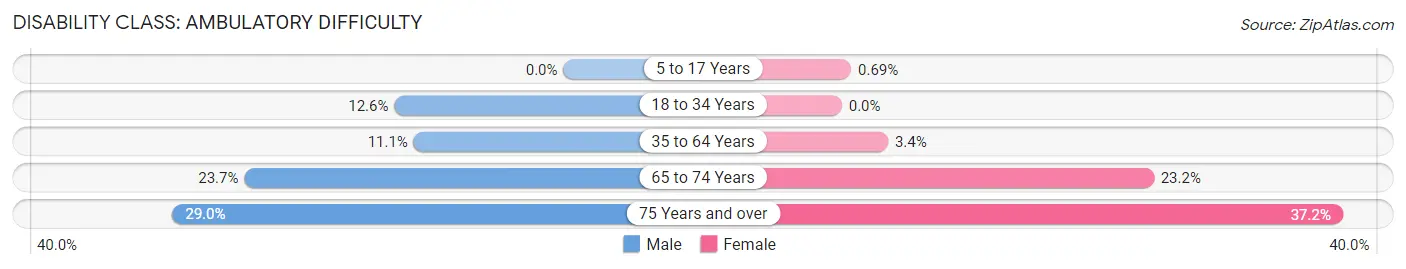
| Age Bracket | Male | Female |
| 5 to 17 Years | 0 (0.0%) | 4 (0.7%) |
| 18 to 34 Years | 58 (12.6%) | 0 (0.0%) |
| 35 to 64 Years | 141 (11.1%) | 40 (3.4%) |
| 65 to 74 Years | 95 (23.7%) | 104 (23.2%) |
| 75 Years and over | 54 (29.0%) | 212 (37.2%) |
Disability Class: Self-Care Difficulty
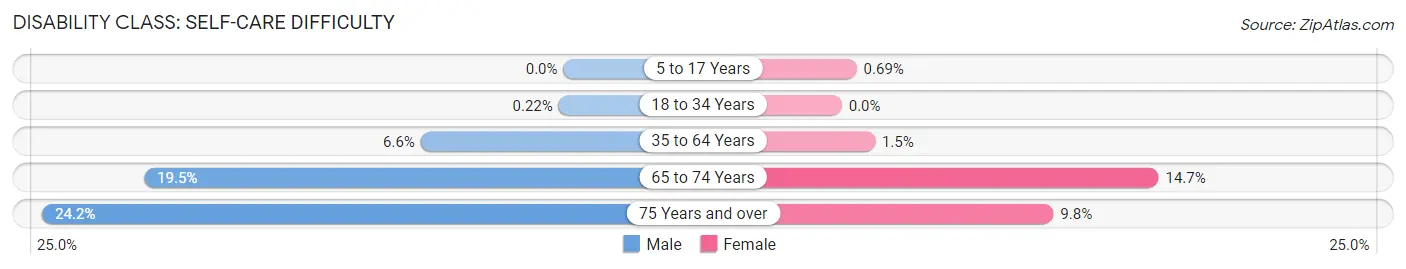
| Age Bracket | Male | Female |
| 5 to 17 Years | 0 (0.0%) | 4 (0.7%) |
| 18 to 34 Years | 1 (0.2%) | 0 (0.0%) |
| 35 to 64 Years | 84 (6.6%) | 18 (1.5%) |
| 65 to 74 Years | 78 (19.5%) | 66 (14.7%) |
| 75 Years and over | 45 (24.2%) | 56 (9.8%) |
Technology Access in Murphysboro
Computing Device Access in Murphysboro
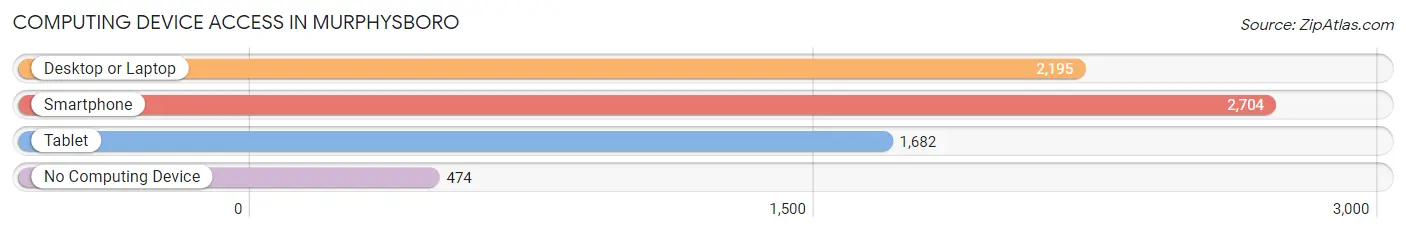
| Device Type | # Households | % Households |
| Desktop or Laptop | 2,195 | 63.3% |
| Smartphone | 2,704 | 78.0% |
| Tablet | 1,682 | 48.5% |
| No Computing Device | 474 | 13.7% |
| Total | 3,466 | 100.0% |
Internet Access in Murphysboro
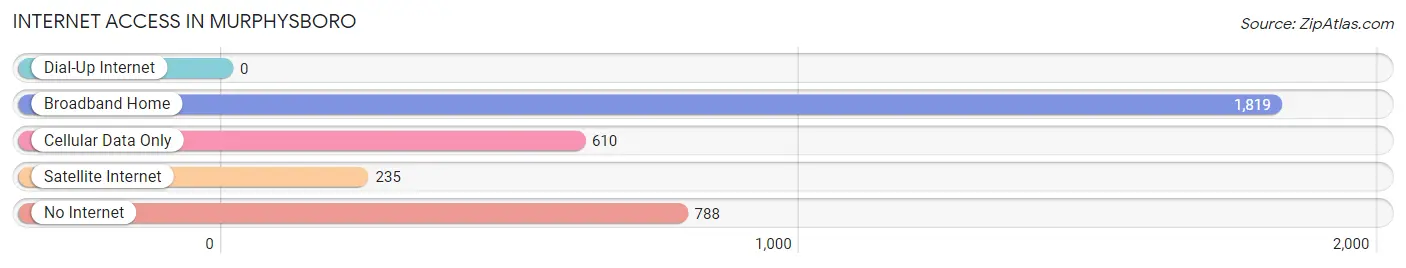
| Internet Type | # Households | % Households |
| Dial-Up Internet | 0 | 0.0% |
| Broadband Home | 1,819 | 52.5% |
| Cellular Data Only | 610 | 17.6% |
| Satellite Internet | 235 | 6.8% |
| No Internet | 788 | 22.7% |
| Total | 3,466 | 100.0% |
Murphysboro Summary
Murphysboro, Illinois is a small city located in Jackson County, in the southern part of the state. It is situated along the banks of the Big Muddy River, and is the county seat of Jackson County. The city has a population of 8,633 as of the 2010 census, and is the largest city in the county.
History
The area that is now Murphysboro was first settled in 1803 by John and William Murphy, two brothers from Kentucky. The brothers purchased the land from the federal government, and the town was named after them. The town was officially incorporated in 1843, and the first post office was established in 1844.
In the late 19th century, Murphysboro became an important center for the coal mining industry. The city was home to several coal mines, and the industry provided jobs for many of the city's residents. The coal industry declined in the early 20th century, and the city's economy shifted to other industries, such as manufacturing and agriculture.
Geography
Murphysboro is located in the southern part of Illinois, in Jackson County. It is situated along the banks of the Big Muddy River, and is about 30 miles south of Carbondale. The city has a total area of 4.2 square miles, all of which is land.
The city has a humid continental climate, with hot, humid summers and cold, snowy winters. The average annual temperature is 54 degrees Fahrenheit, and the average annual precipitation is 40 inches.
Economy
The economy of Murphysboro is largely based on agriculture and manufacturing. The city is home to several manufacturing companies, including a paper mill, a plastics factory, and a food processing plant. Agriculture is also an important part of the local economy, with corn, soybeans, and wheat being the main crops.
The city is also home to several retail stores, restaurants, and other businesses. The city is served by the Murphysboro-Jackson County Airport, which provides air service to the surrounding area.
Demographics
As of the 2010 census, the population of Murphysboro was 8,633. The racial makeup of the city was 87.3% White, 8.2% African American, 0.5% Native American, 0.7% Asian, 0.1% Pacific Islander, 1.2% from other races, and 2.0% from two or more races. Hispanic or Latino of any race were 3.2% of the population.
The median household income in Murphysboro was $37,917, and the median family income was $45,938. The per capita income was $19,945. About 15.3% of the population was below the poverty line.
Murphysboro is served by the Murphysboro Community Unit School District 186, which includes two elementary schools, one middle school, and one high school. The city is also home to several private schools, including a Catholic school and a Christian school.
Common Questions
What is Per Capita Income in Murphysboro?
Per Capita income in Murphysboro is $26,571.
What is the Median Family Income in Murphysboro?
Median Family Income in Murphysboro is $50,750.
What is the Median Household income in Murphysboro?
Median Household Income in Murphysboro is $41,535.
What is Income or Wage Gap in Murphysboro?
Income or Wage Gap in Murphysboro is 17.1%.
Women in Murphysboro earn 82.9 cents for every dollar earned by a man.
What is Inequality or Gini Index in Murphysboro?
Inequality or Gini Index in Murphysboro is 0.40.
What is the Total Population of Murphysboro?
Total Population of Murphysboro is 7,101.
What is the Total Male Population of Murphysboro?
Total Male Population of Murphysboro is 3,158.
What is the Total Female Population of Murphysboro?
Total Female Population of Murphysboro is 3,943.
What is the Ratio of Males per 100 Females in Murphysboro?
There are 80.09 Males per 100 Females in Murphysboro.
What is the Ratio of Females per 100 Males in Murphysboro?
There are 124.86 Females per 100 Males in Murphysboro.
What is the Median Population Age in Murphysboro?
Median Population Age in Murphysboro is 40.0 Years.
What is the Average Family Size in Murphysboro
Average Family Size in Murphysboro is 2.8 People.
What is the Average Household Size in Murphysboro
Average Household Size in Murphysboro is 2.0 People.
How Large is the Labor Force in Murphysboro?
There are 3,201 People in the Labor Forcein in Murphysboro.
What is the Percentage of People in the Labor Force in Murphysboro?
57.2% of People are in the Labor Force in Murphysboro.
What is the Unemployment Rate in Murphysboro?
Unemployment Rate in Murphysboro is 8.8%.