Kenney, IL Map & Demographics
Kenney Map
Kenney Overview
$42,240
PER CAPITA INCOME
$78,214
AVG FAMILY INCOME
$74,125
AVG HOUSEHOLD INCOME
$15,400
FAMILY INCOME DEFICIT
0.32
INEQUALITY / GINI INDEX
369
TOTAL POPULATION
206
MALE POPULATION
163
FEMALE POPULATION
126.38
MALES / 100 FEMALES
79.13
FEMALES / 100 MALES
59.7
MEDIAN AGE
2.6
AVG FAMILY SIZE
1.6
AVG HOUSEHOLD SIZE
141
LABOR FORCE [ PEOPLE ]
42.6%
PERCENT IN LABOR FORCE
14.2%
UNEMPLOYMENT RATE
Kenney Zip Codes
Kenney Area Codes
Income in Kenney
Income Overview in Kenney
Per Capita Income in Kenney is $42,240, while median incomes of families and households are $78,214 and $74,125 respectively.
| Characteristic | Number | Measure |
| Per Capita Income | 369 | $42,240 |
| Median Family Income | 82 | $78,214 |
| Mean Family Income | 82 | $77,963 |
| Median Household Income | 227 | $74,125 |
| Mean Household Income | 227 | $71,425 |
| Income Deficit | 82 | $15,400 |
| Wage / Income Gap (%) | 369 | 0.00% |
| Wage / Income Gap ($) | 369 | 100.00¢ per $1 |
| Gini / Inequality Index | 369 | 0.32 |
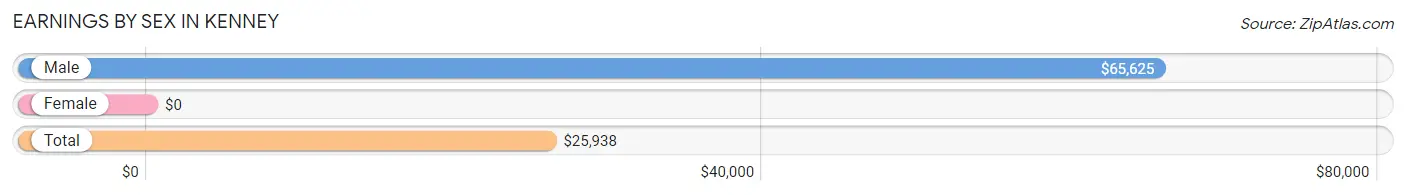
Earnings by Sex in Kenney
| Sex | Number | Average Earnings |
| Male | 64 (49.6%) | $65,625 |
| Female | 65 (50.4%) | $0 |
| Total | 129 (100.0%) | $25,938 |
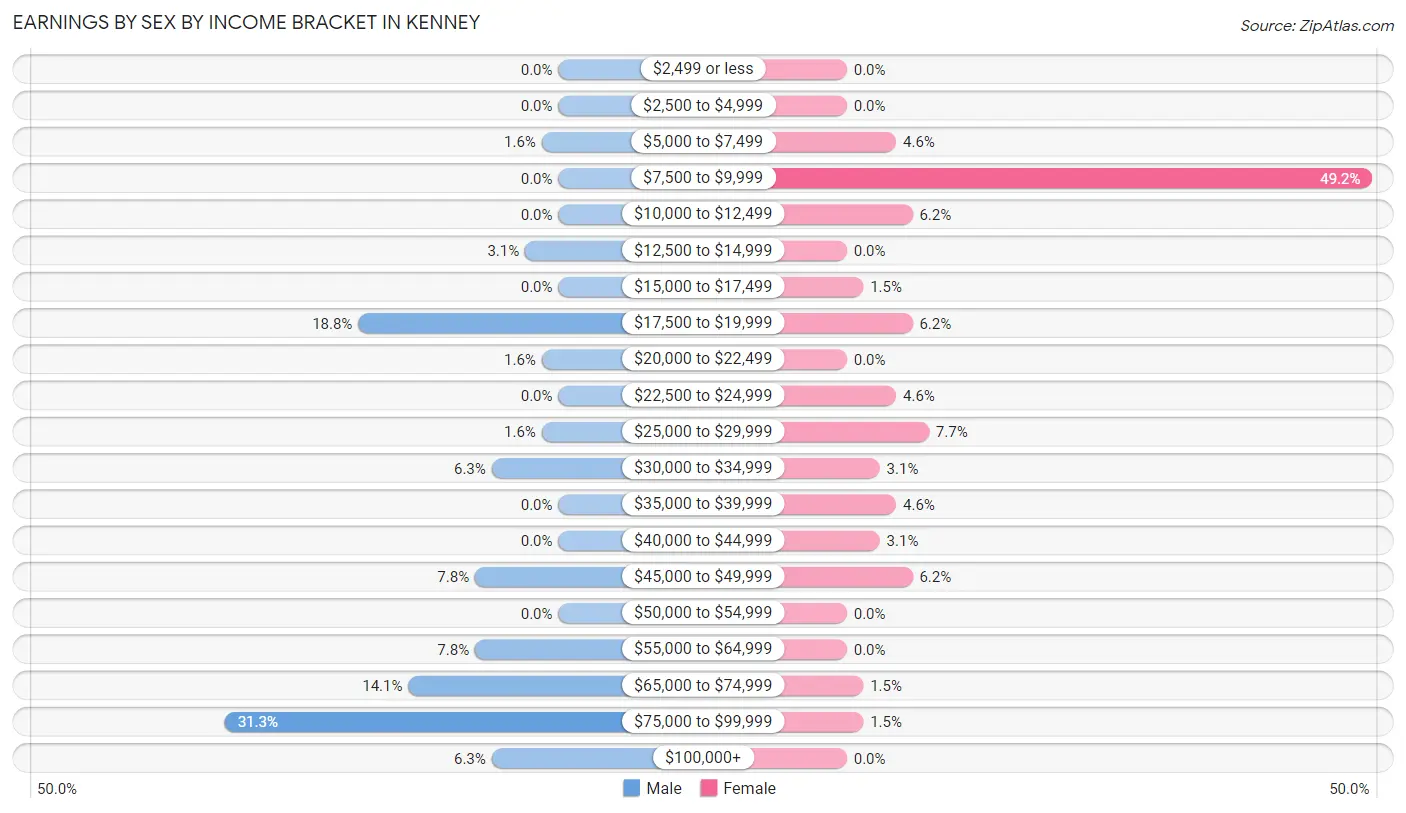
Earnings by Sex by Income Bracket in Kenney
The most common earnings brackets in Kenney are $75,000 to $99,999 for men (20 | 31.2%) and $7,500 to $9,999 for women (32 | 49.2%).
| Income | Male | Female |
| $2,499 or less | 0 (0.0%) | 0 (0.0%) |
| $2,500 to $4,999 | 0 (0.0%) | 0 (0.0%) |
| $5,000 to $7,499 | 1 (1.6%) | 3 (4.6%) |
| $7,500 to $9,999 | 0 (0.0%) | 32 (49.2%) |
| $10,000 to $12,499 | 0 (0.0%) | 4 (6.1%) |
| $12,500 to $14,999 | 2 (3.1%) | 0 (0.0%) |
| $15,000 to $17,499 | 0 (0.0%) | 1 (1.5%) |
| $17,500 to $19,999 | 12 (18.8%) | 4 (6.1%) |
| $20,000 to $22,499 | 1 (1.6%) | 0 (0.0%) |
| $22,500 to $24,999 | 0 (0.0%) | 3 (4.6%) |
| $25,000 to $29,999 | 1 (1.6%) | 5 (7.7%) |
| $30,000 to $34,999 | 4 (6.2%) | 2 (3.1%) |
| $35,000 to $39,999 | 0 (0.0%) | 3 (4.6%) |
| $40,000 to $44,999 | 0 (0.0%) | 2 (3.1%) |
| $45,000 to $49,999 | 5 (7.8%) | 4 (6.1%) |
| $50,000 to $54,999 | 0 (0.0%) | 0 (0.0%) |
| $55,000 to $64,999 | 5 (7.8%) | 0 (0.0%) |
| $65,000 to $74,999 | 9 (14.1%) | 1 (1.5%) |
| $75,000 to $99,999 | 20 (31.2%) | 1 (1.5%) |
| $100,000+ | 4 (6.2%) | 0 (0.0%) |
| Total | 64 (100.0%) | 65 (100.0%) |
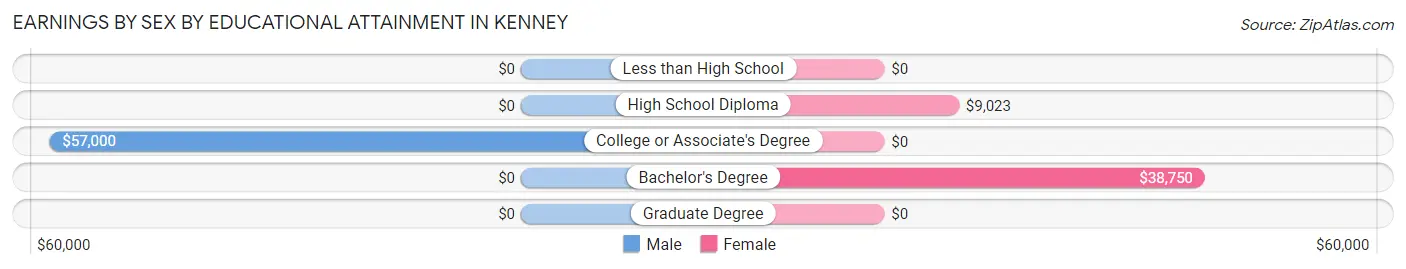
Earnings by Sex by Educational Attainment in Kenney
| Educational Attainment | Male Income | Female Income |
| Less than High School | - | - |
| High School Diploma | - | - |
| College or Associate's Degree | $57,000 | $0 |
| Bachelor's Degree | - | - |
| Graduate Degree | - | - |
| Total | $65,417 | $0 |
Family Income in Kenney
Family Income Brackets in Kenney
According to the Kenney family income data, there are 26 families falling into the $100,000 to $149,999 income range, which is the most common income bracket and makes up 31.7% of all families.
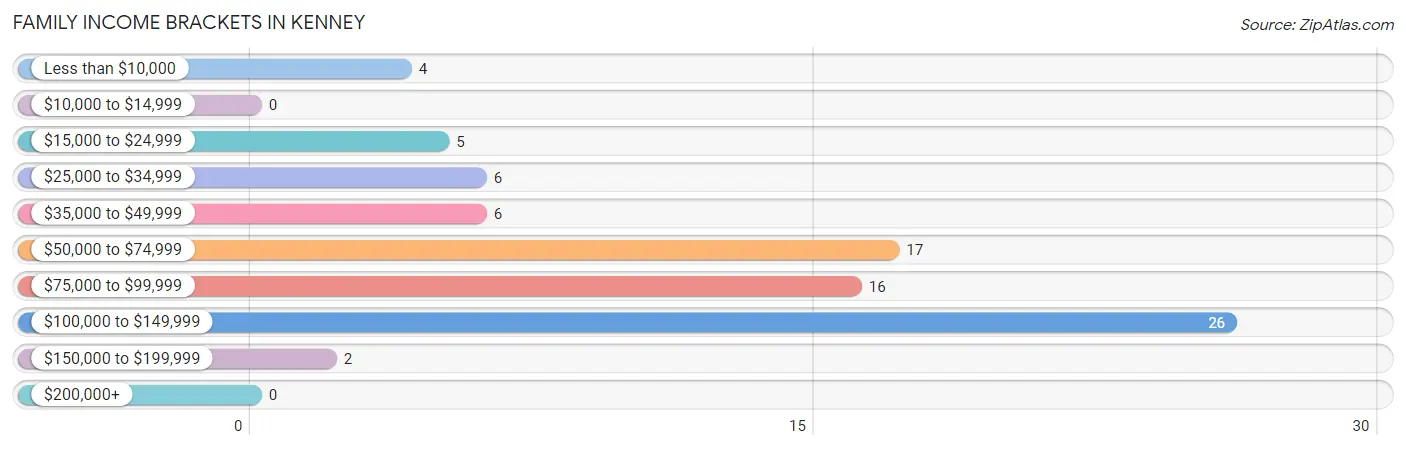
| Income Bracket | # Families | % Families |
| Less than $10,000 | 4 | 4.9% |
| $10,000 to $14,999 | 0 | 0.0% |
| $15,000 to $24,999 | 5 | 6.1% |
| $25,000 to $34,999 | 6 | 7.3% |
| $35,000 to $49,999 | 6 | 7.3% |
| $50,000 to $74,999 | 17 | 20.7% |
| $75,000 to $99,999 | 16 | 19.5% |
| $100,000 to $149,999 | 26 | 31.7% |
| $150,000 to $199,999 | 2 | 2.4% |
| $200,000+ | 0 | 0.0% |
Family Income by Famaliy Size in Kenney
3-person families (31 | 37.8%) account for the highest median family income in Kenney with $78,750 per family, while 2-person families (43 | 52.4%) have the highest median income of $32,188 per family member.
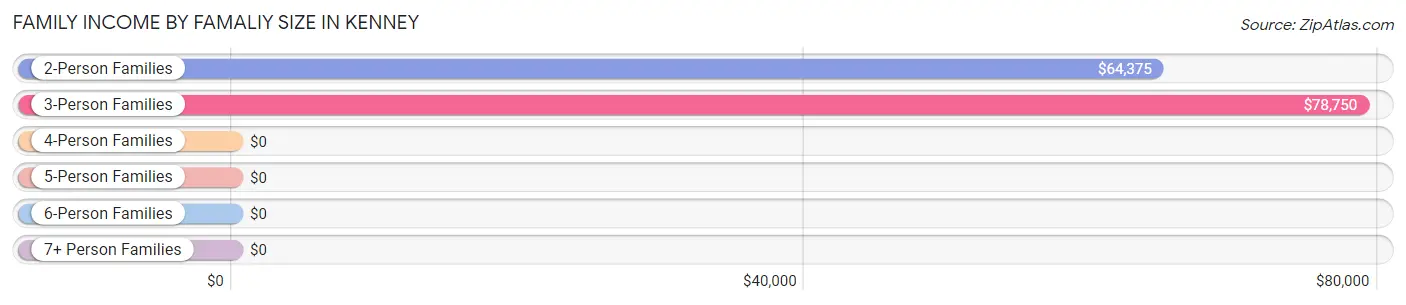
| Income Bracket | # Families | Median Income |
| 2-Person Families | 43 (52.4%) | $64,375 |
| 3-Person Families | 31 (37.8%) | $78,750 |
| 4-Person Families | 5 (6.1%) | $0 |
| 5-Person Families | 1 (1.2%) | $0 |
| 6-Person Families | 2 (2.4%) | $0 |
| 7+ Person Families | 0 (0.0%) | $0 |
| Total | 82 (100.0%) | $78,214 |
Family Income by Number of Earners in Kenney
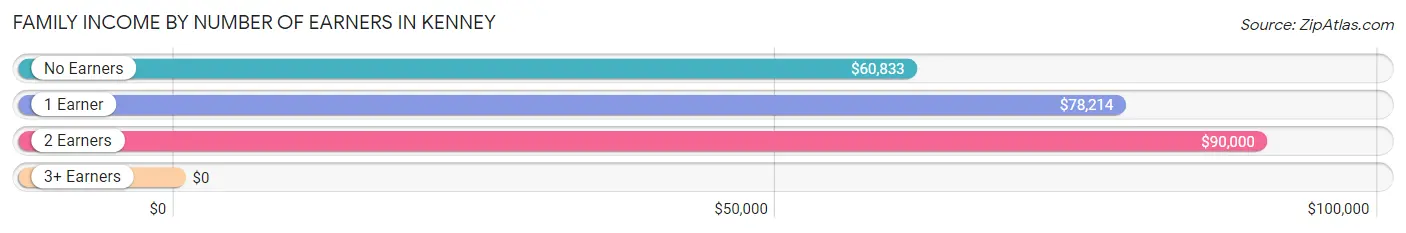
| Number of Earners | # Families | Median Income |
| No Earners | 26 (31.7%) | $60,833 |
| 1 Earner | 40 (48.8%) | $78,214 |
| 2 Earners | 16 (19.5%) | $90,000 |
| 3+ Earners | 0 (0.0%) | $0 |
| Total | 82 (100.0%) | $78,214 |
Household Income in Kenney
Household Income Brackets in Kenney
With 84 households falling in the category, the $100,000 to $149,999 income range is the most frequent in Kenney, accounting for 37.0% of all households.
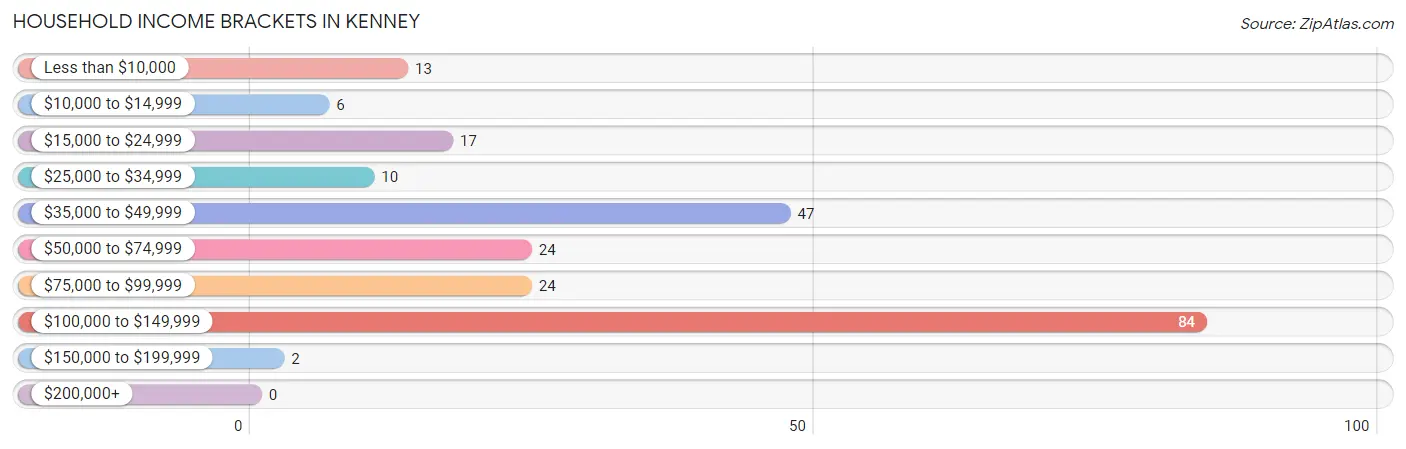
| Income Bracket | # Households | % Households |
| Less than $10,000 | 13 | 5.7% |
| $10,000 to $14,999 | 6 | 2.6% |
| $15,000 to $24,999 | 17 | 7.5% |
| $25,000 to $34,999 | 10 | 4.4% |
| $35,000 to $49,999 | 47 | 20.7% |
| $50,000 to $74,999 | 24 | 10.6% |
| $75,000 to $99,999 | 24 | 10.6% |
| $100,000 to $149,999 | 84 | 37.0% |
| $150,000 to $199,999 | 2 | 0.9% |
| $200,000+ | 0 | 0.0% |
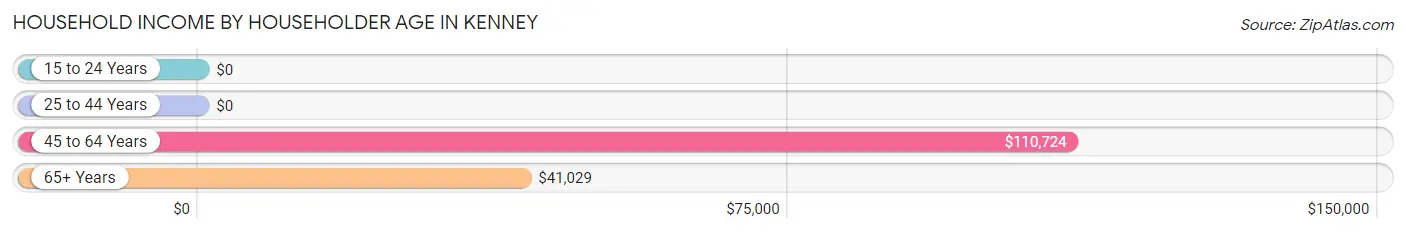
Household Income by Householder Age in Kenney
The median household income in Kenney is $74,125, with the highest median household income of $110,724 found in the 45 to 64 years age bracket for the primary householder. A total of 103 households (45.4%) fall into this category. Meanwhile, the 15 to 24 years age bracket for the primary householder has the lowest median household income of $0, with 3 households (1.3%) in this group.
| Income Bracket | # Households | Median Income |
| 15 to 24 Years | 3 (1.3%) | $0 |
| 25 to 44 Years | 41 (18.1%) | $0 |
| 45 to 64 Years | 103 (45.4%) | $110,724 |
| 65+ Years | 80 (35.2%) | $41,029 |
| Total | 227 (100.0%) | $74,125 |
Poverty in Kenney
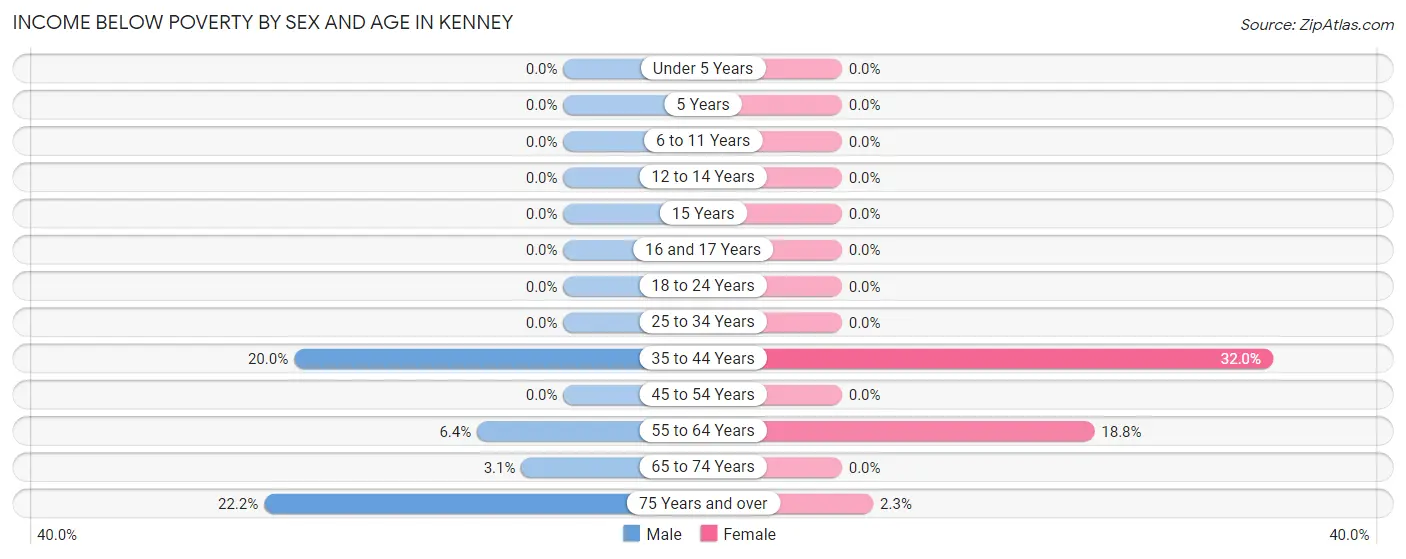
Income Below Poverty by Sex and Age in Kenney
With 6.3% poverty level for males and 7.4% for females among the residents of Kenney, 75 year old and over males and 35 to 44 year old females are the most vulnerable to poverty, with 2 males (22.2%) and 8 females (32.0%) in their respective age groups living below the poverty level.
| Age Bracket | Male | Female |
| Under 5 Years | 0 (0.0%) | 0 (0.0%) |
| 5 Years | 0 (0.0%) | 0 (0.0%) |
| 6 to 11 Years | 0 (0.0%) | 0 (0.0%) |
| 12 to 14 Years | 0 (0.0%) | 0 (0.0%) |
| 15 Years | 0 (0.0%) | 0 (0.0%) |
| 16 and 17 Years | 0 (0.0%) | 0 (0.0%) |
| 18 to 24 Years | 0 (0.0%) | 0 (0.0%) |
| 25 to 34 Years | 0 (0.0%) | 0 (0.0%) |
| 35 to 44 Years | 5 (20.0%) | 8 (32.0%) |
| 45 to 54 Years | 0 (0.0%) | 0 (0.0%) |
| 55 to 64 Years | 5 (6.4%) | 3 (18.8%) |
| 65 to 74 Years | 1 (3.1%) | 0 (0.0%) |
| 75 Years and over | 2 (22.2%) | 1 (2.3%) |
| Total | 13 (6.3%) | 12 (7.4%) |
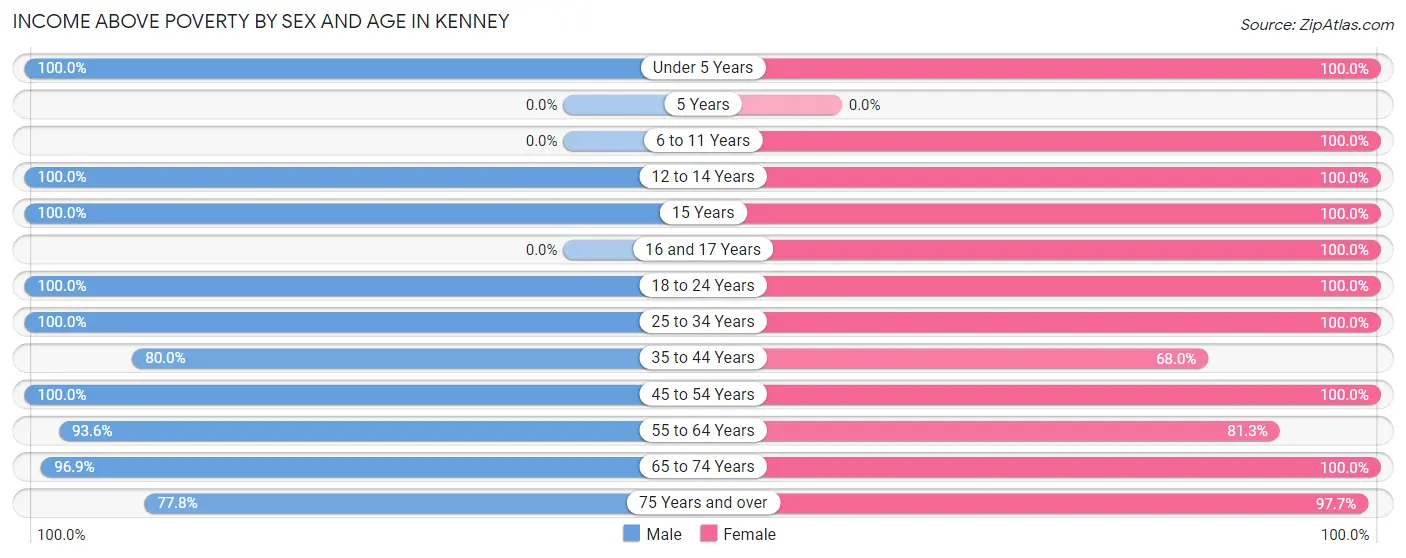
Income Above Poverty by Sex and Age in Kenney
According to the poverty statistics in Kenney, males aged under 5 years and females aged under 5 years are the age groups that are most secure financially, with 100.0% of males and 100.0% of females in these age groups living above the poverty line.
| Age Bracket | Male | Female |
| Under 5 Years | 9 (100.0%) | 11 (100.0%) |
| 5 Years | 0 (0.0%) | 0 (0.0%) |
| 6 to 11 Years | 0 (0.0%) | 4 (100.0%) |
| 12 to 14 Years | 3 (100.0%) | 8 (100.0%) |
| 15 Years | 2 (100.0%) | 1 (100.0%) |
| 16 and 17 Years | 0 (0.0%) | 4 (100.0%) |
| 18 to 24 Years | 11 (100.0%) | 7 (100.0%) |
| 25 to 34 Years | 17 (100.0%) | 6 (100.0%) |
| 35 to 44 Years | 20 (80.0%) | 17 (68.0%) |
| 45 to 54 Years | 20 (100.0%) | 17 (100.0%) |
| 55 to 64 Years | 73 (93.6%) | 13 (81.2%) |
| 65 to 74 Years | 31 (96.9%) | 21 (100.0%) |
| 75 Years and over | 7 (77.8%) | 42 (97.7%) |
| Total | 193 (93.7%) | 151 (92.6%) |
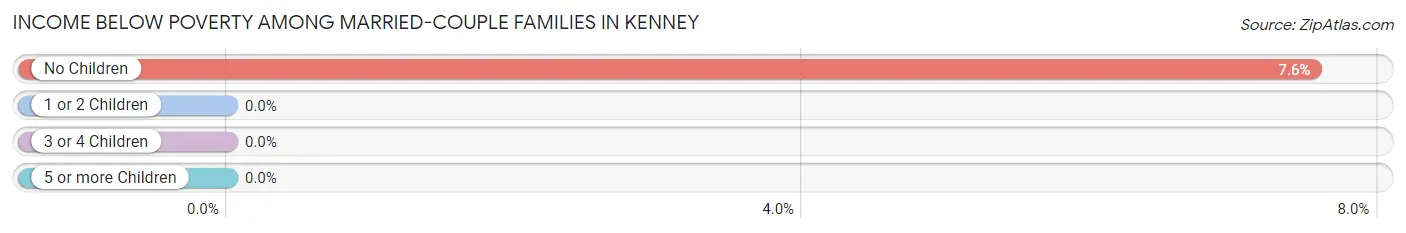
Income Below Poverty Among Married-Couple Families in Kenney
The poverty statistics for married-couple families in Kenney show that 5.8% or 4 of the total 69 families live below the poverty line. Families with no children have the highest poverty rate of 7.5%, comprising of 4 families. On the other hand, families with 1 or 2 children have the lowest poverty rate of 0.0%, which includes 0 families.
| Children | Above Poverty | Below Poverty |
| No Children | 49 (92.4%) | 4 (7.5%) |
| 1 or 2 Children | 13 (100.0%) | 0 (0.0%) |
| 3 or 4 Children | 3 (100.0%) | 0 (0.0%) |
| 5 or more Children | 0 (0.0%) | 0 (0.0%) |
| Total | 65 (94.2%) | 4 (5.8%) |
Income Below Poverty Among Single-Parent Households in Kenney
| Children | Single Father | Single Mother |
| No Children | 0 (0.0%) | 0 (0.0%) |
| 1 or 2 Children | 0 (0.0%) | 0 (0.0%) |
| 3 or 4 Children | 0 (0.0%) | 0 (0.0%) |
| 5 or more Children | 0 (0.0%) | 0 (0.0%) |
| Total | 0 (0.0%) | 0 (0.0%) |
Income Below Poverty Among Married-Couple vs Single-Parent Households in Kenney
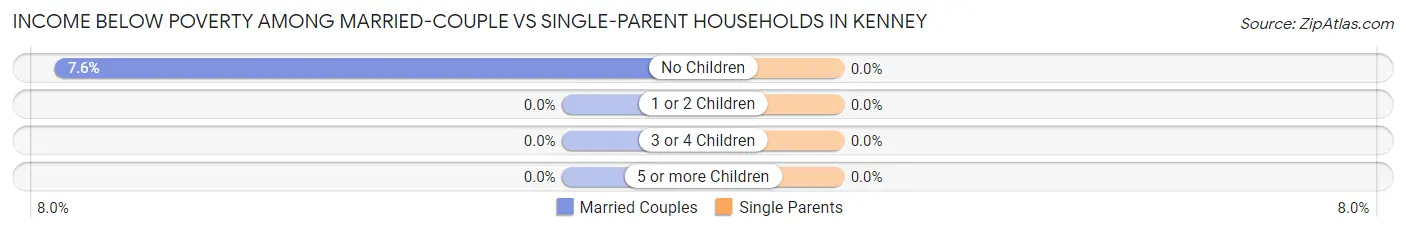
| Children | Married-Couple Families | Single-Parent Households |
| No Children | 4 (7.5%) | 0 (0.0%) |
| 1 or 2 Children | 0 (0.0%) | 0 (0.0%) |
| 3 or 4 Children | 0 (0.0%) | 0 (0.0%) |
| 5 or more Children | 0 (0.0%) | 0 (0.0%) |
| Total | 4 (5.8%) | 0 (0.0%) |
Race in Kenney
The most populous races in Kenney are White / Caucasian (363 | 98.4%), Black / African American (5 | 1.4%), and Hispanic or Latino (1 | 0.3%).
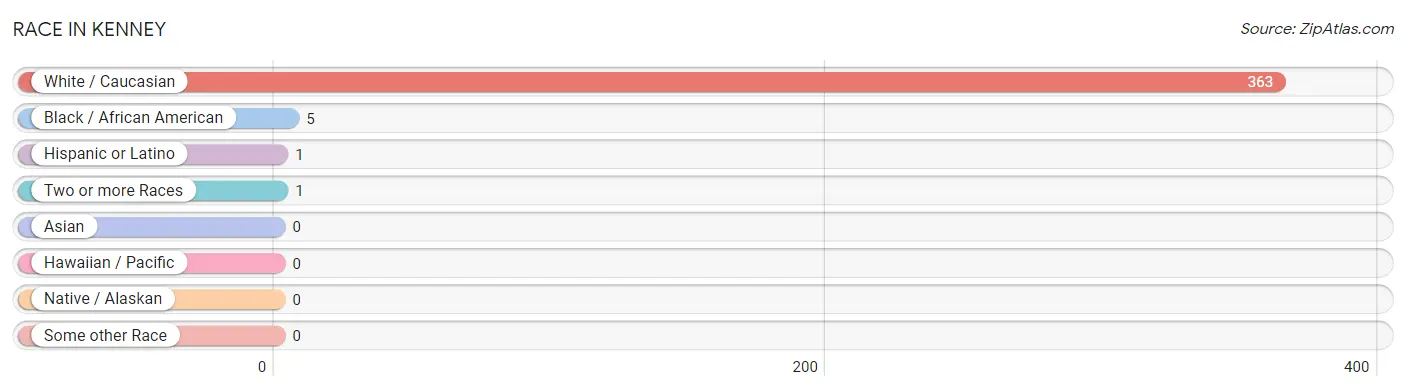
| Race | # Population | % Population |
| Asian | 0 | 0.0% |
| Black / African American | 5 | 1.4% |
| Hawaiian / Pacific | 0 | 0.0% |
| Hispanic or Latino | 1 | 0.3% |
| Native / Alaskan | 0 | 0.0% |
| White / Caucasian | 363 | 98.4% |
| Two or more Races | 1 | 0.3% |
| Some other Race | 0 | 0.0% |
| Total | 369 | 100.0% |
Ancestry in Kenney
The most populous ancestries reported in Kenney are English (85 | 23.0%), American (52 | 14.1%), German (48 | 13.0%), Irish (16 | 4.3%), and British (10 | 2.7%), together accounting for 57.2% of all Kenney residents.
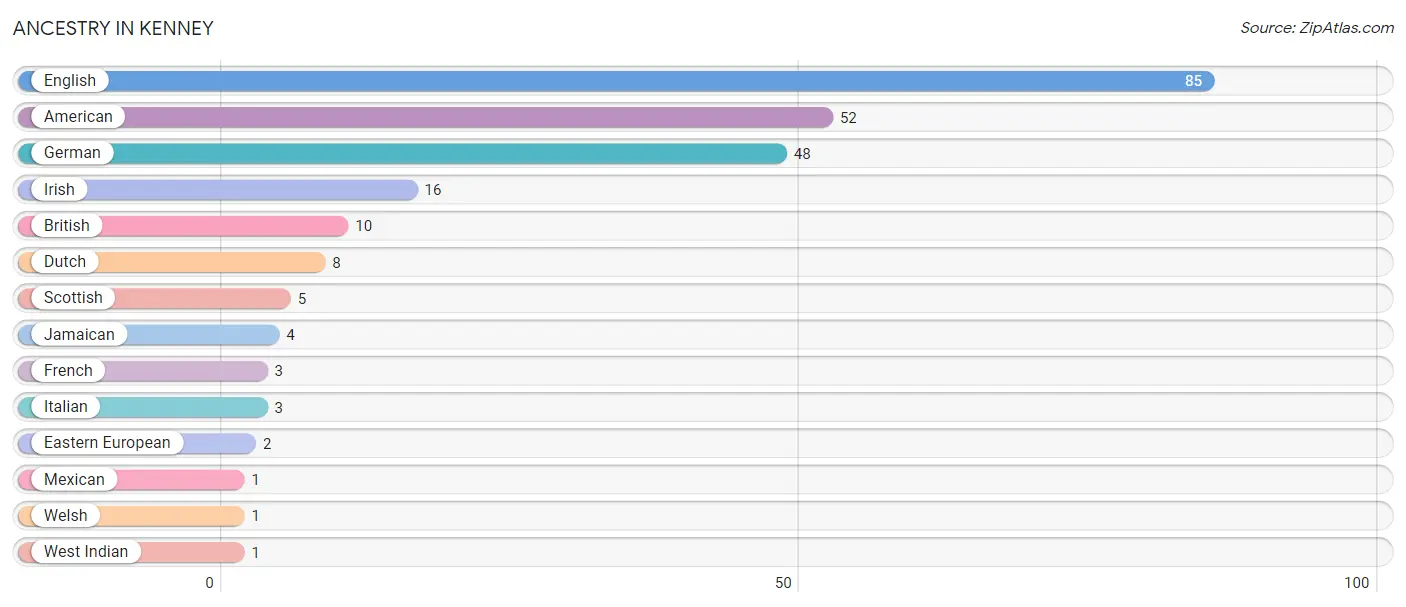
| Ancestry | # Population | % Population |
| American | 52 | 14.1% |
| British | 10 | 2.7% |
| Dutch | 8 | 2.2% |
| Eastern European | 2 | 0.5% |
| English | 85 | 23.0% |
| French | 3 | 0.8% |
| German | 48 | 13.0% |
| Irish | 16 | 4.3% |
| Italian | 3 | 0.8% |
| Jamaican | 4 | 1.1% |
| Mexican | 1 | 0.3% |
| Scottish | 5 | 1.4% |
| Welsh | 1 | 0.3% |
| West Indian | 1 | 0.3% | View All 14 Rows |
Immigrants in Kenney
The most numerous immigrant groups reported in Kenney came from Caribbean (3 | 0.8%), Jamaica (3 | 0.8%), and Latin America (3 | 0.8%), together accounting for 2.4% of all Kenney residents.
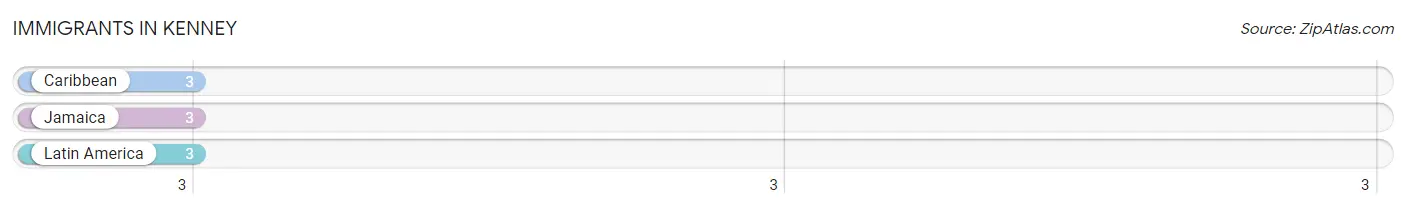
| Immigration Origin | # Population | % Population |
| Caribbean | 3 | 0.8% |
| Jamaica | 3 | 0.8% |
| Latin America | 3 | 0.8% | View All 3 Rows |
Sex and Age in Kenney
Sex and Age in Kenney
The most populous age groups in Kenney are 60 to 64 Years (65 | 31.6%) for men and 75 to 79 Years (34 | 20.9%) for women.
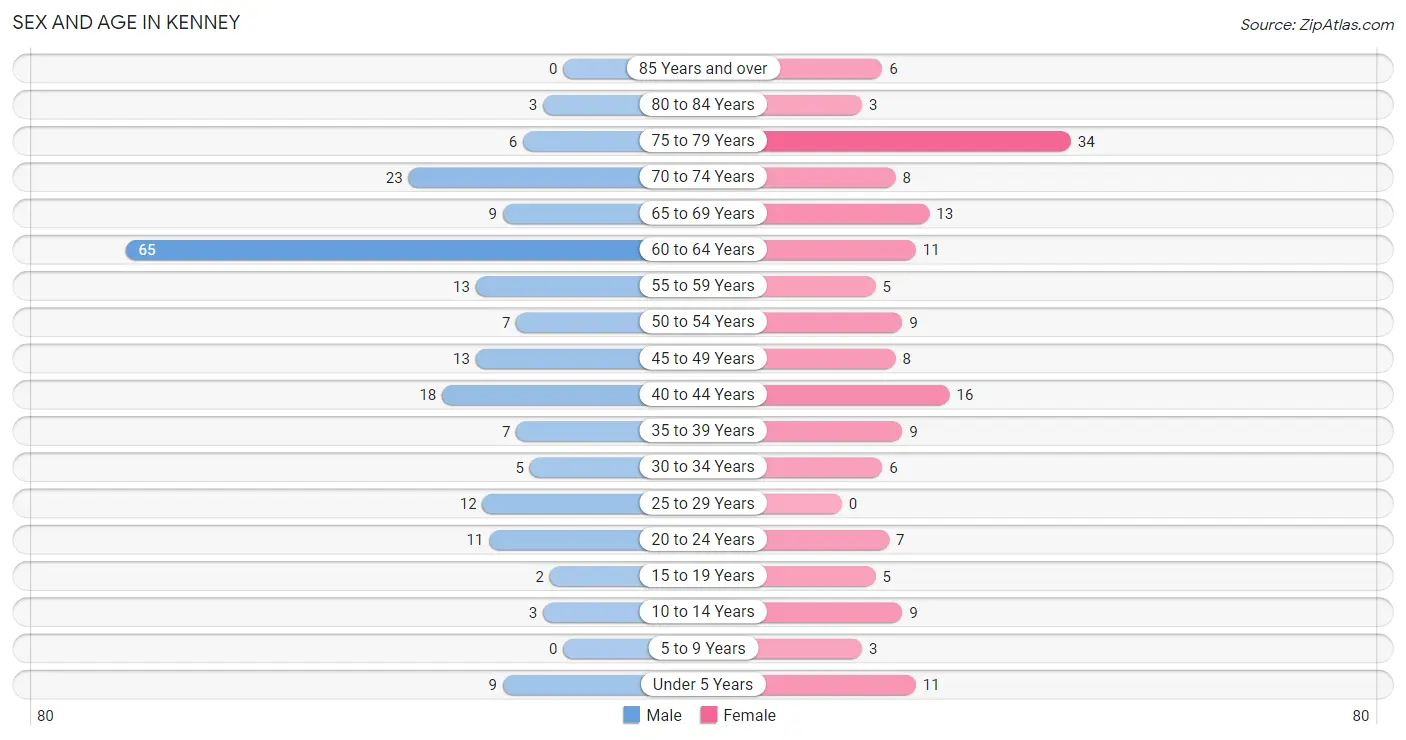
| Age Bracket | Male | Female |
| Under 5 Years | 9 (4.4%) | 11 (6.8%) |
| 5 to 9 Years | 0 (0.0%) | 3 (1.8%) |
| 10 to 14 Years | 3 (1.5%) | 9 (5.5%) |
| 15 to 19 Years | 2 (1.0%) | 5 (3.1%) |
| 20 to 24 Years | 11 (5.3%) | 7 (4.3%) |
| 25 to 29 Years | 12 (5.8%) | 0 (0.0%) |
| 30 to 34 Years | 5 (2.4%) | 6 (3.7%) |
| 35 to 39 Years | 7 (3.4%) | 9 (5.5%) |
| 40 to 44 Years | 18 (8.7%) | 16 (9.8%) |
| 45 to 49 Years | 13 (6.3%) | 8 (4.9%) |
| 50 to 54 Years | 7 (3.4%) | 9 (5.5%) |
| 55 to 59 Years | 13 (6.3%) | 5 (3.1%) |
| 60 to 64 Years | 65 (31.6%) | 11 (6.8%) |
| 65 to 69 Years | 9 (4.4%) | 13 (8.0%) |
| 70 to 74 Years | 23 (11.2%) | 8 (4.9%) |
| 75 to 79 Years | 6 (2.9%) | 34 (20.9%) |
| 80 to 84 Years | 3 (1.5%) | 3 (1.8%) |
| 85 Years and over | 0 (0.0%) | 6 (3.7%) |
| Total | 206 (100.0%) | 163 (100.0%) |
Families and Households in Kenney
Median Family Size in Kenney
The median family size in Kenney is 2.61 persons per family, with single male/father families (7 | 8.5%) accounting for the largest median family size of 3 persons per family. On the other hand, single female/mother families (6 | 7.3%) represent the smallest median family size with 2.33 persons per family.
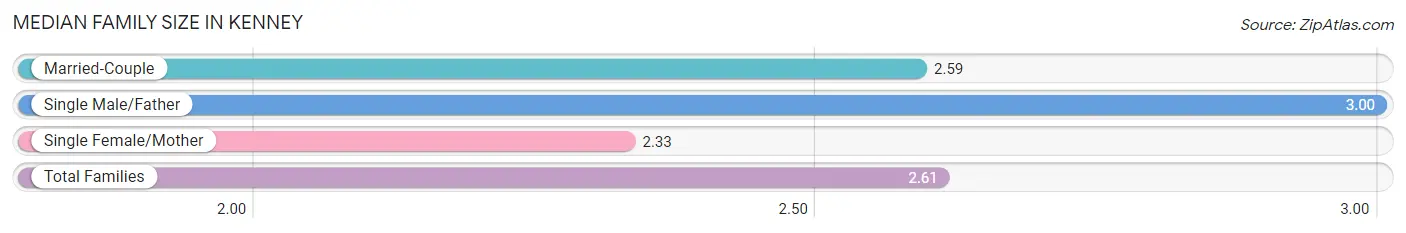
| Family Type | # Families | Family Size |
| Married-Couple | 69 (84.2%) | 2.59 |
| Single Male/Father | 7 (8.5%) | 3.00 |
| Single Female/Mother | 6 (7.3%) | 2.33 |
| Total Families | 82 (100.0%) | 2.61 |
Median Household Size in Kenney
The median household size in Kenney is 1.63 persons per household, with single male/father households (7 | 3.1%) accounting for the largest median household size of 3.14 persons per household. non-family households (145 | 63.9%) represent the smallest median household size with 1.05 persons per household.
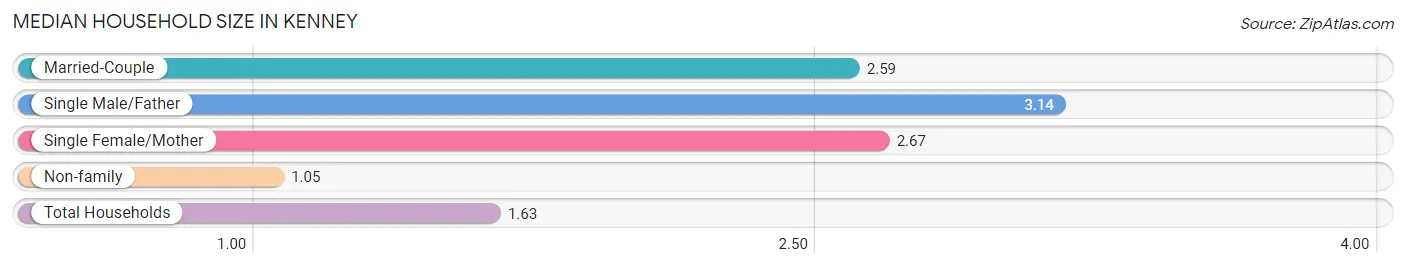
| Household Type | # Households | Household Size |
| Married-Couple | 69 (30.4%) | 2.59 |
| Single Male/Father | 7 (3.1%) | 3.14 |
| Single Female/Mother | 6 (2.6%) | 2.67 |
| Non-family | 145 (63.9%) | 1.05 |
| Total Households | 227 (100.0%) | 1.63 |
Household Size by Marriage Status in Kenney
Out of a total of 227 households in Kenney, 82 (36.1%) are family households, while 145 (63.9%) are nonfamily households. The most numerous type of family households are 2-person households, comprising 41, and the most common type of nonfamily households are 1-person households, comprising 137.
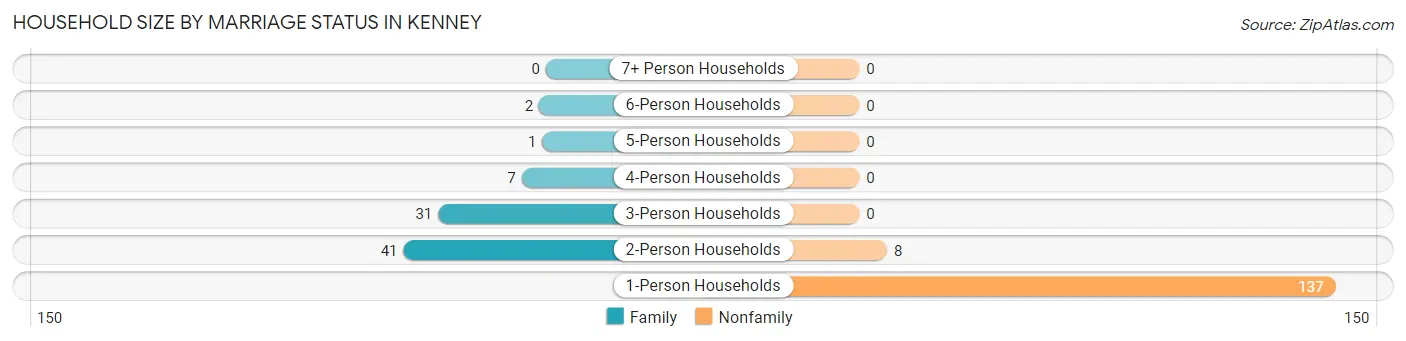
| Household Size | Family Households | Nonfamily Households |
| 1-Person Households | - | 137 (60.4%) |
| 2-Person Households | 41 (18.1%) | 8 (3.5%) |
| 3-Person Households | 31 (13.7%) | 0 (0.0%) |
| 4-Person Households | 7 (3.1%) | 0 (0.0%) |
| 5-Person Households | 1 (0.4%) | 0 (0.0%) |
| 6-Person Households | 2 (0.9%) | 0 (0.0%) |
| 7+ Person Households | 0 (0.0%) | 0 (0.0%) |
| Total | 82 (36.1%) | 145 (63.9%) |
Female Fertility in Kenney
Fertility by Age in Kenney
Average fertility rate in Kenney is 78.0 births per 1,000 women. Women in the age bracket of 20 to 34 years have the highest fertility rate with 308.0 births per 1,000 women. Women in the age bracket of 20 to 34 years acount for 100.0% of all women with births.
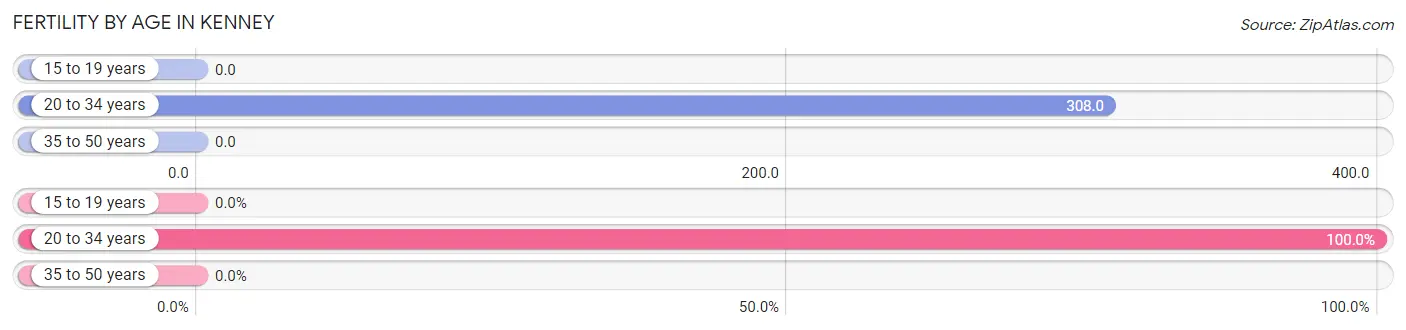
| Age Bracket | Women with Births | Births / 1,000 Women |
| 15 to 19 years | 0 (0.0%) | 0.0 |
| 20 to 34 years | 4 (100.0%) | 308.0 |
| 35 to 50 years | 0 (0.0%) | 0.0 |
| Total | 4 (100.0%) | 78.0 |
Fertility by Age by Marriage Status in Kenney
50.0% of women with births (4) in Kenney are married. The highest percentage of unmarried women with births falls into 20 to 34 years age bracket with 50.0% of them unmarried at the time of birth, while the lowest percentage of unmarried women with births belong to 20 to 34 years age bracket with 50.0% of them unmarried.
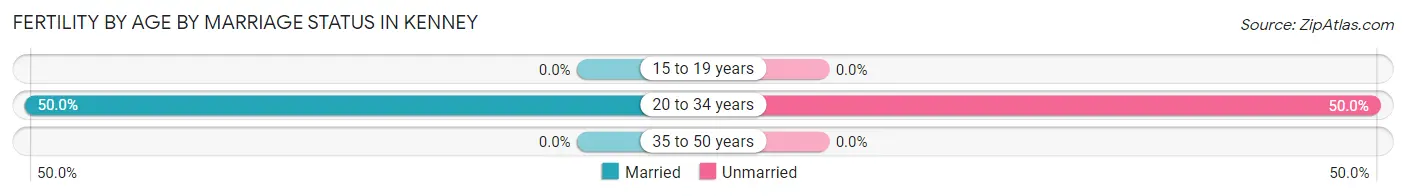
| Age Bracket | Married | Unmarried |
| 15 to 19 years | 0 (0.0%) | 0 (0.0%) |
| 20 to 34 years | 2 (50.0%) | 2 (50.0%) |
| 35 to 50 years | 0 (0.0%) | 0 (0.0%) |
| Total | 2 (50.0%) | 2 (50.0%) |
Fertility by Education in Kenney
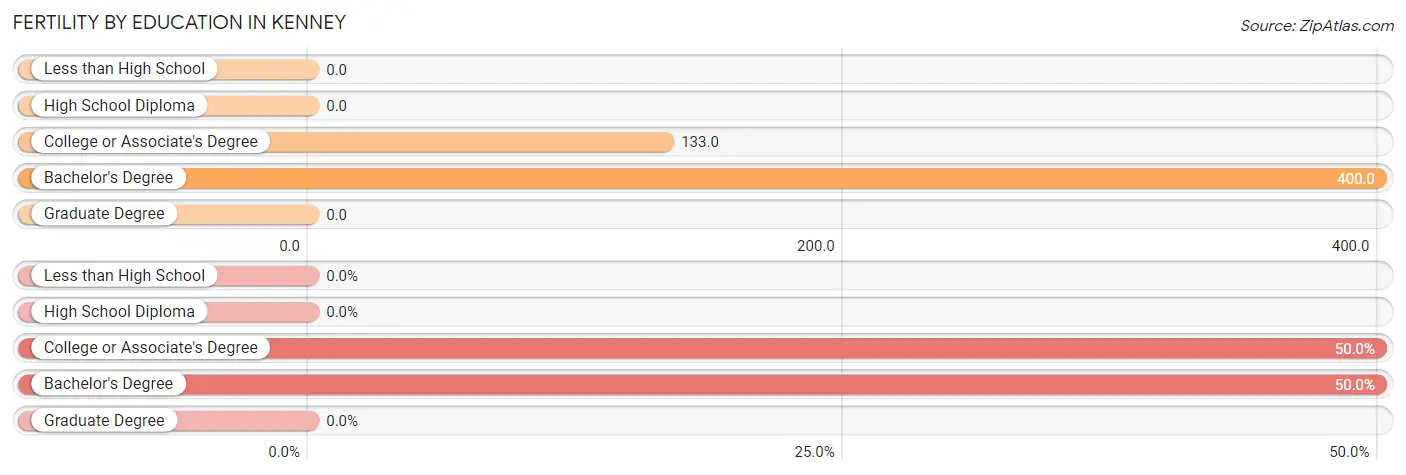
| Educational Attainment | Women with Births | Births / 1,000 Women |
| Less than High School | 0 (0.0%) | 0.0 |
| High School Diploma | 0 (0.0%) | 0.0 |
| College or Associate's Degree | 2 (50.0%) | 133.0 |
| Bachelor's Degree | 2 (50.0%) | 400.0 |
| Graduate Degree | 0 (0.0%) | 0.0 |
| Total | 4 (100.0%) | 78.0 |
Fertility by Education by Marriage Status in Kenney
50.0% of women with births in Kenney are unmarried. Women with the educational attainment of bachelor's degree are most likely to be married with 100.0% of them married at childbirth, while women with the educational attainment of college or associate's degree are least likely to be married with 100.0% of them unmarried at childbirth.
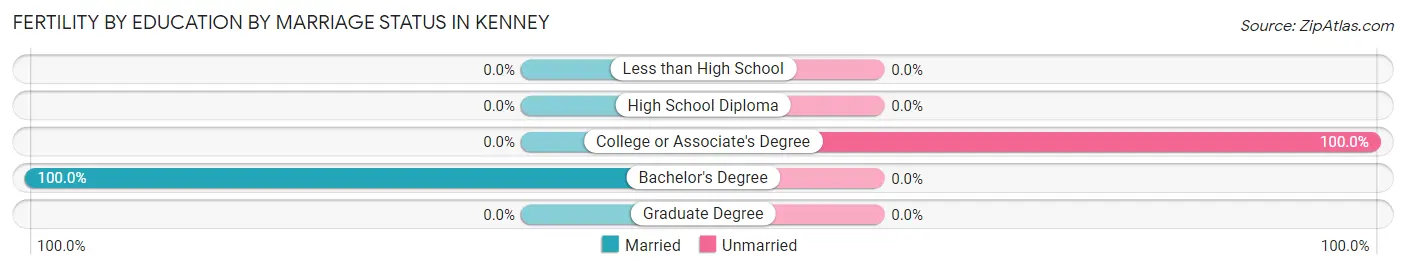
| Educational Attainment | Married | Unmarried |
| Less than High School | 0 (0.0%) | 0 (0.0%) |
| High School Diploma | 0 (0.0%) | 0 (0.0%) |
| College or Associate's Degree | 0 (0.0%) | 2 (100.0%) |
| Bachelor's Degree | 2 (100.0%) | 0 (0.0%) |
| Graduate Degree | 0 (0.0%) | 0 (0.0%) |
| Total | 2 (50.0%) | 2 (50.0%) |
Employment Characteristics in Kenney
Employment by Class of Employer in Kenney
Among the 121 employed individuals in Kenney, private company employees (97 | 80.2%), local government employees (14 | 11.6%), and self-employed (incorporated) (5 | 4.1%) make up the most common classes of employment.
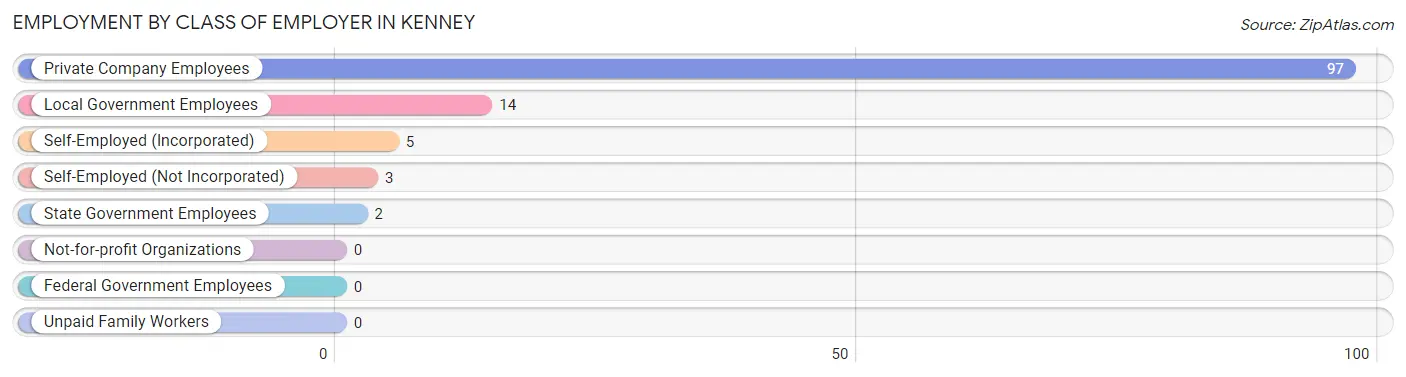
| Employer Class | # Employees | % Employees |
| Private Company Employees | 97 | 80.2% |
| Self-Employed (Incorporated) | 5 | 4.1% |
| Self-Employed (Not Incorporated) | 3 | 2.5% |
| Not-for-profit Organizations | 0 | 0.0% |
| Local Government Employees | 14 | 11.6% |
| State Government Employees | 2 | 1.7% |
| Federal Government Employees | 0 | 0.0% |
| Unpaid Family Workers | 0 | 0.0% |
| Total | 121 | 100.0% |
Employment Status by Age in Kenney
According to the labor force statistics for Kenney, out of the total population over 16 years of age (331), 42.6% or 141 individuals are in the labor force, with 14.2% or 20 of them unemployed. The age group with the highest labor force participation rate is 25 to 29 years, with 100.0% or 12 individuals in the labor force. Within the labor force, the 20 to 24 years age range has the highest percentage of unemployed individuals, with 62.5% or 10 of them being unemployed.
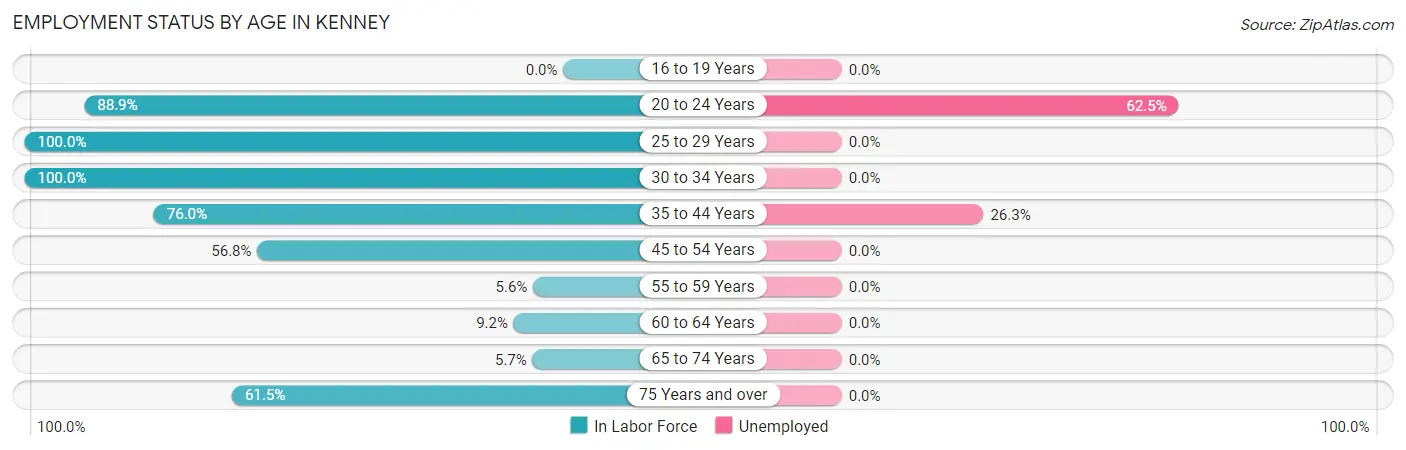
| Age Bracket | In Labor Force | Unemployed |
| 16 to 19 Years | 0 (0.0%) | 0 (0.0%) |
| 20 to 24 Years | 16 (88.9%) | 10 (62.5%) |
| 25 to 29 Years | 12 (100.0%) | 0 (0.0%) |
| 30 to 34 Years | 11 (100.0%) | 0 (0.0%) |
| 35 to 44 Years | 38 (76.0%) | 10 (26.3%) |
| 45 to 54 Years | 21 (56.8%) | 0 (0.0%) |
| 55 to 59 Years | 1 (5.6%) | 0 (0.0%) |
| 60 to 64 Years | 7 (9.2%) | 0 (0.0%) |
| 65 to 74 Years | 3 (5.7%) | 0 (0.0%) |
| 75 Years and over | 32 (61.5%) | 0 (0.0%) |
| Total | 141 (42.6%) | 20 (14.2%) |
Employment Status by Educational Attainment in Kenney
According to labor force statistics for Kenney, 44.1% of individuals (90) out of the total population between 25 and 64 years of age (204) are in the labor force, with 11.1% or 10 of them being unemployed. The group with the highest labor force participation rate are those with the educational attainment of bachelor's degree or higher, with 80.0% or 8 individuals in the labor force. Within the labor force, individuals with college / associate degree education have the highest percentage of unemployment, with 15.6% or 5 of them being unemployed.
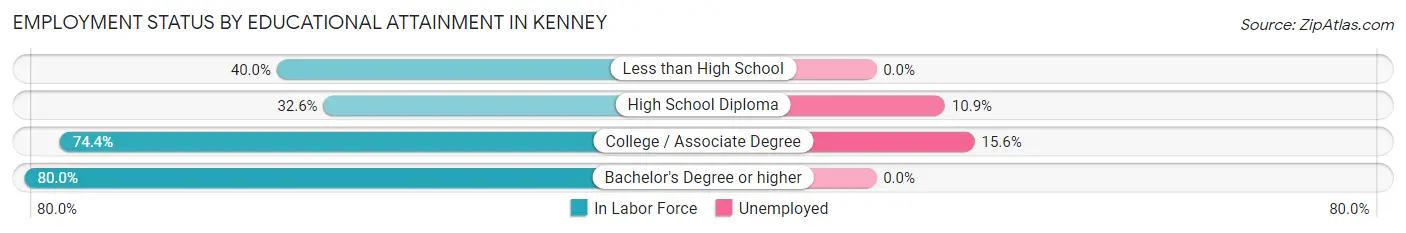
| Educational Attainment | In Labor Force | Unemployed |
| Less than High School | 4 (40.0%) | 0 (0.0%) |
| High School Diploma | 46 (32.6%) | 15 (10.9%) |
| College / Associate Degree | 32 (74.4%) | 7 (15.6%) |
| Bachelor's Degree or higher | 8 (80.0%) | 0 (0.0%) |
| Total | 90 (44.1%) | 23 (11.1%) |
Employment Occupations by Sex in Kenney
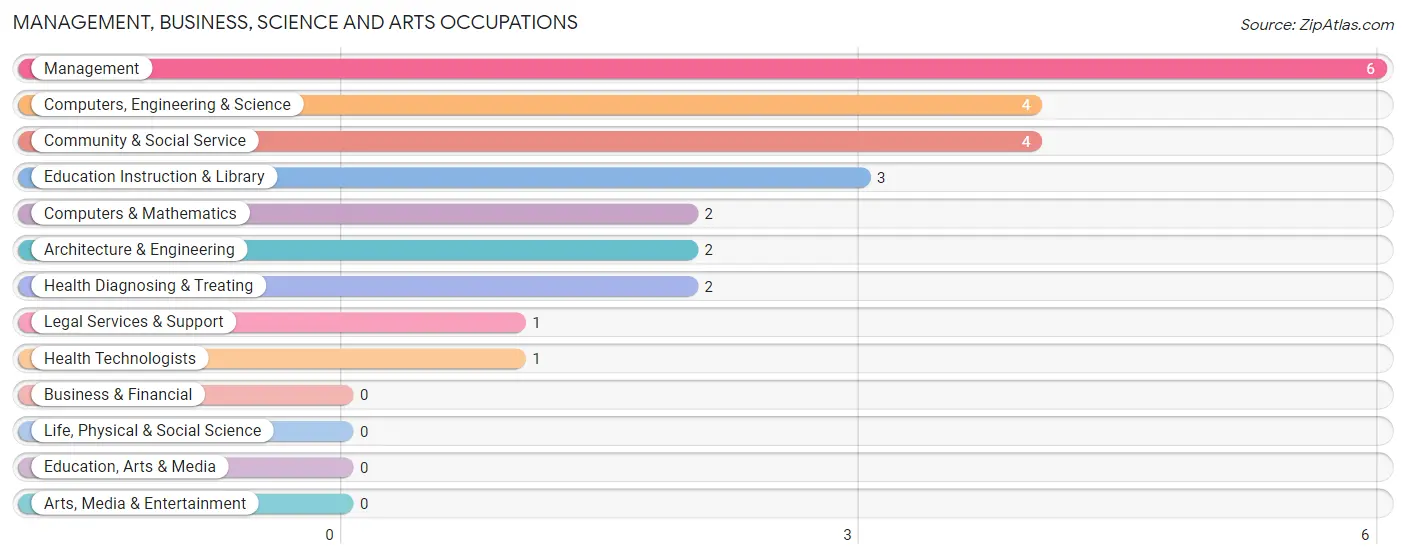
Management, Business, Science and Arts Occupations
The most common Management, Business, Science and Arts occupations in Kenney are Management (6 | 5.0%), Computers, Engineering & Science (4 | 3.3%), Community & Social Service (4 | 3.3%), Education Instruction & Library (3 | 2.5%), and Computers & Mathematics (2 | 1.7%).
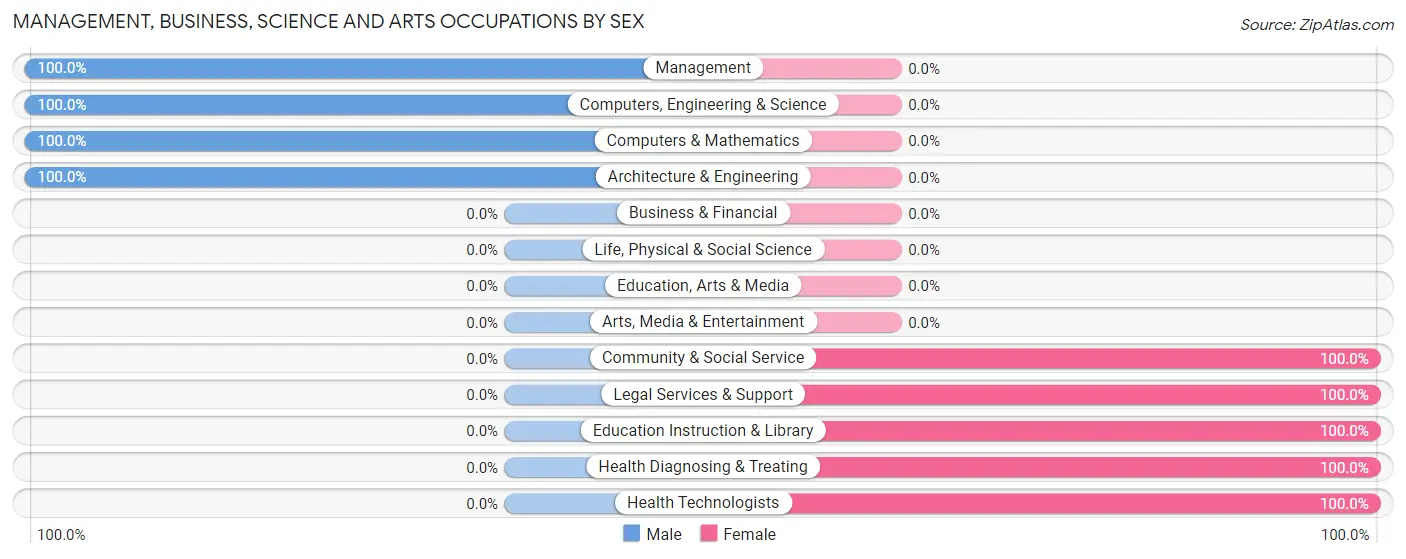
Management, Business, Science and Arts Occupations by Sex
Within the Management, Business, Science and Arts occupations in Kenney, the most male-oriented occupations are Management (100.0%), Computers, Engineering & Science (100.0%), and Computers & Mathematics (100.0%), while the most female-oriented occupations are Community & Social Service (100.0%), Legal Services & Support (100.0%), and Education Instruction & Library (100.0%).
| Occupation | Male | Female |
| Management | 6 (100.0%) | 0 (0.0%) |
| Business & Financial | 0 (0.0%) | 0 (0.0%) |
| Computers, Engineering & Science | 4 (100.0%) | 0 (0.0%) |
| Computers & Mathematics | 2 (100.0%) | 0 (0.0%) |
| Architecture & Engineering | 2 (100.0%) | 0 (0.0%) |
| Life, Physical & Social Science | 0 (0.0%) | 0 (0.0%) |
| Community & Social Service | 0 (0.0%) | 4 (100.0%) |
| Education, Arts & Media | 0 (0.0%) | 0 (0.0%) |
| Legal Services & Support | 0 (0.0%) | 1 (100.0%) |
| Education Instruction & Library | 0 (0.0%) | 3 (100.0%) |
| Arts, Media & Entertainment | 0 (0.0%) | 0 (0.0%) |
| Health Diagnosing & Treating | 0 (0.0%) | 2 (100.0%) |
| Health Technologists | 0 (0.0%) | 1 (100.0%) |
| Total (Category) | 10 (62.5%) | 6 (37.5%) |
| Total (Overall) | 57 (47.1%) | 64 (52.9%) |
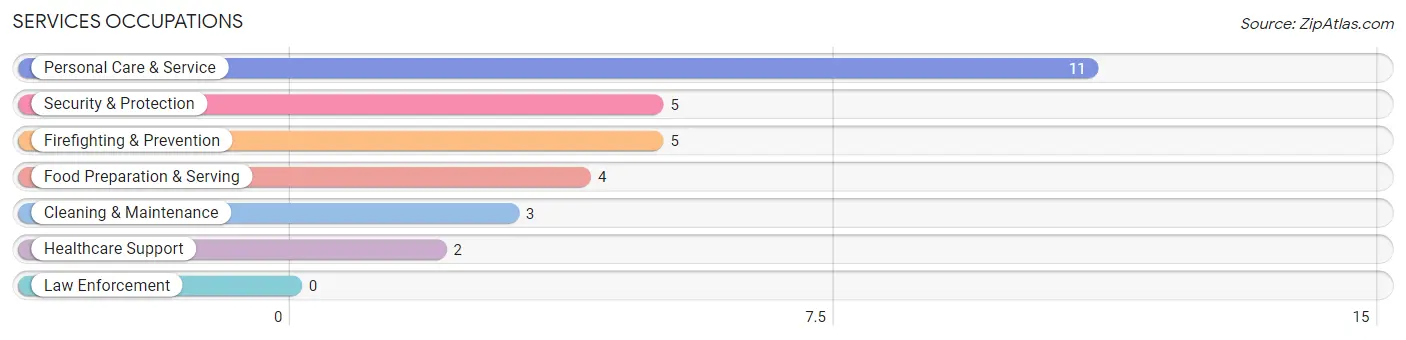
Services Occupations
The most common Services occupations in Kenney are Personal Care & Service (11 | 9.1%), Security & Protection (5 | 4.1%), Firefighting & Prevention (5 | 4.1%), Food Preparation & Serving (4 | 3.3%), and Cleaning & Maintenance (3 | 2.5%).
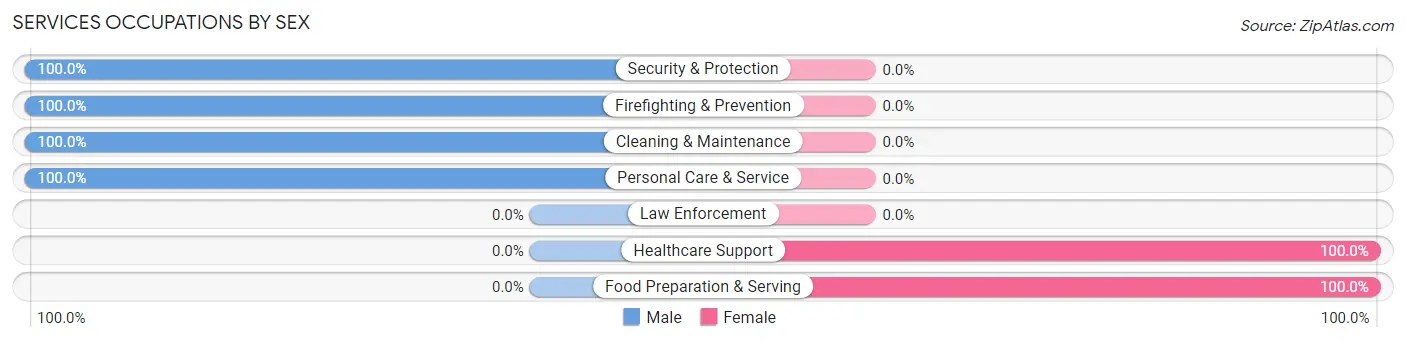
Services Occupations by Sex
Within the Services occupations in Kenney, the most male-oriented occupations are Security & Protection (100.0%), Firefighting & Prevention (100.0%), and Cleaning & Maintenance (100.0%), while the most female-oriented occupations are Healthcare Support (100.0%), and Food Preparation & Serving (100.0%).
| Occupation | Male | Female |
| Healthcare Support | 0 (0.0%) | 2 (100.0%) |
| Security & Protection | 5 (100.0%) | 0 (0.0%) |
| Firefighting & Prevention | 5 (100.0%) | 0 (0.0%) |
| Law Enforcement | 0 (0.0%) | 0 (0.0%) |
| Food Preparation & Serving | 0 (0.0%) | 4 (100.0%) |
| Cleaning & Maintenance | 3 (100.0%) | 0 (0.0%) |
| Personal Care & Service | 11 (100.0%) | 0 (0.0%) |
| Total (Category) | 19 (76.0%) | 6 (24.0%) |
| Total (Overall) | 57 (47.1%) | 64 (52.9%) |
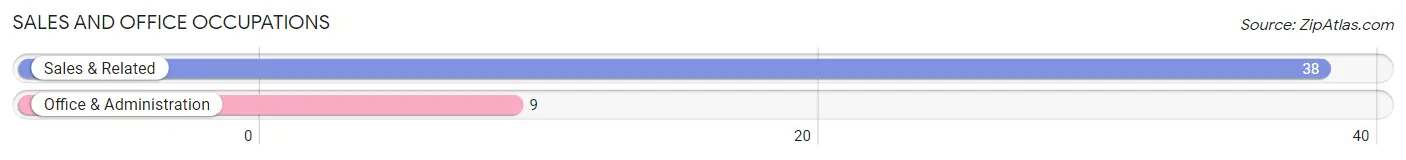
Sales and Office Occupations
The most common Sales and Office occupations in Kenney are Sales & Related (38 | 31.4%), and Office & Administration (9 | 7.4%).
Sales and Office Occupations by Sex
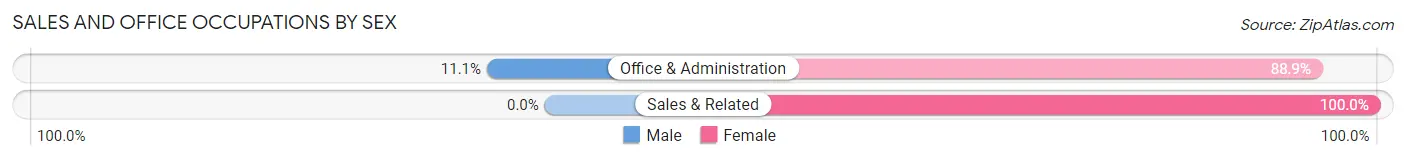
| Occupation | Male | Female |
| Sales & Related | 0 (0.0%) | 38 (100.0%) |
| Office & Administration | 1 (11.1%) | 8 (88.9%) |
| Total (Category) | 1 (2.1%) | 46 (97.9%) |
| Total (Overall) | 57 (47.1%) | 64 (52.9%) |
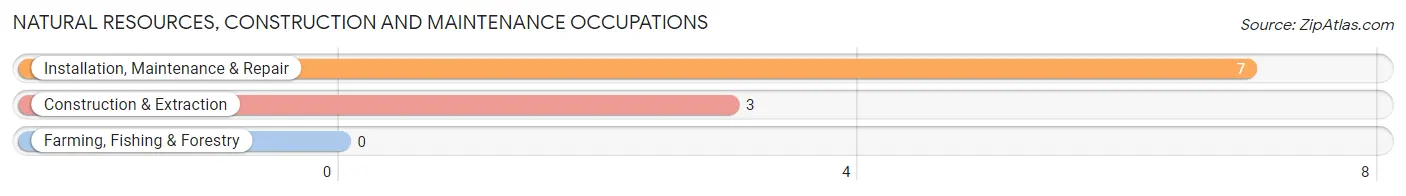
Natural Resources, Construction and Maintenance Occupations
The most common Natural Resources, Construction and Maintenance occupations in Kenney are Installation, Maintenance & Repair (7 | 5.8%), and Construction & Extraction (3 | 2.5%).
Natural Resources, Construction and Maintenance Occupations by Sex
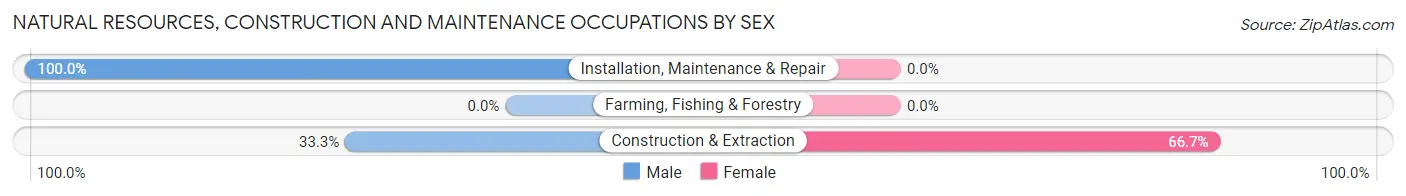
| Occupation | Male | Female |
| Farming, Fishing & Forestry | 0 (0.0%) | 0 (0.0%) |
| Construction & Extraction | 1 (33.3%) | 2 (66.7%) |
| Installation, Maintenance & Repair | 7 (100.0%) | 0 (0.0%) |
| Total (Category) | 8 (80.0%) | 2 (20.0%) |
| Total (Overall) | 57 (47.1%) | 64 (52.9%) |
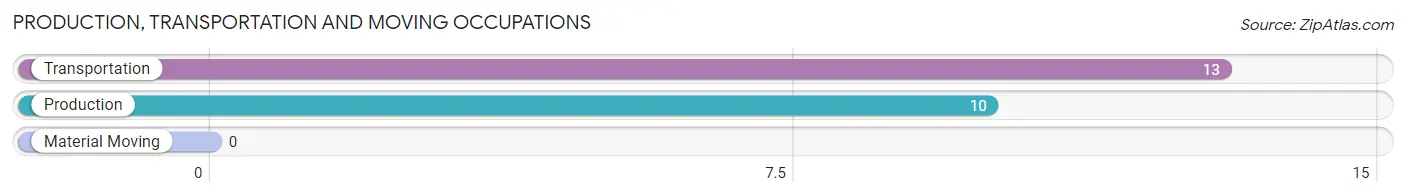
Production, Transportation and Moving Occupations
The most common Production, Transportation and Moving occupations in Kenney are Transportation (13 | 10.7%), and Production (10 | 8.3%).
Production, Transportation and Moving Occupations by Sex
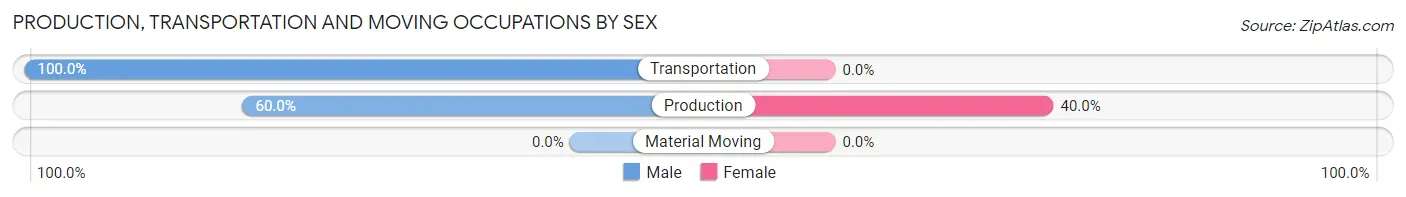
| Occupation | Male | Female |
| Production | 6 (60.0%) | 4 (40.0%) |
| Transportation | 13 (100.0%) | 0 (0.0%) |
| Material Moving | 0 (0.0%) | 0 (0.0%) |
| Total (Category) | 19 (82.6%) | 4 (17.4%) |
| Total (Overall) | 57 (47.1%) | 64 (52.9%) |
Employment Industries by Sex in Kenney
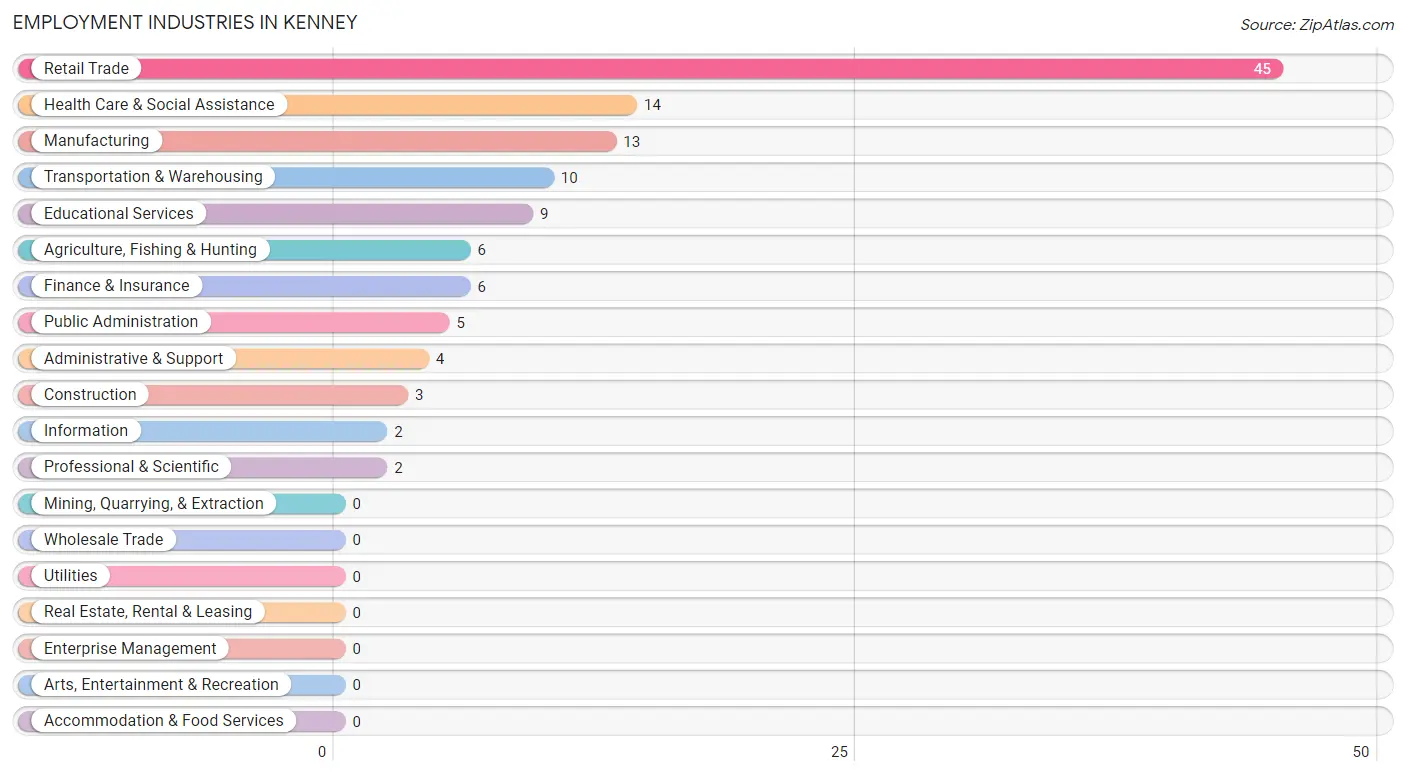
Employment Industries in Kenney
The major employment industries in Kenney include Retail Trade (45 | 37.2%), Health Care & Social Assistance (14 | 11.6%), Manufacturing (13 | 10.7%), Transportation & Warehousing (10 | 8.3%), and Educational Services (9 | 7.4%).
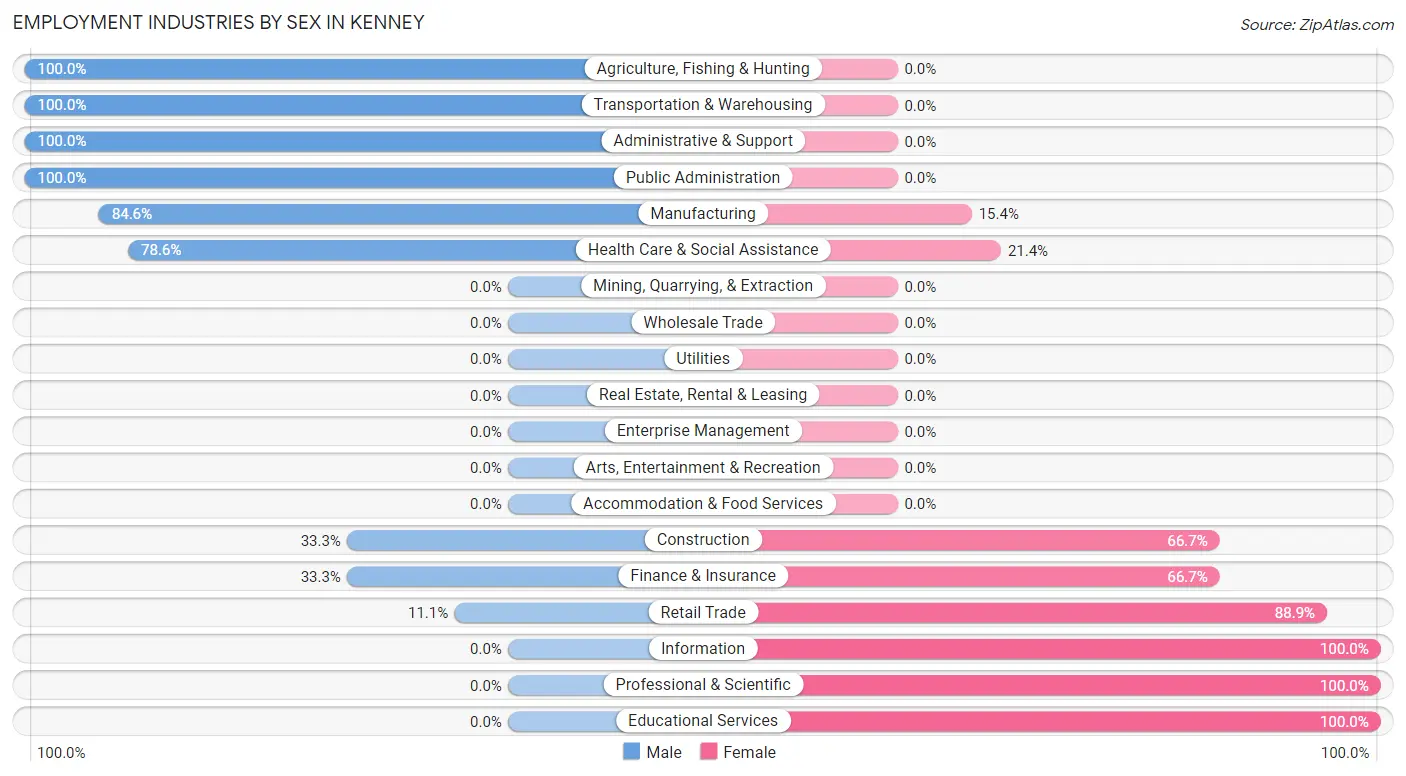
Employment Industries by Sex in Kenney
The Kenney industries that see more men than women are Agriculture, Fishing & Hunting (100.0%), Transportation & Warehousing (100.0%), and Administrative & Support (100.0%), whereas the industries that tend to have a higher number of women are Information (100.0%), Professional & Scientific (100.0%), and Educational Services (100.0%).
| Industry | Male | Female |
| Agriculture, Fishing & Hunting | 6 (100.0%) | 0 (0.0%) |
| Mining, Quarrying, & Extraction | 0 (0.0%) | 0 (0.0%) |
| Construction | 1 (33.3%) | 2 (66.7%) |
| Manufacturing | 11 (84.6%) | 2 (15.4%) |
| Wholesale Trade | 0 (0.0%) | 0 (0.0%) |
| Retail Trade | 5 (11.1%) | 40 (88.9%) |
| Transportation & Warehousing | 10 (100.0%) | 0 (0.0%) |
| Utilities | 0 (0.0%) | 0 (0.0%) |
| Information | 0 (0.0%) | 2 (100.0%) |
| Finance & Insurance | 2 (33.3%) | 4 (66.7%) |
| Real Estate, Rental & Leasing | 0 (0.0%) | 0 (0.0%) |
| Professional & Scientific | 0 (0.0%) | 2 (100.0%) |
| Enterprise Management | 0 (0.0%) | 0 (0.0%) |
| Administrative & Support | 4 (100.0%) | 0 (0.0%) |
| Educational Services | 0 (0.0%) | 9 (100.0%) |
| Health Care & Social Assistance | 11 (78.6%) | 3 (21.4%) |
| Arts, Entertainment & Recreation | 0 (0.0%) | 0 (0.0%) |
| Accommodation & Food Services | 0 (0.0%) | 0 (0.0%) |
| Public Administration | 5 (100.0%) | 0 (0.0%) |
| Total | 57 (47.1%) | 64 (52.9%) |
Education in Kenney
School Enrollment in Kenney
The most common levels of schooling among the 27 students in Kenney are middle school (10 | 37.0%), college / undergraduate (7 | 25.9%), and high school (6 | 22.2%).
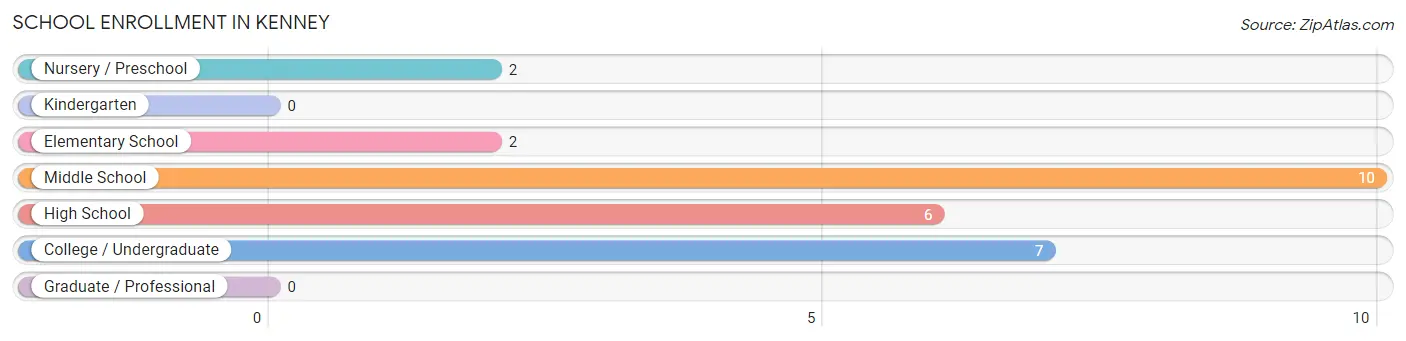
| School Level | # Students | % Students |
| Nursery / Preschool | 2 | 7.4% |
| Kindergarten | 0 | 0.0% |
| Elementary School | 2 | 7.4% |
| Middle School | 10 | 37.0% |
| High School | 6 | 22.2% |
| College / Undergraduate | 7 | 25.9% |
| Graduate / Professional | 0 | 0.0% |
| Total | 27 | 100.0% |
School Enrollment by Age by Funding Source in Kenney
Out of a total of 27 students who are enrolled in schools in Kenney, 6 (22.2%) attend a private institution, while the remaining 21 (77.8%) are enrolled in public schools. The age group of 15 to 17 year olds has the highest likelihood of being enrolled in private schools, with 4 (100.0% in the age bracket) enrolled. Conversely, the age group of 3 to 4 year olds has the lowest likelihood of being enrolled in a private school, with 2 (100.0% in the age bracket) attending a public institution.
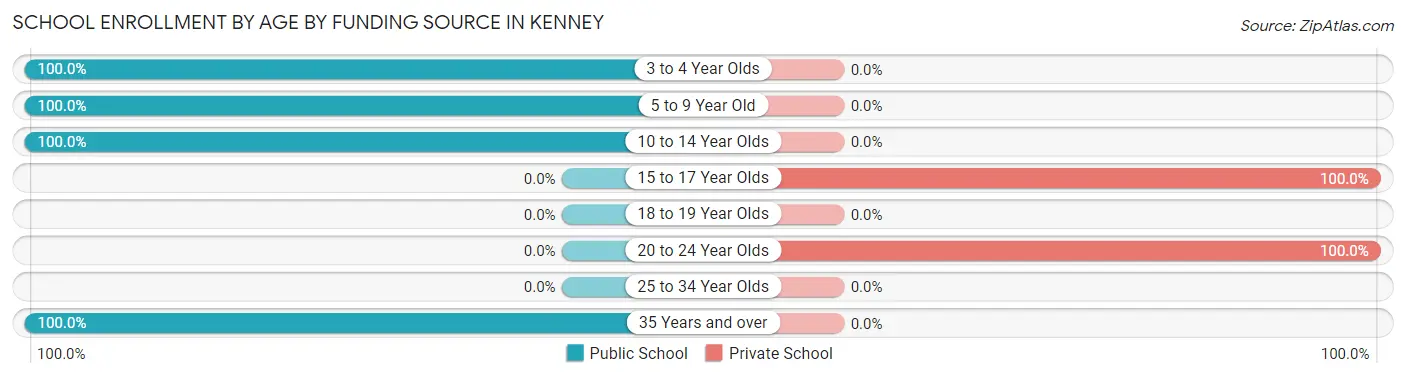
| Age Bracket | Public School | Private School |
| 3 to 4 Year Olds | 2 (100.0%) | 0 (0.0%) |
| 5 to 9 Year Old | 2 (100.0%) | 0 (0.0%) |
| 10 to 14 Year Olds | 12 (100.0%) | 0 (0.0%) |
| 15 to 17 Year Olds | 0 (0.0%) | 4 (100.0%) |
| 18 to 19 Year Olds | 0 (0.0%) | 0 (0.0%) |
| 20 to 24 Year Olds | 0 (0.0%) | 2 (100.0%) |
| 25 to 34 Year Olds | 0 (0.0%) | 0 (0.0%) |
| 35 Years and over | 5 (100.0%) | 0 (0.0%) |
| Total | 21 (77.8%) | 6 (22.2%) |
Educational Attainment by Field of Study in Kenney
Science & technology (12 | 48.0%), education (7 | 28.0%), psychology (2 | 8.0%), engineering (2 | 8.0%), and business (1 | 4.0%) are the most common fields of study among 25 individuals in Kenney who have obtained a bachelor's degree or higher.
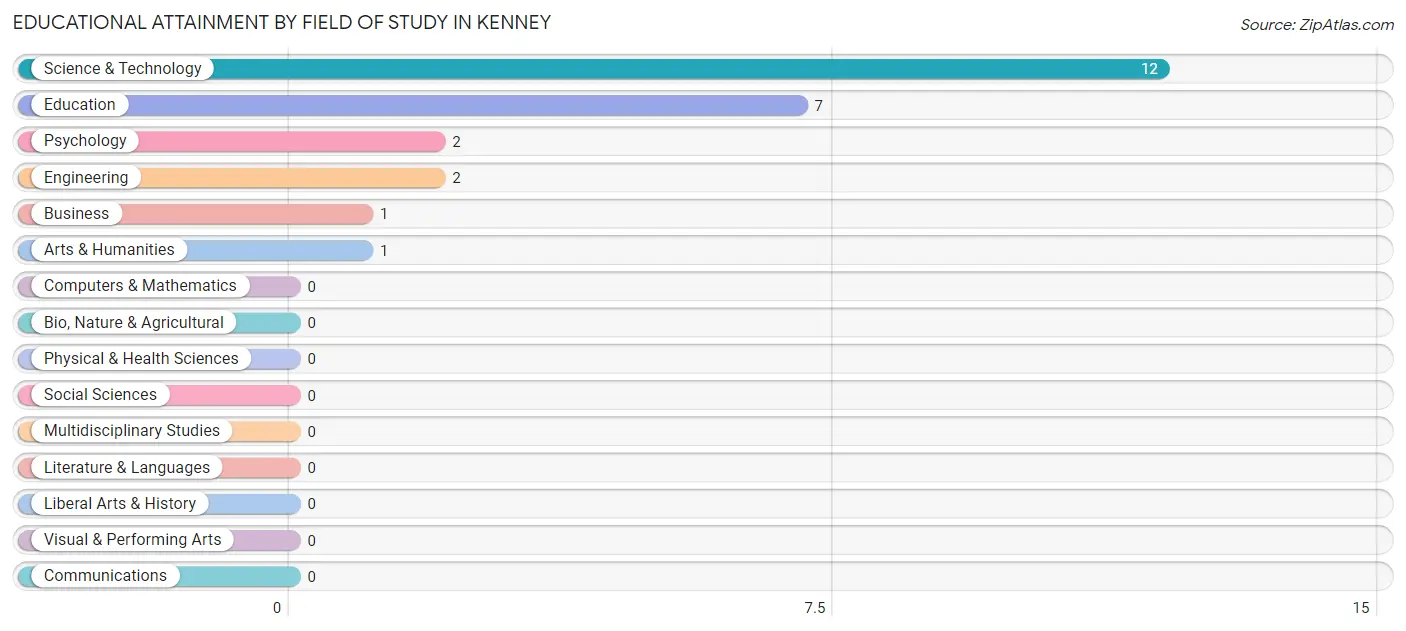
| Field of Study | # Graduates | % Graduates |
| Computers & Mathematics | 0 | 0.0% |
| Bio, Nature & Agricultural | 0 | 0.0% |
| Physical & Health Sciences | 0 | 0.0% |
| Psychology | 2 | 8.0% |
| Social Sciences | 0 | 0.0% |
| Engineering | 2 | 8.0% |
| Multidisciplinary Studies | 0 | 0.0% |
| Science & Technology | 12 | 48.0% |
| Business | 1 | 4.0% |
| Education | 7 | 28.0% |
| Literature & Languages | 0 | 0.0% |
| Liberal Arts & History | 0 | 0.0% |
| Visual & Performing Arts | 0 | 0.0% |
| Communications | 0 | 0.0% |
| Arts & Humanities | 1 | 4.0% |
| Total | 25 | 100.0% |
Transportation & Commute in Kenney
Vehicle Availability by Sex in Kenney
The most prevalent vehicle ownership categories in Kenney are males with 3 vehicles (24, accounting for 42.1%) and females with 3 vehicles (3, making up 37.5%).
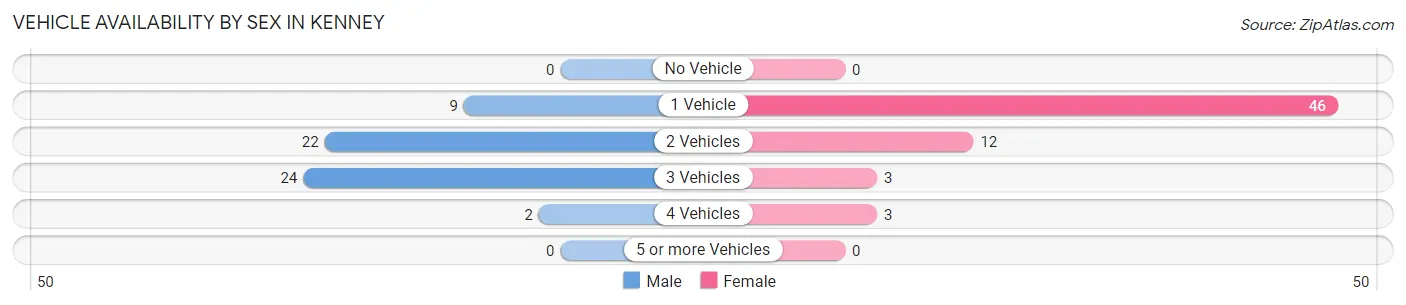
| Vehicles Available | Male | Female |
| No Vehicle | 0 (0.0%) | 0 (0.0%) |
| 1 Vehicle | 9 (15.8%) | 46 (71.9%) |
| 2 Vehicles | 22 (38.6%) | 12 (18.8%) |
| 3 Vehicles | 24 (42.1%) | 3 (4.7%) |
| 4 Vehicles | 2 (3.5%) | 3 (4.7%) |
| 5 or more Vehicles | 0 (0.0%) | 0 (0.0%) |
| Total | 57 (100.0%) | 64 (100.0%) |
Commute Time in Kenney
The most frequently occuring commute durations in Kenney are 10 to 14 minutes (49 commuters, 46.7%), 15 to 19 minutes (19 commuters, 18.1%), and 45 to 59 minutes (14 commuters, 13.3%).
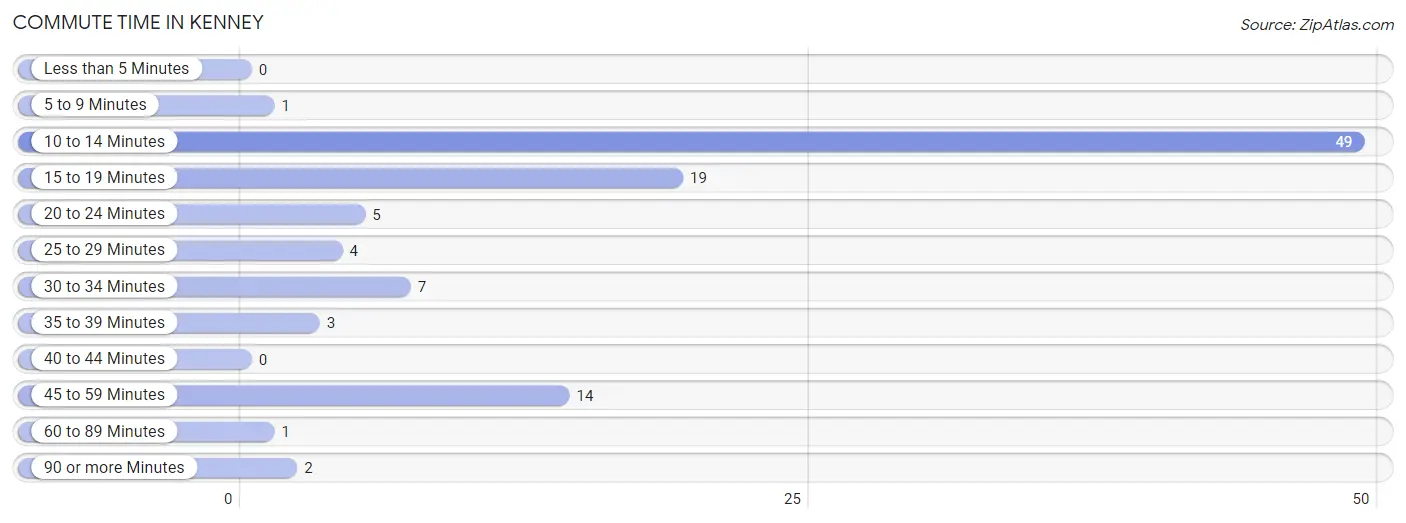
| Commute Time | # Commuters | % Commuters |
| Less than 5 Minutes | 0 | 0.0% |
| 5 to 9 Minutes | 1 | 0.9% |
| 10 to 14 Minutes | 49 | 46.7% |
| 15 to 19 Minutes | 19 | 18.1% |
| 20 to 24 Minutes | 5 | 4.8% |
| 25 to 29 Minutes | 4 | 3.8% |
| 30 to 34 Minutes | 7 | 6.7% |
| 35 to 39 Minutes | 3 | 2.9% |
| 40 to 44 Minutes | 0 | 0.0% |
| 45 to 59 Minutes | 14 | 13.3% |
| 60 to 89 Minutes | 1 | 0.9% |
| 90 or more Minutes | 2 | 1.9% |
Commute Time by Sex in Kenney
The most common commute times in Kenney are 10 to 14 minutes (13 commuters, 28.3%) for males and 10 to 14 minutes (36 commuters, 61.0%) for females.
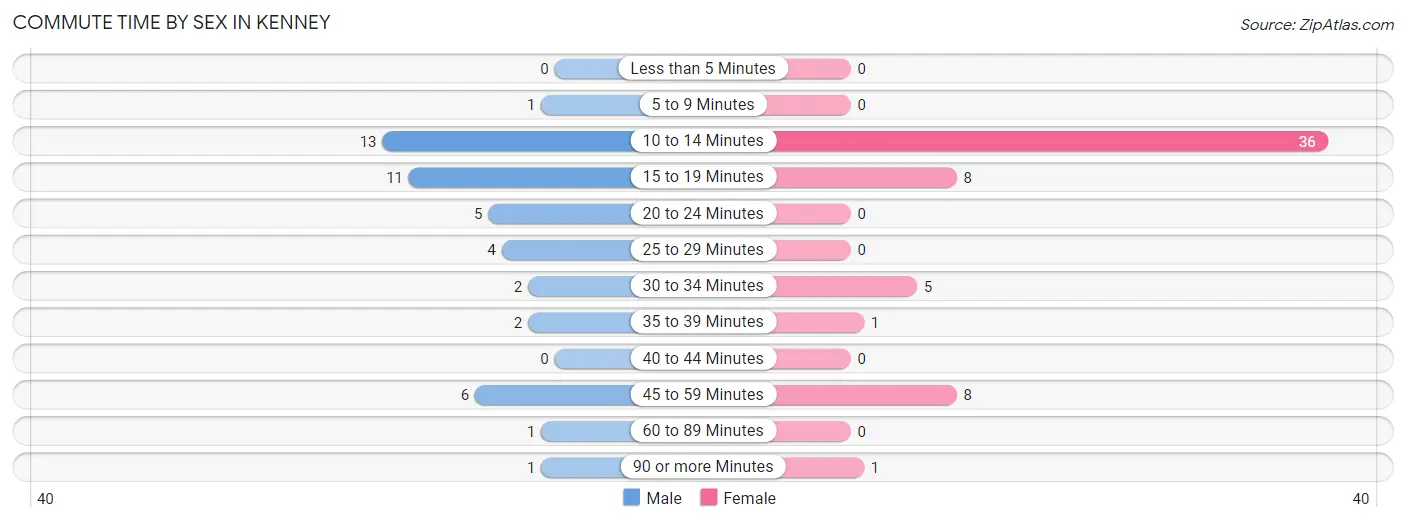
| Commute Time | Male | Female |
| Less than 5 Minutes | 0 (0.0%) | 0 (0.0%) |
| 5 to 9 Minutes | 1 (2.2%) | 0 (0.0%) |
| 10 to 14 Minutes | 13 (28.3%) | 36 (61.0%) |
| 15 to 19 Minutes | 11 (23.9%) | 8 (13.6%) |
| 20 to 24 Minutes | 5 (10.9%) | 0 (0.0%) |
| 25 to 29 Minutes | 4 (8.7%) | 0 (0.0%) |
| 30 to 34 Minutes | 2 (4.3%) | 5 (8.5%) |
| 35 to 39 Minutes | 2 (4.3%) | 1 (1.7%) |
| 40 to 44 Minutes | 0 (0.0%) | 0 (0.0%) |
| 45 to 59 Minutes | 6 (13.0%) | 8 (13.6%) |
| 60 to 89 Minutes | 1 (2.2%) | 0 (0.0%) |
| 90 or more Minutes | 1 (2.2%) | 1 (1.7%) |
Time of Departure to Work by Sex in Kenney
The most frequent times of departure to work in Kenney are 6:30 AM to 6:59 AM (11, 23.9%) for males and 10:00 AM to 10:59 AM (32, 54.2%) for females.
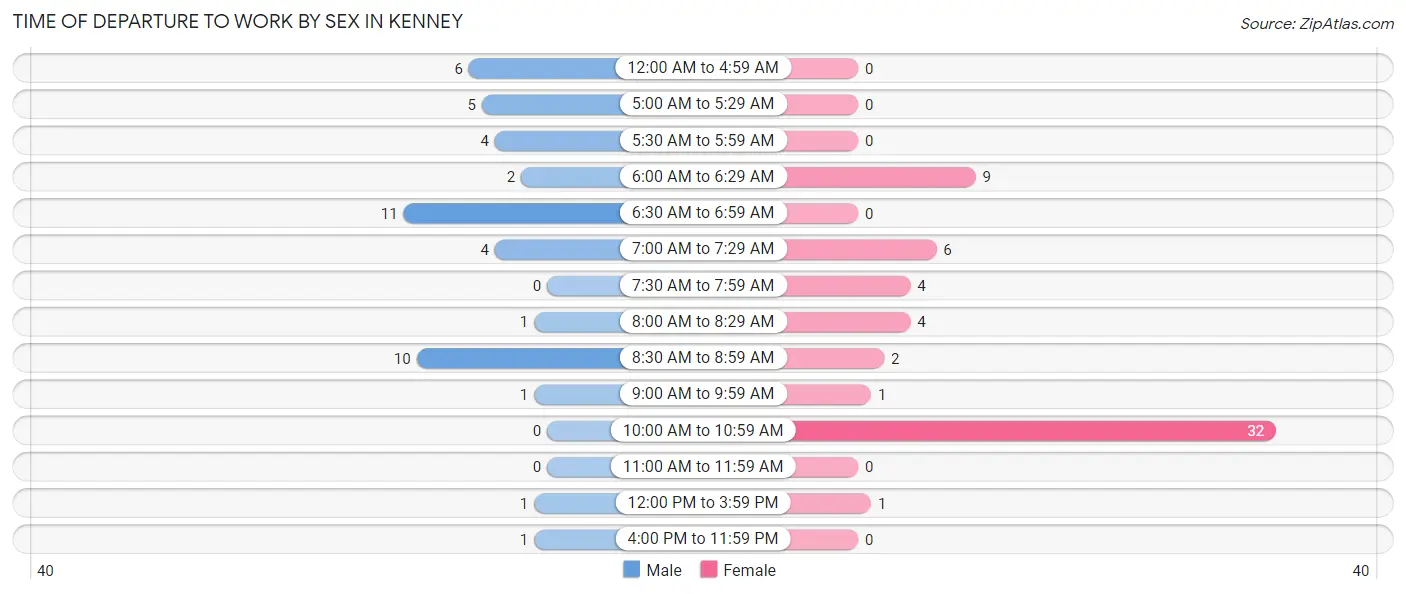
| Time of Departure | Male | Female |
| 12:00 AM to 4:59 AM | 6 (13.0%) | 0 (0.0%) |
| 5:00 AM to 5:29 AM | 5 (10.9%) | 0 (0.0%) |
| 5:30 AM to 5:59 AM | 4 (8.7%) | 0 (0.0%) |
| 6:00 AM to 6:29 AM | 2 (4.3%) | 9 (15.2%) |
| 6:30 AM to 6:59 AM | 11 (23.9%) | 0 (0.0%) |
| 7:00 AM to 7:29 AM | 4 (8.7%) | 6 (10.2%) |
| 7:30 AM to 7:59 AM | 0 (0.0%) | 4 (6.8%) |
| 8:00 AM to 8:29 AM | 1 (2.2%) | 4 (6.8%) |
| 8:30 AM to 8:59 AM | 10 (21.7%) | 2 (3.4%) |
| 9:00 AM to 9:59 AM | 1 (2.2%) | 1 (1.7%) |
| 10:00 AM to 10:59 AM | 0 (0.0%) | 32 (54.2%) |
| 11:00 AM to 11:59 AM | 0 (0.0%) | 0 (0.0%) |
| 12:00 PM to 3:59 PM | 1 (2.2%) | 1 (1.7%) |
| 4:00 PM to 11:59 PM | 1 (2.2%) | 0 (0.0%) |
| Total | 46 (100.0%) | 59 (100.0%) |
Housing Occupancy in Kenney
Occupancy by Ownership in Kenney
Of the total 227 dwellings in Kenney, owner-occupied units account for 201 (88.5%), while renter-occupied units make up 26 (11.5%).
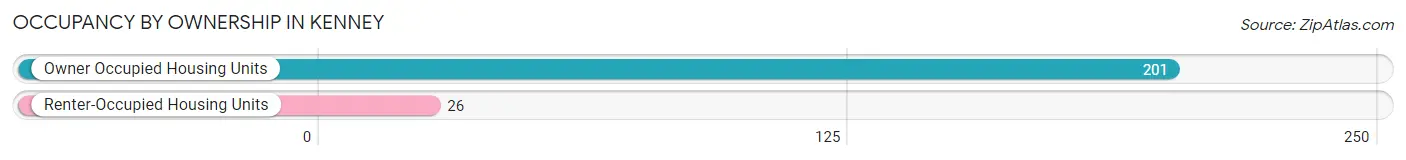
| Occupancy | # Housing Units | % Housing Units |
| Owner Occupied Housing Units | 201 | 88.5% |
| Renter-Occupied Housing Units | 26 | 11.5% |
| Total Occupied Housing Units | 227 | 100.0% |
Occupancy by Household Size in Kenney
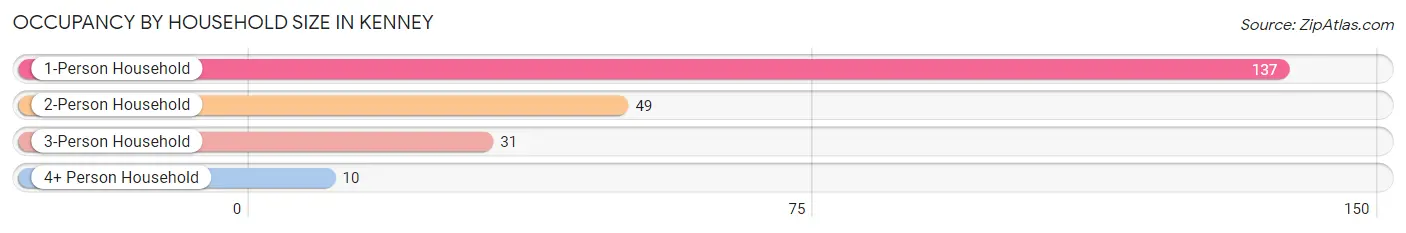
| Household Size | # Housing Units | % Housing Units |
| 1-Person Household | 137 | 60.4% |
| 2-Person Household | 49 | 21.6% |
| 3-Person Household | 31 | 13.7% |
| 4+ Person Household | 10 | 4.4% |
| Total Housing Units | 227 | 100.0% |
Occupancy by Ownership by Household Size in Kenney
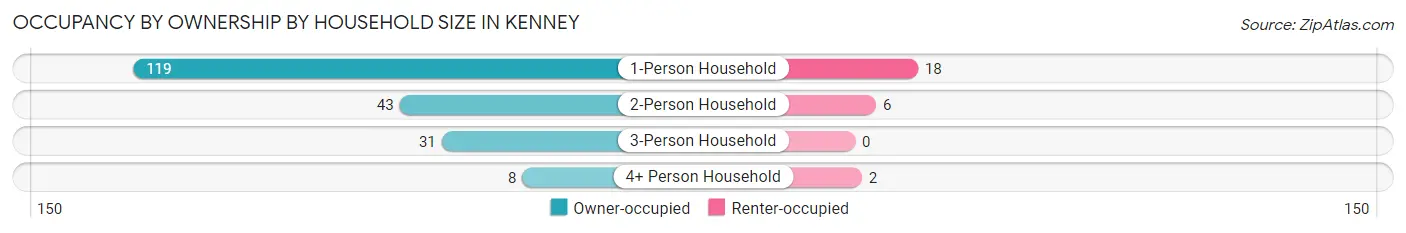
| Household Size | Owner-occupied | Renter-occupied |
| 1-Person Household | 119 (86.9%) | 18 (13.1%) |
| 2-Person Household | 43 (87.8%) | 6 (12.2%) |
| 3-Person Household | 31 (100.0%) | 0 (0.0%) |
| 4+ Person Household | 8 (80.0%) | 2 (20.0%) |
| Total Housing Units | 201 (88.5%) | 26 (11.5%) |
Occupancy by Educational Attainment in Kenney
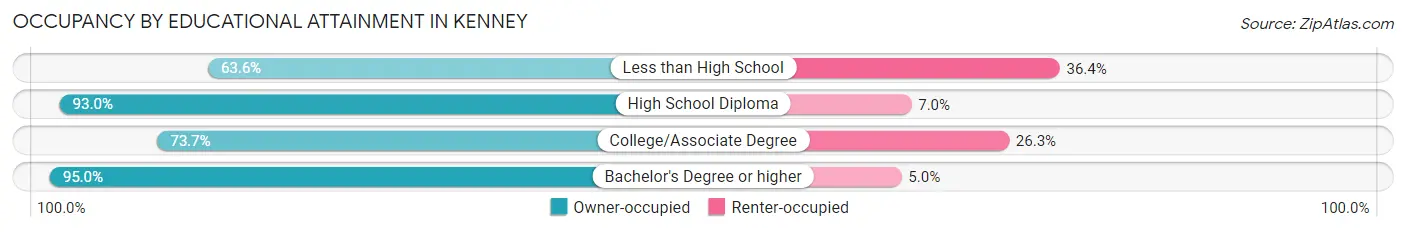
| Household Size | Owner-occupied | Renter-occupied |
| Less than High School | 7 (63.6%) | 4 (36.4%) |
| High School Diploma | 147 (93.0%) | 11 (7.0%) |
| College/Associate Degree | 28 (73.7%) | 10 (26.3%) |
| Bachelor's Degree or higher | 19 (95.0%) | 1 (5.0%) |
Occupancy by Age of Householder in Kenney
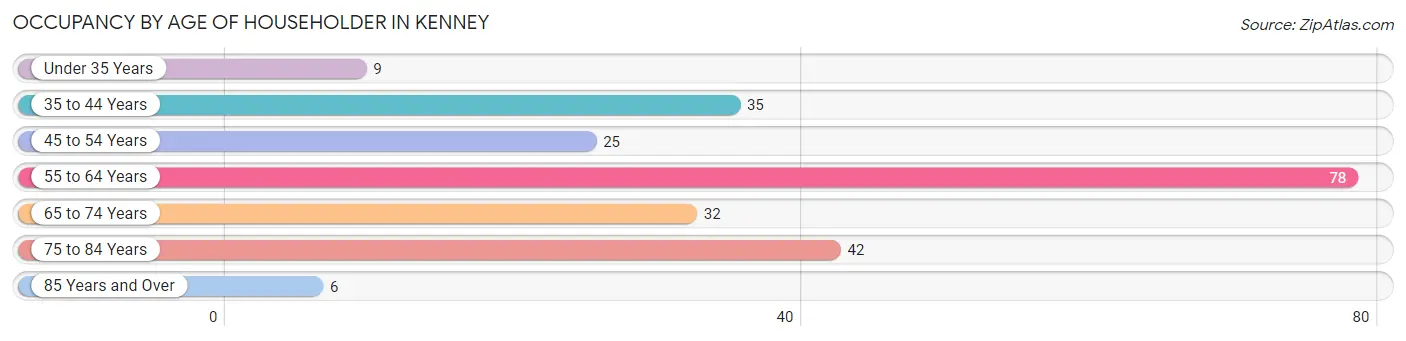
| Age Bracket | # Households | % Households |
| Under 35 Years | 9 | 4.0% |
| 35 to 44 Years | 35 | 15.4% |
| 45 to 54 Years | 25 | 11.0% |
| 55 to 64 Years | 78 | 34.4% |
| 65 to 74 Years | 32 | 14.1% |
| 75 to 84 Years | 42 | 18.5% |
| 85 Years and Over | 6 | 2.6% |
| Total | 227 | 100.0% |
Housing Finances in Kenney
Median Income by Occupancy in Kenney
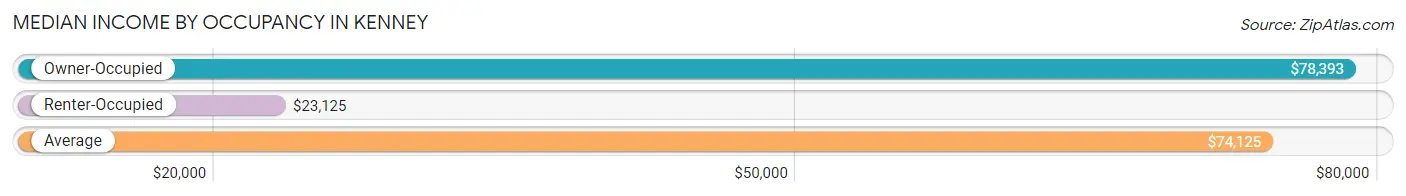
| Occupancy Type | # Households | Median Income |
| Owner-Occupied | 201 (88.5%) | $78,393 |
| Renter-Occupied | 26 (11.5%) | $23,125 |
| Average | 227 (100.0%) | $74,125 |
Occupancy by Householder Income Bracket in Kenney
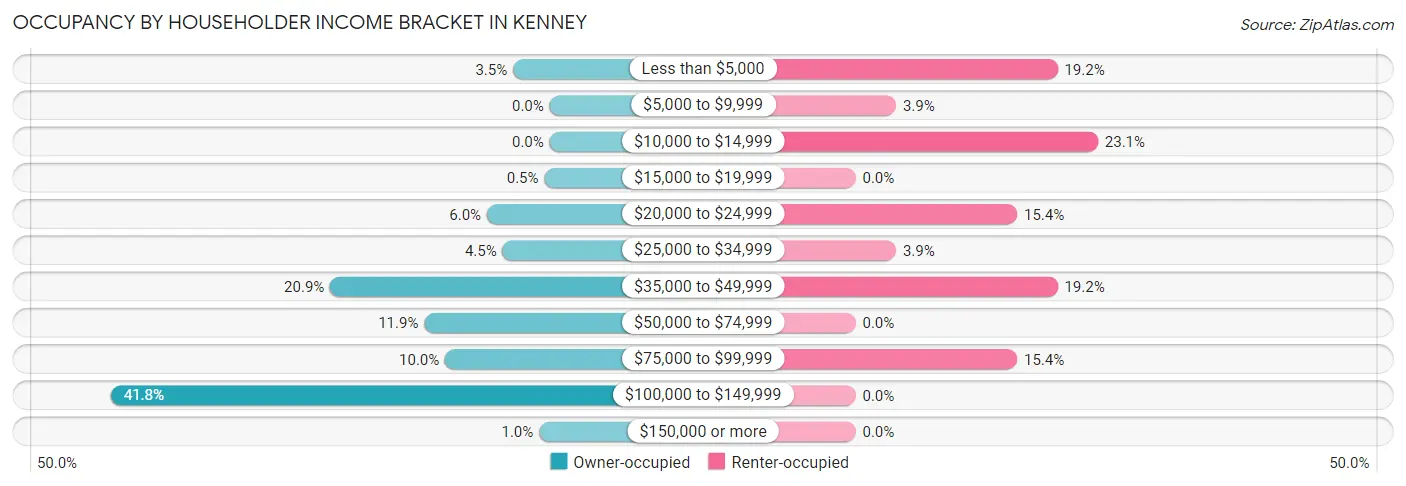
| Income Bracket | Owner-occupied | Renter-occupied |
| Less than $5,000 | 7 (3.5%) | 5 (19.2%) |
| $5,000 to $9,999 | 0 (0.0%) | 1 (3.8%) |
| $10,000 to $14,999 | 0 (0.0%) | 6 (23.1%) |
| $15,000 to $19,999 | 1 (0.5%) | 0 (0.0%) |
| $20,000 to $24,999 | 12 (6.0%) | 4 (15.4%) |
| $25,000 to $34,999 | 9 (4.5%) | 1 (3.8%) |
| $35,000 to $49,999 | 42 (20.9%) | 5 (19.2%) |
| $50,000 to $74,999 | 24 (11.9%) | 0 (0.0%) |
| $75,000 to $99,999 | 20 (10.0%) | 4 (15.4%) |
| $100,000 to $149,999 | 84 (41.8%) | 0 (0.0%) |
| $150,000 or more | 2 (1.0%) | 0 (0.0%) |
| Total | 201 (100.0%) | 26 (100.0%) |
Monthly Housing Cost Tiers in Kenney
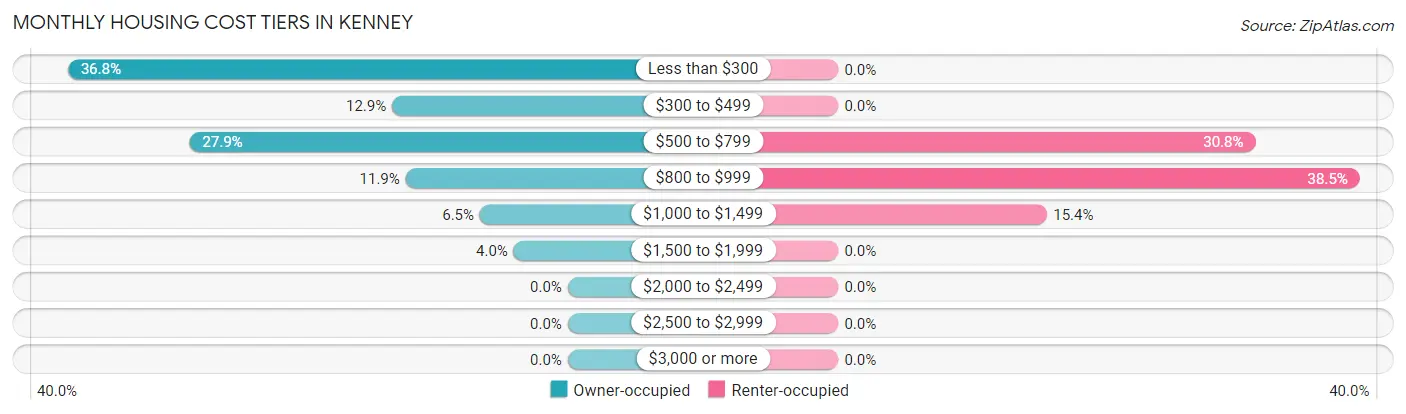
| Monthly Cost | Owner-occupied | Renter-occupied |
| Less than $300 | 74 (36.8%) | 0 (0.0%) |
| $300 to $499 | 26 (12.9%) | 0 (0.0%) |
| $500 to $799 | 56 (27.9%) | 8 (30.8%) |
| $800 to $999 | 24 (11.9%) | 10 (38.5%) |
| $1,000 to $1,499 | 13 (6.5%) | 4 (15.4%) |
| $1,500 to $1,999 | 8 (4.0%) | 0 (0.0%) |
| $2,000 to $2,499 | 0 (0.0%) | 0 (0.0%) |
| $2,500 to $2,999 | 0 (0.0%) | 0 (0.0%) |
| $3,000 or more | 0 (0.0%) | 0 (0.0%) |
| Total | 201 (100.0%) | 26 (100.0%) |
Physical Housing Characteristics in Kenney
Housing Structures in Kenney
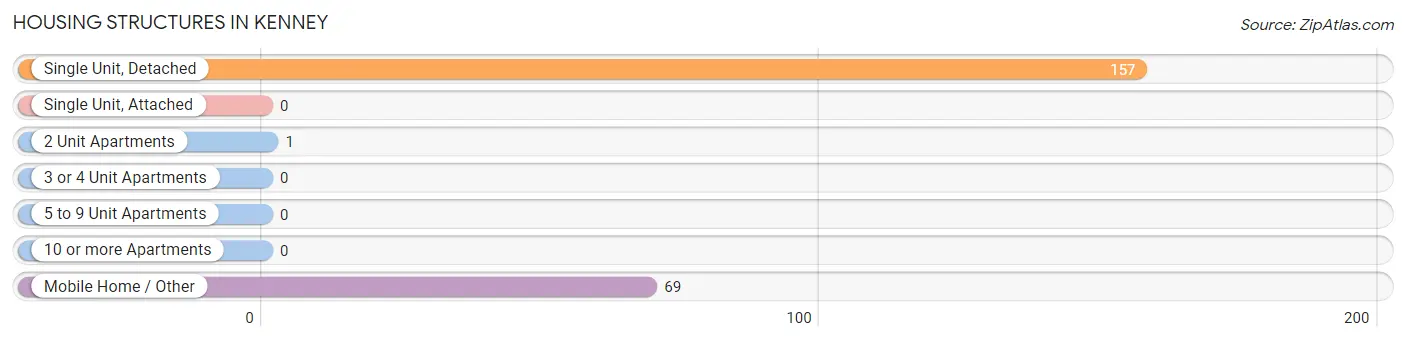
| Structure Type | # Housing Units | % Housing Units |
| Single Unit, Detached | 157 | 69.2% |
| Single Unit, Attached | 0 | 0.0% |
| 2 Unit Apartments | 1 | 0.4% |
| 3 or 4 Unit Apartments | 0 | 0.0% |
| 5 to 9 Unit Apartments | 0 | 0.0% |
| 10 or more Apartments | 0 | 0.0% |
| Mobile Home / Other | 69 | 30.4% |
| Total | 227 | 100.0% |
Housing Structures by Occupancy in Kenney
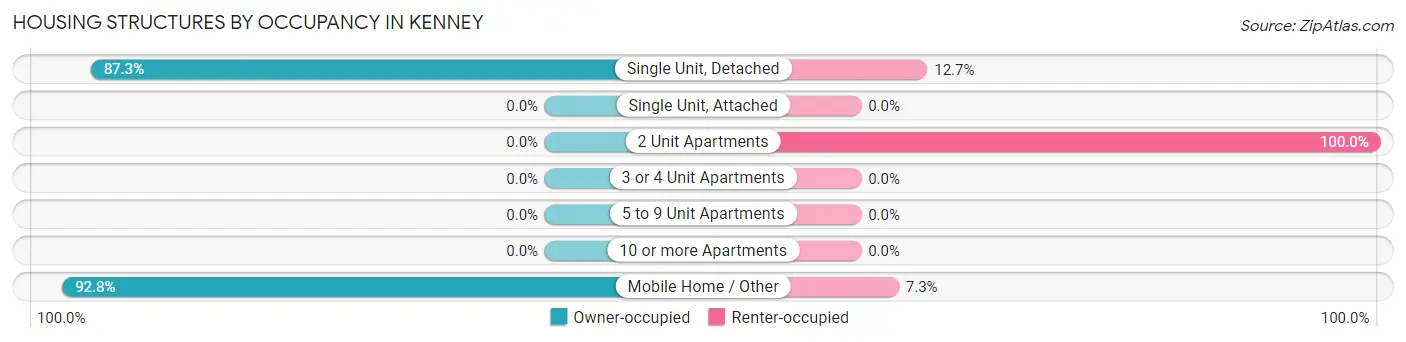
| Structure Type | Owner-occupied | Renter-occupied |
| Single Unit, Detached | 137 (87.3%) | 20 (12.7%) |
| Single Unit, Attached | 0 (0.0%) | 0 (0.0%) |
| 2 Unit Apartments | 0 (0.0%) | 1 (100.0%) |
| 3 or 4 Unit Apartments | 0 (0.0%) | 0 (0.0%) |
| 5 to 9 Unit Apartments | 0 (0.0%) | 0 (0.0%) |
| 10 or more Apartments | 0 (0.0%) | 0 (0.0%) |
| Mobile Home / Other | 64 (92.7%) | 5 (7.2%) |
| Total | 201 (88.5%) | 26 (11.5%) |
Housing Structures by Number of Rooms in Kenney
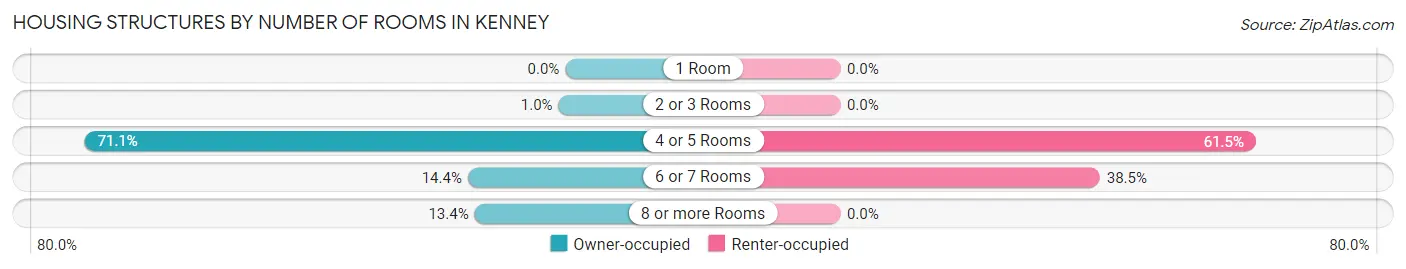
| Number of Rooms | Owner-occupied | Renter-occupied |
| 1 Room | 0 (0.0%) | 0 (0.0%) |
| 2 or 3 Rooms | 2 (1.0%) | 0 (0.0%) |
| 4 or 5 Rooms | 143 (71.1%) | 16 (61.5%) |
| 6 or 7 Rooms | 29 (14.4%) | 10 (38.5%) |
| 8 or more Rooms | 27 (13.4%) | 0 (0.0%) |
| Total | 201 (100.0%) | 26 (100.0%) |
Housing Structure by Heating Type in Kenney
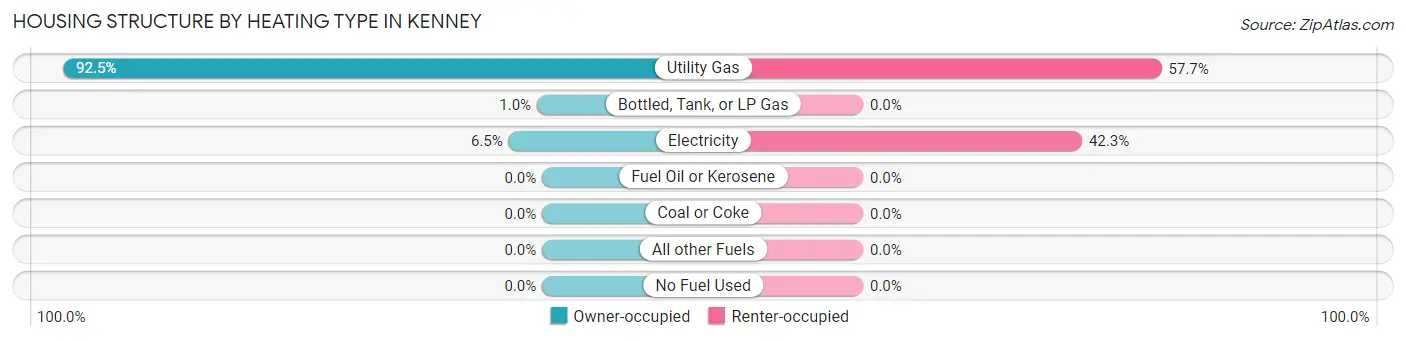
| Heating Type | Owner-occupied | Renter-occupied |
| Utility Gas | 186 (92.5%) | 15 (57.7%) |
| Bottled, Tank, or LP Gas | 2 (1.0%) | 0 (0.0%) |
| Electricity | 13 (6.5%) | 11 (42.3%) |
| Fuel Oil or Kerosene | 0 (0.0%) | 0 (0.0%) |
| Coal or Coke | 0 (0.0%) | 0 (0.0%) |
| All other Fuels | 0 (0.0%) | 0 (0.0%) |
| No Fuel Used | 0 (0.0%) | 0 (0.0%) |
| Total | 201 (100.0%) | 26 (100.0%) |
Household Vehicle Usage in Kenney
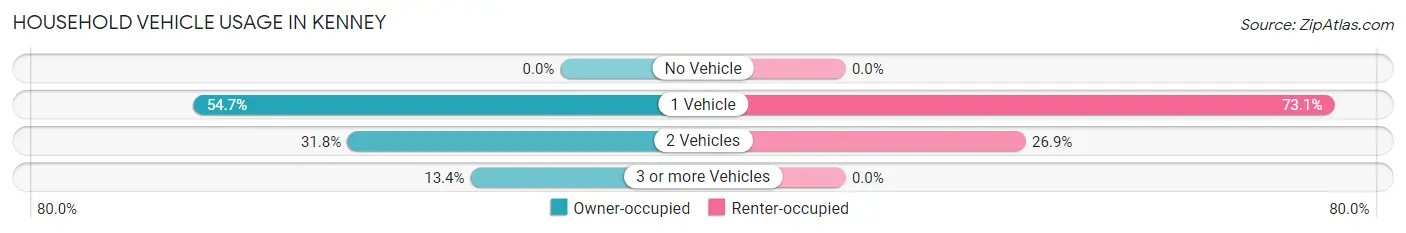
| Vehicles per Household | Owner-occupied | Renter-occupied |
| No Vehicle | 0 (0.0%) | 0 (0.0%) |
| 1 Vehicle | 110 (54.7%) | 19 (73.1%) |
| 2 Vehicles | 64 (31.8%) | 7 (26.9%) |
| 3 or more Vehicles | 27 (13.4%) | 0 (0.0%) |
| Total | 201 (100.0%) | 26 (100.0%) |
Real Estate & Mortgages in Kenney
Real Estate and Mortgage Overview in Kenney
| Characteristic | Without Mortgage | With Mortgage |
| Housing Units | 140 | 61 |
| Median Property Value | - | - |
| Median Household Income | - | - |
| Monthly Housing Costs | - | - |
| Real Estate Taxes | - | - |
Property Value by Mortgage Status in Kenney
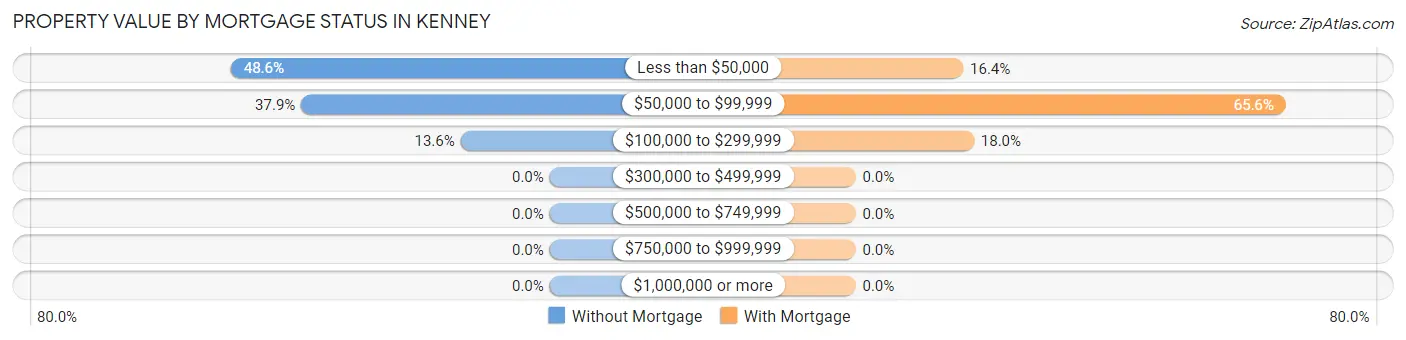
| Property Value | Without Mortgage | With Mortgage |
| Less than $50,000 | 68 (48.6%) | 10 (16.4%) |
| $50,000 to $99,999 | 53 (37.9%) | 40 (65.6%) |
| $100,000 to $299,999 | 19 (13.6%) | 11 (18.0%) |
| $300,000 to $499,999 | 0 (0.0%) | 0 (0.0%) |
| $500,000 to $749,999 | 0 (0.0%) | 0 (0.0%) |
| $750,000 to $999,999 | 0 (0.0%) | 0 (0.0%) |
| $1,000,000 or more | 0 (0.0%) | 0 (0.0%) |
| Total | 140 (100.0%) | 61 (100.0%) |
Household Income by Mortgage Status in Kenney
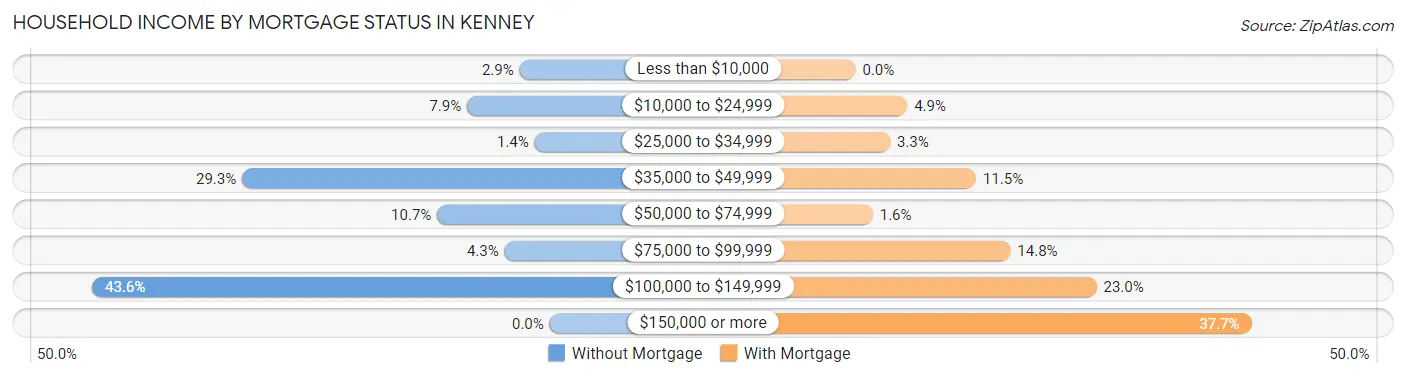
| Household Income | Without Mortgage | With Mortgage |
| Less than $10,000 | 4 (2.9%) | 0 (0.0%) |
| $10,000 to $24,999 | 11 (7.9%) | 3 (4.9%) |
| $25,000 to $34,999 | 2 (1.4%) | 2 (3.3%) |
| $35,000 to $49,999 | 41 (29.3%) | 7 (11.5%) |
| $50,000 to $74,999 | 15 (10.7%) | 1 (1.6%) |
| $75,000 to $99,999 | 6 (4.3%) | 9 (14.7%) |
| $100,000 to $149,999 | 61 (43.6%) | 14 (23.0%) |
| $150,000 or more | 0 (0.0%) | 23 (37.7%) |
| Total | 140 (100.0%) | 61 (100.0%) |
Property Value to Household Income Ratio in Kenney
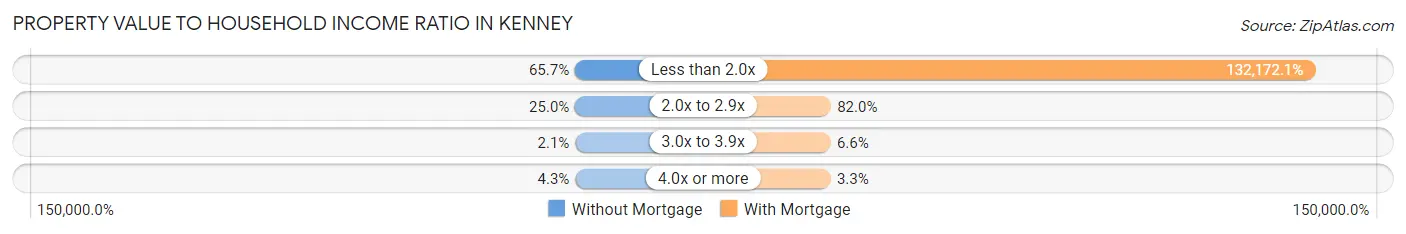
| Value-to-Income Ratio | Without Mortgage | With Mortgage |
| Less than 2.0x | 92 (65.7%) | 80,625 (132,172.1%) |
| 2.0x to 2.9x | 35 (25.0%) | 50 (82.0%) |
| 3.0x to 3.9x | 3 (2.1%) | 4 (6.6%) |
| 4.0x or more | 6 (4.3%) | 2 (3.3%) |
| Total | 140 (100.0%) | 61 (100.0%) |
Real Estate Taxes by Mortgage Status in Kenney
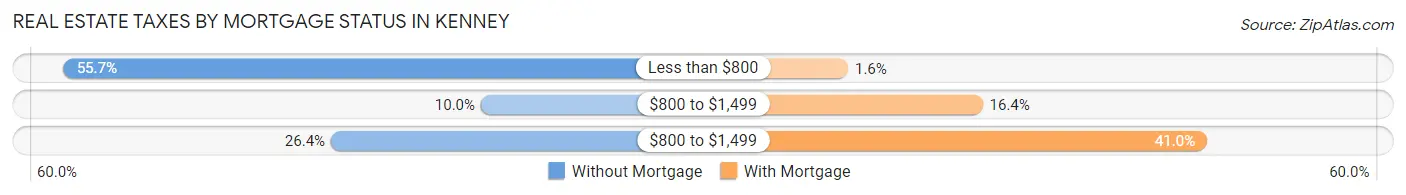
| Property Taxes | Without Mortgage | With Mortgage |
| Less than $800 | 78 (55.7%) | 1 (1.6%) |
| $800 to $1,499 | 14 (10.0%) | 10 (16.4%) |
| $800 to $1,499 | 37 (26.4%) | 25 (41.0%) |
| Total | 140 (100.0%) | 61 (100.0%) |
Health & Disability in Kenney
Health Insurance Coverage by Age in Kenney
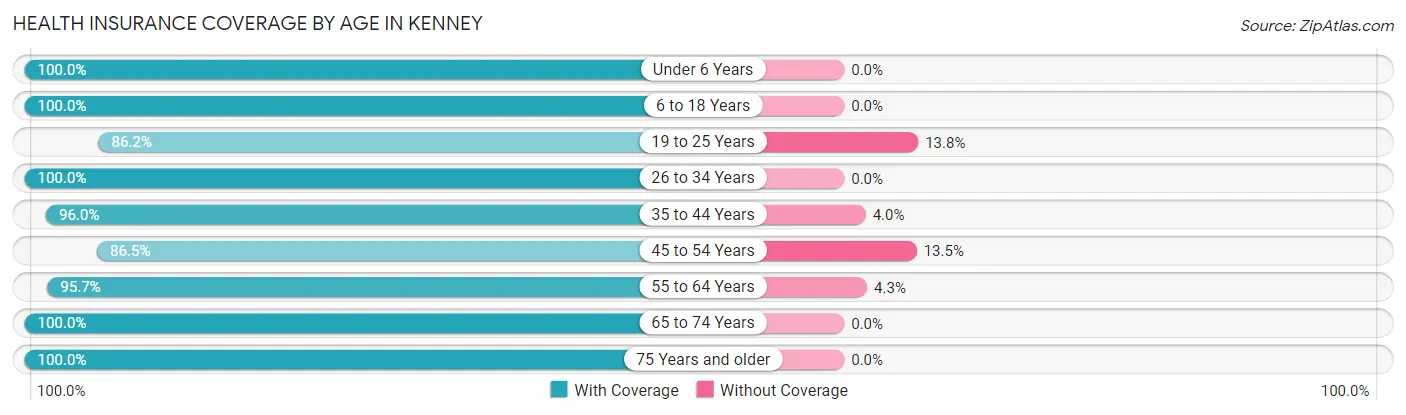
| Age Bracket | With Coverage | Without Coverage |
| Under 6 Years | 20 (100.0%) | 0 (0.0%) |
| 6 to 18 Years | 22 (100.0%) | 0 (0.0%) |
| 19 to 25 Years | 25 (86.2%) | 4 (13.8%) |
| 26 to 34 Years | 12 (100.0%) | 0 (0.0%) |
| 35 to 44 Years | 48 (96.0%) | 2 (4.0%) |
| 45 to 54 Years | 32 (86.5%) | 5 (13.5%) |
| 55 to 64 Years | 90 (95.7%) | 4 (4.3%) |
| 65 to 74 Years | 53 (100.0%) | 0 (0.0%) |
| 75 Years and older | 52 (100.0%) | 0 (0.0%) |
| Total | 354 (95.9%) | 15 (4.1%) |
Health Insurance Coverage by Citizenship Status in Kenney
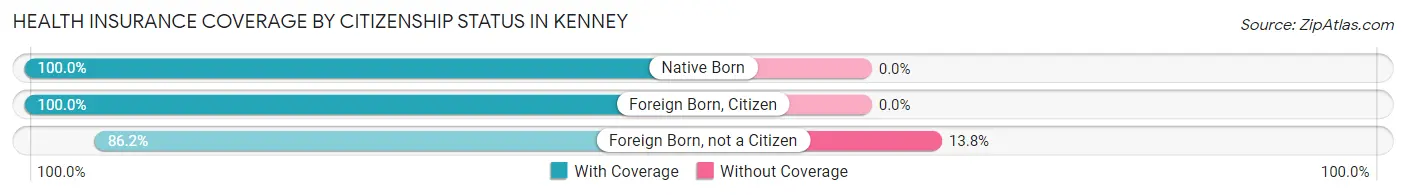
| Citizenship Status | With Coverage | Without Coverage |
| Native Born | 20 (100.0%) | 0 (0.0%) |
| Foreign Born, Citizen | 22 (100.0%) | 0 (0.0%) |
| Foreign Born, not a Citizen | 25 (86.2%) | 4 (13.8%) |
Health Insurance Coverage by Household Income in Kenney
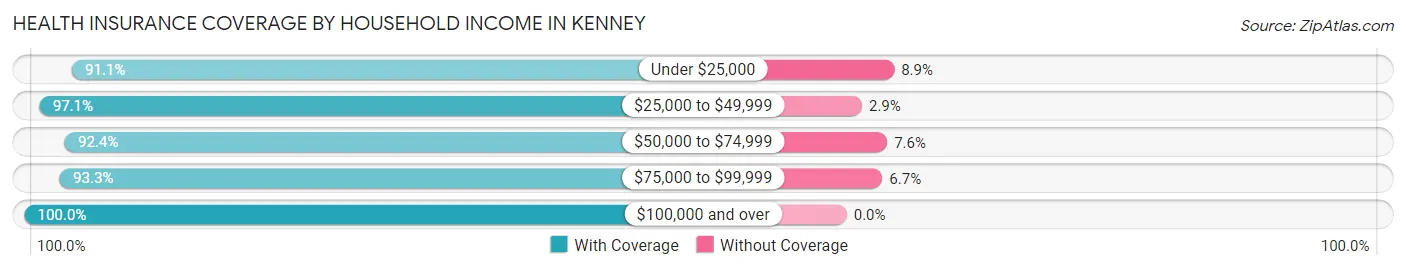
| Household Income | With Coverage | Without Coverage |
| Under $25,000 | 41 (91.1%) | 4 (8.9%) |
| $25,000 to $49,999 | 68 (97.1%) | 2 (2.9%) |
| $50,000 to $74,999 | 61 (92.4%) | 5 (7.6%) |
| $75,000 to $99,999 | 56 (93.3%) | 4 (6.7%) |
| $100,000 and over | 128 (100.0%) | 0 (0.0%) |
Public vs Private Health Insurance Coverage by Age in Kenney
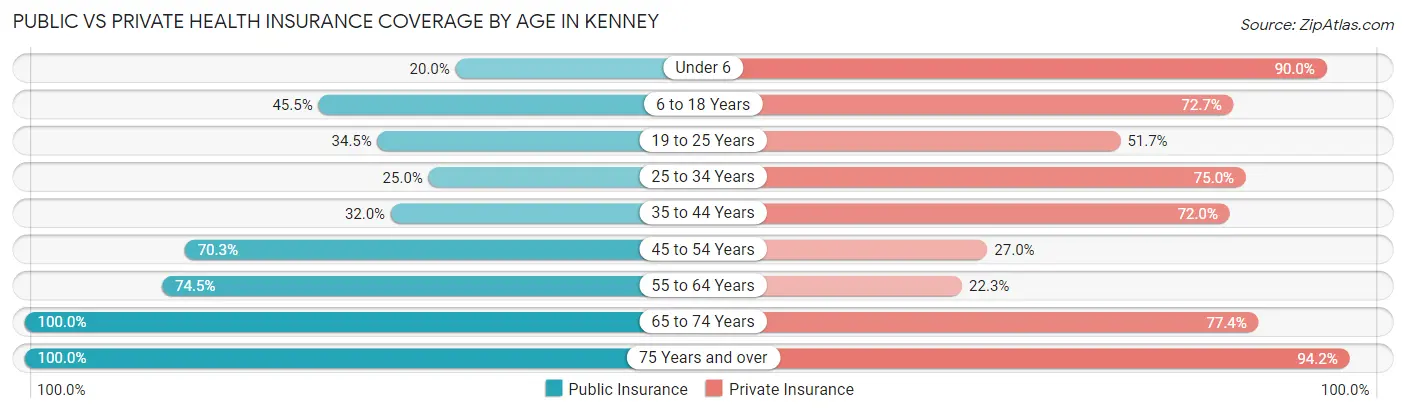
| Age Bracket | Public Insurance | Private Insurance |
| Under 6 | 4 (20.0%) | 18 (90.0%) |
| 6 to 18 Years | 10 (45.5%) | 16 (72.7%) |
| 19 to 25 Years | 10 (34.5%) | 15 (51.7%) |
| 25 to 34 Years | 3 (25.0%) | 9 (75.0%) |
| 35 to 44 Years | 16 (32.0%) | 36 (72.0%) |
| 45 to 54 Years | 26 (70.3%) | 10 (27.0%) |
| 55 to 64 Years | 70 (74.5%) | 21 (22.3%) |
| 65 to 74 Years | 53 (100.0%) | 41 (77.4%) |
| 75 Years and over | 52 (100.0%) | 49 (94.2%) |
| Total | 244 (66.1%) | 215 (58.3%) |
Disability Status by Sex by Age in Kenney
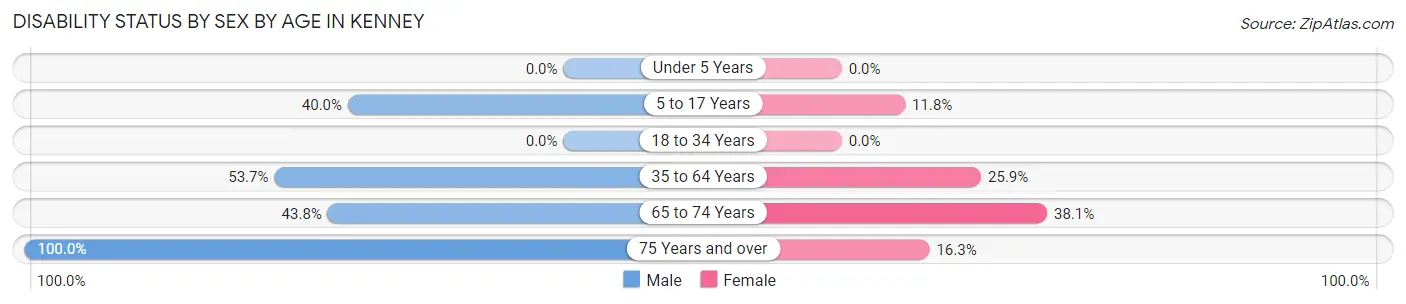
| Age Bracket | Male | Female |
| Under 5 Years | 0 (0.0%) | 0 (0.0%) |
| 5 to 17 Years | 2 (40.0%) | 2 (11.8%) |
| 18 to 34 Years | 0 (0.0%) | 0 (0.0%) |
| 35 to 64 Years | 66 (53.7%) | 15 (25.9%) |
| 65 to 74 Years | 14 (43.8%) | 8 (38.1%) |
| 75 Years and over | 9 (100.0%) | 7 (16.3%) |
Disability Class by Sex by Age in Kenney
Disability Class: Hearing Difficulty
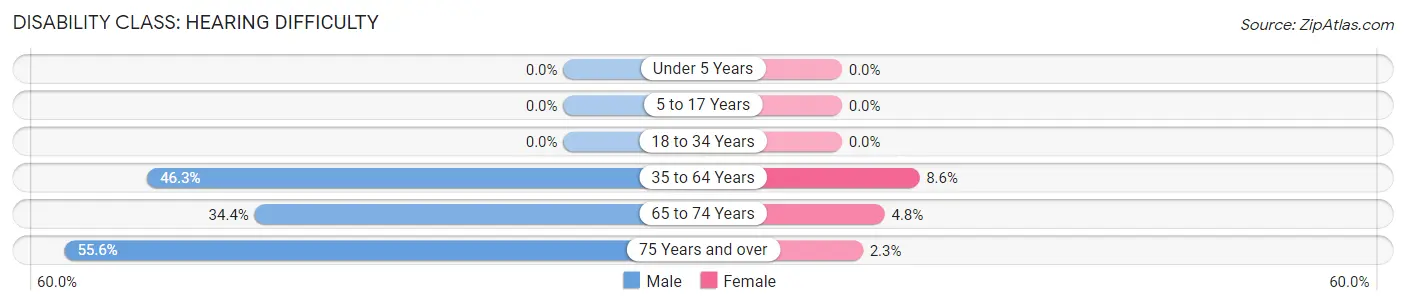
| Age Bracket | Male | Female |
| Under 5 Years | 0 (0.0%) | 0 (0.0%) |
| 5 to 17 Years | 0 (0.0%) | 0 (0.0%) |
| 18 to 34 Years | 0 (0.0%) | 0 (0.0%) |
| 35 to 64 Years | 57 (46.3%) | 5 (8.6%) |
| 65 to 74 Years | 11 (34.4%) | 1 (4.8%) |
| 75 Years and over | 5 (55.6%) | 1 (2.3%) |
Disability Class: Vision Difficulty
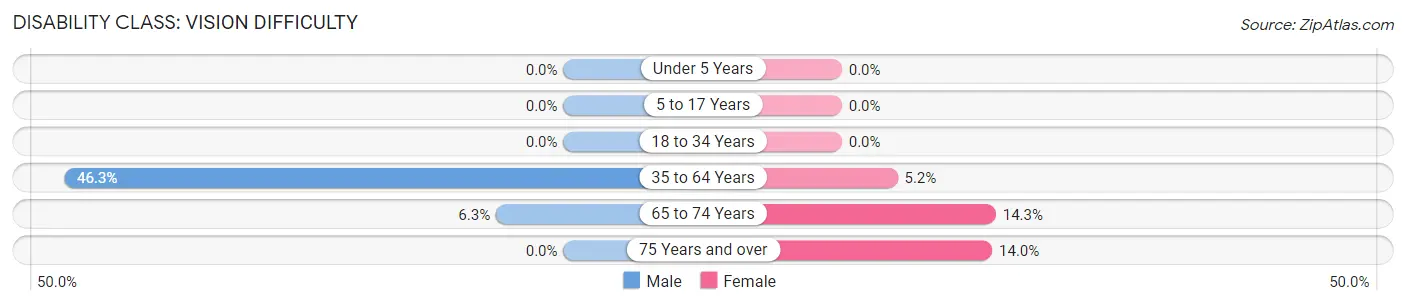
| Age Bracket | Male | Female |
| Under 5 Years | 0 (0.0%) | 0 (0.0%) |
| 5 to 17 Years | 0 (0.0%) | 0 (0.0%) |
| 18 to 34 Years | 0 (0.0%) | 0 (0.0%) |
| 35 to 64 Years | 57 (46.3%) | 3 (5.2%) |
| 65 to 74 Years | 2 (6.2%) | 3 (14.3%) |
| 75 Years and over | 0 (0.0%) | 6 (14.0%) |
Disability Class: Cognitive Difficulty
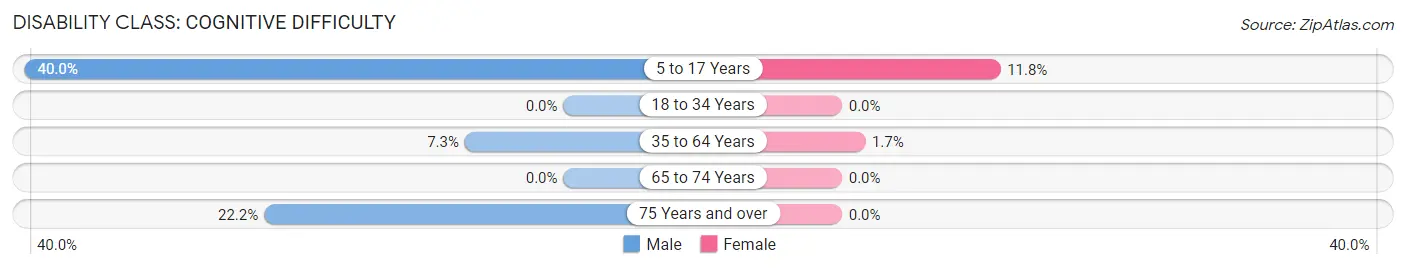
| Age Bracket | Male | Female |
| 5 to 17 Years | 2 (40.0%) | 2 (11.8%) |
| 18 to 34 Years | 0 (0.0%) | 0 (0.0%) |
| 35 to 64 Years | 9 (7.3%) | 1 (1.7%) |
| 65 to 74 Years | 0 (0.0%) | 0 (0.0%) |
| 75 Years and over | 2 (22.2%) | 0 (0.0%) |
Disability Class: Ambulatory Difficulty
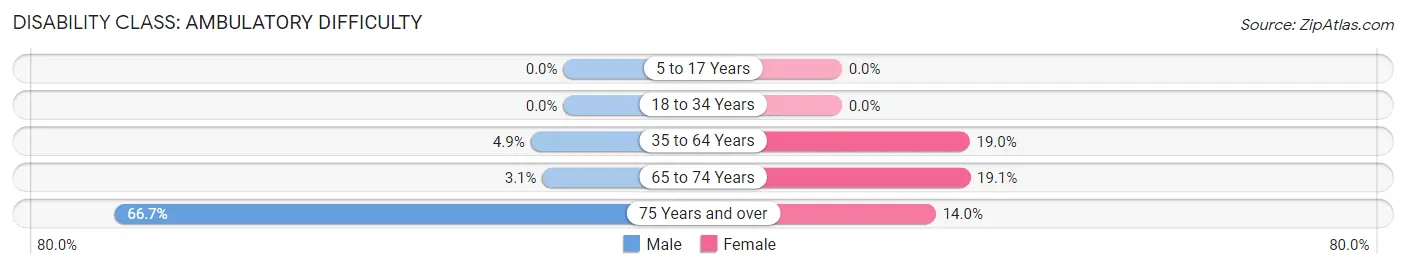
| Age Bracket | Male | Female |
| 5 to 17 Years | 0 (0.0%) | 0 (0.0%) |
| 18 to 34 Years | 0 (0.0%) | 0 (0.0%) |
| 35 to 64 Years | 6 (4.9%) | 11 (19.0%) |
| 65 to 74 Years | 1 (3.1%) | 4 (19.1%) |
| 75 Years and over | 6 (66.7%) | 6 (14.0%) |
Disability Class: Self-Care Difficulty
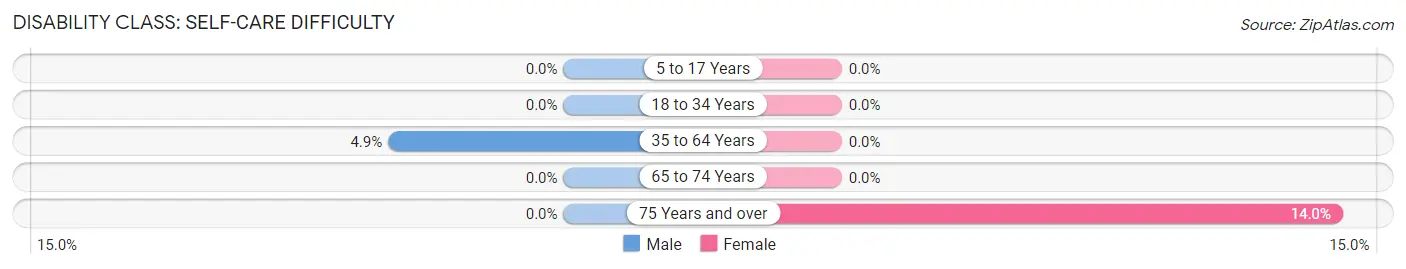
| Age Bracket | Male | Female |
| 5 to 17 Years | 0 (0.0%) | 0 (0.0%) |
| 18 to 34 Years | 0 (0.0%) | 0 (0.0%) |
| 35 to 64 Years | 6 (4.9%) | 0 (0.0%) |
| 65 to 74 Years | 0 (0.0%) | 0 (0.0%) |
| 75 Years and over | 0 (0.0%) | 6 (14.0%) |
Technology Access in Kenney
Computing Device Access in Kenney
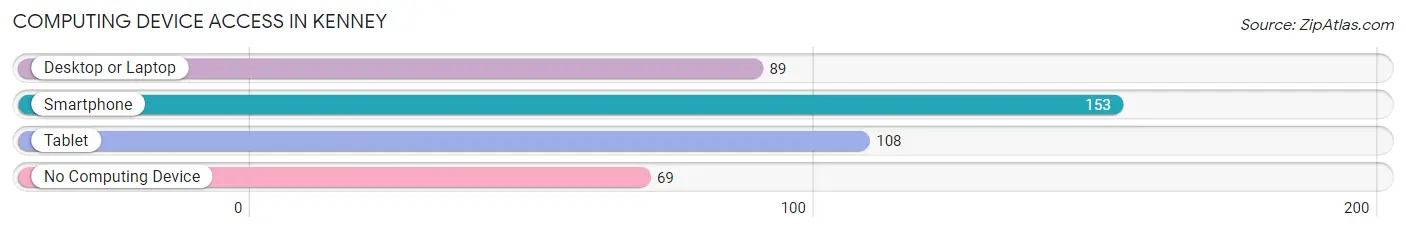
| Device Type | # Households | % Households |
| Desktop or Laptop | 89 | 39.2% |
| Smartphone | 153 | 67.4% |
| Tablet | 108 | 47.6% |
| No Computing Device | 69 | 30.4% |
| Total | 227 | 100.0% |
Internet Access in Kenney
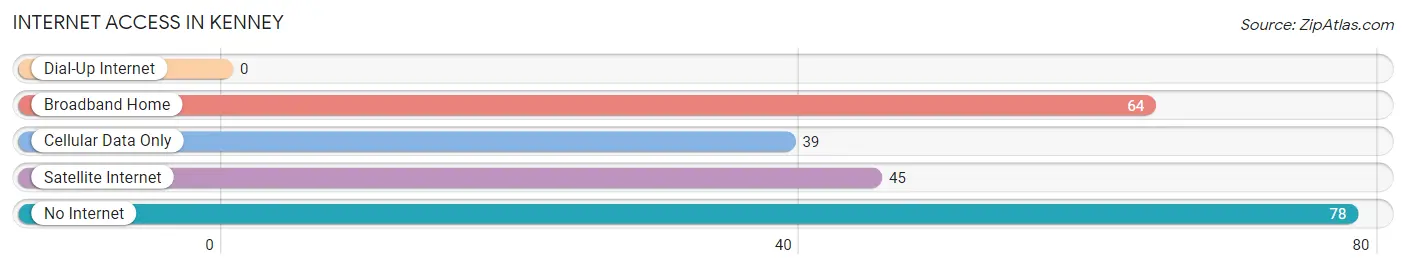
| Internet Type | # Households | % Households |
| Dial-Up Internet | 0 | 0.0% |
| Broadband Home | 64 | 28.2% |
| Cellular Data Only | 39 | 17.2% |
| Satellite Internet | 45 | 19.8% |
| No Internet | 78 | 34.4% |
| Total | 227 | 100.0% |
Kenney Summary
Kenney, Illinois is a small village located in Logan County, Illinois. It is situated about 25 miles northwest of Springfield, the state capital. The village has a population of approximately 500 people and covers an area of 0.6 square miles.
History
Kenney was founded in 1854 by William Kenney, a settler from Ohio. He purchased the land from the federal government and began to develop the area. The village was originally known as Kenney’s Station, but the name was changed to Kenney in 1858.
The village was incorporated in 1872 and the first mayor was elected in 1873. The village grew slowly over the years, but it was not until the early 1900s that it began to experience significant growth. The population increased from just over 200 in 1900 to nearly 500 by the year 2000.
Geography
Kenney is located in the northern part of Logan County, Illinois. It is situated about 25 miles northwest of Springfield, the state capital. The village is located on the banks of the Sangamon River and is surrounded by rolling hills and farmland.
The climate in Kenney is typical of the Midwest, with hot summers and cold winters. The average temperature in the summer is around 80 degrees Fahrenheit and the average temperature in the winter is around 30 degrees Fahrenheit.
Economy
The economy of Kenney is largely based on agriculture. The village is home to several farms, which produce a variety of crops, including corn, soybeans, and wheat. The village also has a few small businesses, including a grocery store, a hardware store, and a few restaurants.
Demographics
As of the 2010 census, the population of Kenney was 498 people. The racial makeup of the village was 97.6% White, 0.2% African American, 0.2% Native American, 0.2% Asian, 0.2% from other races, and 1.8% from two or more races. Hispanic or Latino of any race were 0.8% of the population.
The median income for a household in Kenney was $45,000, and the median income for a family was $50,000. The per capita income for the village was $20,000. About 8.3% of families and 10.2% of the population were below the poverty line, including 11.3% of those under age 18 and 8.3% of those age 65 or over.
Conclusion
Kenney, Illinois is a small village located in Logan County, Illinois. It is situated about 25 miles northwest of Springfield, the state capital. The village has a population of approximately 500 people and covers an area of 0.6 square miles. The economy of Kenney is largely based on agriculture, and the village is home to several farms, which produce a variety of crops. The racial makeup of the village is predominantly White, with a small percentage of African American, Native American, Asian, and other races. The median income for a household in Kenney is $45,000, and the median income for a family is $50,000.
Common Questions
What is Per Capita Income in Kenney?
Per Capita income in Kenney is $42,240.
What is the Median Family Income in Kenney?
Median Family Income in Kenney is $78,214.
What is the Median Household income in Kenney?
Median Household Income in Kenney is $74,125.
What is Family Income Deficit in Kenney?
Family Income Deficit in Kenney is $15,400.
Families that are below poverty line in Kenney earn $15,400 less on average than the poverty threshold level.
What is Inequality or Gini Index in Kenney?
Inequality or Gini Index in Kenney is 0.32.
What is the Total Population of Kenney?
Total Population of Kenney is 369.
What is the Total Male Population of Kenney?
Total Male Population of Kenney is 206.
What is the Total Female Population of Kenney?
Total Female Population of Kenney is 163.
What is the Ratio of Males per 100 Females in Kenney?
There are 126.38 Males per 100 Females in Kenney.
What is the Ratio of Females per 100 Males in Kenney?
There are 79.13 Females per 100 Males in Kenney.
What is the Median Population Age in Kenney?
Median Population Age in Kenney is 59.7 Years.
What is the Average Family Size in Kenney
Average Family Size in Kenney is 2.6 People.
What is the Average Household Size in Kenney
Average Household Size in Kenney is 1.6 People.
How Large is the Labor Force in Kenney?
There are 141 People in the Labor Forcein in Kenney.
What is the Percentage of People in the Labor Force in Kenney?
42.6% of People are in the Labor Force in Kenney.
What is the Unemployment Rate in Kenney?
Unemployment Rate in Kenney is 14.2%.