Alton, IL Map & Demographics
Alton Map
Alton Overview
$28,120
PER CAPITA INCOME
$66,837
AVG FAMILY INCOME
$49,439
AVG HOUSEHOLD INCOME
17.8%
WAGE / INCOME GAP [ % ]
82.2¢/ $1
WAGE / INCOME GAP [ $ ]
$13,684
FAMILY INCOME DEFICIT
0.46
INEQUALITY / GINI INDEX
25,642
TOTAL POPULATION
12,244
MALE POPULATION
13,398
FEMALE POPULATION
91.39
MALES / 100 FEMALES
109.43
FEMALES / 100 MALES
38.3
MEDIAN AGE
3.1
AVG FAMILY SIZE
2.3
AVG HOUSEHOLD SIZE
12,135
LABOR FORCE [ PEOPLE ]
60.1%
PERCENT IN LABOR FORCE
6.6%
UNEMPLOYMENT RATE
Alton Zip Codes
Alton Area Codes
Income in Alton
Income Overview in Alton
Per Capita Income in Alton is $28,120, while median incomes of families and households are $66,837 and $49,439 respectively.
| Characteristic | Number | Measure |
| Per Capita Income | 25,642 | $28,120 |
| Median Family Income | 5,651 | $66,837 |
| Mean Family Income | 5,651 | $79,546 |
| Median Household Income | 10,878 | $49,439 |
| Mean Household Income | 10,878 | $64,590 |
| Income Deficit | 5,651 | $13,684 |
| Wage / Income Gap (%) | 25,642 | 17.82% |
| Wage / Income Gap ($) | 25,642 | 82.18¢ per $1 |
| Gini / Inequality Index | 25,642 | 0.46 |
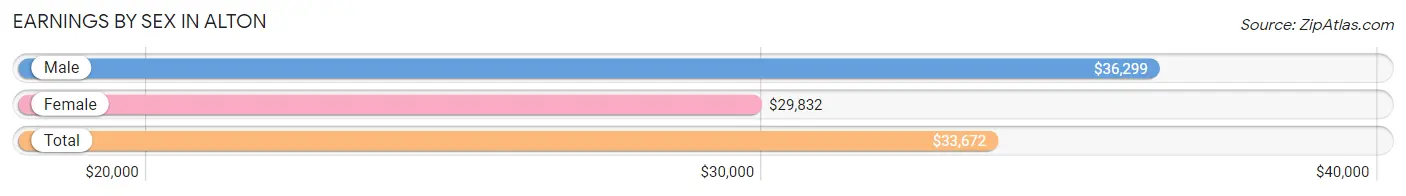
Earnings by Sex in Alton
Average Earnings in Alton are $33,672, $36,299 for men and $29,832 for women, a difference of 17.8%.
| Sex | Number | Average Earnings |
| Male | 6,106 (49.0%) | $36,299 |
| Female | 6,363 (51.0%) | $29,832 |
| Total | 12,469 (100.0%) | $33,672 |
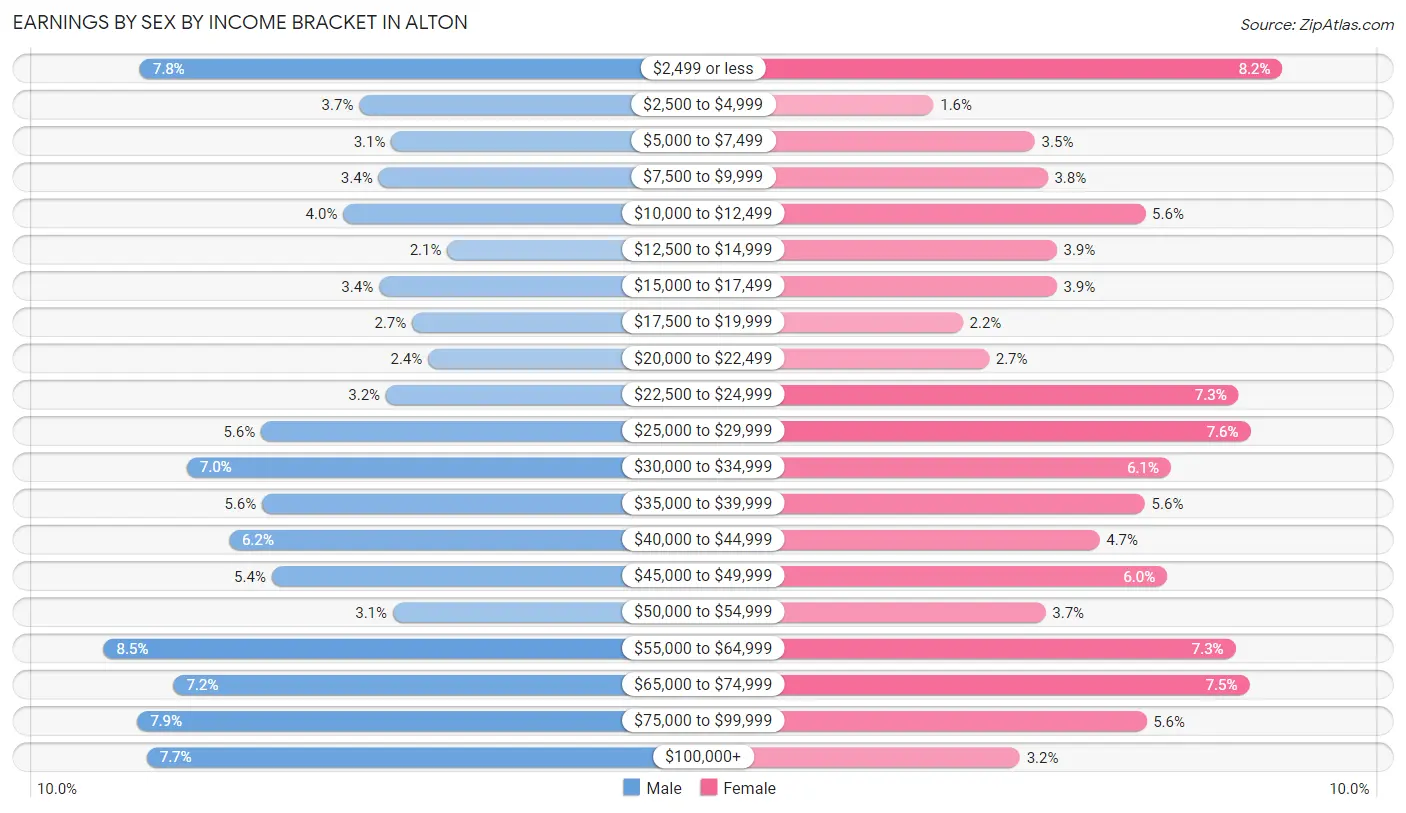
Earnings by Sex by Income Bracket in Alton
The most common earnings brackets in Alton are $55,000 to $64,999 for men (520 | 8.5%) and $2,499 or less for women (519 | 8.2%).
| Income | Male | Female |
| $2,499 or less | 479 (7.8%) | 519 (8.2%) |
| $2,500 to $4,999 | 228 (3.7%) | 103 (1.6%) |
| $5,000 to $7,499 | 191 (3.1%) | 224 (3.5%) |
| $7,500 to $9,999 | 206 (3.4%) | 239 (3.8%) |
| $10,000 to $12,499 | 246 (4.0%) | 356 (5.6%) |
| $12,500 to $14,999 | 127 (2.1%) | 250 (3.9%) |
| $15,000 to $17,499 | 205 (3.4%) | 250 (3.9%) |
| $17,500 to $19,999 | 167 (2.7%) | 138 (2.2%) |
| $20,000 to $22,499 | 149 (2.4%) | 169 (2.7%) |
| $22,500 to $24,999 | 197 (3.2%) | 467 (7.3%) |
| $25,000 to $29,999 | 340 (5.6%) | 481 (7.6%) |
| $30,000 to $34,999 | 425 (7.0%) | 386 (6.1%) |
| $35,000 to $39,999 | 339 (5.6%) | 355 (5.6%) |
| $40,000 to $44,999 | 377 (6.2%) | 301 (4.7%) |
| $45,000 to $49,999 | 328 (5.4%) | 382 (6.0%) |
| $50,000 to $54,999 | 189 (3.1%) | 237 (3.7%) |
| $55,000 to $64,999 | 520 (8.5%) | 463 (7.3%) |
| $65,000 to $74,999 | 440 (7.2%) | 480 (7.5%) |
| $75,000 to $99,999 | 482 (7.9%) | 357 (5.6%) |
| $100,000+ | 471 (7.7%) | 206 (3.2%) |
| Total | 6,106 (100.0%) | 6,363 (100.0%) |
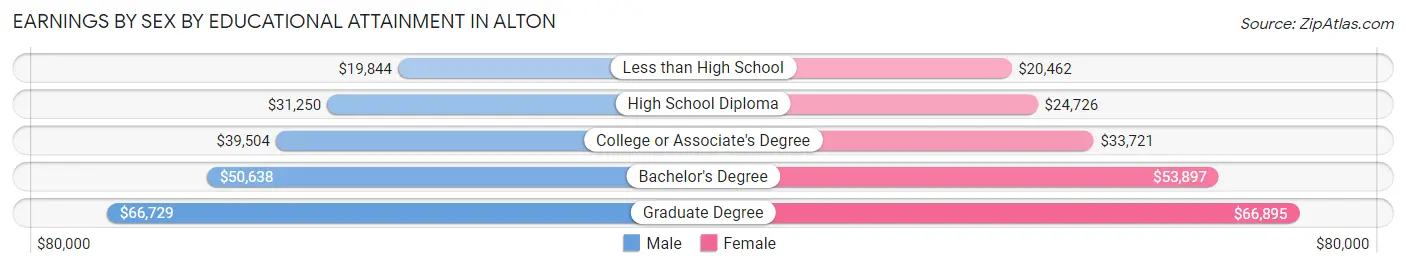
Earnings by Sex by Educational Attainment in Alton
Average earnings in Alton are $40,851 for men and $33,978 for women, a difference of 16.8%. Men with an educational attainment of graduate degree enjoy the highest average annual earnings of $66,729, while those with less than high school education earn the least with $19,844. Women with an educational attainment of graduate degree earn the most with the average annual earnings of $66,895, while those with less than high school education have the smallest earnings of $20,462.
| Educational Attainment | Male Income | Female Income |
| Less than High School | $19,844 | $20,462 |
| High School Diploma | $31,250 | $24,726 |
| College or Associate's Degree | $39,504 | $33,721 |
| Bachelor's Degree | $50,638 | $53,897 |
| Graduate Degree | $66,729 | $66,895 |
| Total | $40,851 | $33,978 |
Family Income in Alton
Family Income Brackets in Alton
According to the Alton family income data, there are 1,040 families falling into the $50,000 to $74,999 income range, which is the most common income bracket and makes up 18.4% of all families. Conversely, the $10,000 to $14,999 income bracket is the least frequent group with only 209 families (3.7%) belonging to this category.
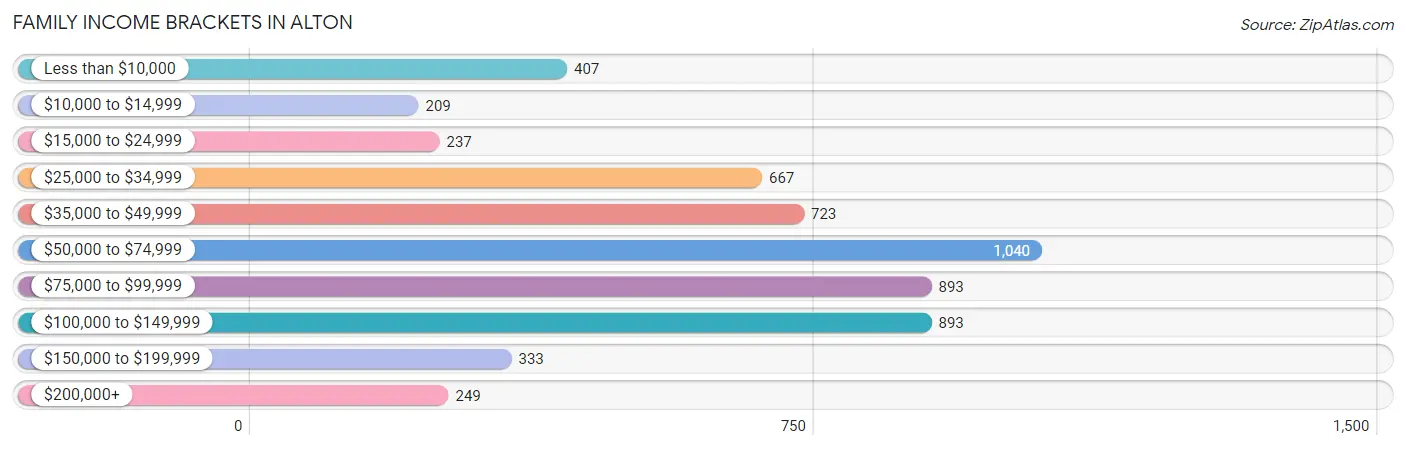
| Income Bracket | # Families | % Families |
| Less than $10,000 | 407 | 7.2% |
| $10,000 to $14,999 | 209 | 3.7% |
| $15,000 to $24,999 | 237 | 4.2% |
| $25,000 to $34,999 | 667 | 11.8% |
| $35,000 to $49,999 | 723 | 12.8% |
| $50,000 to $74,999 | 1,040 | 18.4% |
| $75,000 to $99,999 | 893 | 15.8% |
| $100,000 to $149,999 | 893 | 15.8% |
| $150,000 to $199,999 | 333 | 5.9% |
| $200,000+ | 249 | 4.4% |
Family Income by Famaliy Size in Alton
4-person families (1,003 | 17.7%) account for the highest median family income in Alton with $84,369 per family, while 2-person families (2,478 | 43.9%) have the highest median income of $32,796 per family member.
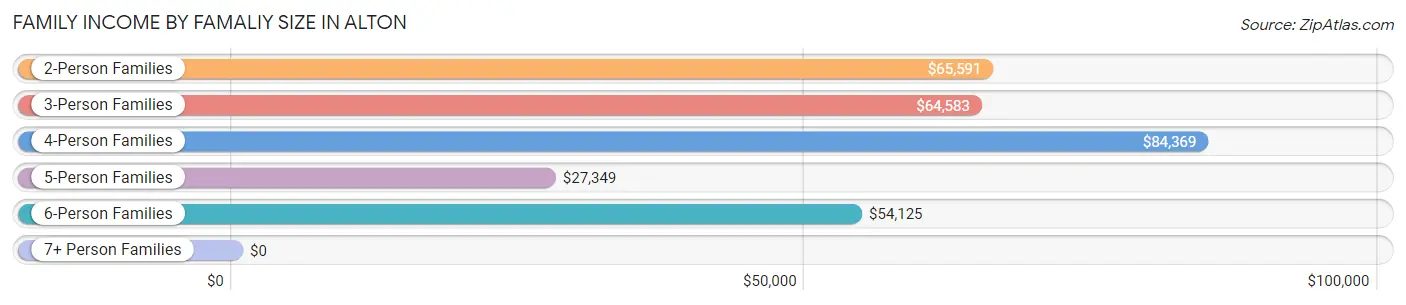
| Income Bracket | # Families | Median Income |
| 2-Person Families | 2,478 (43.9%) | $65,591 |
| 3-Person Families | 1,499 (26.5%) | $64,583 |
| 4-Person Families | 1,003 (17.7%) | $84,369 |
| 5-Person Families | 418 (7.4%) | $27,349 |
| 6-Person Families | 159 (2.8%) | $54,125 |
| 7+ Person Families | 94 (1.7%) | $0 |
| Total | 5,651 (100.0%) | $66,837 |
Family Income by Number of Earners in Alton
The median family income in Alton is $66,837, with families comprising 3+ earners (423) having the highest median family income of $97,404, while families with no earners (923) have the lowest median family income of $40,919, accounting for 7.5% and 16.3% of families, respectively.
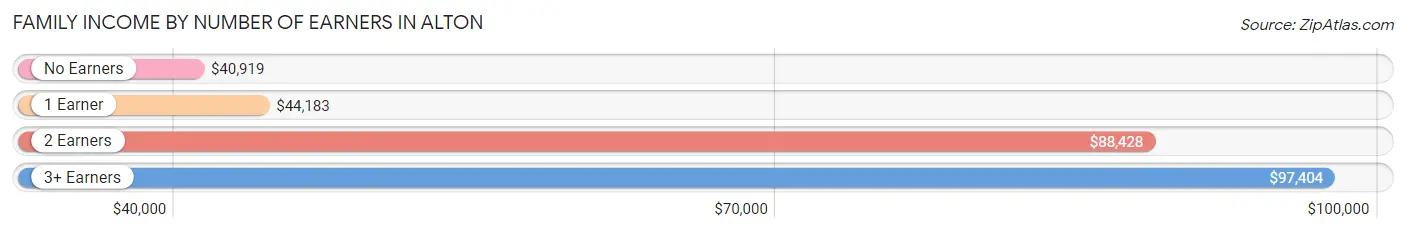
| Number of Earners | # Families | Median Income |
| No Earners | 923 (16.3%) | $40,919 |
| 1 Earner | 2,106 (37.3%) | $44,183 |
| 2 Earners | 2,199 (38.9%) | $88,428 |
| 3+ Earners | 423 (7.5%) | $97,404 |
| Total | 5,651 (100.0%) | $66,837 |
Household Income in Alton
Household Income Brackets in Alton
With 2,012 households falling in the category, the $50,000 to $74,999 income range is the most frequent in Alton, accounting for 18.5% of all households. In contrast, only 315 households (2.9%) fall into the $200,000+ income bracket, making it the least populous group.
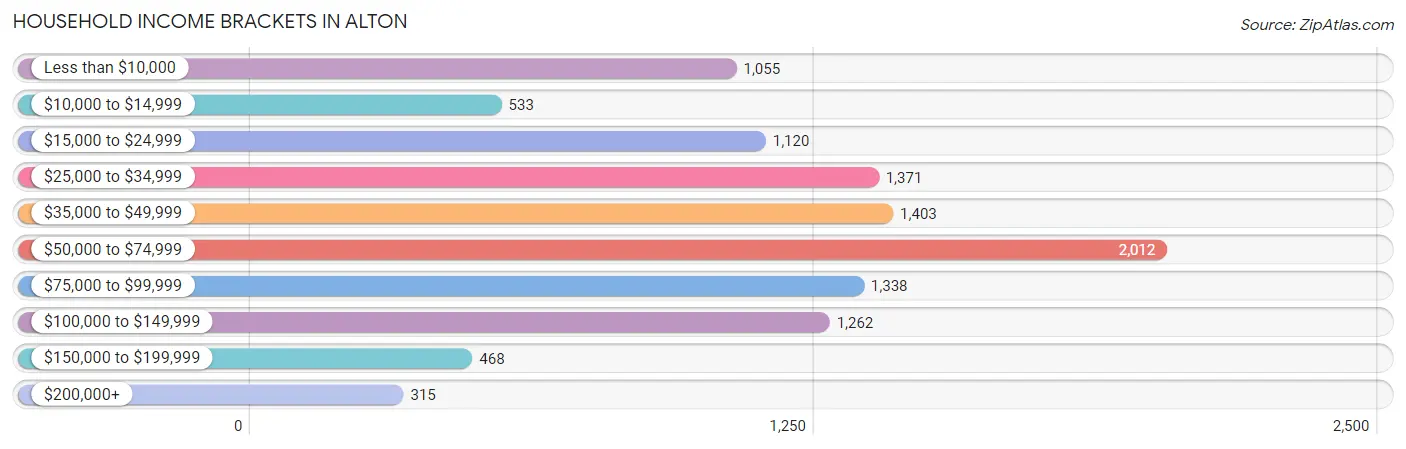
| Income Bracket | # Households | % Households |
| Less than $10,000 | 1,055 | 9.7% |
| $10,000 to $14,999 | 533 | 4.9% |
| $15,000 to $24,999 | 1,120 | 10.3% |
| $25,000 to $34,999 | 1,371 | 12.6% |
| $35,000 to $49,999 | 1,403 | 12.9% |
| $50,000 to $74,999 | 2,012 | 18.5% |
| $75,000 to $99,999 | 1,338 | 12.3% |
| $100,000 to $149,999 | 1,262 | 11.6% |
| $150,000 to $199,999 | 468 | 4.3% |
| $200,000+ | 315 | 2.9% |
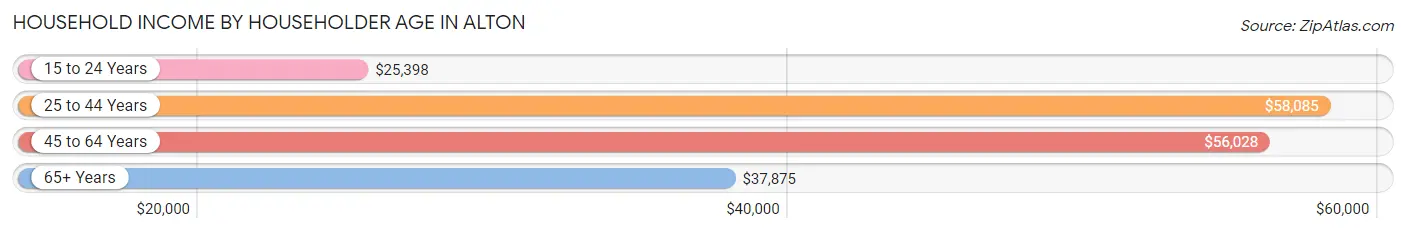
Household Income by Householder Age in Alton
The median household income in Alton is $49,439, with the highest median household income of $58,085 found in the 25 to 44 years age bracket for the primary householder. A total of 3,809 households (35.0%) fall into this category. Meanwhile, the 15 to 24 years age bracket for the primary householder has the lowest median household income of $25,398, with 329 households (3.0%) in this group.
| Income Bracket | # Households | Median Income |
| 15 to 24 Years | 329 (3.0%) | $25,398 |
| 25 to 44 Years | 3,809 (35.0%) | $58,085 |
| 45 to 64 Years | 3,631 (33.4%) | $56,028 |
| 65+ Years | 3,109 (28.6%) | $37,875 |
| Total | 10,878 (100.0%) | $49,439 |
Poverty in Alton
Income Below Poverty by Sex and Age in Alton
With 24.8% poverty level for males and 24.2% for females among the residents of Alton, 18 to 24 year old males and 5 year old females are the most vulnerable to poverty, with 445 males (47.7%) and 85 females (54.1%) in their respective age groups living below the poverty level.
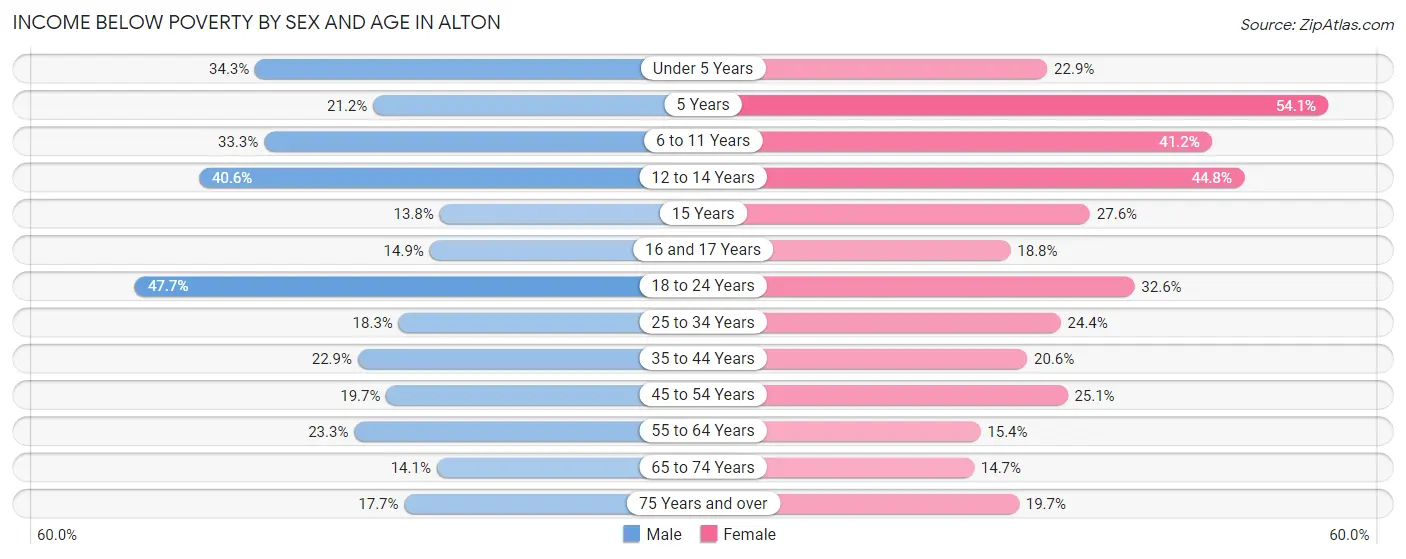
| Age Bracket | Male | Female |
| Under 5 Years | 264 (34.3%) | 129 (22.9%) |
| 5 Years | 57 (21.2%) | 85 (54.1%) |
| 6 to 11 Years | 339 (33.3%) | 480 (41.2%) |
| 12 to 14 Years | 211 (40.6%) | 227 (44.8%) |
| 15 Years | 16 (13.8%) | 21 (27.6%) |
| 16 and 17 Years | 35 (14.9%) | 64 (18.8%) |
| 18 to 24 Years | 445 (47.7%) | 263 (32.6%) |
| 25 to 34 Years | 347 (18.3%) | 452 (24.4%) |
| 35 to 44 Years | 350 (22.9%) | 376 (20.6%) |
| 45 to 54 Years | 285 (19.7%) | 380 (25.1%) |
| 55 to 64 Years | 360 (23.3%) | 262 (15.4%) |
| 65 to 74 Years | 156 (14.1%) | 227 (14.7%) |
| 75 Years and over | 105 (17.7%) | 192 (19.7%) |
| Total | 2,970 (24.8%) | 3,158 (24.2%) |
Income Above Poverty by Sex and Age in Alton
According to the poverty statistics in Alton, males aged 15 years and females aged 65 to 74 years are the age groups that are most secure financially, with 86.2% of males and 85.3% of females in these age groups living above the poverty line.
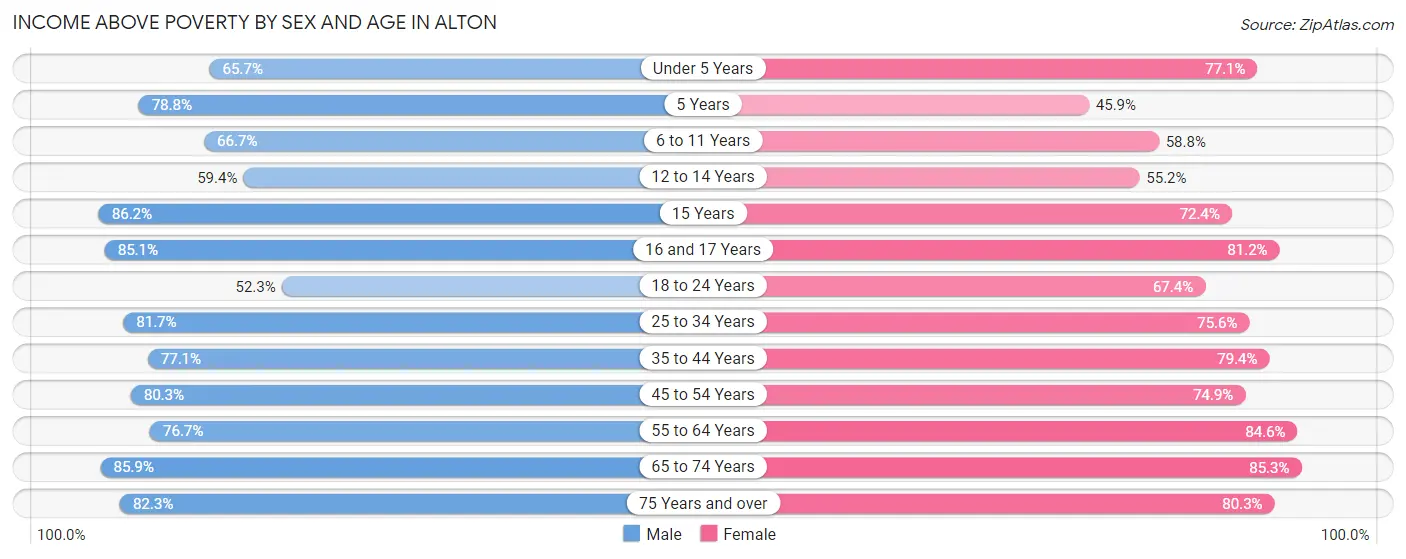
| Age Bracket | Male | Female |
| Under 5 Years | 505 (65.7%) | 435 (77.1%) |
| 5 Years | 212 (78.8%) | 72 (45.9%) |
| 6 to 11 Years | 678 (66.7%) | 686 (58.8%) |
| 12 to 14 Years | 309 (59.4%) | 280 (55.2%) |
| 15 Years | 100 (86.2%) | 55 (72.4%) |
| 16 and 17 Years | 200 (85.1%) | 277 (81.2%) |
| 18 to 24 Years | 488 (52.3%) | 544 (67.4%) |
| 25 to 34 Years | 1,545 (81.7%) | 1,403 (75.6%) |
| 35 to 44 Years | 1,179 (77.1%) | 1,446 (79.4%) |
| 45 to 54 Years | 1,160 (80.3%) | 1,132 (74.9%) |
| 55 to 64 Years | 1,186 (76.7%) | 1,436 (84.6%) |
| 65 to 74 Years | 950 (85.9%) | 1,316 (85.3%) |
| 75 Years and over | 488 (82.3%) | 782 (80.3%) |
| Total | 9,000 (75.2%) | 9,864 (75.7%) |
Income Below Poverty Among Married-Couple Families in Alton
The poverty statistics for married-couple families in Alton show that 8.7% or 273 of the total 3,140 families live below the poverty line. Families with 5 or more children have the highest poverty rate of 77.1%, comprising of 27 families. On the other hand, families with no children have the lowest poverty rate of 5.1%, which includes 94 families.
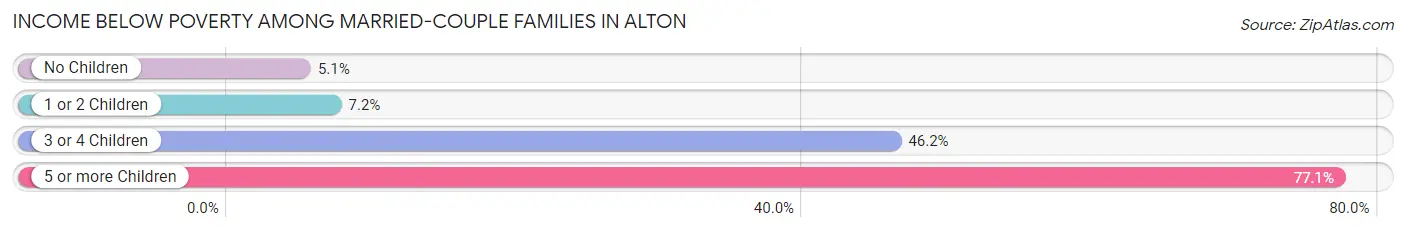
| Children | Above Poverty | Below Poverty |
| No Children | 1,757 (94.9%) | 94 (5.1%) |
| 1 or 2 Children | 1,017 (92.8%) | 79 (7.2%) |
| 3 or 4 Children | 85 (53.8%) | 73 (46.2%) |
| 5 or more Children | 8 (22.9%) | 27 (77.1%) |
| Total | 2,867 (91.3%) | 273 (8.7%) |
Income Below Poverty Among Single-Parent Households in Alton
According to the poverty data in Alton, 17.7% or 77 single-father households and 32.0% or 663 single-mother households are living below the poverty line. Among single-father households, those with no children have the highest poverty rate, with 54 households (31.0%) experiencing poverty. Likewise, among single-mother households, those with 5 or more children have the highest poverty rate, with 82 households (81.2%) falling below the poverty line.
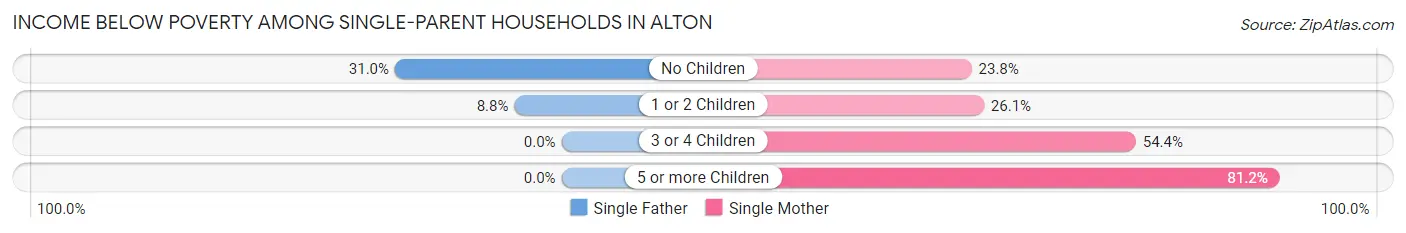
| Children | Single Father | Single Mother |
| No Children | 54 (31.0%) | 153 (23.8%) |
| 1 or 2 Children | 23 (8.8%) | 274 (26.1%) |
| 3 or 4 Children | 0 (0.0%) | 154 (54.4%) |
| 5 or more Children | 0 (0.0%) | 82 (81.2%) |
| Total | 77 (17.7%) | 663 (32.0%) |
Income Below Poverty Among Married-Couple vs Single-Parent Households in Alton
The poverty data for Alton shows that 273 of the married-couple family households (8.7%) and 740 of the single-parent households (29.5%) are living below the poverty level. Within the married-couple family households, those with 5 or more children have the highest poverty rate, with 27 households (77.1%) falling below the poverty line. Among the single-parent households, those with 5 or more children have the highest poverty rate, with 82 household (81.2%) living below poverty.
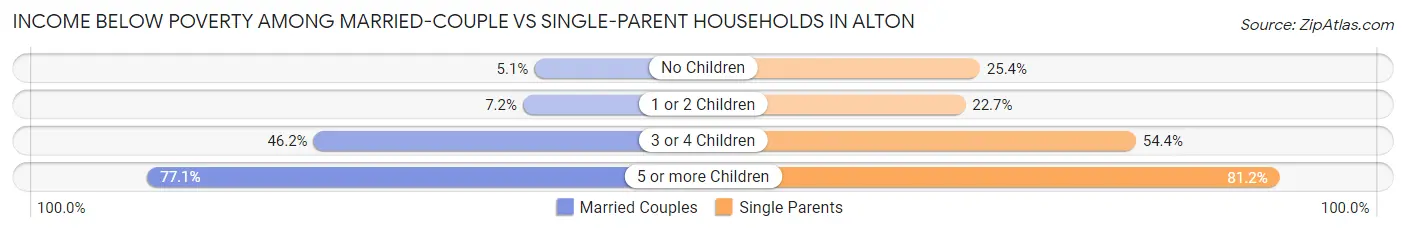
| Children | Married-Couple Families | Single-Parent Households |
| No Children | 94 (5.1%) | 207 (25.4%) |
| 1 or 2 Children | 79 (7.2%) | 297 (22.7%) |
| 3 or 4 Children | 73 (46.2%) | 154 (54.4%) |
| 5 or more Children | 27 (77.1%) | 82 (81.2%) |
| Total | 273 (8.7%) | 740 (29.5%) |
Race in Alton
The most populous races in Alton are White / Caucasian (17,103 | 66.7%), Black / African American (6,343 | 24.7%), and Two or more Races (1,729 | 6.7%).
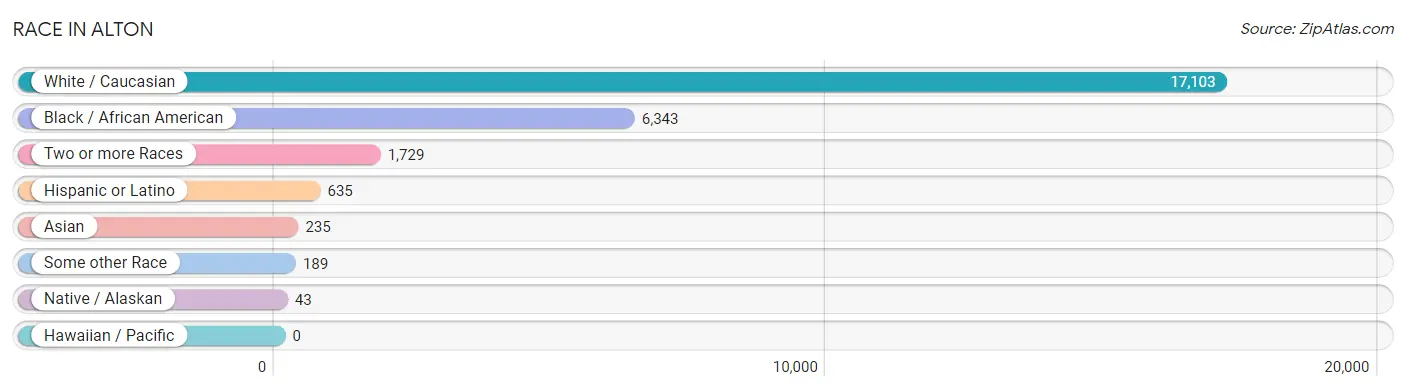
| Race | # Population | % Population |
| Asian | 235 | 0.9% |
| Black / African American | 6,343 | 24.7% |
| Hawaiian / Pacific | 0 | 0.0% |
| Hispanic or Latino | 635 | 2.5% |
| Native / Alaskan | 43 | 0.2% |
| White / Caucasian | 17,103 | 66.7% |
| Two or more Races | 1,729 | 6.7% |
| Some other Race | 189 | 0.7% |
| Total | 25,642 | 100.0% |
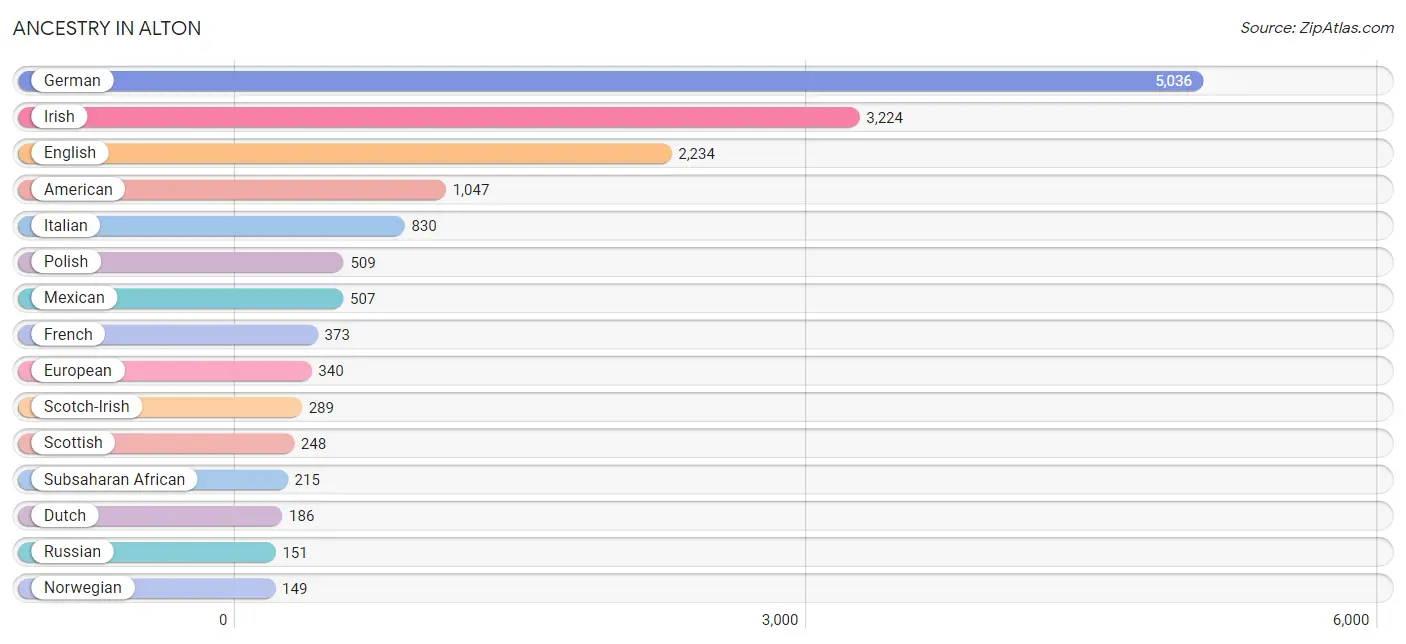
Ancestry in Alton
The most populous ancestries reported in Alton are German (5,036 | 19.6%), Irish (3,224 | 12.6%), English (2,234 | 8.7%), American (1,047 | 4.1%), and Italian (830 | 3.2%), together accounting for 48.2% of all Alton residents.
| Ancestry | # Population | % Population |
| African | 145 | 0.6% |
| Albanian | 117 | 0.5% |
| American | 1,047 | 4.1% |
| Apache | 8 | 0.0% |
| Arab | 47 | 0.2% |
| Australian | 25 | 0.1% |
| Austrian | 29 | 0.1% |
| Belizean | 7 | 0.0% |
| Bhutanese | 41 | 0.2% |
| Blackfeet | 3 | 0.0% |
| British | 51 | 0.2% |
| Burmese | 2 | 0.0% |
| Canadian | 7 | 0.0% |
| Cape Verdean | 8 | 0.0% |
| Celtic | 9 | 0.0% |
| Cherokee | 48 | 0.2% |
| Chilean | 14 | 0.1% |
| Choctaw | 1 | 0.0% |
| Croatian | 92 | 0.4% |
| Czech | 48 | 0.2% |
| Czechoslovakian | 6 | 0.0% |
| Danish | 10 | 0.0% |
| Dutch | 186 | 0.7% |
| Dutch West Indian | 57 | 0.2% |
| Eastern European | 105 | 0.4% |
| Ecuadorian | 3 | 0.0% |
| Egyptian | 8 | 0.0% |
| English | 2,234 | 8.7% |
| Ethiopian | 27 | 0.1% |
| European | 340 | 1.3% |
| Finnish | 3 | 0.0% |
| French | 373 | 1.5% |
| French American Indian | 4 | 0.0% |
| French Canadian | 54 | 0.2% |
| German | 5,036 | 19.6% |
| Greek | 53 | 0.2% |
| Hungarian | 44 | 0.2% |
| Indian (Asian) | 7 | 0.0% |
| Irish | 3,224 | 12.6% |
| Iroquois | 1 | 0.0% |
| Italian | 830 | 3.2% |
| Jamaican | 56 | 0.2% |
| Korean | 102 | 0.4% |
| Latvian | 11 | 0.0% |
| Lebanese | 8 | 0.0% |
| Lithuanian | 8 | 0.0% |
| Macedonian | 34 | 0.1% |
| Mexican | 507 | 2.0% |
| Native Hawaiian | 23 | 0.1% |
| Nigerian | 30 | 0.1% |
| Northern European | 75 | 0.3% |
| Norwegian | 149 | 0.6% |
| Pakistani | 2 | 0.0% |
| Polish | 509 | 2.0% |
| Portuguese | 1 | 0.0% |
| Puerto Rican | 12 | 0.1% |
| Romanian | 81 | 0.3% |
| Russian | 151 | 0.6% |
| Scandinavian | 83 | 0.3% |
| Scotch-Irish | 289 | 1.1% |
| Scottish | 248 | 1.0% |
| Slavic | 29 | 0.1% |
| Slovak | 32 | 0.1% |
| Slovene | 10 | 0.0% |
| South American | 17 | 0.1% |
| Spaniard | 55 | 0.2% |
| Spanish | 20 | 0.1% |
| Sri Lankan | 42 | 0.2% |
| Subsaharan African | 215 | 0.8% |
| Swedish | 108 | 0.4% |
| Swiss | 47 | 0.2% |
| Syrian | 31 | 0.1% |
| Thai | 128 | 0.5% |
| Turkish | 7 | 0.0% |
| Ukrainian | 38 | 0.2% |
| Welsh | 147 | 0.6% |
| Yugoslavian | 18 | 0.1% | View All 77 Rows |
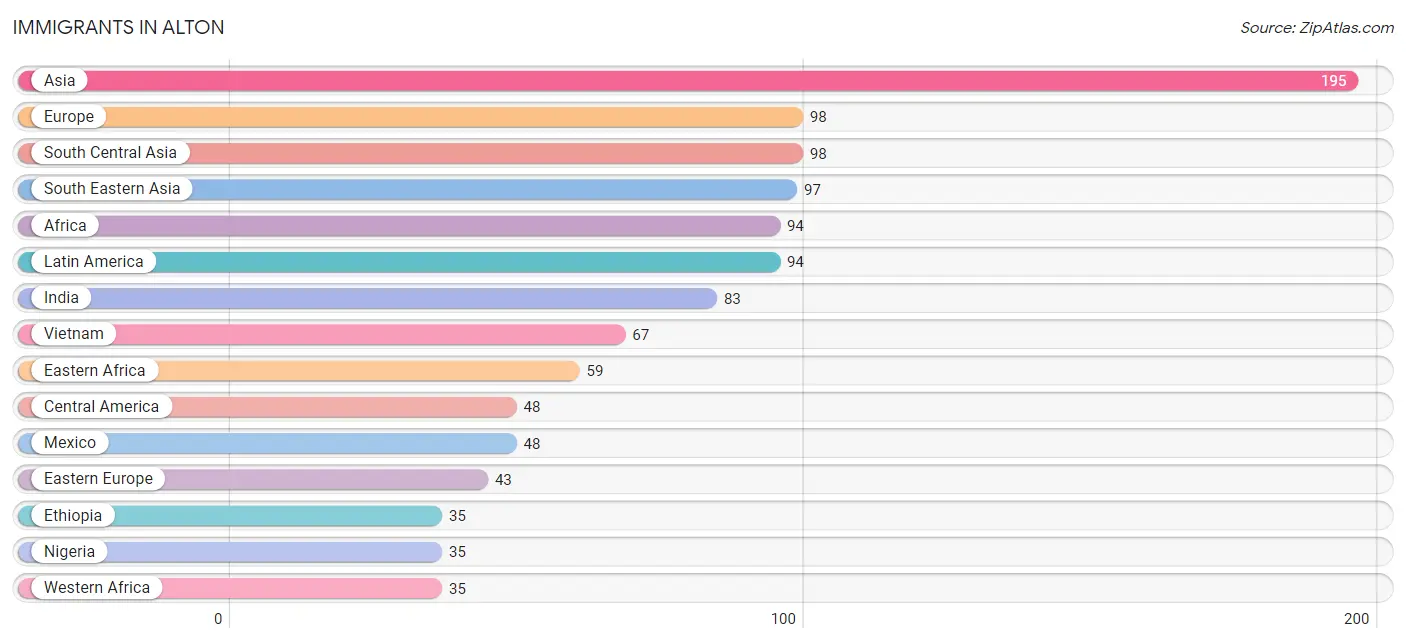
Immigrants in Alton
The most numerous immigrant groups reported in Alton came from Asia (195 | 0.8%), Europe (98 | 0.4%), South Central Asia (98 | 0.4%), South Eastern Asia (97 | 0.4%), and Africa (94 | 0.4%), together accounting for 2.3% of all Alton residents.
| Immigration Origin | # Population | % Population |
| Africa | 94 | 0.4% |
| Argentina | 12 | 0.1% |
| Asia | 195 | 0.8% |
| Bahamas | 13 | 0.1% |
| Bosnia and Herzegovina | 9 | 0.0% |
| Canada | 20 | 0.1% |
| Caribbean | 13 | 0.1% |
| Central America | 48 | 0.2% |
| Eastern Africa | 59 | 0.2% |
| Eastern Europe | 43 | 0.2% |
| Ecuador | 3 | 0.0% |
| Ethiopia | 35 | 0.1% |
| Europe | 98 | 0.4% |
| Germany | 29 | 0.1% |
| India | 83 | 0.3% |
| Ireland | 23 | 0.1% |
| Kazakhstan | 8 | 0.0% |
| Latin America | 94 | 0.4% |
| Mexico | 48 | 0.2% |
| Nigeria | 35 | 0.1% |
| North Macedonia | 34 | 0.1% |
| Northern Europe | 26 | 0.1% |
| Pakistan | 7 | 0.0% |
| Peru | 18 | 0.1% |
| Philippines | 28 | 0.1% |
| South America | 33 | 0.1% |
| South Central Asia | 98 | 0.4% |
| South Eastern Asia | 97 | 0.4% |
| Thailand | 2 | 0.0% |
| Vietnam | 67 | 0.3% |
| Western Africa | 35 | 0.1% |
| Western Europe | 29 | 0.1% |
| Zimbabwe | 24 | 0.1% | View All 33 Rows |
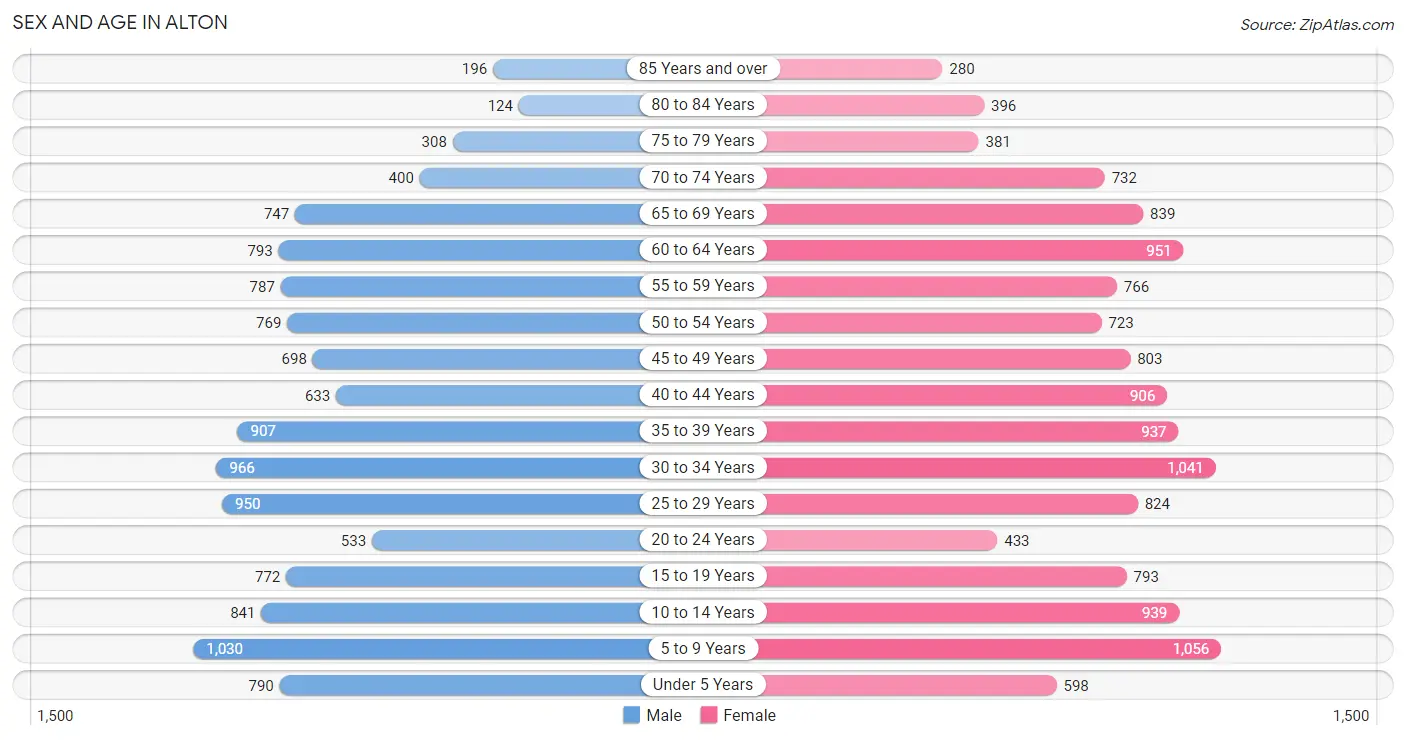
Sex and Age in Alton
Sex and Age in Alton
The most populous age groups in Alton are 5 to 9 Years (1,030 | 8.4%) for men and 5 to 9 Years (1,056 | 7.9%) for women.
| Age Bracket | Male | Female |
| Under 5 Years | 790 (6.5%) | 598 (4.5%) |
| 5 to 9 Years | 1,030 (8.4%) | 1,056 (7.9%) |
| 10 to 14 Years | 841 (6.9%) | 939 (7.0%) |
| 15 to 19 Years | 772 (6.3%) | 793 (5.9%) |
| 20 to 24 Years | 533 (4.3%) | 433 (3.2%) |
| 25 to 29 Years | 950 (7.8%) | 824 (6.1%) |
| 30 to 34 Years | 966 (7.9%) | 1,041 (7.8%) |
| 35 to 39 Years | 907 (7.4%) | 937 (7.0%) |
| 40 to 44 Years | 633 (5.2%) | 906 (6.8%) |
| 45 to 49 Years | 698 (5.7%) | 803 (6.0%) |
| 50 to 54 Years | 769 (6.3%) | 723 (5.4%) |
| 55 to 59 Years | 787 (6.4%) | 766 (5.7%) |
| 60 to 64 Years | 793 (6.5%) | 951 (7.1%) |
| 65 to 69 Years | 747 (6.1%) | 839 (6.3%) |
| 70 to 74 Years | 400 (3.3%) | 732 (5.5%) |
| 75 to 79 Years | 308 (2.5%) | 381 (2.8%) |
| 80 to 84 Years | 124 (1.0%) | 396 (3.0%) |
| 85 Years and over | 196 (1.6%) | 280 (2.1%) |
| Total | 12,244 (100.0%) | 13,398 (100.0%) |
Families and Households in Alton
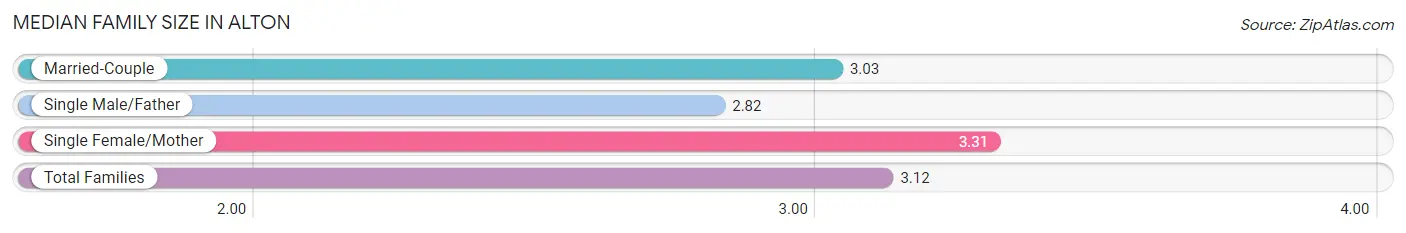
Median Family Size in Alton
The median family size in Alton is 3.12 persons per family, with single female/mother families (2,075 | 36.7%) accounting for the largest median family size of 3.31 persons per family. On the other hand, single male/father families (436 | 7.7%) represent the smallest median family size with 2.82 persons per family.
| Family Type | # Families | Family Size |
| Married-Couple | 3,140 (55.6%) | 3.03 |
| Single Male/Father | 436 (7.7%) | 2.82 |
| Single Female/Mother | 2,075 (36.7%) | 3.31 |
| Total Families | 5,651 (100.0%) | 3.12 |
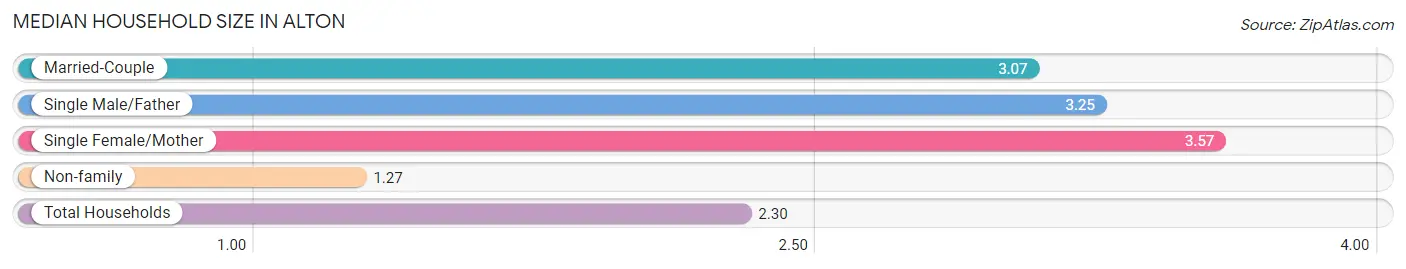
Median Household Size in Alton
The median household size in Alton is 2.30 persons per household, with single female/mother households (2,075 | 19.1%) accounting for the largest median household size of 3.57 persons per household. non-family households (5,227 | 48.0%) represent the smallest median household size with 1.27 persons per household.
| Household Type | # Households | Household Size |
| Married-Couple | 3,140 (28.9%) | 3.07 |
| Single Male/Father | 436 (4.0%) | 3.25 |
| Single Female/Mother | 2,075 (19.1%) | 3.57 |
| Non-family | 5,227 (48.0%) | 1.27 |
| Total Households | 10,878 (100.0%) | 2.30 |
Household Size by Marriage Status in Alton
Out of a total of 10,878 households in Alton, 5,651 (51.9%) are family households, while 5,227 (48.0%) are nonfamily households. The most numerous type of family households are 2-person households, comprising 2,127, and the most common type of nonfamily households are 1-person households, comprising 4,231.
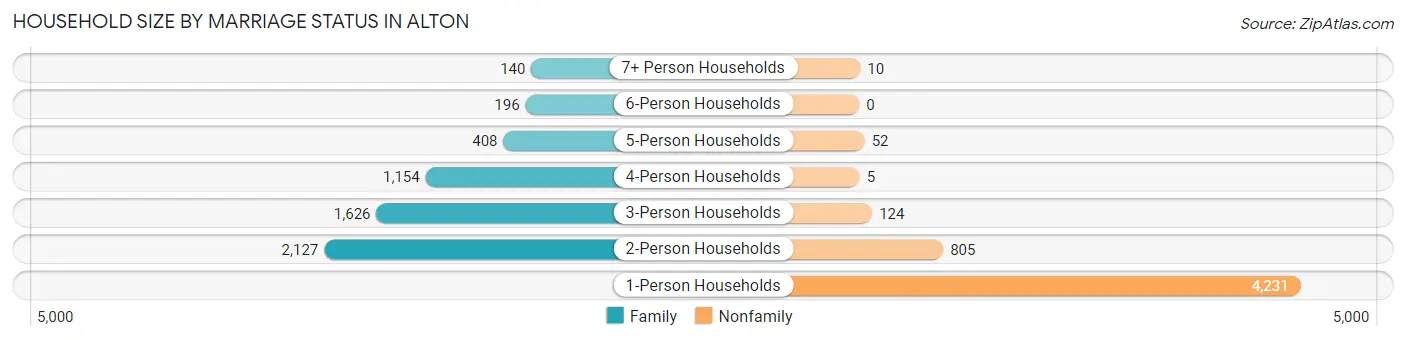
| Household Size | Family Households | Nonfamily Households |
| 1-Person Households | - | 4,231 (38.9%) |
| 2-Person Households | 2,127 (19.6%) | 805 (7.4%) |
| 3-Person Households | 1,626 (14.9%) | 124 (1.1%) |
| 4-Person Households | 1,154 (10.6%) | 5 (0.1%) |
| 5-Person Households | 408 (3.7%) | 52 (0.5%) |
| 6-Person Households | 196 (1.8%) | 0 (0.0%) |
| 7+ Person Households | 140 (1.3%) | 10 (0.1%) |
| Total | 5,651 (51.9%) | 5,227 (48.0%) |
Female Fertility in Alton
Fertility by Age in Alton
Average fertility rate in Alton is 41.0 births per 1,000 women. Women in the age bracket of 20 to 34 years have the highest fertility rate with 70.0 births per 1,000 women. Women in the age bracket of 20 to 34 years acount for 66.9% of all women with births.
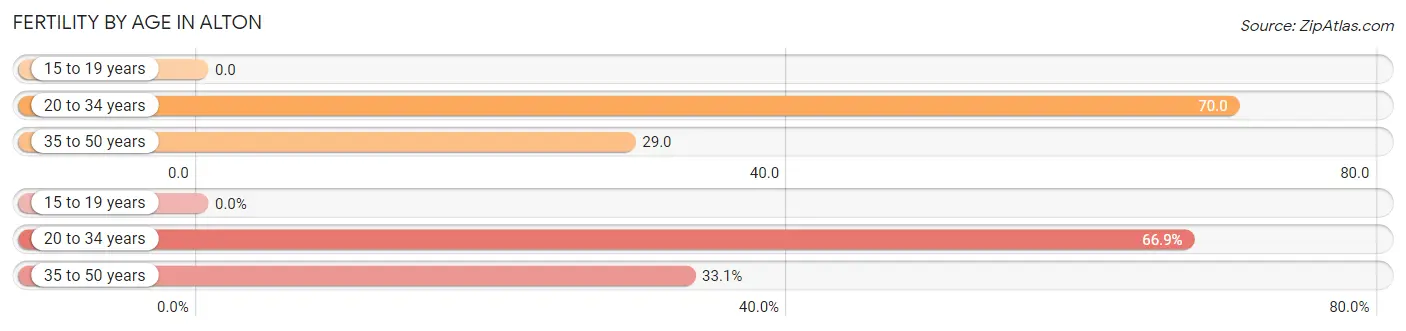
| Age Bracket | Women with Births | Births / 1,000 Women |
| 15 to 19 years | 0 (0.0%) | 0.0 |
| 20 to 34 years | 162 (66.9%) | 70.0 |
| 35 to 50 years | 80 (33.1%) | 29.0 |
| Total | 242 (100.0%) | 41.0 |
Fertility by Age by Marriage Status in Alton
36.8% of women with births (242) in Alton are married. The highest percentage of unmarried women with births falls into 20 to 34 years age bracket with 69.8% of them unmarried at the time of birth, while the lowest percentage of unmarried women with births belong to 35 to 50 years age bracket with 50.0% of them unmarried.
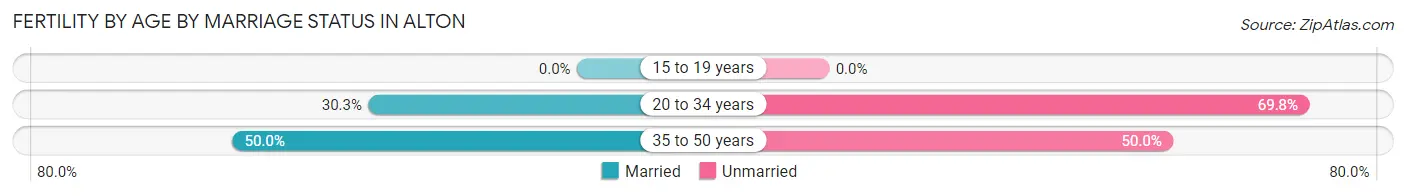
| Age Bracket | Married | Unmarried |
| 15 to 19 years | 0 (0.0%) | 0 (0.0%) |
| 20 to 34 years | 49 (30.2%) | 113 (69.8%) |
| 35 to 50 years | 40 (50.0%) | 40 (50.0%) |
| Total | 89 (36.8%) | 153 (63.2%) |
Fertility by Education in Alton
Average fertility rate in Alton is 41.0 births per 1,000 women. Women with the education attainment of graduate degree have the highest fertility rate of 90.0 births per 1,000 women, while women with the education attainment of college or associate's degree have the lowest fertility at 20.0 births per 1,000 women. Women with the education attainment of high school diploma represent 40.9% of all women with births.
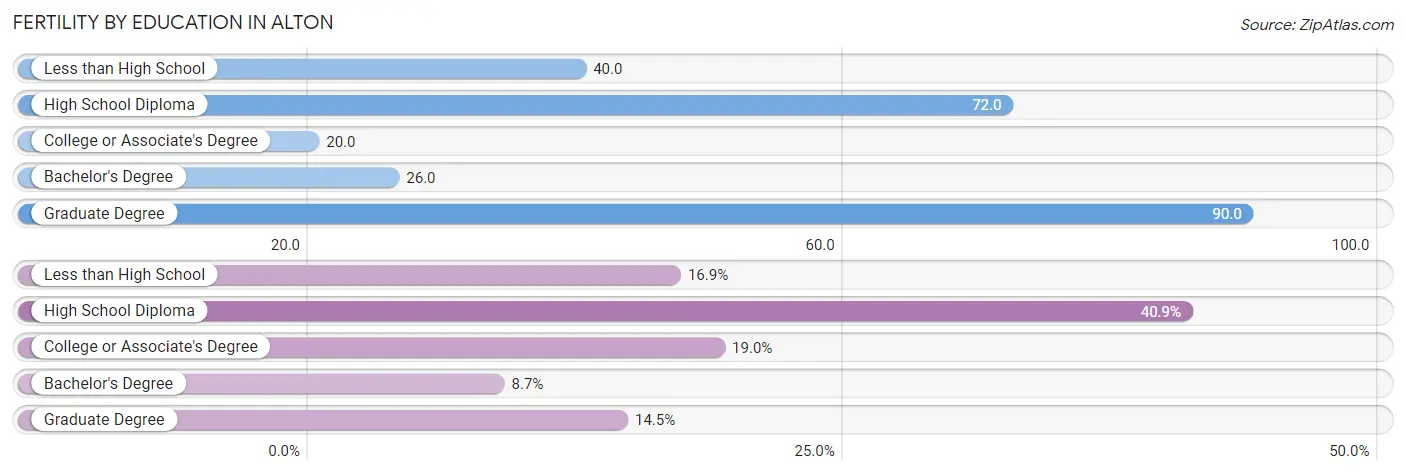
| Educational Attainment | Women with Births | Births / 1,000 Women |
| Less than High School | 41 (16.9%) | 40.0 |
| High School Diploma | 99 (40.9%) | 72.0 |
| College or Associate's Degree | 46 (19.0%) | 20.0 |
| Bachelor's Degree | 21 (8.7%) | 26.0 |
| Graduate Degree | 35 (14.5%) | 90.0 |
| Total | 242 (100.0%) | 41.0 |
Fertility by Education by Marriage Status in Alton
63.2% of women with births in Alton are unmarried. Women with the educational attainment of bachelor's degree are most likely to be married with 100.0% of them married at childbirth, while women with the educational attainment of less than high school are least likely to be married with 100.0% of them unmarried at childbirth.
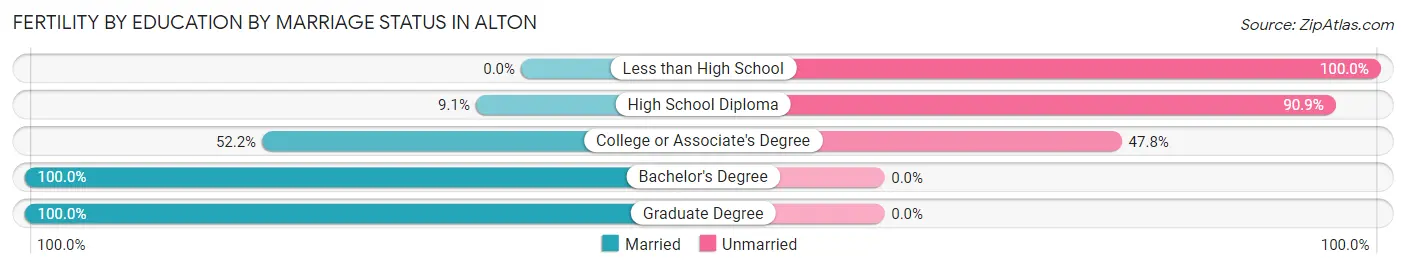
| Educational Attainment | Married | Unmarried |
| Less than High School | 0 (0.0%) | 41 (100.0%) |
| High School Diploma | 9 (9.1%) | 90 (90.9%) |
| College or Associate's Degree | 24 (52.2%) | 22 (47.8%) |
| Bachelor's Degree | 21 (100.0%) | 0 (0.0%) |
| Graduate Degree | 35 (100.0%) | 0 (0.0%) |
| Total | 89 (36.8%) | 153 (63.2%) |
Employment Characteristics in Alton
Employment by Class of Employer in Alton
Among the 11,072 employed individuals in Alton, private company employees (7,827 | 70.7%), not-for-profit organizations (1,226 | 11.1%), and self-employed (not incorporated) (570 | 5.1%) make up the most common classes of employment.
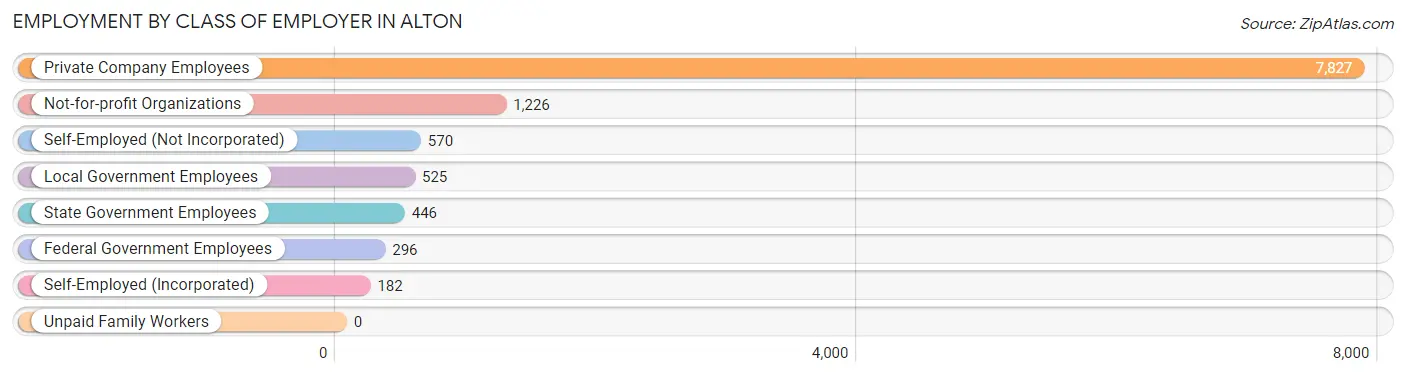
| Employer Class | # Employees | % Employees |
| Private Company Employees | 7,827 | 70.7% |
| Self-Employed (Incorporated) | 182 | 1.6% |
| Self-Employed (Not Incorporated) | 570 | 5.1% |
| Not-for-profit Organizations | 1,226 | 11.1% |
| Local Government Employees | 525 | 4.7% |
| State Government Employees | 446 | 4.0% |
| Federal Government Employees | 296 | 2.7% |
| Unpaid Family Workers | 0 | 0.0% |
| Total | 11,072 | 100.0% |
Employment Status by Age in Alton
According to the labor force statistics for Alton, out of the total population over 16 years of age (20,191), 60.1% or 12,135 individuals are in the labor force, with 6.6% or 801 of them unemployed. The age group with the highest labor force participation rate is 25 to 29 years, with 85.6% or 1,519 individuals in the labor force. Within the labor force, the 75 years and over age range has the highest percentage of unemployed individuals, with 15.5% or 13 of them being unemployed.
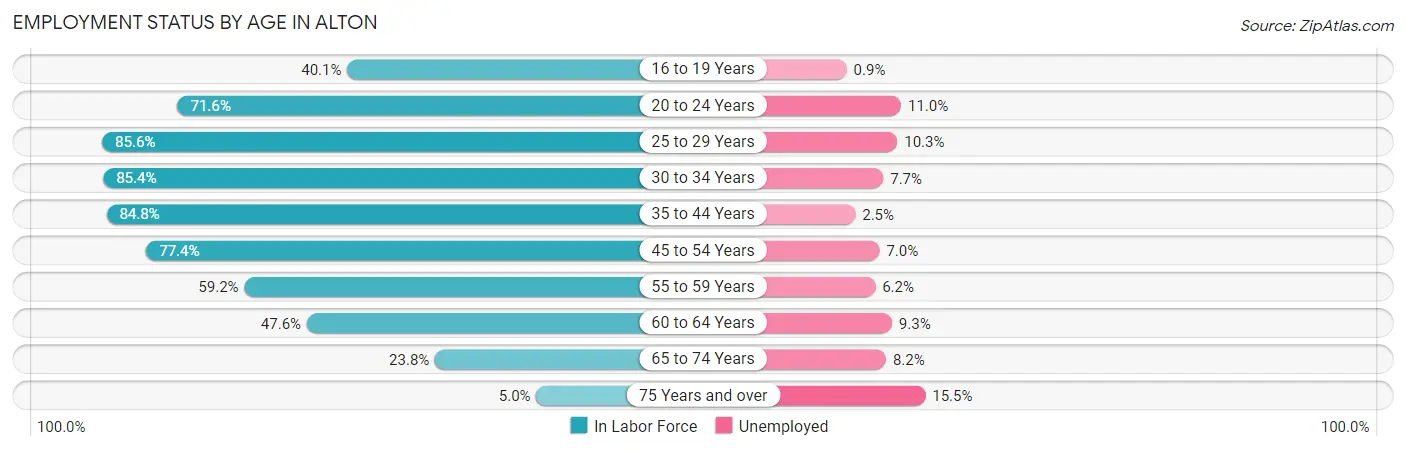
| Age Bracket | In Labor Force | Unemployed |
| 16 to 19 Years | 549 (40.1%) | 5 (0.9%) |
| 20 to 24 Years | 692 (71.6%) | 76 (11.0%) |
| 25 to 29 Years | 1,519 (85.6%) | 156 (10.3%) |
| 30 to 34 Years | 1,714 (85.4%) | 132 (7.7%) |
| 35 to 44 Years | 2,869 (84.8%) | 72 (2.5%) |
| 45 to 54 Years | 2,317 (77.4%) | 162 (7.0%) |
| 55 to 59 Years | 919 (59.2%) | 57 (6.2%) |
| 60 to 64 Years | 830 (47.6%) | 77 (9.3%) |
| 65 to 74 Years | 647 (23.8%) | 53 (8.2%) |
| 75 Years and over | 84 (5.0%) | 13 (15.5%) |
| Total | 12,135 (60.1%) | 801 (6.6%) |
Employment Status by Educational Attainment in Alton
According to labor force statistics for Alton, 75.6% of individuals (10,171) out of the total population between 25 and 64 years of age (13,454) are in the labor force, with 6.5% or 661 of them being unemployed. The group with the highest labor force participation rate are those with the educational attainment of bachelor's degree or higher, with 86.3% or 2,478 individuals in the labor force. Within the labor force, individuals with less than high school education have the highest percentage of unemployment, with 25.5% or 185 of them being unemployed.
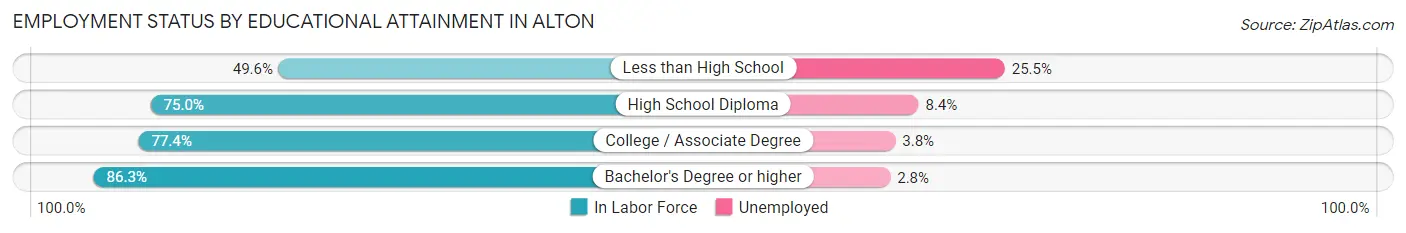
| Educational Attainment | In Labor Force | Unemployed |
| Less than High School | 726 (49.6%) | 373 (25.5%) |
| High School Diploma | 2,950 (75.0%) | 330 (8.4%) |
| College / Associate Degree | 4,013 (77.4%) | 197 (3.8%) |
| Bachelor's Degree or higher | 2,478 (86.3%) | 80 (2.8%) |
| Total | 10,171 (75.6%) | 875 (6.5%) |
Employment Occupations by Sex in Alton
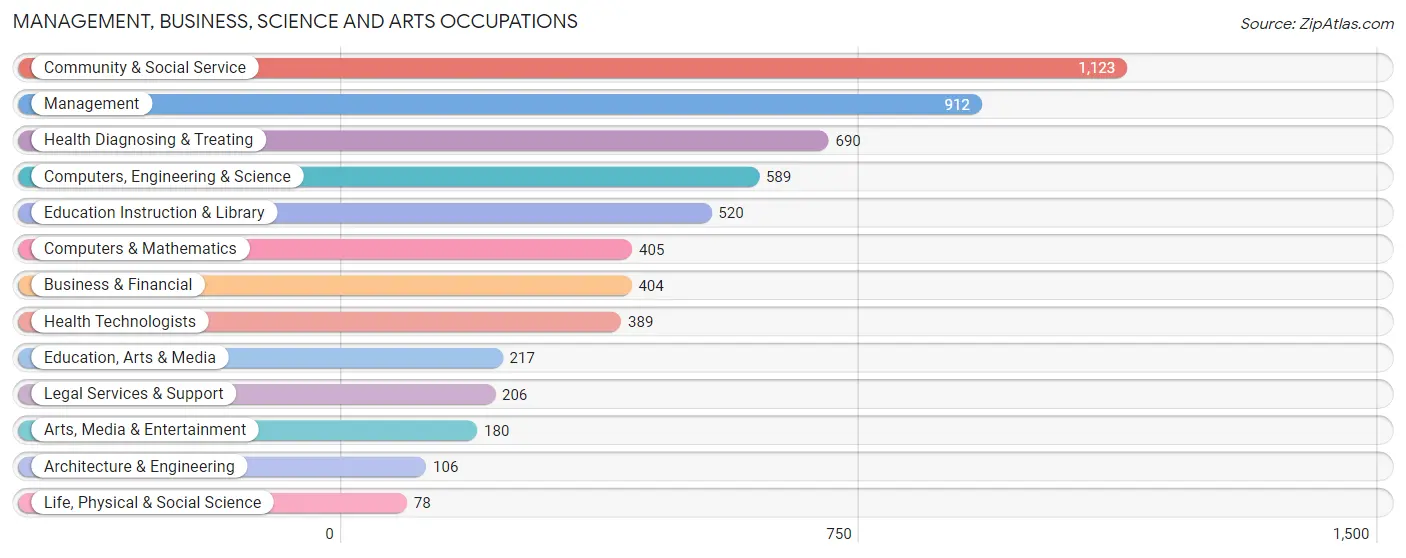
Management, Business, Science and Arts Occupations
The most common Management, Business, Science and Arts occupations in Alton are Community & Social Service (1,123 | 9.9%), Management (912 | 8.1%), Health Diagnosing & Treating (690 | 6.1%), Computers, Engineering & Science (589 | 5.2%), and Education Instruction & Library (520 | 4.6%).
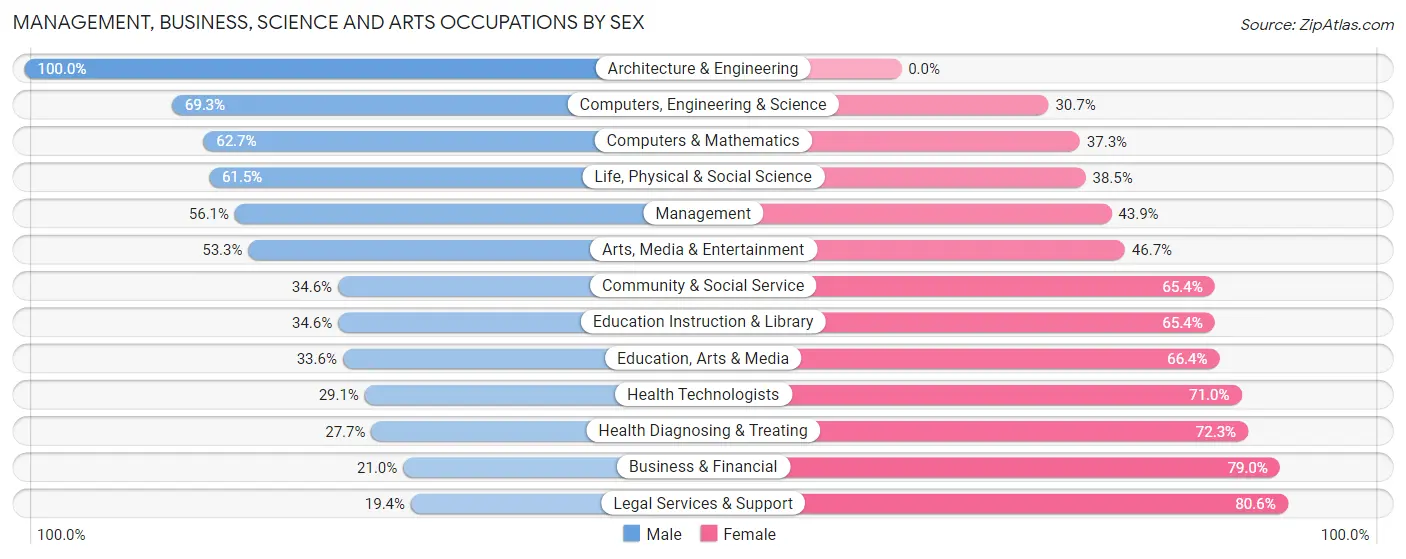
Management, Business, Science and Arts Occupations by Sex
Within the Management, Business, Science and Arts occupations in Alton, the most male-oriented occupations are Architecture & Engineering (100.0%), Computers, Engineering & Science (69.3%), and Computers & Mathematics (62.7%), while the most female-oriented occupations are Legal Services & Support (80.6%), Business & Financial (79.0%), and Health Diagnosing & Treating (72.3%).
| Occupation | Male | Female |
| Management | 512 (56.1%) | 400 (43.9%) |
| Business & Financial | 85 (21.0%) | 319 (79.0%) |
| Computers, Engineering & Science | 408 (69.3%) | 181 (30.7%) |
| Computers & Mathematics | 254 (62.7%) | 151 (37.3%) |
| Architecture & Engineering | 106 (100.0%) | 0 (0.0%) |
| Life, Physical & Social Science | 48 (61.5%) | 30 (38.5%) |
| Community & Social Service | 389 (34.6%) | 734 (65.4%) |
| Education, Arts & Media | 73 (33.6%) | 144 (66.4%) |
| Legal Services & Support | 40 (19.4%) | 166 (80.6%) |
| Education Instruction & Library | 180 (34.6%) | 340 (65.4%) |
| Arts, Media & Entertainment | 96 (53.3%) | 84 (46.7%) |
| Health Diagnosing & Treating | 191 (27.7%) | 499 (72.3%) |
| Health Technologists | 113 (29.0%) | 276 (71.0%) |
| Total (Category) | 1,585 (42.6%) | 2,133 (57.4%) |
| Total (Overall) | 5,464 (48.2%) | 5,863 (51.8%) |
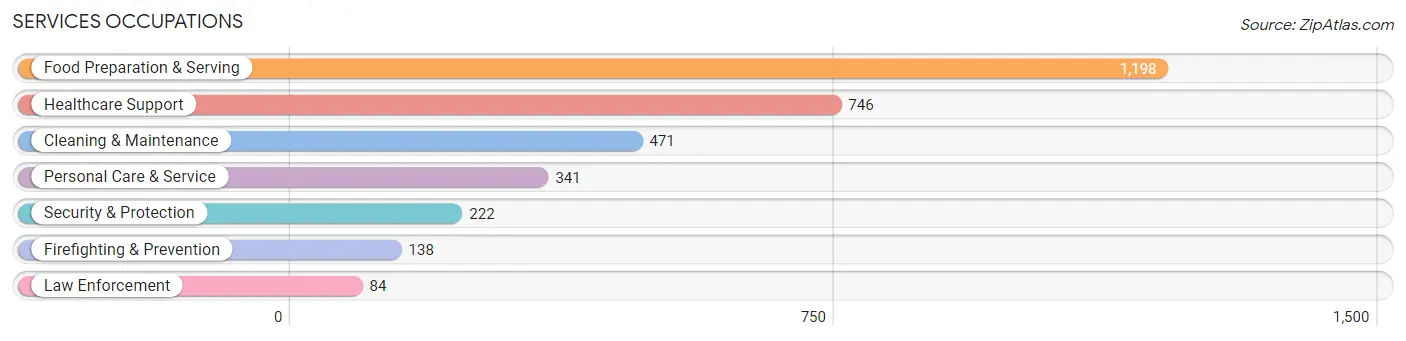
Services Occupations
The most common Services occupations in Alton are Food Preparation & Serving (1,198 | 10.6%), Healthcare Support (746 | 6.6%), Cleaning & Maintenance (471 | 4.2%), Personal Care & Service (341 | 3.0%), and Security & Protection (222 | 2.0%).
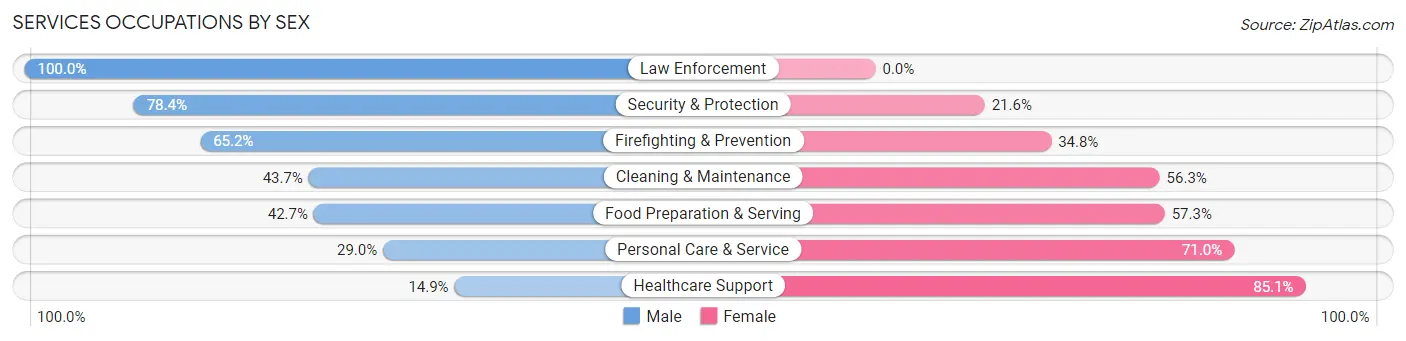
Services Occupations by Sex
Within the Services occupations in Alton, the most male-oriented occupations are Law Enforcement (100.0%), Security & Protection (78.4%), and Firefighting & Prevention (65.2%), while the most female-oriented occupations are Healthcare Support (85.1%), Personal Care & Service (71.0%), and Food Preparation & Serving (57.3%).
| Occupation | Male | Female |
| Healthcare Support | 111 (14.9%) | 635 (85.1%) |
| Security & Protection | 174 (78.4%) | 48 (21.6%) |
| Firefighting & Prevention | 90 (65.2%) | 48 (34.8%) |
| Law Enforcement | 84 (100.0%) | 0 (0.0%) |
| Food Preparation & Serving | 512 (42.7%) | 686 (57.3%) |
| Cleaning & Maintenance | 206 (43.7%) | 265 (56.3%) |
| Personal Care & Service | 99 (29.0%) | 242 (71.0%) |
| Total (Category) | 1,102 (37.0%) | 1,876 (63.0%) |
| Total (Overall) | 5,464 (48.2%) | 5,863 (51.8%) |
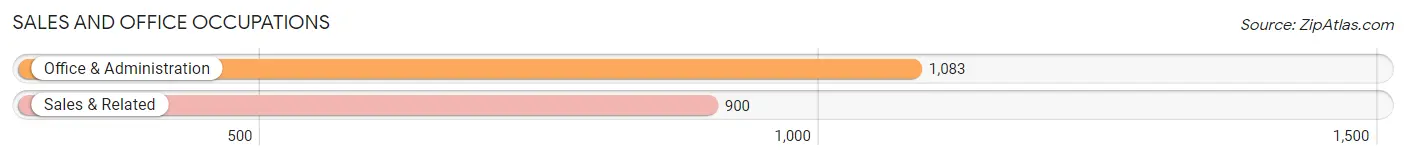
Sales and Office Occupations
The most common Sales and Office occupations in Alton are Office & Administration (1,083 | 9.6%), and Sales & Related (900 | 8.0%).
Sales and Office Occupations by Sex
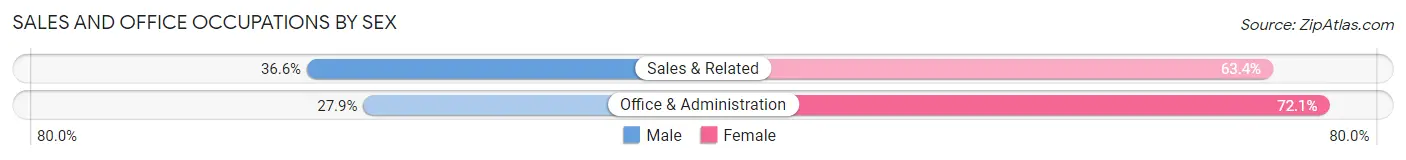
| Occupation | Male | Female |
| Sales & Related | 329 (36.6%) | 571 (63.4%) |
| Office & Administration | 302 (27.9%) | 781 (72.1%) |
| Total (Category) | 631 (31.8%) | 1,352 (68.2%) |
| Total (Overall) | 5,464 (48.2%) | 5,863 (51.8%) |
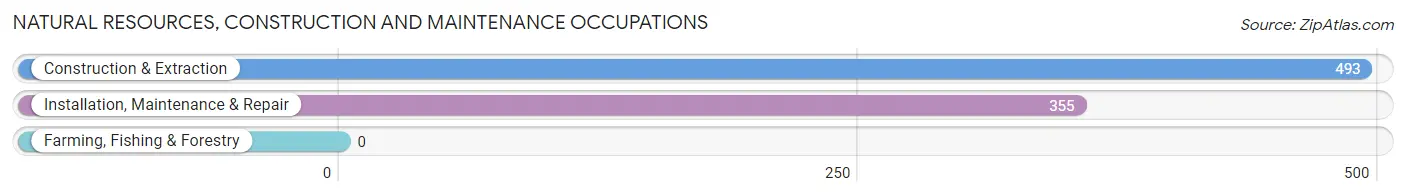
Natural Resources, Construction and Maintenance Occupations
The most common Natural Resources, Construction and Maintenance occupations in Alton are Construction & Extraction (493 | 4.3%), and Installation, Maintenance & Repair (355 | 3.1%).
Natural Resources, Construction and Maintenance Occupations by Sex
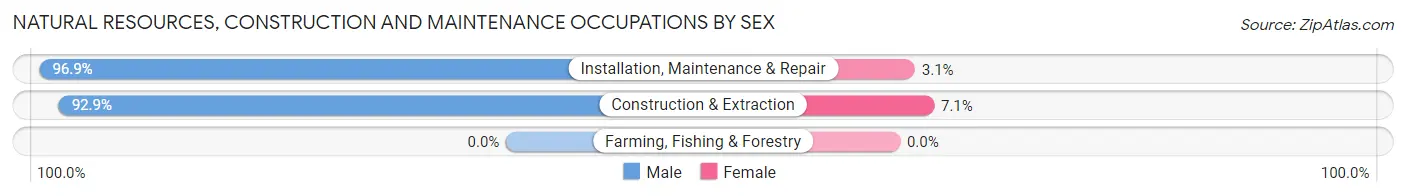
| Occupation | Male | Female |
| Farming, Fishing & Forestry | 0 (0.0%) | 0 (0.0%) |
| Construction & Extraction | 458 (92.9%) | 35 (7.1%) |
| Installation, Maintenance & Repair | 344 (96.9%) | 11 (3.1%) |
| Total (Category) | 802 (94.6%) | 46 (5.4%) |
| Total (Overall) | 5,464 (48.2%) | 5,863 (51.8%) |
Production, Transportation and Moving Occupations
The most common Production, Transportation and Moving occupations in Alton are Production (683 | 6.0%), Material Moving (595 | 5.2%), and Transportation (522 | 4.6%).
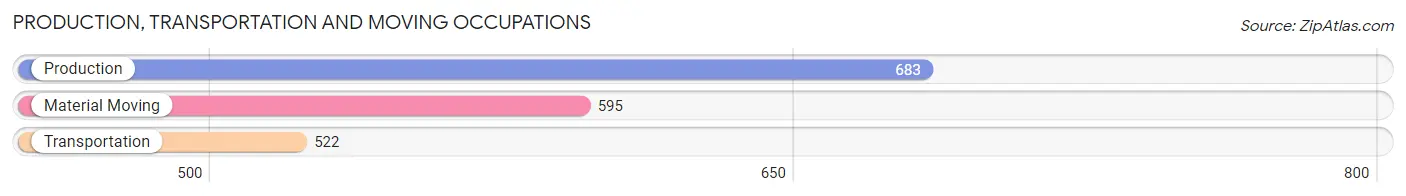
Production, Transportation and Moving Occupations by Sex
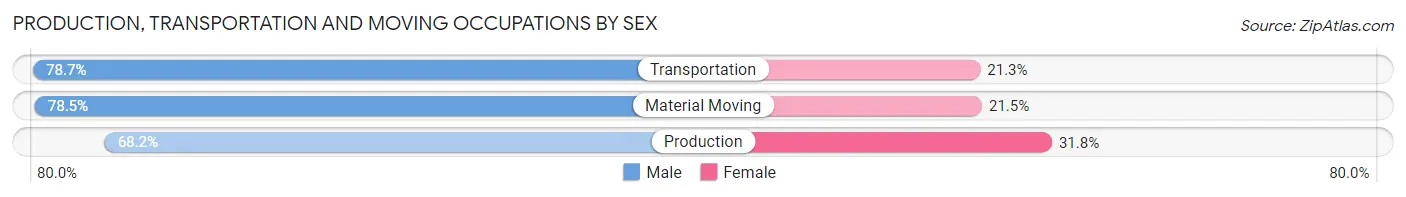
| Occupation | Male | Female |
| Production | 466 (68.2%) | 217 (31.8%) |
| Transportation | 411 (78.7%) | 111 (21.3%) |
| Material Moving | 467 (78.5%) | 128 (21.5%) |
| Total (Category) | 1,344 (74.7%) | 456 (25.3%) |
| Total (Overall) | 5,464 (48.2%) | 5,863 (51.8%) |
Employment Industries by Sex in Alton
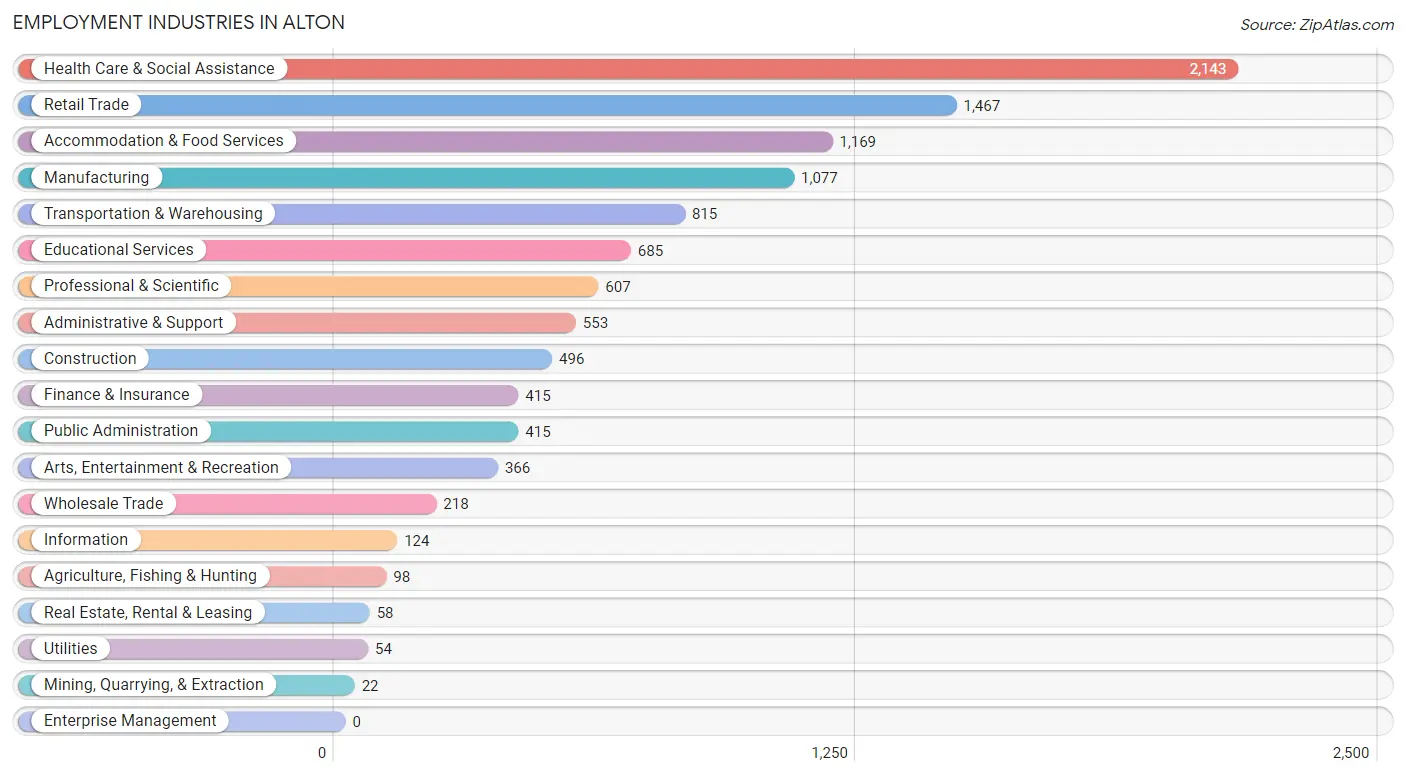
Employment Industries in Alton
The major employment industries in Alton include Health Care & Social Assistance (2,143 | 18.9%), Retail Trade (1,467 | 13.0%), Accommodation & Food Services (1,169 | 10.3%), Manufacturing (1,077 | 9.5%), and Transportation & Warehousing (815 | 7.2%).
Employment Industries by Sex in Alton
The Alton industries that see more men than women are Mining, Quarrying, & Extraction (100.0%), Real Estate, Rental & Leasing (86.2%), and Wholesale Trade (79.4%), whereas the industries that tend to have a higher number of women are Health Care & Social Assistance (78.1%), Educational Services (68.9%), and Finance & Insurance (63.1%).
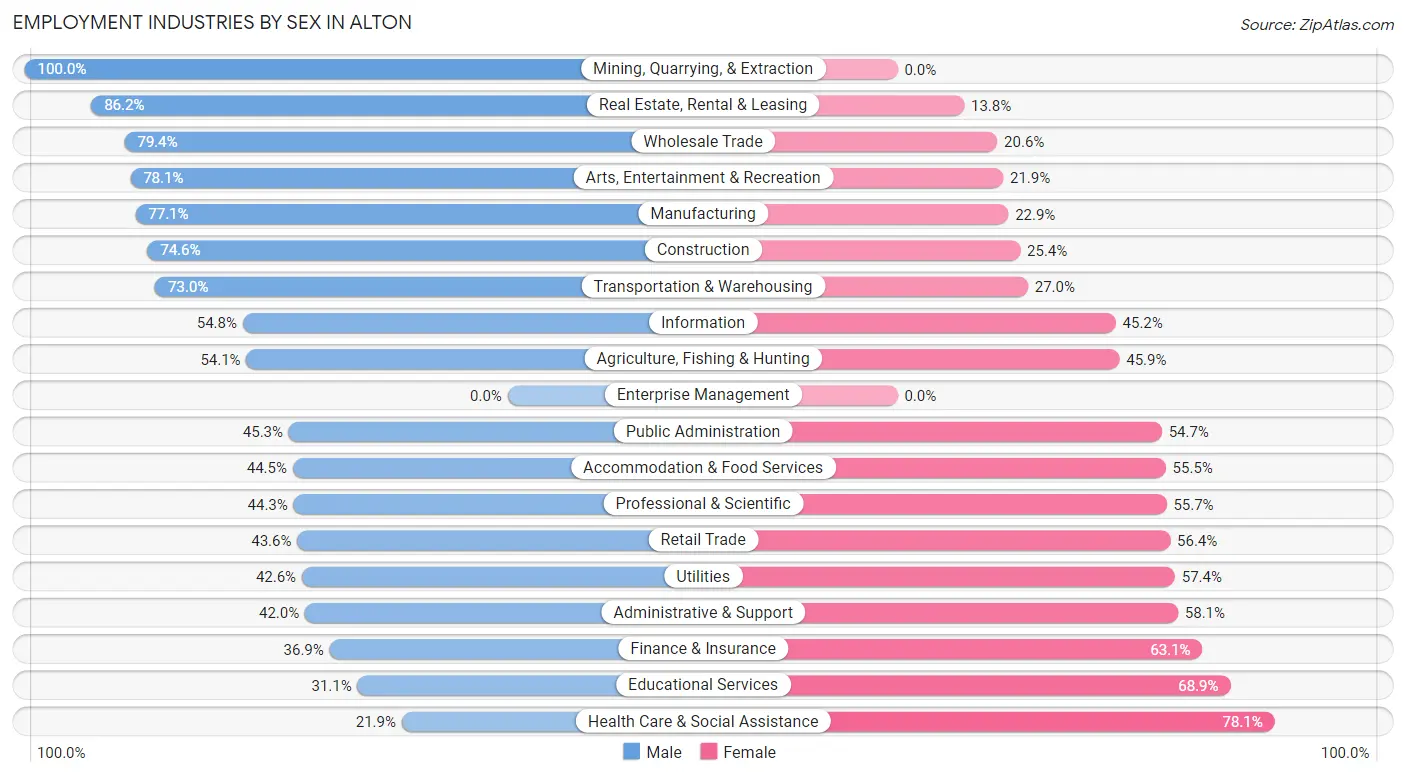
| Industry | Male | Female |
| Agriculture, Fishing & Hunting | 53 (54.1%) | 45 (45.9%) |
| Mining, Quarrying, & Extraction | 22 (100.0%) | 0 (0.0%) |
| Construction | 370 (74.6%) | 126 (25.4%) |
| Manufacturing | 830 (77.1%) | 247 (22.9%) |
| Wholesale Trade | 173 (79.4%) | 45 (20.6%) |
| Retail Trade | 639 (43.6%) | 828 (56.4%) |
| Transportation & Warehousing | 595 (73.0%) | 220 (27.0%) |
| Utilities | 23 (42.6%) | 31 (57.4%) |
| Information | 68 (54.8%) | 56 (45.2%) |
| Finance & Insurance | 153 (36.9%) | 262 (63.1%) |
| Real Estate, Rental & Leasing | 50 (86.2%) | 8 (13.8%) |
| Professional & Scientific | 269 (44.3%) | 338 (55.7%) |
| Enterprise Management | 0 (0.0%) | 0 (0.0%) |
| Administrative & Support | 232 (41.9%) | 321 (58.1%) |
| Educational Services | 213 (31.1%) | 472 (68.9%) |
| Health Care & Social Assistance | 470 (21.9%) | 1,673 (78.1%) |
| Arts, Entertainment & Recreation | 286 (78.1%) | 80 (21.9%) |
| Accommodation & Food Services | 520 (44.5%) | 649 (55.5%) |
| Public Administration | 188 (45.3%) | 227 (54.7%) |
| Total | 5,464 (48.2%) | 5,863 (51.8%) |
Education in Alton
School Enrollment in Alton
The most common levels of schooling among the 6,054 students in Alton are middle school (1,497 | 24.7%), elementary school (1,489 | 24.6%), and high school (1,161 | 19.2%).
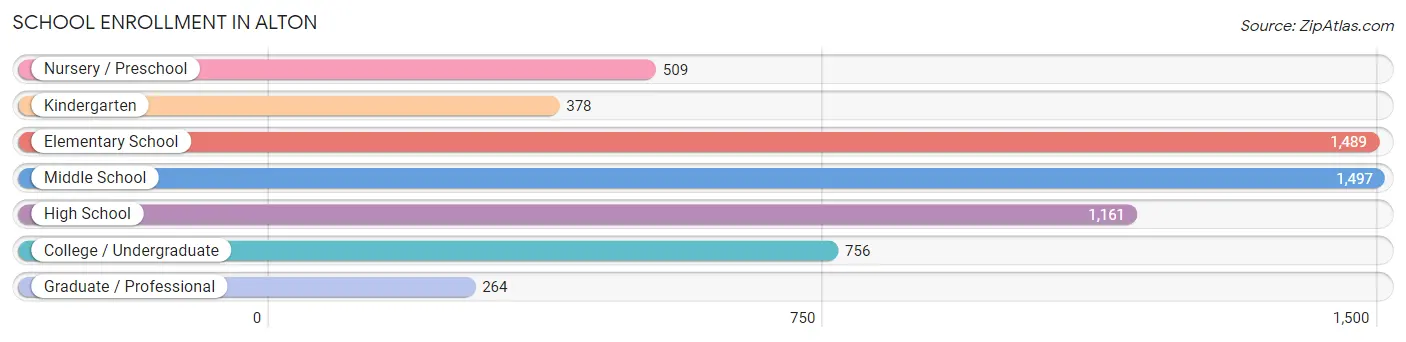
| School Level | # Students | % Students |
| Nursery / Preschool | 509 | 8.4% |
| Kindergarten | 378 | 6.2% |
| Elementary School | 1,489 | 24.6% |
| Middle School | 1,497 | 24.7% |
| High School | 1,161 | 19.2% |
| College / Undergraduate | 756 | 12.5% |
| Graduate / Professional | 264 | 4.4% |
| Total | 6,054 | 100.0% |
School Enrollment by Age by Funding Source in Alton
Out of a total of 6,054 students who are enrolled in schools in Alton, 957 (15.8%) attend a private institution, while the remaining 5,097 (84.2%) are enrolled in public schools. The age group of 3 to 4 year olds has the highest likelihood of being enrolled in private schools, with 133 (33.8% in the age bracket) enrolled. Conversely, the age group of 20 to 24 year olds has the lowest likelihood of being enrolled in a private school, with 280 (91.2% in the age bracket) attending a public institution.
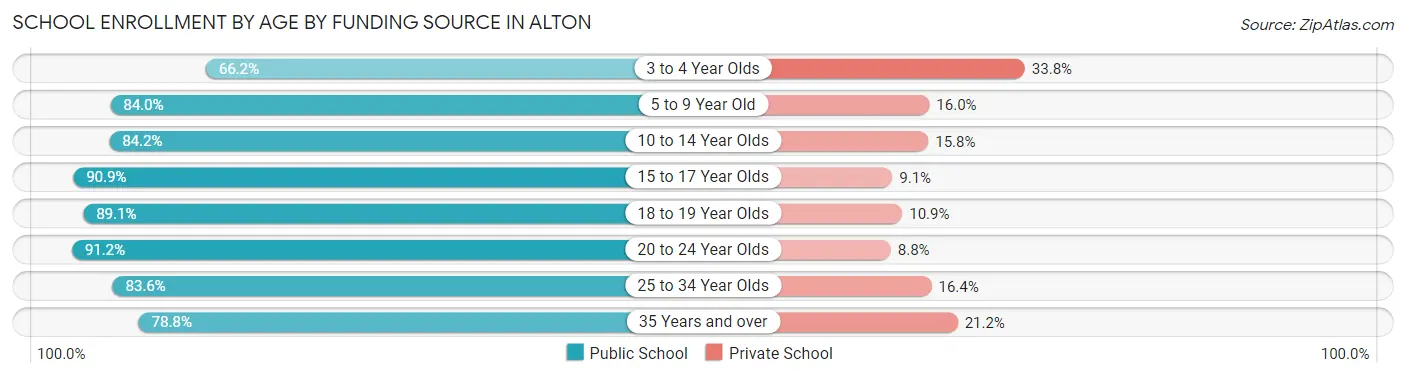
| Age Bracket | Public School | Private School |
| 3 to 4 Year Olds | 261 (66.2%) | 133 (33.8%) |
| 5 to 9 Year Old | 1,537 (84.0%) | 292 (16.0%) |
| 10 to 14 Year Olds | 1,475 (84.2%) | 276 (15.8%) |
| 15 to 17 Year Olds | 632 (90.9%) | 63 (9.1%) |
| 18 to 19 Year Olds | 408 (89.1%) | 50 (10.9%) |
| 20 to 24 Year Olds | 280 (91.2%) | 27 (8.8%) |
| 25 to 34 Year Olds | 235 (83.6%) | 46 (16.4%) |
| 35 Years and over | 267 (78.8%) | 72 (21.2%) |
| Total | 5,097 (84.2%) | 957 (15.8%) |
Educational Attainment by Field of Study in Alton
Business (709 | 18.3%), education (558 | 14.4%), visual & performing arts (395 | 10.2%), science & technology (331 | 8.5%), and liberal arts & history (326 | 8.4%) are the most common fields of study among 3,882 individuals in Alton who have obtained a bachelor's degree or higher.
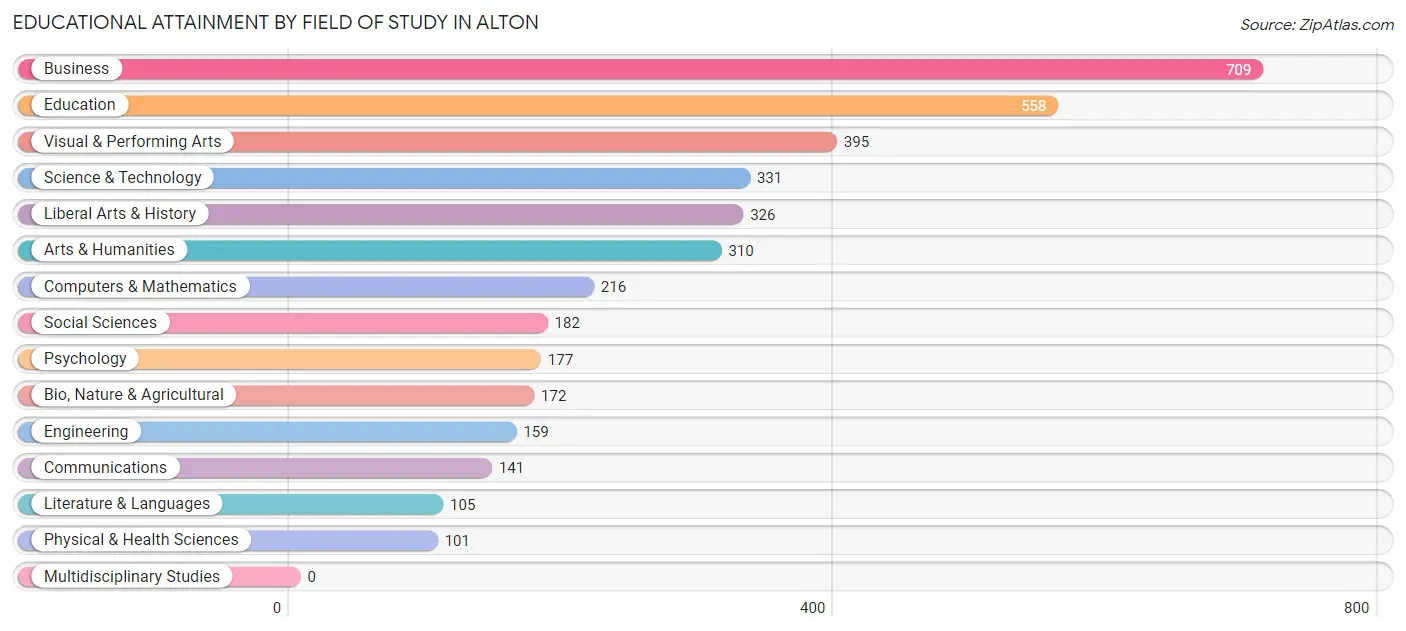
| Field of Study | # Graduates | % Graduates |
| Computers & Mathematics | 216 | 5.6% |
| Bio, Nature & Agricultural | 172 | 4.4% |
| Physical & Health Sciences | 101 | 2.6% |
| Psychology | 177 | 4.6% |
| Social Sciences | 182 | 4.7% |
| Engineering | 159 | 4.1% |
| Multidisciplinary Studies | 0 | 0.0% |
| Science & Technology | 331 | 8.5% |
| Business | 709 | 18.3% |
| Education | 558 | 14.4% |
| Literature & Languages | 105 | 2.7% |
| Liberal Arts & History | 326 | 8.4% |
| Visual & Performing Arts | 395 | 10.2% |
| Communications | 141 | 3.6% |
| Arts & Humanities | 310 | 8.0% |
| Total | 3,882 | 100.0% |
Transportation & Commute in Alton
Vehicle Availability by Sex in Alton
The most prevalent vehicle ownership categories in Alton are males with 2 vehicles (2,374, accounting for 44.2%) and females with 2 vehicles (2,275, making up 41.9%).
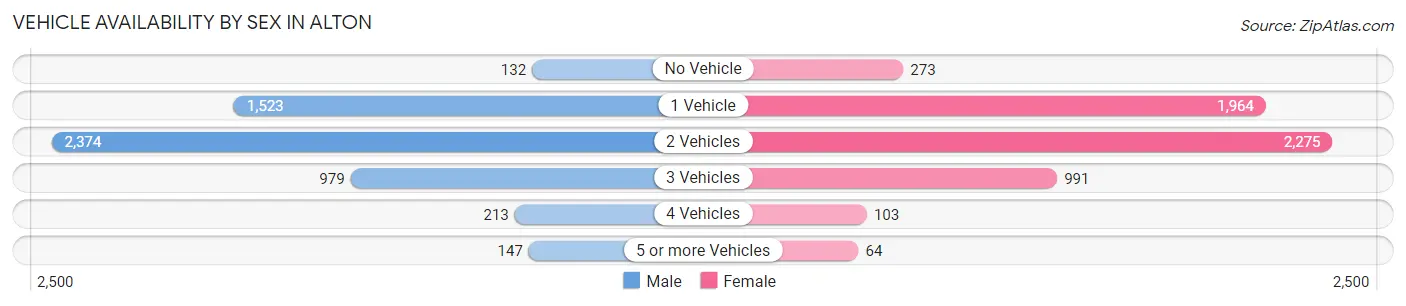
| Vehicles Available | Male | Female |
| No Vehicle | 132 (2.5%) | 273 (4.8%) |
| 1 Vehicle | 1,523 (28.4%) | 1,964 (34.6%) |
| 2 Vehicles | 2,374 (44.2%) | 2,275 (40.1%) |
| 3 Vehicles | 979 (18.2%) | 991 (17.5%) |
| 4 Vehicles | 213 (4.0%) | 103 (1.8%) |
| 5 or more Vehicles | 147 (2.7%) | 64 (1.1%) |
| Total | 5,368 (100.0%) | 5,670 (100.0%) |
Commute Time in Alton
The most frequently occuring commute durations in Alton are 10 to 14 minutes (1,859 commuters, 18.3%), 5 to 9 minutes (1,772 commuters, 17.4%), and 15 to 19 minutes (1,491 commuters, 14.7%).
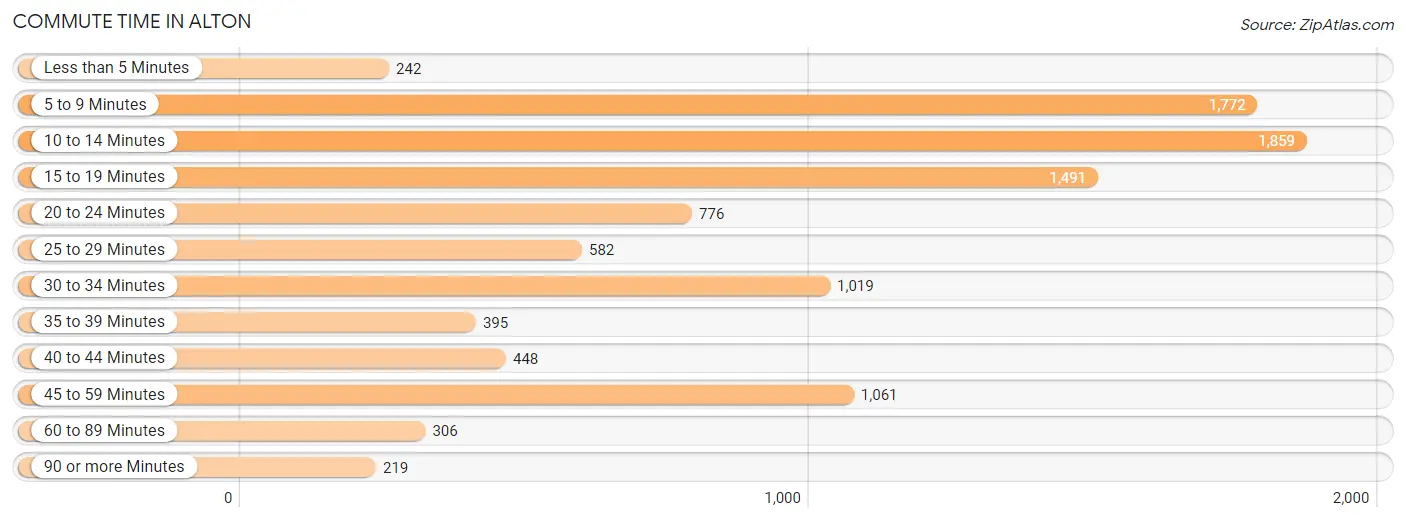
| Commute Time | # Commuters | % Commuters |
| Less than 5 Minutes | 242 | 2.4% |
| 5 to 9 Minutes | 1,772 | 17.4% |
| 10 to 14 Minutes | 1,859 | 18.3% |
| 15 to 19 Minutes | 1,491 | 14.7% |
| 20 to 24 Minutes | 776 | 7.6% |
| 25 to 29 Minutes | 582 | 5.7% |
| 30 to 34 Minutes | 1,019 | 10.0% |
| 35 to 39 Minutes | 395 | 3.9% |
| 40 to 44 Minutes | 448 | 4.4% |
| 45 to 59 Minutes | 1,061 | 10.4% |
| 60 to 89 Minutes | 306 | 3.0% |
| 90 or more Minutes | 219 | 2.1% |
Commute Time by Sex in Alton
The most common commute times in Alton are 10 to 14 minutes (894 commuters, 17.8%) for males and 5 to 9 minutes (1,066 commuters, 20.7%) for females.
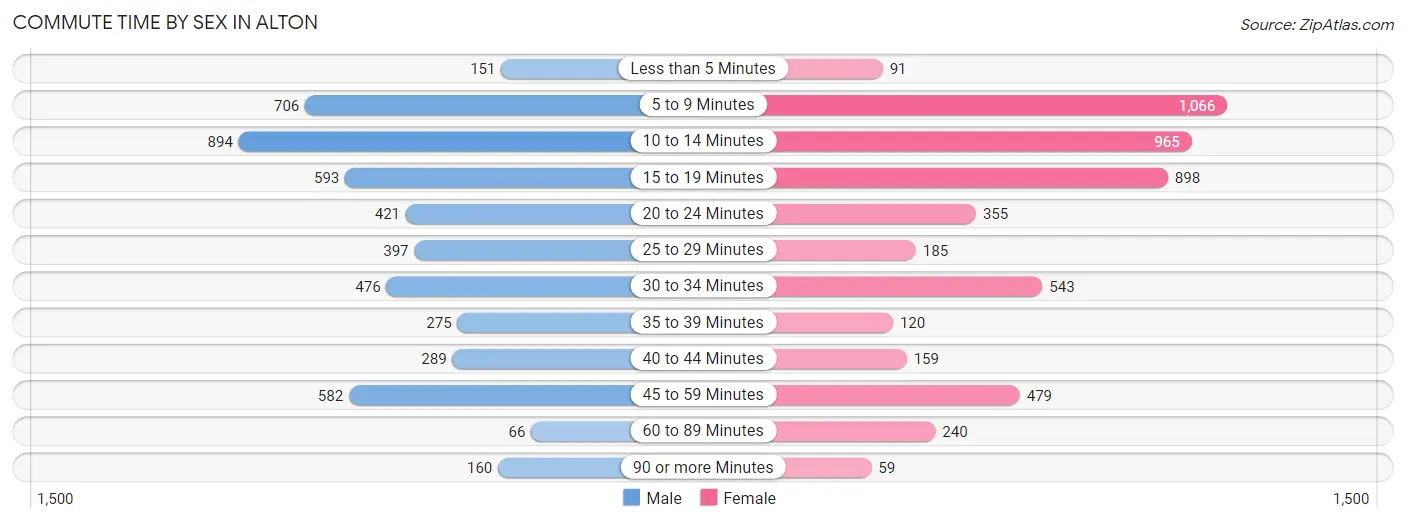
| Commute Time | Male | Female |
| Less than 5 Minutes | 151 (3.0%) | 91 (1.8%) |
| 5 to 9 Minutes | 706 (14.1%) | 1,066 (20.7%) |
| 10 to 14 Minutes | 894 (17.8%) | 965 (18.7%) |
| 15 to 19 Minutes | 593 (11.8%) | 898 (17.4%) |
| 20 to 24 Minutes | 421 (8.4%) | 355 (6.9%) |
| 25 to 29 Minutes | 397 (7.9%) | 185 (3.6%) |
| 30 to 34 Minutes | 476 (9.5%) | 543 (10.5%) |
| 35 to 39 Minutes | 275 (5.5%) | 120 (2.3%) |
| 40 to 44 Minutes | 289 (5.8%) | 159 (3.1%) |
| 45 to 59 Minutes | 582 (11.6%) | 479 (9.3%) |
| 60 to 89 Minutes | 66 (1.3%) | 240 (4.6%) |
| 90 or more Minutes | 160 (3.2%) | 59 (1.1%) |
Time of Departure to Work by Sex in Alton
The most frequent times of departure to work in Alton are 6:30 AM to 6:59 AM (728, 14.5%) for males and 7:00 AM to 7:29 AM (891, 17.3%) for females.
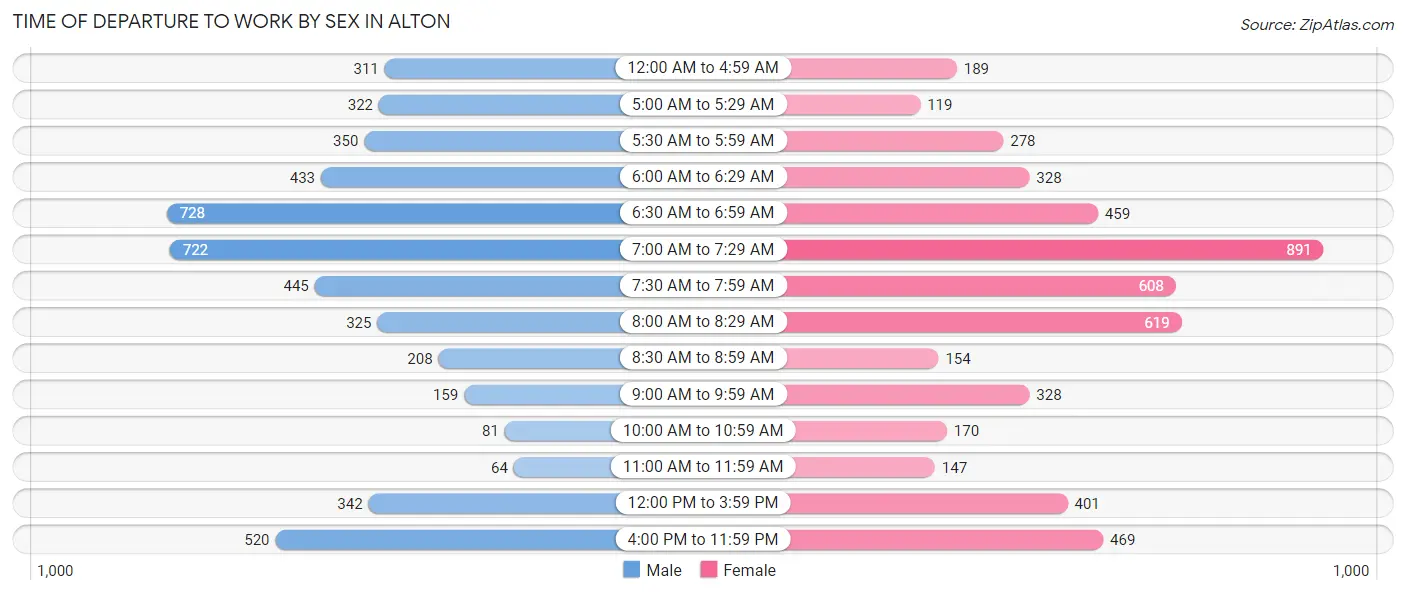
| Time of Departure | Male | Female |
| 12:00 AM to 4:59 AM | 311 (6.2%) | 189 (3.7%) |
| 5:00 AM to 5:29 AM | 322 (6.4%) | 119 (2.3%) |
| 5:30 AM to 5:59 AM | 350 (7.0%) | 278 (5.4%) |
| 6:00 AM to 6:29 AM | 433 (8.6%) | 328 (6.4%) |
| 6:30 AM to 6:59 AM | 728 (14.5%) | 459 (8.9%) |
| 7:00 AM to 7:29 AM | 722 (14.4%) | 891 (17.3%) |
| 7:30 AM to 7:59 AM | 445 (8.9%) | 608 (11.8%) |
| 8:00 AM to 8:29 AM | 325 (6.5%) | 619 (12.0%) |
| 8:30 AM to 8:59 AM | 208 (4.2%) | 154 (3.0%) |
| 9:00 AM to 9:59 AM | 159 (3.2%) | 328 (6.4%) |
| 10:00 AM to 10:59 AM | 81 (1.6%) | 170 (3.3%) |
| 11:00 AM to 11:59 AM | 64 (1.3%) | 147 (2.9%) |
| 12:00 PM to 3:59 PM | 342 (6.8%) | 401 (7.8%) |
| 4:00 PM to 11:59 PM | 520 (10.4%) | 469 (9.1%) |
| Total | 5,010 (100.0%) | 5,160 (100.0%) |
Housing Occupancy in Alton
Occupancy by Ownership in Alton
Of the total 10,878 dwellings in Alton, owner-occupied units account for 6,238 (57.4%), while renter-occupied units make up 4,640 (42.6%).
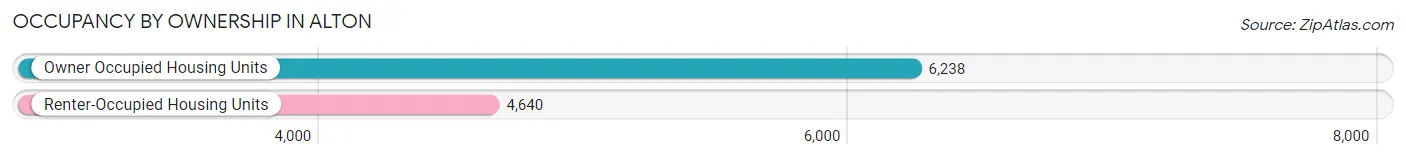
| Occupancy | # Housing Units | % Housing Units |
| Owner Occupied Housing Units | 6,238 | 57.4% |
| Renter-Occupied Housing Units | 4,640 | 42.6% |
| Total Occupied Housing Units | 10,878 | 100.0% |
Occupancy by Household Size in Alton
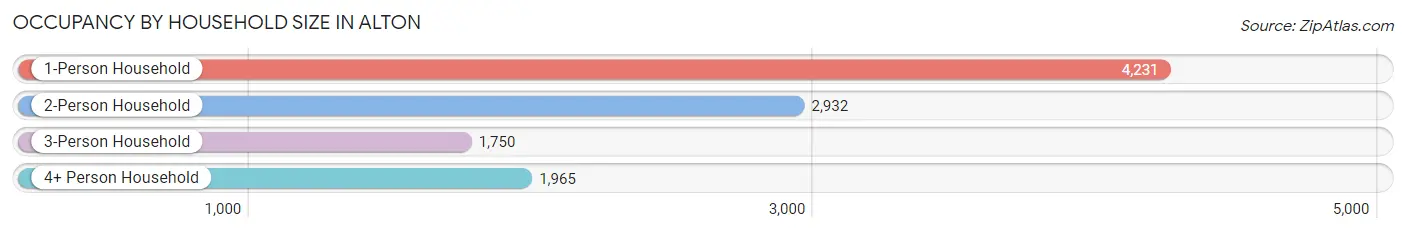
| Household Size | # Housing Units | % Housing Units |
| 1-Person Household | 4,231 | 38.9% |
| 2-Person Household | 2,932 | 27.0% |
| 3-Person Household | 1,750 | 16.1% |
| 4+ Person Household | 1,965 | 18.1% |
| Total Housing Units | 10,878 | 100.0% |
Occupancy by Ownership by Household Size in Alton
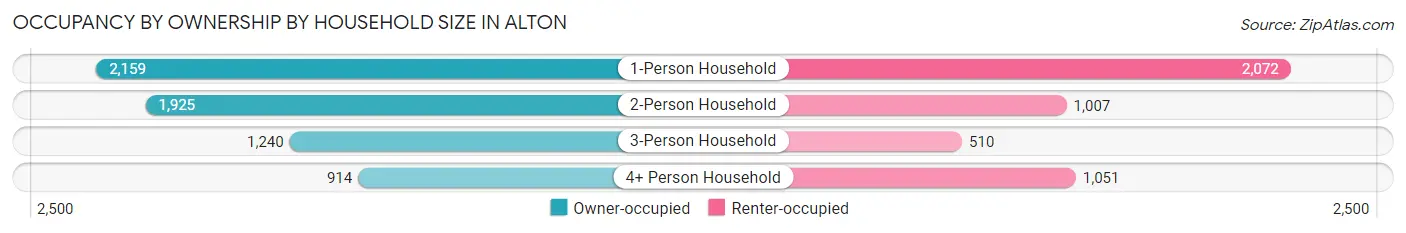
| Household Size | Owner-occupied | Renter-occupied |
| 1-Person Household | 2,159 (51.0%) | 2,072 (49.0%) |
| 2-Person Household | 1,925 (65.6%) | 1,007 (34.4%) |
| 3-Person Household | 1,240 (70.9%) | 510 (29.1%) |
| 4+ Person Household | 914 (46.5%) | 1,051 (53.5%) |
| Total Housing Units | 6,238 (57.4%) | 4,640 (42.6%) |
Occupancy by Educational Attainment in Alton
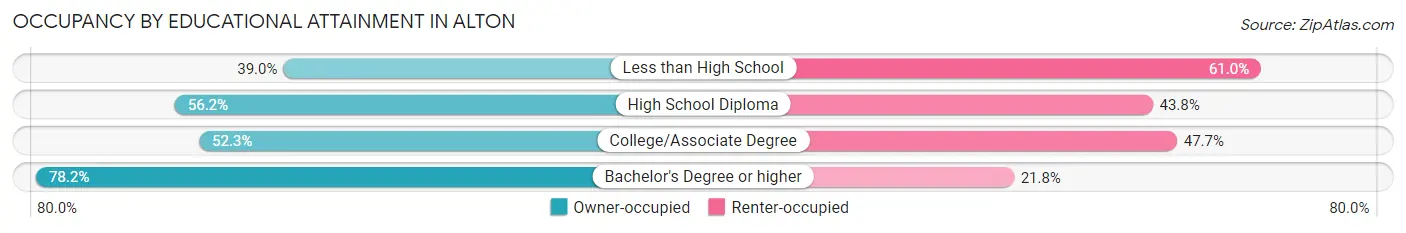
| Household Size | Owner-occupied | Renter-occupied |
| Less than High School | 415 (39.0%) | 650 (61.0%) |
| High School Diploma | 1,627 (56.2%) | 1,270 (43.8%) |
| College/Associate Degree | 2,450 (52.3%) | 2,233 (47.7%) |
| Bachelor's Degree or higher | 1,746 (78.2%) | 487 (21.8%) |
Occupancy by Age of Householder in Alton
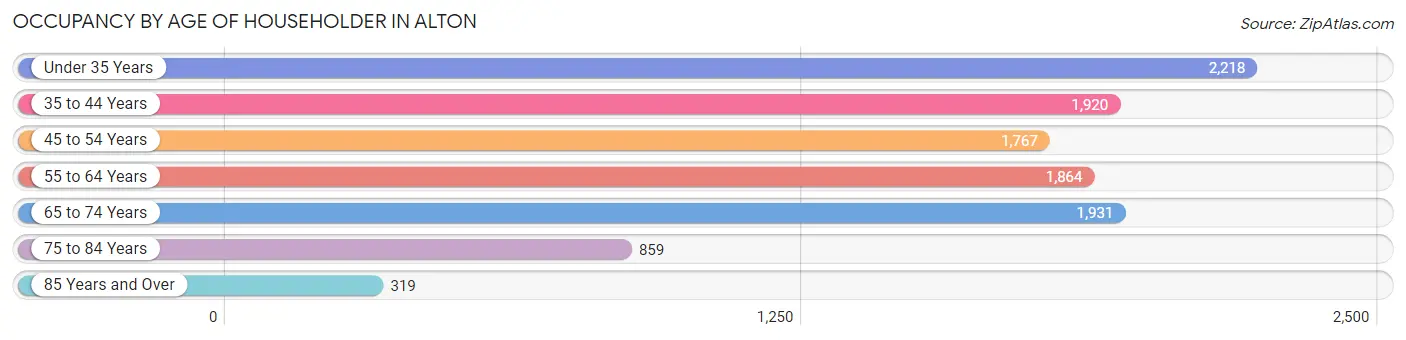
| Age Bracket | # Households | % Households |
| Under 35 Years | 2,218 | 20.4% |
| 35 to 44 Years | 1,920 | 17.6% |
| 45 to 54 Years | 1,767 | 16.2% |
| 55 to 64 Years | 1,864 | 17.1% |
| 65 to 74 Years | 1,931 | 17.7% |
| 75 to 84 Years | 859 | 7.9% |
| 85 Years and Over | 319 | 2.9% |
| Total | 10,878 | 100.0% |
Housing Finances in Alton
Median Income by Occupancy in Alton
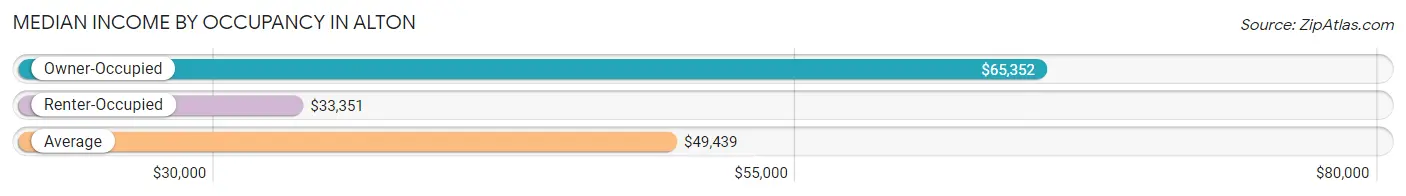
| Occupancy Type | # Households | Median Income |
| Owner-Occupied | 6,238 (57.4%) | $65,352 |
| Renter-Occupied | 4,640 (42.6%) | $33,351 |
| Average | 10,878 (100.0%) | $49,439 |
Occupancy by Householder Income Bracket in Alton
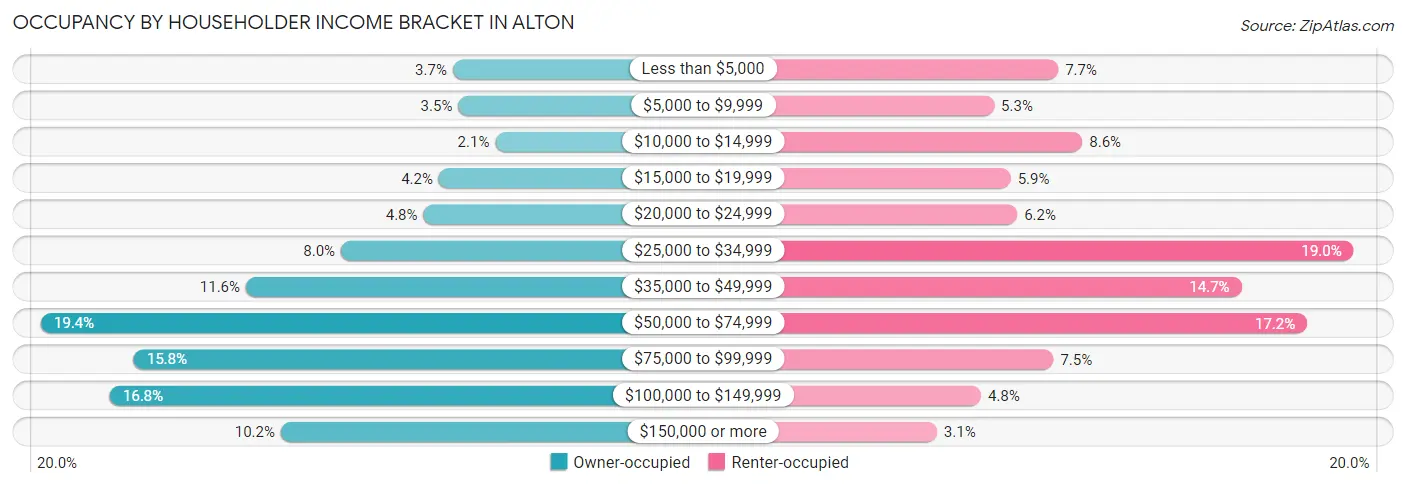
| Income Bracket | Owner-occupied | Renter-occupied |
| Less than $5,000 | 230 (3.7%) | 358 (7.7%) |
| $5,000 to $9,999 | 217 (3.5%) | 245 (5.3%) |
| $10,000 to $14,999 | 129 (2.1%) | 401 (8.6%) |
| $15,000 to $19,999 | 263 (4.2%) | 274 (5.9%) |
| $20,000 to $24,999 | 300 (4.8%) | 286 (6.2%) |
| $25,000 to $34,999 | 496 (8.0%) | 880 (19.0%) |
| $35,000 to $49,999 | 722 (11.6%) | 682 (14.7%) |
| $50,000 to $74,999 | 1,209 (19.4%) | 798 (17.2%) |
| $75,000 to $99,999 | 988 (15.8%) | 350 (7.5%) |
| $100,000 to $149,999 | 1,045 (16.8%) | 222 (4.8%) |
| $150,000 or more | 639 (10.2%) | 144 (3.1%) |
| Total | 6,238 (100.0%) | 4,640 (100.0%) |
Monthly Housing Cost Tiers in Alton
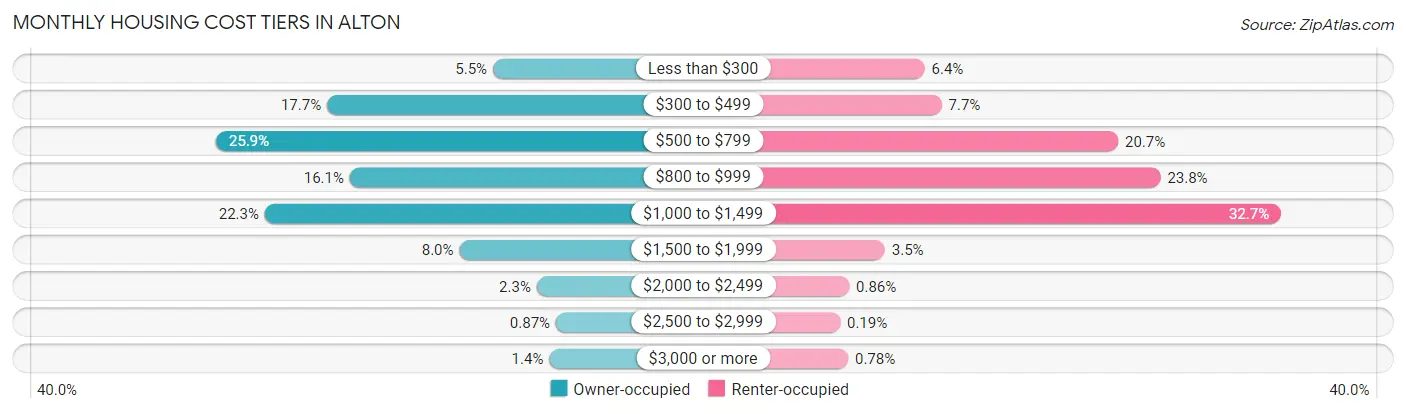
| Monthly Cost | Owner-occupied | Renter-occupied |
| Less than $300 | 344 (5.5%) | 298 (6.4%) |
| $300 to $499 | 1,106 (17.7%) | 356 (7.7%) |
| $500 to $799 | 1,616 (25.9%) | 959 (20.7%) |
| $800 to $999 | 1,001 (16.1%) | 1,104 (23.8%) |
| $1,000 to $1,499 | 1,392 (22.3%) | 1,516 (32.7%) |
| $1,500 to $1,999 | 498 (8.0%) | 162 (3.5%) |
| $2,000 to $2,499 | 142 (2.3%) | 40 (0.9%) |
| $2,500 to $2,999 | 54 (0.9%) | 9 (0.2%) |
| $3,000 or more | 85 (1.4%) | 36 (0.8%) |
| Total | 6,238 (100.0%) | 4,640 (100.0%) |
Physical Housing Characteristics in Alton
Housing Structures in Alton
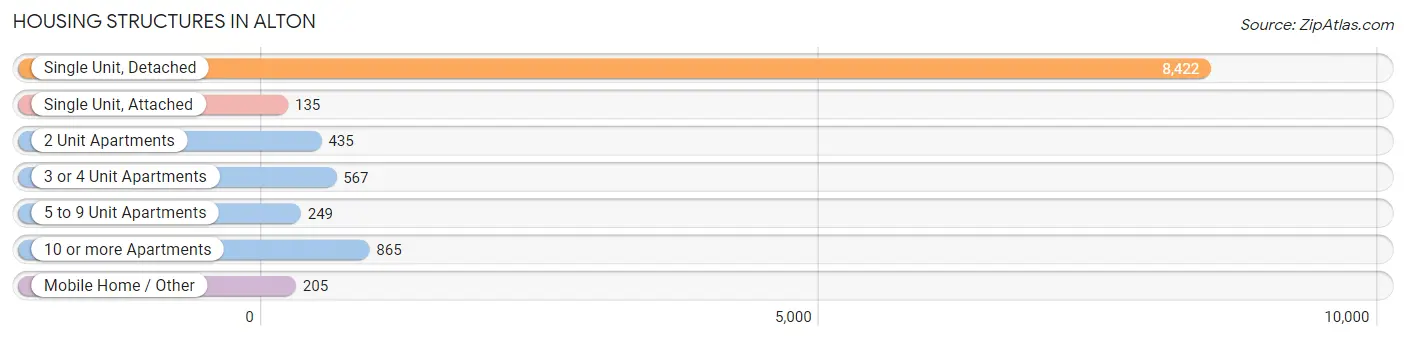
| Structure Type | # Housing Units | % Housing Units |
| Single Unit, Detached | 8,422 | 77.4% |
| Single Unit, Attached | 135 | 1.2% |
| 2 Unit Apartments | 435 | 4.0% |
| 3 or 4 Unit Apartments | 567 | 5.2% |
| 5 to 9 Unit Apartments | 249 | 2.3% |
| 10 or more Apartments | 865 | 8.0% |
| Mobile Home / Other | 205 | 1.9% |
| Total | 10,878 | 100.0% |
Housing Structures by Occupancy in Alton
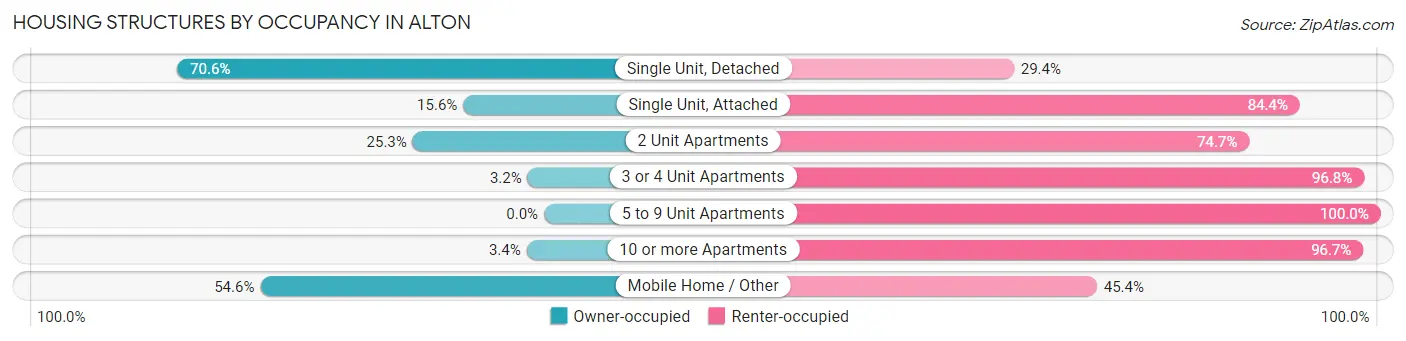
| Structure Type | Owner-occupied | Renter-occupied |
| Single Unit, Detached | 5,948 (70.6%) | 2,474 (29.4%) |
| Single Unit, Attached | 21 (15.6%) | 114 (84.4%) |
| 2 Unit Apartments | 110 (25.3%) | 325 (74.7%) |
| 3 or 4 Unit Apartments | 18 (3.2%) | 549 (96.8%) |
| 5 to 9 Unit Apartments | 0 (0.0%) | 249 (100.0%) |
| 10 or more Apartments | 29 (3.4%) | 836 (96.7%) |
| Mobile Home / Other | 112 (54.6%) | 93 (45.4%) |
| Total | 6,238 (57.4%) | 4,640 (42.6%) |
Housing Structures by Number of Rooms in Alton
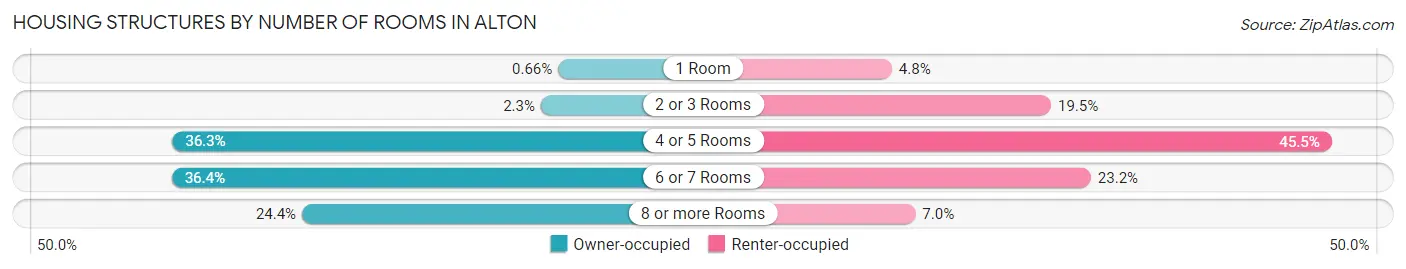
| Number of Rooms | Owner-occupied | Renter-occupied |
| 1 Room | 41 (0.7%) | 223 (4.8%) |
| 2 or 3 Rooms | 141 (2.3%) | 906 (19.5%) |
| 4 or 5 Rooms | 2,267 (36.3%) | 2,110 (45.5%) |
| 6 or 7 Rooms | 2,270 (36.4%) | 1,077 (23.2%) |
| 8 or more Rooms | 1,519 (24.3%) | 324 (7.0%) |
| Total | 6,238 (100.0%) | 4,640 (100.0%) |
Housing Structure by Heating Type in Alton
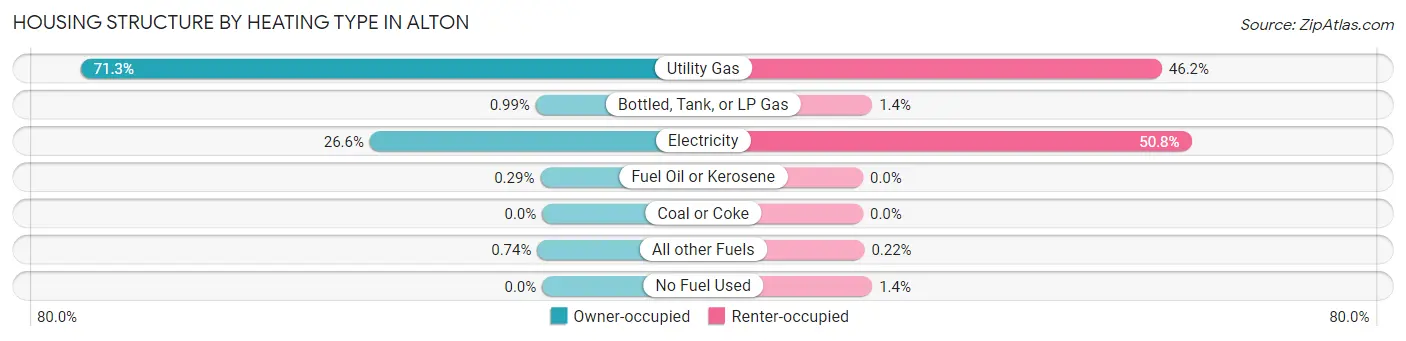
| Heating Type | Owner-occupied | Renter-occupied |
| Utility Gas | 4,450 (71.3%) | 2,143 (46.2%) |
| Bottled, Tank, or LP Gas | 62 (1.0%) | 66 (1.4%) |
| Electricity | 1,662 (26.6%) | 2,355 (50.7%) |
| Fuel Oil or Kerosene | 18 (0.3%) | 0 (0.0%) |
| Coal or Coke | 0 (0.0%) | 0 (0.0%) |
| All other Fuels | 46 (0.7%) | 10 (0.2%) |
| No Fuel Used | 0 (0.0%) | 66 (1.4%) |
| Total | 6,238 (100.0%) | 4,640 (100.0%) |
Household Vehicle Usage in Alton
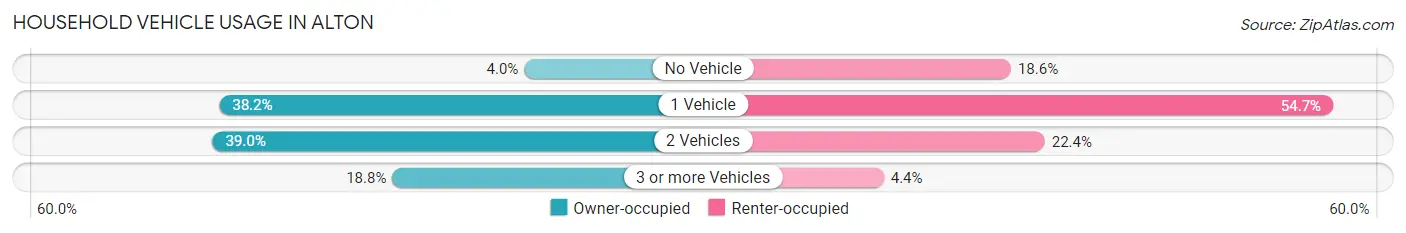
| Vehicles per Household | Owner-occupied | Renter-occupied |
| No Vehicle | 252 (4.0%) | 863 (18.6%) |
| 1 Vehicle | 2,382 (38.2%) | 2,536 (54.7%) |
| 2 Vehicles | 2,430 (39.0%) | 1,039 (22.4%) |
| 3 or more Vehicles | 1,174 (18.8%) | 202 (4.3%) |
| Total | 6,238 (100.0%) | 4,640 (100.0%) |
Real Estate & Mortgages in Alton
Real Estate and Mortgage Overview in Alton
| Characteristic | Without Mortgage | With Mortgage |
| Housing Units | 2,536 | 3,702 |
| Median Property Value | $86,300 | $98,200 |
| Median Household Income | $50,450 | $431 |
| Monthly Housing Costs | $480 | $85 |
| Real Estate Taxes | $1,357 | $189 |
Property Value by Mortgage Status in Alton
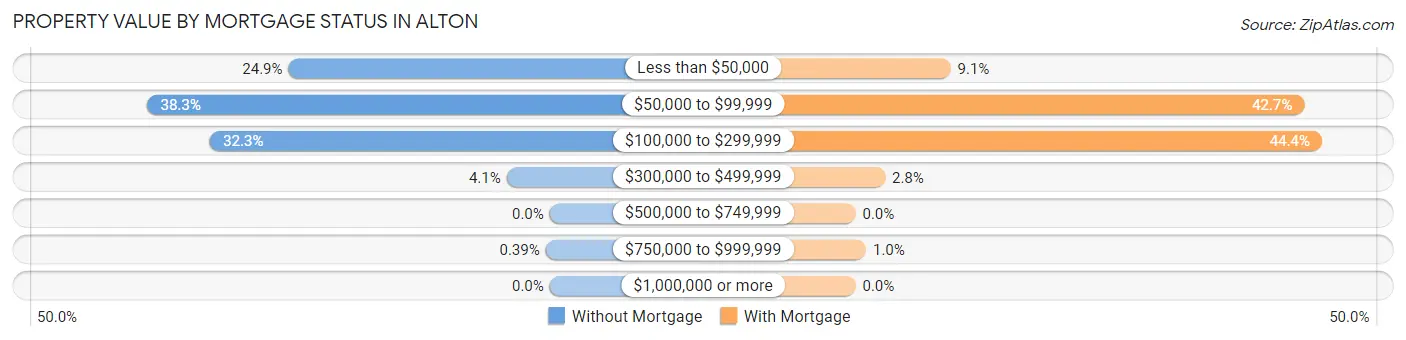
| Property Value | Without Mortgage | With Mortgage |
| Less than $50,000 | 631 (24.9%) | 335 (9.0%) |
| $50,000 to $99,999 | 971 (38.3%) | 1,582 (42.7%) |
| $100,000 to $299,999 | 820 (32.3%) | 1,644 (44.4%) |
| $300,000 to $499,999 | 104 (4.1%) | 104 (2.8%) |
| $500,000 to $749,999 | 0 (0.0%) | 0 (0.0%) |
| $750,000 to $999,999 | 10 (0.4%) | 37 (1.0%) |
| $1,000,000 or more | 0 (0.0%) | 0 (0.0%) |
| Total | 2,536 (100.0%) | 3,702 (100.0%) |
Household Income by Mortgage Status in Alton
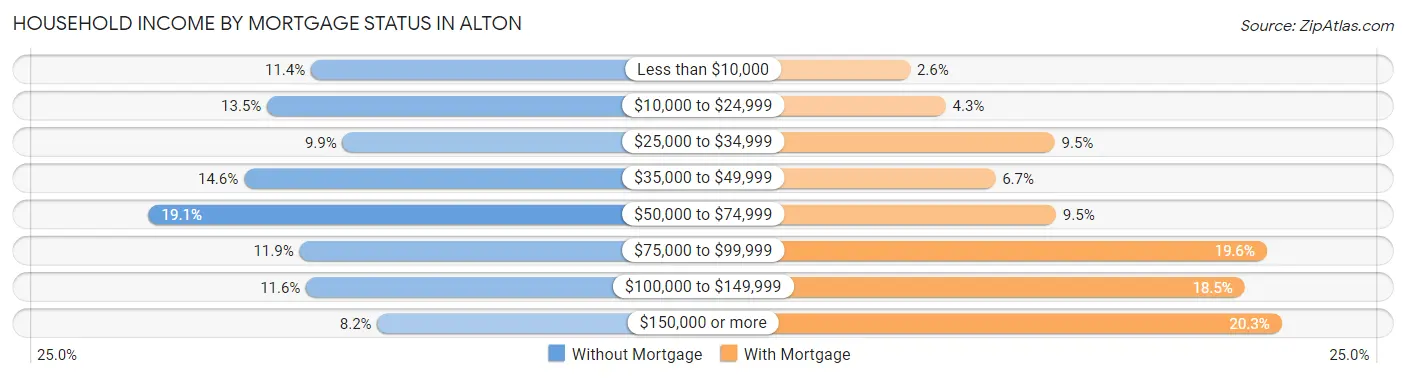
| Household Income | Without Mortgage | With Mortgage |
| Less than $10,000 | 288 (11.4%) | 96 (2.6%) |
| $10,000 to $24,999 | 341 (13.5%) | 159 (4.3%) |
| $25,000 to $34,999 | 250 (9.9%) | 351 (9.5%) |
| $35,000 to $49,999 | 369 (14.5%) | 246 (6.7%) |
| $50,000 to $74,999 | 484 (19.1%) | 353 (9.5%) |
| $75,000 to $99,999 | 302 (11.9%) | 725 (19.6%) |
| $100,000 to $149,999 | 294 (11.6%) | 686 (18.5%) |
| $150,000 or more | 208 (8.2%) | 751 (20.3%) |
| Total | 2,536 (100.0%) | 3,702 (100.0%) |
Property Value to Household Income Ratio in Alton
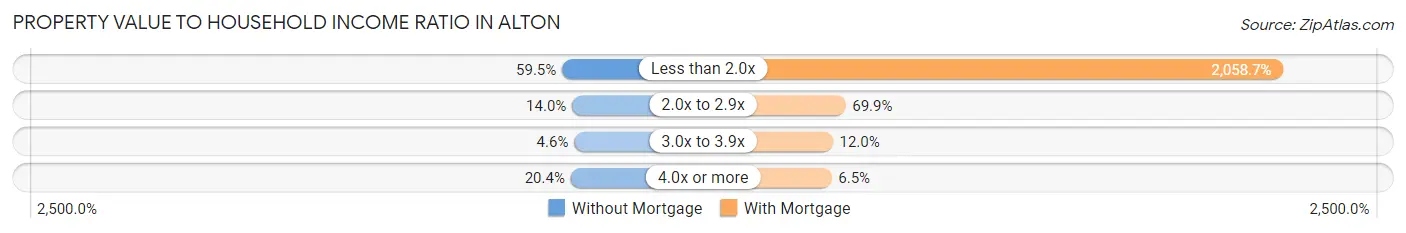
| Value-to-Income Ratio | Without Mortgage | With Mortgage |
| Less than 2.0x | 1,510 (59.5%) | 76,214 (2,058.7%) |
| 2.0x to 2.9x | 354 (14.0%) | 2,588 (69.9%) |
| 3.0x to 3.9x | 116 (4.6%) | 445 (12.0%) |
| 4.0x or more | 517 (20.4%) | 242 (6.5%) |
| Total | 2,536 (100.0%) | 3,702 (100.0%) |
Real Estate Taxes by Mortgage Status in Alton
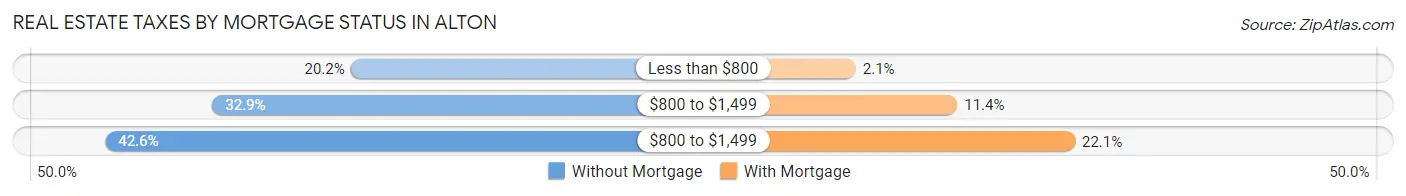
| Property Taxes | Without Mortgage | With Mortgage |
| Less than $800 | 513 (20.2%) | 77 (2.1%) |
| $800 to $1,499 | 833 (32.9%) | 420 (11.4%) |
| $800 to $1,499 | 1,081 (42.6%) | 818 (22.1%) |
| Total | 2,536 (100.0%) | 3,702 (100.0%) |
Health & Disability in Alton
Health Insurance Coverage by Age in Alton
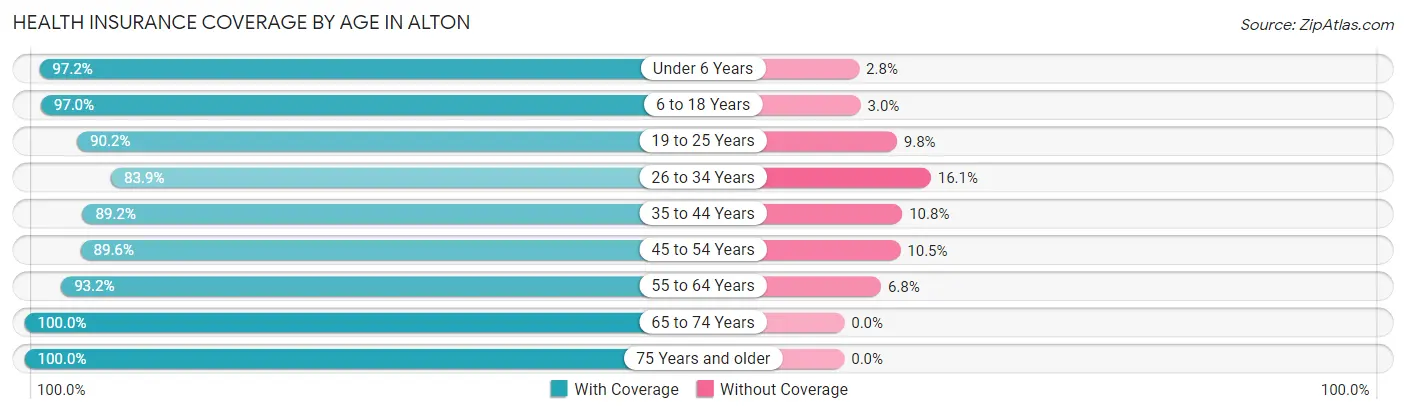
| Age Bracket | With Coverage | Without Coverage |
| Under 6 Years | 1,787 (97.2%) | 51 (2.8%) |
| 6 to 18 Years | 4,624 (97.0%) | 145 (3.0%) |
| 19 to 25 Years | 1,270 (90.2%) | 138 (9.8%) |
| 26 to 34 Years | 2,918 (83.9%) | 561 (16.1%) |
| 35 to 44 Years | 2,989 (89.2%) | 362 (10.8%) |
| 45 to 54 Years | 2,648 (89.5%) | 309 (10.4%) |
| 55 to 64 Years | 3,022 (93.2%) | 222 (6.8%) |
| 65 to 74 Years | 2,649 (100.0%) | 0 (0.0%) |
| 75 Years and older | 1,567 (100.0%) | 0 (0.0%) |
| Total | 23,474 (92.9%) | 1,788 (7.1%) |
Health Insurance Coverage by Citizenship Status in Alton
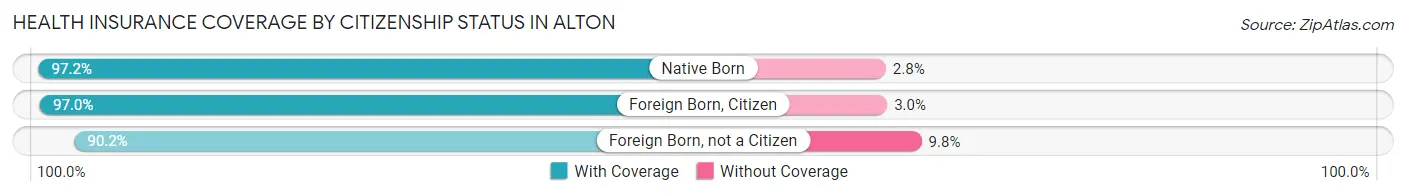
| Citizenship Status | With Coverage | Without Coverage |
| Native Born | 1,787 (97.2%) | 51 (2.8%) |
| Foreign Born, Citizen | 4,624 (97.0%) | 145 (3.0%) |
| Foreign Born, not a Citizen | 1,270 (90.2%) | 138 (9.8%) |
Health Insurance Coverage by Household Income in Alton
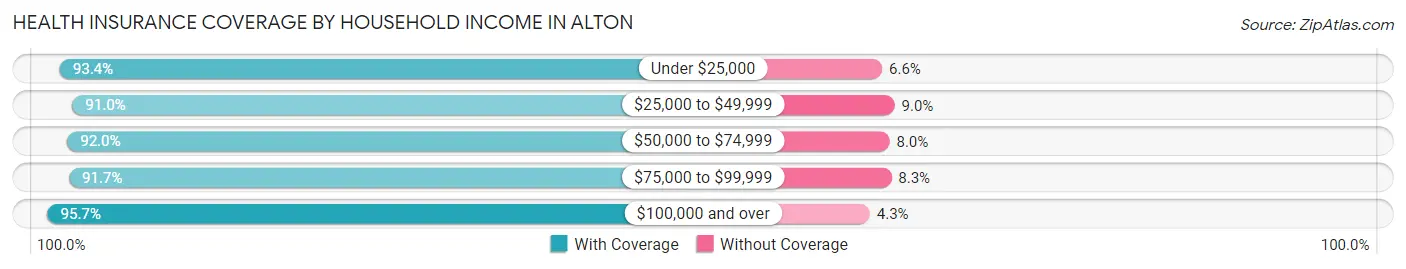
| Household Income | With Coverage | Without Coverage |
| Under $25,000 | 4,574 (93.4%) | 324 (6.6%) |
| $25,000 to $49,999 | 5,403 (91.0%) | 532 (9.0%) |
| $50,000 to $74,999 | 4,252 (92.0%) | 370 (8.0%) |
| $75,000 to $99,999 | 3,134 (91.7%) | 285 (8.3%) |
| $100,000 and over | 5,920 (95.7%) | 267 (4.3%) |
Public vs Private Health Insurance Coverage by Age in Alton
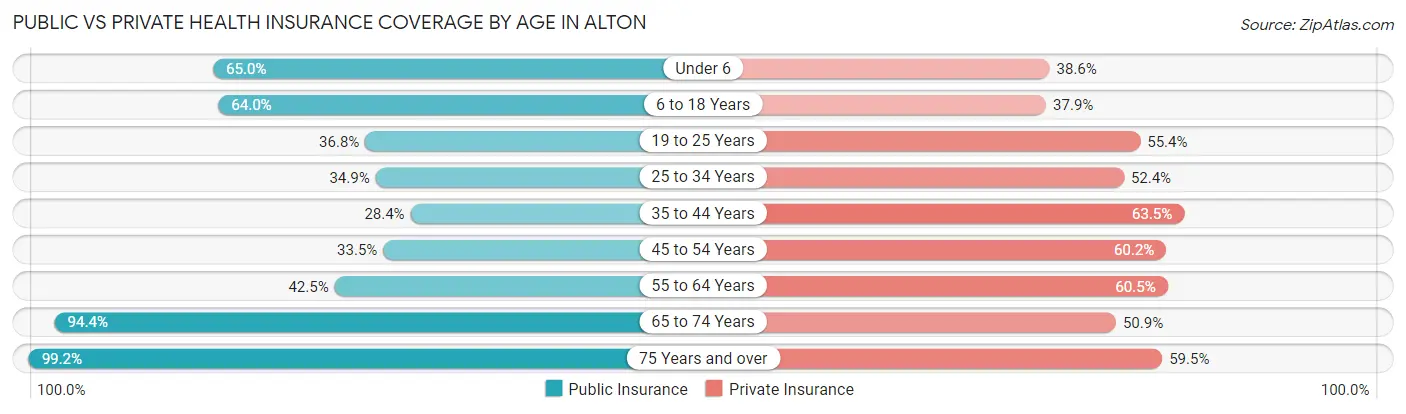
| Age Bracket | Public Insurance | Private Insurance |
| Under 6 | 1,195 (65.0%) | 709 (38.6%) |
| 6 to 18 Years | 3,053 (64.0%) | 1,809 (37.9%) |
| 19 to 25 Years | 518 (36.8%) | 780 (55.4%) |
| 25 to 34 Years | 1,213 (34.9%) | 1,822 (52.4%) |
| 35 to 44 Years | 951 (28.4%) | 2,129 (63.5%) |
| 45 to 54 Years | 989 (33.5%) | 1,780 (60.2%) |
| 55 to 64 Years | 1,378 (42.5%) | 1,961 (60.5%) |
| 65 to 74 Years | 2,501 (94.4%) | 1,348 (50.9%) |
| 75 Years and over | 1,555 (99.2%) | 932 (59.5%) |
| Total | 13,353 (52.9%) | 13,270 (52.5%) |
Disability Status by Sex by Age in Alton
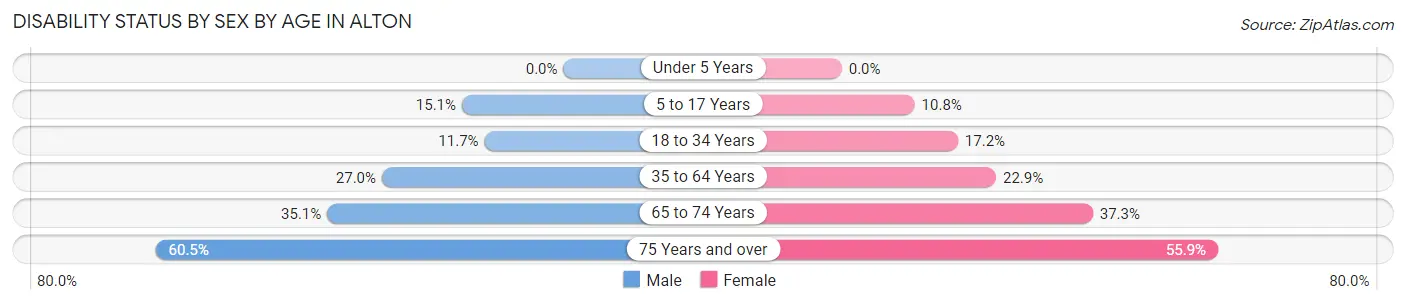
| Age Bracket | Male | Female |
| Under 5 Years | 0 (0.0%) | 0 (0.0%) |
| 5 to 17 Years | 334 (15.1%) | 261 (10.8%) |
| 18 to 34 Years | 330 (11.7%) | 459 (17.2%) |
| 35 to 64 Years | 1,218 (27.0%) | 1,153 (22.9%) |
| 65 to 74 Years | 388 (35.1%) | 575 (37.3%) |
| 75 Years and over | 359 (60.5%) | 544 (55.8%) |
Disability Class by Sex by Age in Alton
Disability Class: Hearing Difficulty
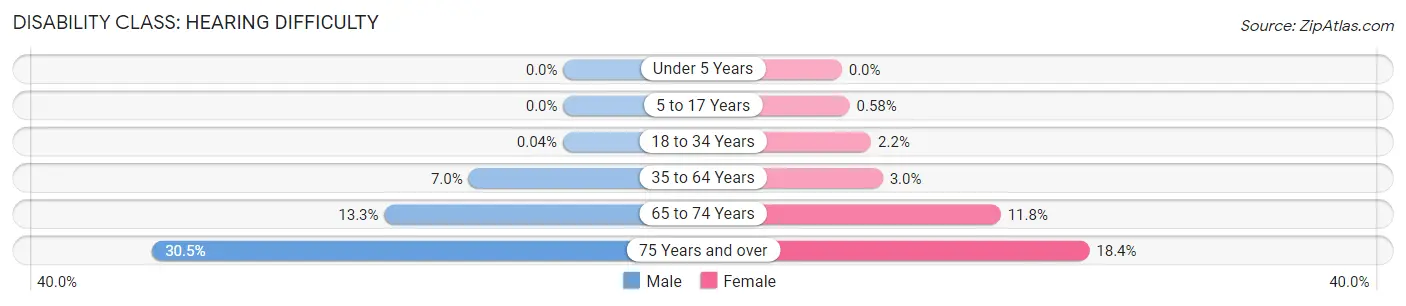
| Age Bracket | Male | Female |
| Under 5 Years | 0 (0.0%) | 0 (0.0%) |
| 5 to 17 Years | 0 (0.0%) | 14 (0.6%) |
| 18 to 34 Years | 1 (0.0%) | 58 (2.2%) |
| 35 to 64 Years | 318 (7.0%) | 153 (3.0%) |
| 65 to 74 Years | 147 (13.3%) | 182 (11.8%) |
| 75 Years and over | 181 (30.5%) | 179 (18.4%) |
Disability Class: Vision Difficulty
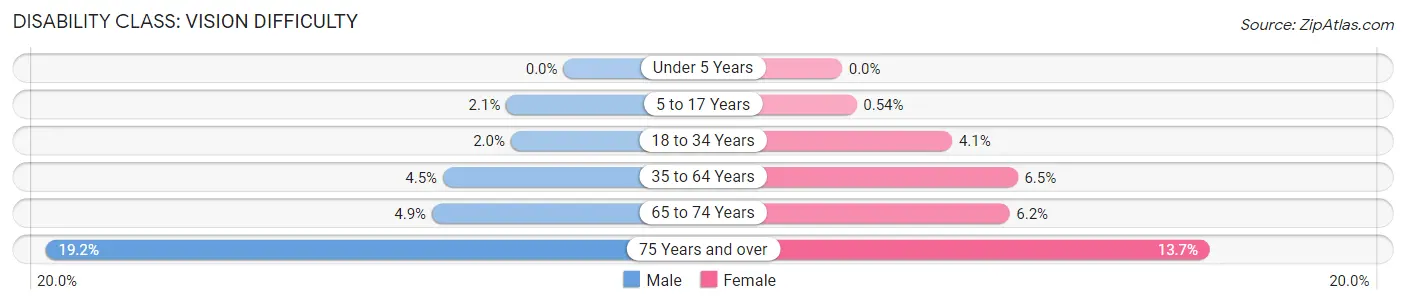
| Age Bracket | Male | Female |
| Under 5 Years | 0 (0.0%) | 0 (0.0%) |
| 5 to 17 Years | 47 (2.1%) | 13 (0.5%) |
| 18 to 34 Years | 55 (1.9%) | 109 (4.1%) |
| 35 to 64 Years | 202 (4.5%) | 328 (6.5%) |
| 65 to 74 Years | 54 (4.9%) | 96 (6.2%) |
| 75 Years and over | 114 (19.2%) | 133 (13.7%) |
Disability Class: Cognitive Difficulty
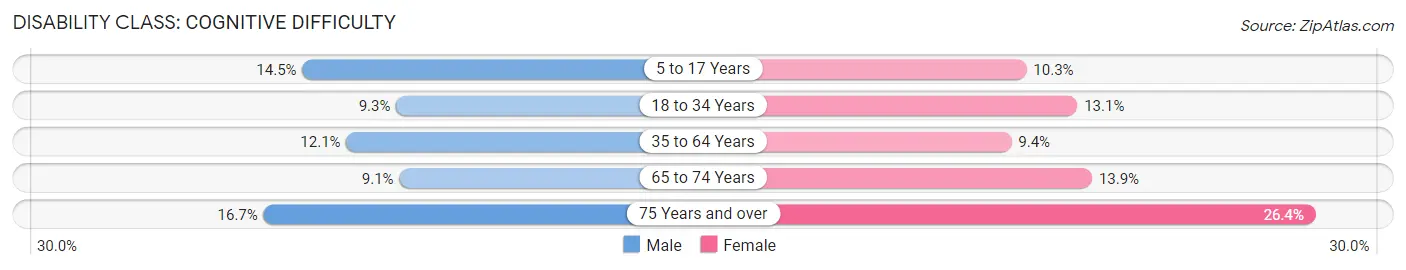
| Age Bracket | Male | Female |
| 5 to 17 Years | 322 (14.5%) | 248 (10.3%) |
| 18 to 34 Years | 262 (9.3%) | 349 (13.1%) |
| 35 to 64 Years | 546 (12.1%) | 475 (9.4%) |
| 65 to 74 Years | 101 (9.1%) | 215 (13.9%) |
| 75 Years and over | 99 (16.7%) | 257 (26.4%) |
Disability Class: Ambulatory Difficulty
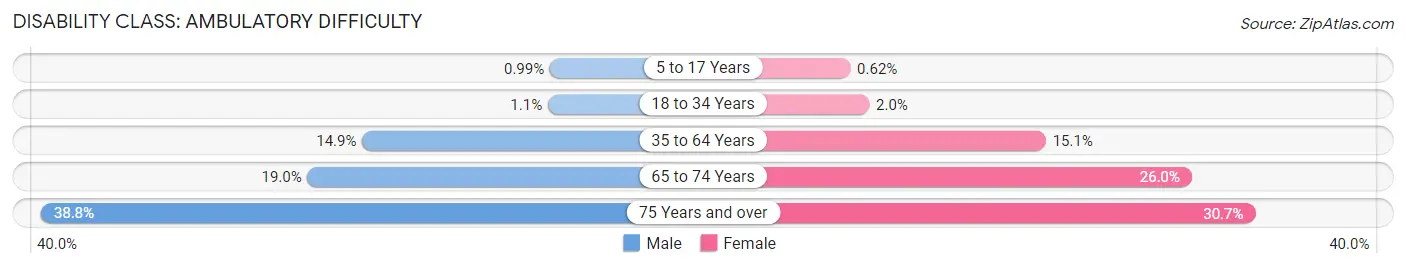
| Age Bracket | Male | Female |
| 5 to 17 Years | 22 (1.0%) | 15 (0.6%) |
| 18 to 34 Years | 32 (1.1%) | 54 (2.0%) |
| 35 to 64 Years | 675 (14.9%) | 762 (15.1%) |
| 65 to 74 Years | 210 (19.0%) | 401 (26.0%) |
| 75 Years and over | 230 (38.8%) | 299 (30.7%) |
Disability Class: Self-Care Difficulty
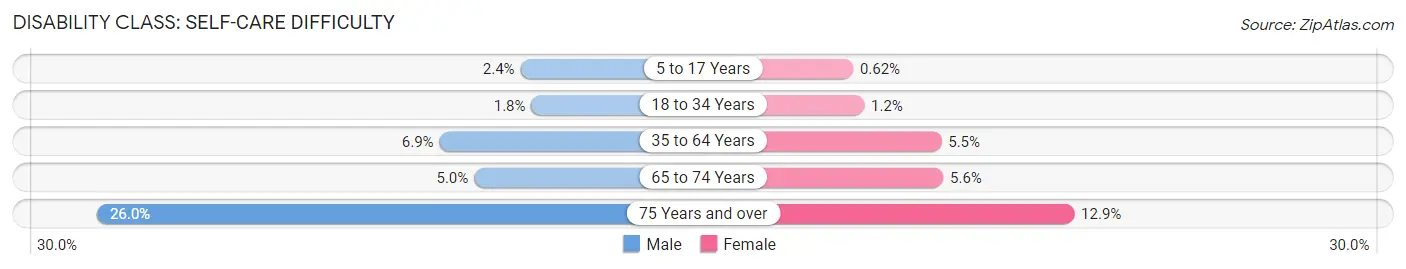
| Age Bracket | Male | Female |
| 5 to 17 Years | 53 (2.4%) | 15 (0.6%) |
| 18 to 34 Years | 50 (1.8%) | 33 (1.2%) |
| 35 to 64 Years | 312 (6.9%) | 279 (5.5%) |
| 65 to 74 Years | 55 (5.0%) | 87 (5.6%) |
| 75 Years and over | 154 (26.0%) | 126 (12.9%) |
Technology Access in Alton
Computing Device Access in Alton
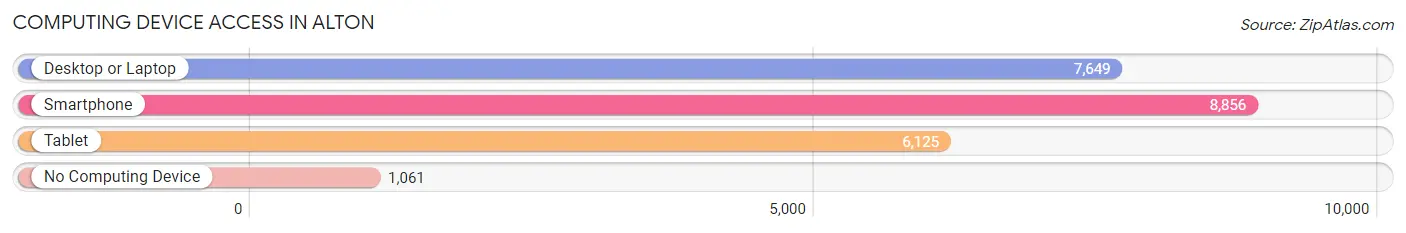
| Device Type | # Households | % Households |
| Desktop or Laptop | 7,649 | 70.3% |
| Smartphone | 8,856 | 81.4% |
| Tablet | 6,125 | 56.3% |
| No Computing Device | 1,061 | 9.8% |
| Total | 10,878 | 100.0% |
Internet Access in Alton
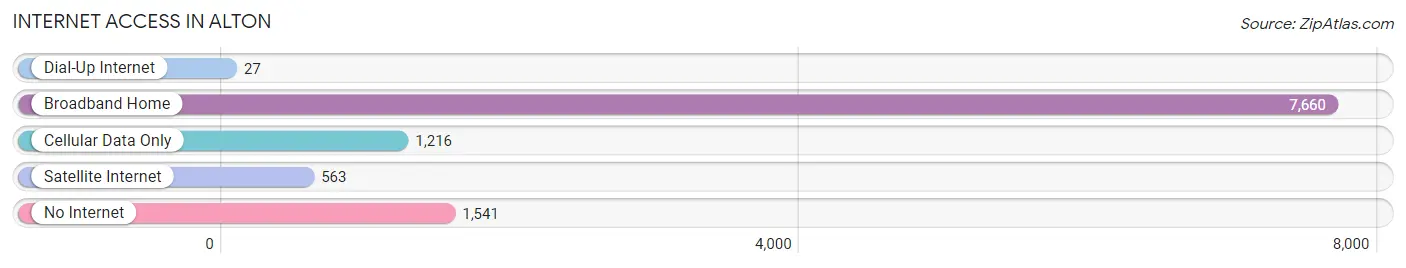
| Internet Type | # Households | % Households |
| Dial-Up Internet | 27 | 0.3% |
| Broadband Home | 7,660 | 70.4% |
| Cellular Data Only | 1,216 | 11.2% |
| Satellite Internet | 563 | 5.2% |
| No Internet | 1,541 | 14.2% |
| Total | 10,878 | 100.0% |
Alton Summary
Alton, Illinois is a city located in Madison County, Illinois, United States. It is located along the Mississippi River, just north of St. Louis, Missouri. The city has a population of approximately 27,000 people and is the county seat of Madison County.
History
Alton was founded in 1818 by Rufus Easton, a fur trader and land speculator. Easton named the city after his son, Alton, who was born in the same year. The city was incorporated in 1837 and was an important port city during the 19th century. It was a major stop on the Underground Railroad and was the site of the first debate between Abraham Lincoln and Stephen Douglas in 1858.
During the Civil War, Alton was a major center of Union activity. It was the site of the first Confederate prison camp in the United States, Camp Jackson. The city was also the site of the first free public library in the United States, the Alton Public Library, which opened in 1869.
Geography
Alton is located in southwestern Illinois, along the Mississippi River. It is situated about 25 miles north of St. Louis, Missouri. The city has a total area of 8.3 square miles, of which 8.2 square miles is land and 0.1 square miles is water.
The city is located in the American Bottom region of the Mississippi River Valley. The American Bottom is a flat, alluvial plain that stretches from Alton to the Kaskaskia River. The city is located on a bluff overlooking the Mississippi River.
Economy
Alton’s economy is largely based on manufacturing and tourism. The city is home to several large manufacturing companies, including Olin Corporation, Alton Box Board Company, and Alton Steel. The city is also home to several tourist attractions, including the National Great Rivers Museum, the Alton Museum of History and Art, and the Alton Marina.
Demographics
As of the 2010 census, Alton had a population of 27,865 people. The racial makeup of the city was 79.2% White, 15.3% African American, 0.4% Native American, 1.2% Asian, 0.1% Pacific Islander, 1.3% from other races, and 2.5% from two or more races. Hispanic or Latino of any race were 4.2% of the population.
The median income for a household in Alton was $37,945, and the median income for a family was $45,945. The per capita income for the city was $20,845. About 15.2% of families and 18.2% of the population were below the poverty line, including 28.2% of those under age 18 and 8.2% of those age 65 or over.
Common Questions
What is Per Capita Income in Alton?
Per Capita income in Alton is $28,120.
What is the Median Family Income in Alton?
Median Family Income in Alton is $66,837.
What is the Median Household income in Alton?
Median Household Income in Alton is $49,439.
What is Income or Wage Gap in Alton?
Income or Wage Gap in Alton is 17.8%.
Women in Alton earn 82.2 cents for every dollar earned by a man.
What is Family Income Deficit in Alton?
Family Income Deficit in Alton is $13,684.
Families that are below poverty line in Alton earn $13,684 less on average than the poverty threshold level.
What is Inequality or Gini Index in Alton?
Inequality or Gini Index in Alton is 0.46.
What is the Total Population of Alton?
Total Population of Alton is 25,642.
What is the Total Male Population of Alton?
Total Male Population of Alton is 12,244.
What is the Total Female Population of Alton?
Total Female Population of Alton is 13,398.
What is the Ratio of Males per 100 Females in Alton?
There are 91.39 Males per 100 Females in Alton.
What is the Ratio of Females per 100 Males in Alton?
There are 109.43 Females per 100 Males in Alton.
What is the Median Population Age in Alton?
Median Population Age in Alton is 38.3 Years.
What is the Average Family Size in Alton
Average Family Size in Alton is 3.1 People.
What is the Average Household Size in Alton
Average Household Size in Alton is 2.3 People.
How Large is the Labor Force in Alton?
There are 12,135 People in the Labor Forcein in Alton.
What is the Percentage of People in the Labor Force in Alton?
60.1% of People are in the Labor Force in Alton.
What is the Unemployment Rate in Alton?
Unemployment Rate in Alton is 6.6%.