Zip Codes with the Highest Percentage of White / Caucasian Population in Woodinville, WA
RELATED REPORTS & OPTIONS
White / Caucasian
Woodinville
Compare Zip Codes
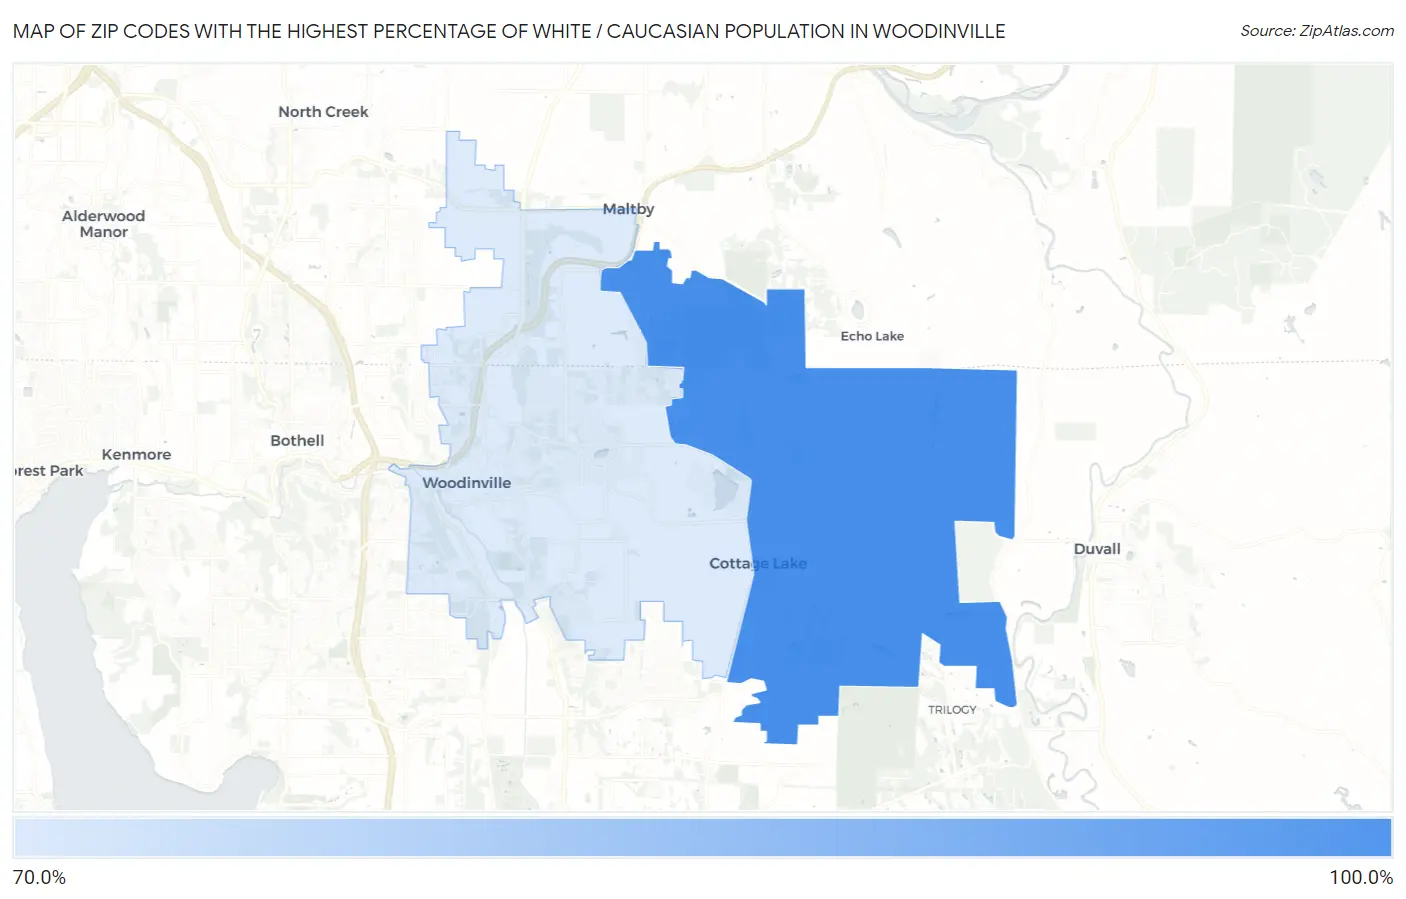
Map of Zip Codes with the Highest Percentage of White / Caucasian Population in Woodinville
77.4%
81.8%
Zip Codes with the Highest Percentage of White / Caucasian Population in Woodinville, WA
| Zip Code | White / Caucasian | vs State | vs National | |
| 1. | 98077 | 81.8% | 69.9%(+11.9)#287 | 65.9%(+15.9)#20,129 |
| 2. | 98072 | 77.4% | 69.9%(+7.54)#352 | 65.9%(+11.6)#22,087 |
1
Common Questions
What are the Top Zip Codes with the Highest Percentage of White / Caucasian Population in Woodinville, WA?
Top Zip Codes with the Highest Percentage of White / Caucasian Population in Woodinville, WA are:
What zip code has the Highest Percentage of White / Caucasian Population in Woodinville, WA?
98077 has the Highest Percentage of White / Caucasian Population in Woodinville, WA with 81.8%.
What is the Percentage of White / Caucasian Population in Woodinville, WA?
Percentage of White / Caucasian Population in Woodinville is 75.2%.
What is the Percentage of White / Caucasian Population in Washington?
Percentage of White / Caucasian Population in Washington is 69.9%.
What is the Percentage of White / Caucasian Population in the United States?
Percentage of White / Caucasian Population in the United States is 65.9%.