Zip Codes with the Highest Percentage of Households Without a Vehicle in Woodinville, WA
RELATED REPORTS & OPTIONS
Households without a Cars
Woodinville
Compare Zip Codes
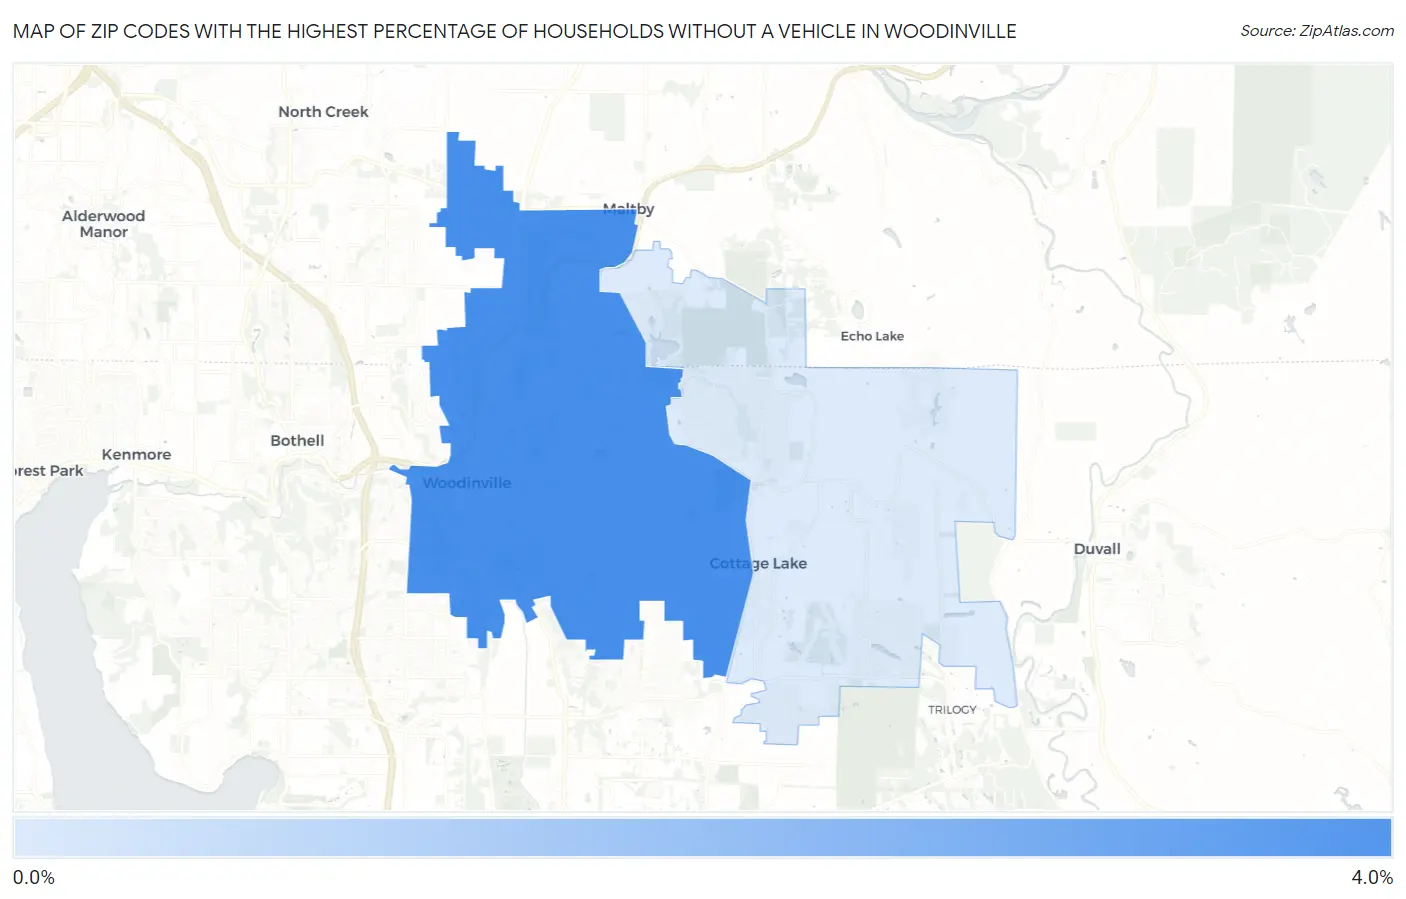
Map of Zip Codes with the Highest Percentage of Households Without a Vehicle in Woodinville
0.30%
3.4%
Zip Codes with the Highest Percentage of Households Without a Vehicle in Woodinville, WA
| Zip Code | Housholds Without a Car | vs State | vs National | |
| 1. | 98072 | 3.4% | 6.9%(-3.50)#293 | 8.3%(-4.90)#17,647 |
| 2. | 98077 | 0.30% | 6.9%(-6.60)#483 | 8.3%(-8.00)#27,187 |
1
Common Questions
What are the Top Zip Codes with the Highest Percentage of Households Without a Vehicle in Woodinville, WA?
Top Zip Codes with the Highest Percentage of Households Without a Vehicle in Woodinville, WA are:
What zip code has the Highest Percentage of Households Without a Vehicle in Woodinville, WA?
98072 has the Highest Percentage of Households Without a Vehicle in Woodinville, WA with 3.4%.
What is the Percentage of Households Without a Vehicle in Woodinville, WA?
Percentage of Households Without a Vehicle in Woodinville is 5.0%.
What is the Percentage of Households Without a Vehicle in Washington?
Percentage of Households Without a Vehicle in Washington is 6.9%.
What is the Percentage of Households Without a Vehicle in the United States?
Percentage of Households Without a Vehicle in the United States is 8.3%.