Zip Codes with the Highest Percentage of Population Employed in Transportation & Warehousing in Woodinville, WA
RELATED REPORTS & OPTIONS
Transportation & Warehousing
Woodinville
Compare Zip Codes
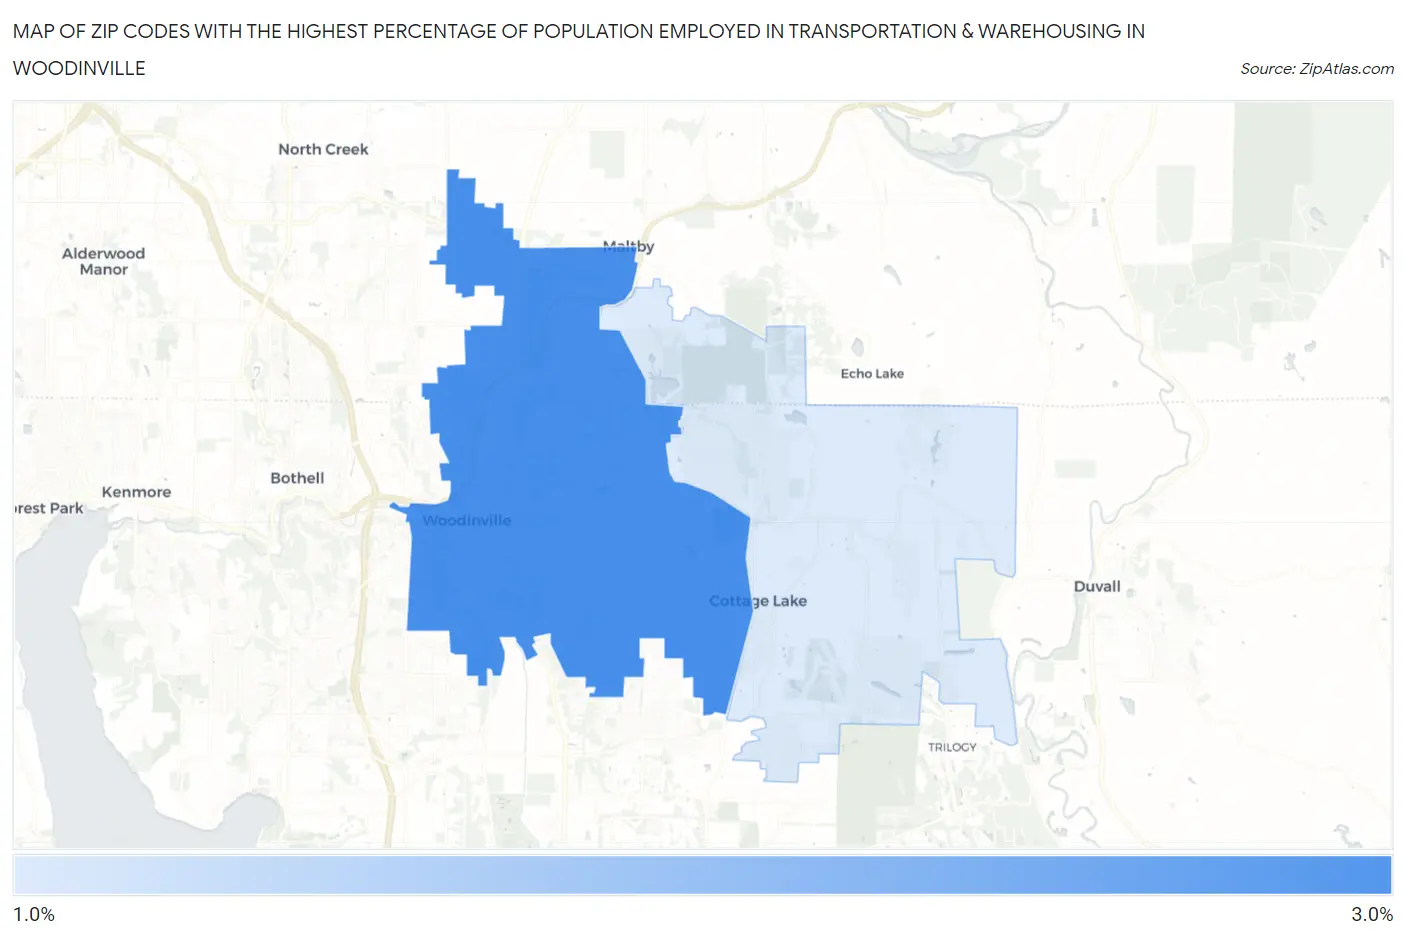
Map of Zip Codes with the Highest Percentage of Population Employed in Transportation & Warehousing in Woodinville
1.4%
2.6%
Zip Codes with the Highest Percentage of Population Employed in Transportation & Warehousing in Woodinville, WA
| Zip Code | % Employed | vs State | vs National | |
| 1. | 98072 | 2.6% | 4.9%(-2.30)#395 | 4.9%(-2.33)#21,904 |
| 2. | 98077 | 1.4% | 4.9%(-3.49)#470 | 4.9%(-3.52)#26,031 |
1
Common Questions
What are the Top Zip Codes with the Highest Percentage of Population Employed in Transportation & Warehousing in Woodinville, WA?
Top Zip Codes with the Highest Percentage of Population Employed in Transportation & Warehousing in Woodinville, WA are:
What zip code has the Highest Percentage of Population Employed in Transportation & Warehousing in Woodinville, WA?
98072 has the Highest Percentage of Population Employed in Transportation & Warehousing in Woodinville, WA with 2.6%.
What is the Percentage of Population Employed in Transportation & Warehousing in Woodinville, WA?
Percentage of Population Employed in Transportation & Warehousing in Woodinville is 3.2%.
What is the Percentage of Population Employed in Transportation & Warehousing in Washington?
Percentage of Population Employed in Transportation & Warehousing in Washington is 4.9%.
What is the Percentage of Population Employed in Transportation & Warehousing in the United States?
Percentage of Population Employed in Transportation & Warehousing in the United States is 4.9%.