Zip Codes with the Highest Percentage of Population with a Degree in Visual and Performing Arts in Woodinville, WA
RELATED REPORTS & OPTIONS
Visual and Performing Arts
Woodinville
Compare Zip Codes
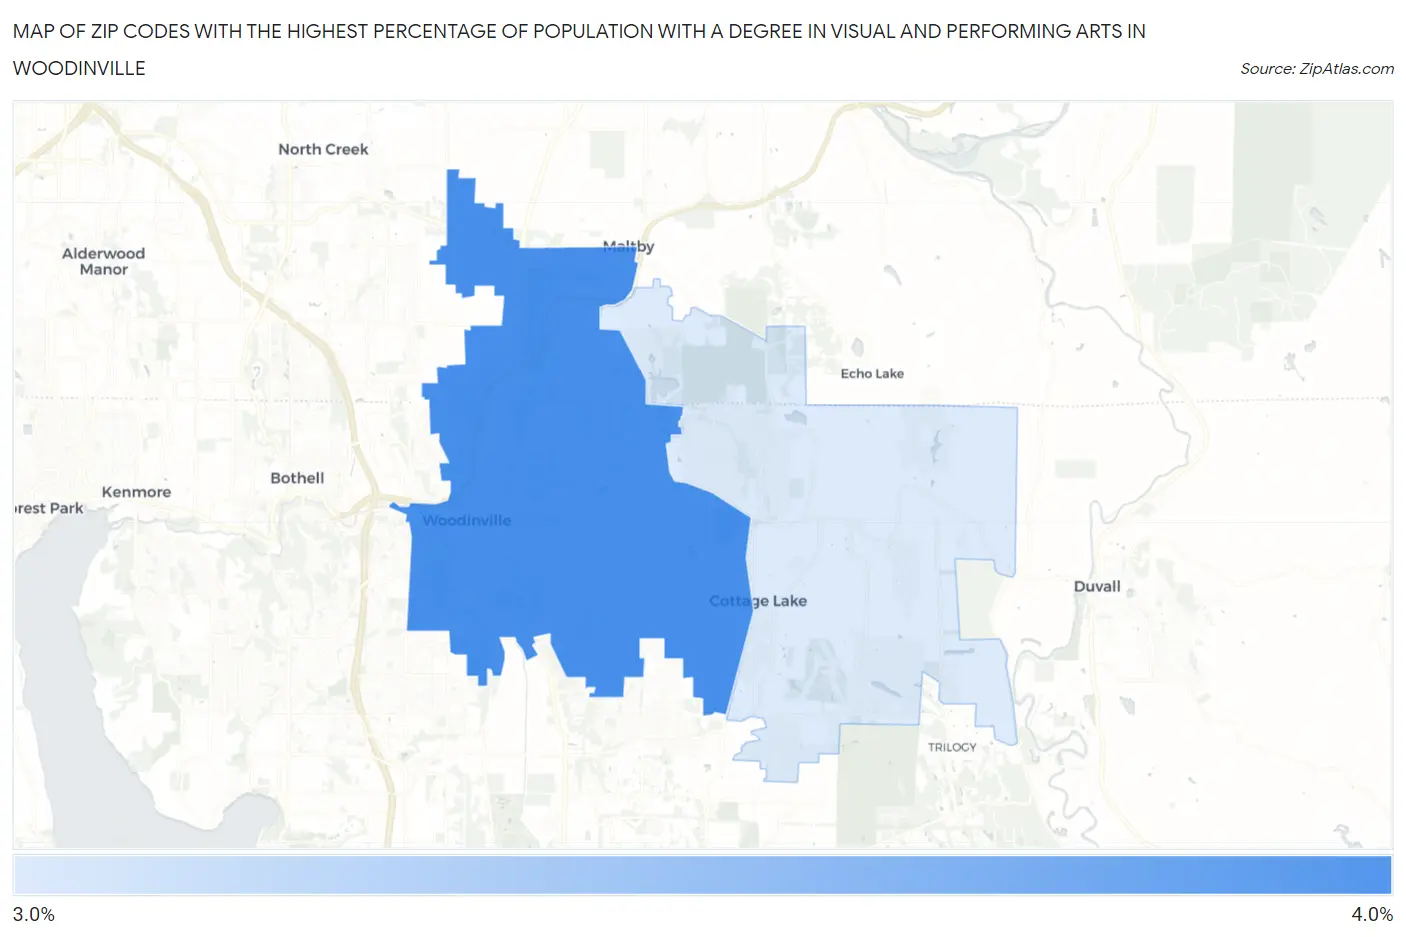
Map of Zip Codes with the Highest Percentage of Population with a Degree in Visual and Performing Arts in Woodinville
3.6%
3.9%
Zip Codes with the Highest Percentage of Population with a Degree in Visual and Performing Arts in Woodinville, WA
| Zip Code | % Graduates | vs State | vs National | |
| 1. | 98072 | 3.9% | 4.6%(-0.747)#247 | 4.3%(-0.380)#9,656 |
| 2. | 98077 | 3.6% | 4.6%(-1.04)#268 | 4.3%(-0.674)#10,570 |
1
Common Questions
What are the Top Zip Codes with the Highest Percentage of Population with a Degree in Visual and Performing Arts in Woodinville, WA?
Top Zip Codes with the Highest Percentage of Population with a Degree in Visual and Performing Arts in Woodinville, WA are:
What zip code has the Highest Percentage of Population with a Degree in Visual and Performing Arts in Woodinville, WA?
98072 has the Highest Percentage of Population with a Degree in Visual and Performing Arts in Woodinville, WA with 3.9%.
What is the Percentage of Population with a Degree in Visual and Performing Arts in Woodinville, WA?
Percentage of Population with a Degree in Visual and Performing Arts in Woodinville is 3.4%.
What is the Percentage of Population with a Degree in Visual and Performing Arts in Washington?
Percentage of Population with a Degree in Visual and Performing Arts in Washington is 4.6%.
What is the Percentage of Population with a Degree in Visual and Performing Arts in the United States?
Percentage of Population with a Degree in Visual and Performing Arts in the United States is 4.3%.