Immigrants from Ireland vs Immigrants from Eritrea 1 or more Vehicles in Household
COMPARE
Immigrants from Ireland
Immigrants from Eritrea
1 or more Vehicles in Household
1 or more Vehicles in Household Comparison
Immigrants from Ireland
Immigrants from Eritrea
86.4%
1 OR MORE VEHICLES IN HOUSEHOLD
0.0/ 100
METRIC RATING
289th/ 347
METRIC RANK
89.4%
1 OR MORE VEHICLES IN HOUSEHOLD
33.2/ 100
METRIC RATING
194th/ 347
METRIC RANK
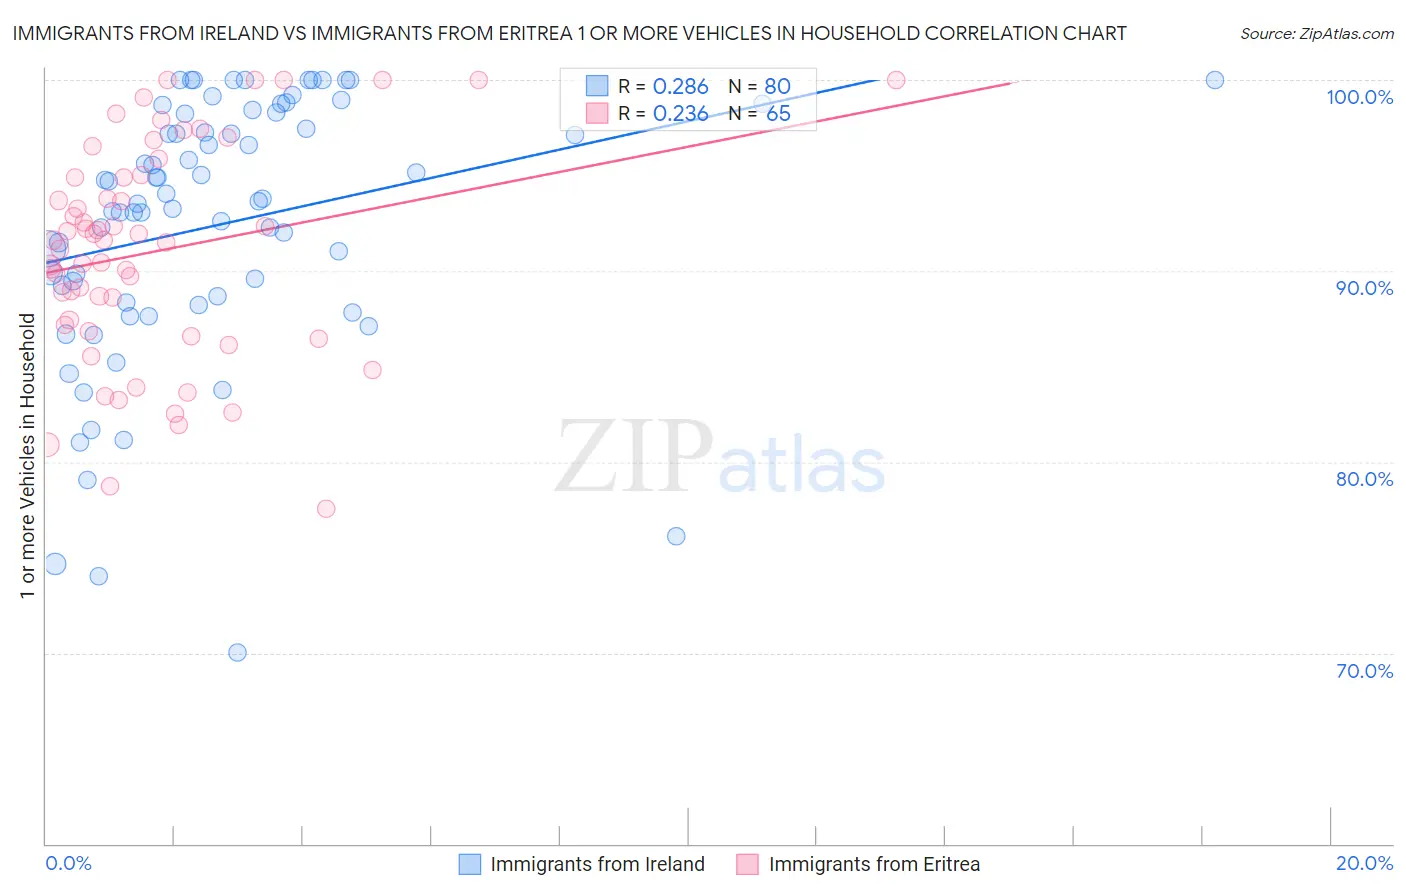
Immigrants from Ireland vs Immigrants from Eritrea 1 or more Vehicles in Household Correlation Chart
The statistical analysis conducted on geographies consisting of 240,751,818 people shows a weak positive correlation between the proportion of Immigrants from Ireland and percentage of households with 1 or more vehicles available in the United States with a correlation coefficient (R) of 0.286 and weighted average of 86.4%. Similarly, the statistical analysis conducted on geographies consisting of 104,847,164 people shows a weak positive correlation between the proportion of Immigrants from Eritrea and percentage of households with 1 or more vehicles available in the United States with a correlation coefficient (R) of 0.236 and weighted average of 89.4%, a difference of 3.5%.
1 or more Vehicles in Household Correlation Summary
| Measurement | Immigrants from Ireland | Immigrants from Eritrea |
| Minimum | 70.0% | 77.6% |
| Maximum | 100.0% | 100.0% |
| Range | 30.0% | 22.4% |
| Mean | 92.4% | 91.0% |
| Median | 93.7% | 91.6% |
| Interquartile 25% (IQ1) | 88.5% | 87.0% |
| Interquartile 75% (IQ3) | 98.3% | 95.0% |
| Interquartile Range (IQR) | 9.8% | 8.0% |
| Standard Deviation (Sample) | 6.9% | 5.6% |
| Standard Deviation (Population) | 6.9% | 5.6% |
Similar Demographics by 1 or more Vehicles in Household
Demographics Similar to Immigrants from Ireland by 1 or more Vehicles in Household
In terms of 1 or more vehicles in household, the demographic groups most similar to Immigrants from Ireland are Hopi (86.4%, a difference of 0.020%), Immigrants from Australia (86.4%, a difference of 0.040%), Immigrants from Malaysia (86.5%, a difference of 0.090%), Pima (86.3%, a difference of 0.12%), and Immigrants from Eastern Asia (86.5%, a difference of 0.16%).
| Demographics | Rating | Rank | 1 or more Vehicles in Household |
| Colville | 0.0 /100 | #282 | Tragic 86.8% |
| Immigrants | Eastern Europe | 0.0 /100 | #283 | Tragic 86.7% |
| Central American Indians | 0.0 /100 | #284 | Tragic 86.7% |
| Immigrants | Kazakhstan | 0.0 /100 | #285 | Tragic 86.6% |
| Immigrants | Eastern Asia | 0.0 /100 | #286 | Tragic 86.5% |
| Immigrants | Malaysia | 0.0 /100 | #287 | Tragic 86.5% |
| Hopi | 0.0 /100 | #288 | Tragic 86.4% |
| Immigrants | Ireland | 0.0 /100 | #289 | Tragic 86.4% |
| Immigrants | Australia | 0.0 /100 | #290 | Tragic 86.4% |
| Pima | 0.0 /100 | #291 | Tragic 86.3% |
| Okinawans | 0.0 /100 | #292 | Tragic 86.1% |
| Indians (Asian) | 0.0 /100 | #293 | Tragic 86.0% |
| Alaskan Athabascans | 0.0 /100 | #294 | Tragic 86.0% |
| Immigrants | Jamaica | 0.0 /100 | #295 | Tragic 85.8% |
| Immigrants | Spain | 0.0 /100 | #296 | Tragic 85.8% |
Demographics Similar to Immigrants from Eritrea by 1 or more Vehicles in Household
In terms of 1 or more vehicles in household, the demographic groups most similar to Immigrants from Eritrea are Immigrants from Armenia (89.4%, a difference of 0.020%), Immigrants from Northern Europe (89.5%, a difference of 0.040%), Immigrants from North Macedonia (89.5%, a difference of 0.060%), Shoshone (89.5%, a difference of 0.070%), and Immigrants from Poland (89.5%, a difference of 0.070%).
| Demographics | Rating | Rank | 1 or more Vehicles in Household |
| South Americans | 39.6 /100 | #187 | Fair 89.5% |
| Immigrants | Nepal | 38.9 /100 | #188 | Fair 89.5% |
| Carpatho Rusyns | 37.8 /100 | #189 | Fair 89.5% |
| Shoshone | 37.5 /100 | #190 | Fair 89.5% |
| Immigrants | Poland | 37.1 /100 | #191 | Fair 89.5% |
| Immigrants | North Macedonia | 36.5 /100 | #192 | Fair 89.5% |
| Immigrants | Northern Europe | 35.5 /100 | #193 | Fair 89.5% |
| Immigrants | Eritrea | 33.2 /100 | #194 | Fair 89.4% |
| Immigrants | Armenia | 31.8 /100 | #195 | Fair 89.4% |
| Crow | 24.3 /100 | #196 | Fair 89.3% |
| Immigrants | Sweden | 23.6 /100 | #197 | Fair 89.3% |
| Pennsylvania Germans | 22.9 /100 | #198 | Fair 89.3% |
| Immigrants | Asia | 22.8 /100 | #199 | Fair 89.3% |
| Central Americans | 21.4 /100 | #200 | Fair 89.2% |
| Immigrants | Western Europe | 20.5 /100 | #201 | Fair 89.2% |