Immigrants from Ireland vs Nepalese 1 or more Vehicles in Household
COMPARE
Immigrants from Ireland
Nepalese
1 or more Vehicles in Household
1 or more Vehicles in Household Comparison
Immigrants from Ireland
Nepalese
86.4%
1 OR MORE VEHICLES IN HOUSEHOLD
0.0/ 100
METRIC RATING
289th/ 347
METRIC RANK
92.6%
1 OR MORE VEHICLES IN HOUSEHOLD
100.0/ 100
METRIC RATING
23rd/ 347
METRIC RANK
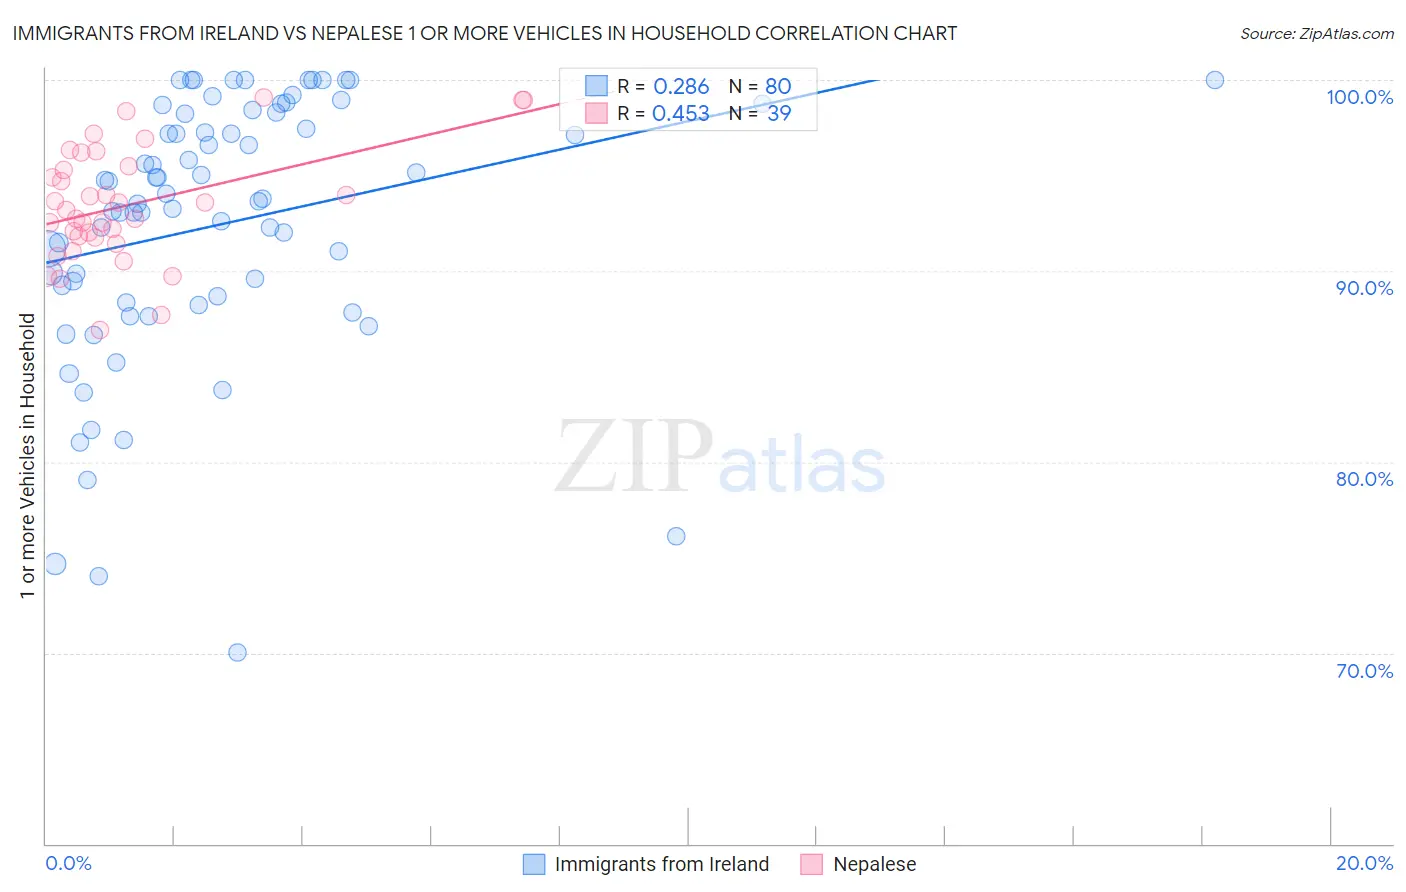
Immigrants from Ireland vs Nepalese 1 or more Vehicles in Household Correlation Chart
The statistical analysis conducted on geographies consisting of 240,751,818 people shows a weak positive correlation between the proportion of Immigrants from Ireland and percentage of households with 1 or more vehicles available in the United States with a correlation coefficient (R) of 0.286 and weighted average of 86.4%. Similarly, the statistical analysis conducted on geographies consisting of 24,483,296 people shows a moderate positive correlation between the proportion of Nepalese and percentage of households with 1 or more vehicles available in the United States with a correlation coefficient (R) of 0.453 and weighted average of 92.6%, a difference of 7.2%.
1 or more Vehicles in Household Correlation Summary
| Measurement | Immigrants from Ireland | Nepalese |
| Minimum | 70.0% | 86.9% |
| Maximum | 100.0% | 99.1% |
| Range | 30.0% | 12.2% |
| Mean | 92.4% | 93.5% |
| Median | 93.7% | 93.2% |
| Interquartile 25% (IQ1) | 88.5% | 91.8% |
| Interquartile 75% (IQ3) | 98.3% | 95.5% |
| Interquartile Range (IQR) | 9.8% | 3.7% |
| Standard Deviation (Sample) | 6.9% | 3.0% |
| Standard Deviation (Population) | 6.9% | 2.9% |
Similar Demographics by 1 or more Vehicles in Household
Demographics Similar to Immigrants from Ireland by 1 or more Vehicles in Household
In terms of 1 or more vehicles in household, the demographic groups most similar to Immigrants from Ireland are Hopi (86.4%, a difference of 0.020%), Immigrants from Australia (86.4%, a difference of 0.040%), Immigrants from Malaysia (86.5%, a difference of 0.090%), Pima (86.3%, a difference of 0.12%), and Immigrants from Eastern Asia (86.5%, a difference of 0.16%).
| Demographics | Rating | Rank | 1 or more Vehicles in Household |
| Colville | 0.0 /100 | #282 | Tragic 86.8% |
| Immigrants | Eastern Europe | 0.0 /100 | #283 | Tragic 86.7% |
| Central American Indians | 0.0 /100 | #284 | Tragic 86.7% |
| Immigrants | Kazakhstan | 0.0 /100 | #285 | Tragic 86.6% |
| Immigrants | Eastern Asia | 0.0 /100 | #286 | Tragic 86.5% |
| Immigrants | Malaysia | 0.0 /100 | #287 | Tragic 86.5% |
| Hopi | 0.0 /100 | #288 | Tragic 86.4% |
| Immigrants | Ireland | 0.0 /100 | #289 | Tragic 86.4% |
| Immigrants | Australia | 0.0 /100 | #290 | Tragic 86.4% |
| Pima | 0.0 /100 | #291 | Tragic 86.3% |
| Okinawans | 0.0 /100 | #292 | Tragic 86.1% |
| Indians (Asian) | 0.0 /100 | #293 | Tragic 86.0% |
| Alaskan Athabascans | 0.0 /100 | #294 | Tragic 86.0% |
| Immigrants | Jamaica | 0.0 /100 | #295 | Tragic 85.8% |
| Immigrants | Spain | 0.0 /100 | #296 | Tragic 85.8% |
Demographics Similar to Nepalese by 1 or more Vehicles in Household
In terms of 1 or more vehicles in household, the demographic groups most similar to Nepalese are French (92.7%, a difference of 0.070%), Yaqui (92.6%, a difference of 0.070%), Ottawa (92.7%, a difference of 0.080%), Immigrants from Iraq (92.5%, a difference of 0.090%), and Arapaho (92.7%, a difference of 0.10%).
| Demographics | Rating | Rank | 1 or more Vehicles in Household |
| Assyrians/Chaldeans/Syriacs | 100.0 /100 | #16 | Exceptional 93.0% |
| Europeans | 100.0 /100 | #17 | Exceptional 93.0% |
| Welsh | 100.0 /100 | #18 | Exceptional 93.0% |
| Tongans | 100.0 /100 | #19 | Exceptional 92.9% |
| Arapaho | 100.0 /100 | #20 | Exceptional 92.7% |
| Ottawa | 100.0 /100 | #21 | Exceptional 92.7% |
| French | 100.0 /100 | #22 | Exceptional 92.7% |
| Nepalese | 100.0 /100 | #23 | Exceptional 92.6% |
| Yaqui | 100.0 /100 | #24 | Exceptional 92.6% |
| Immigrants | Iraq | 100.0 /100 | #25 | Exceptional 92.5% |
| British | 100.0 /100 | #26 | Exceptional 92.5% |
| Americans | 100.0 /100 | #27 | Exceptional 92.5% |
| Sri Lankans | 100.0 /100 | #28 | Exceptional 92.5% |
| Native Hawaiians | 100.0 /100 | #29 | Exceptional 92.4% |
| Finns | 100.0 /100 | #30 | Exceptional 92.4% |