Zip Codes with the Highest Percentage of Immigrants from Eastern Asia in Portsmouth, VA
RELATED REPORTS & OPTIONS
Eastern Asia
Portsmouth
Compare Zip Codes
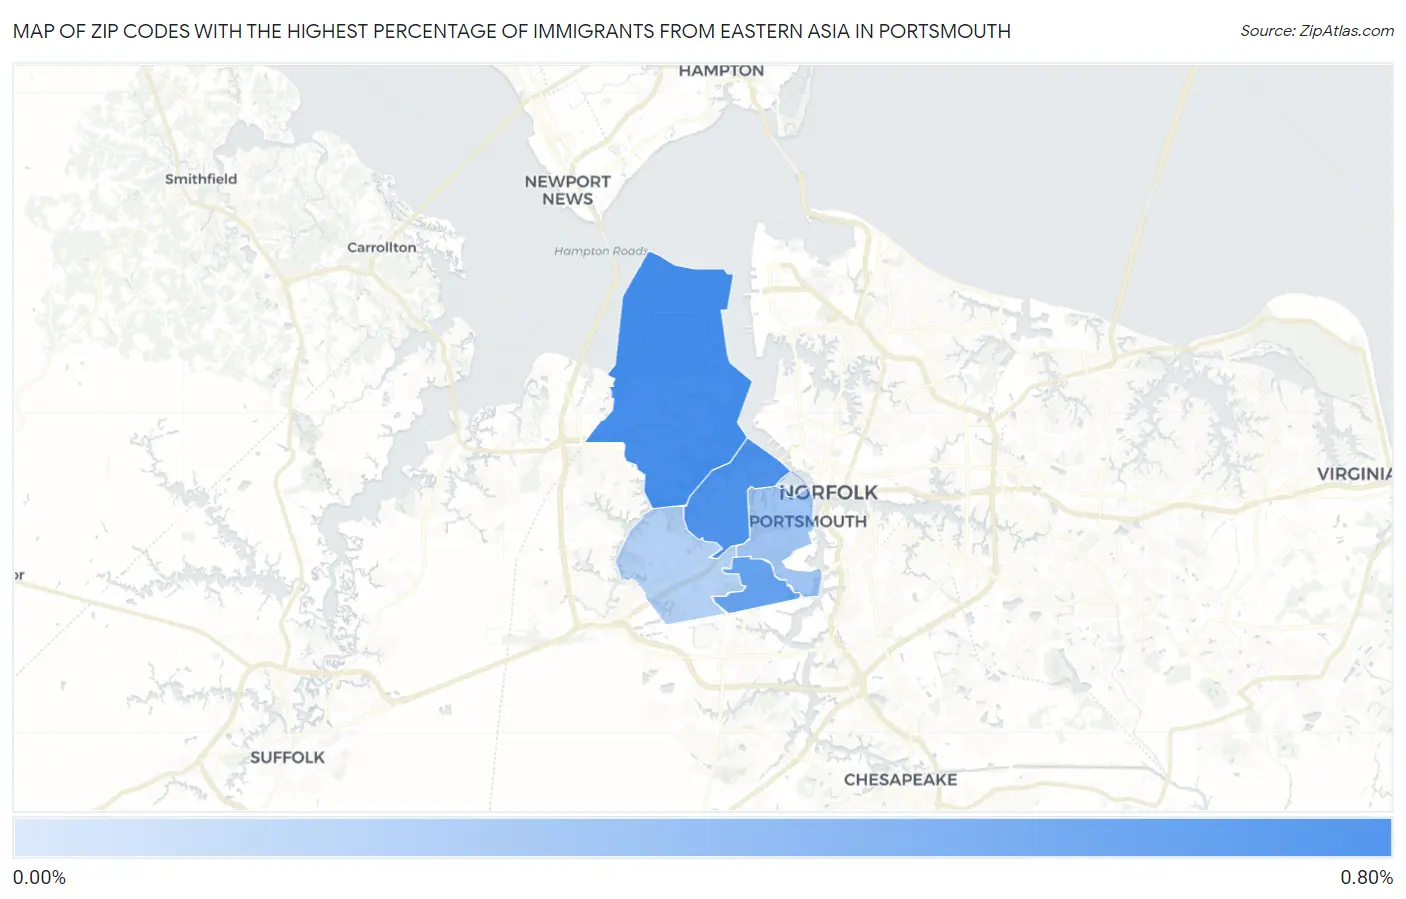
Map of Zip Codes with the Highest Percentage of Immigrants from Eastern Asia in Portsmouth
0.17%
0.67%
Zip Codes with the Highest Percentage of Immigrants from Eastern Asia in Portsmouth, VA
| Zip Code | Eastern Asia | vs State | vs National | |
| 1. | 23703 | 0.67% | 1.35%(-0.684)#173 | 1.28%(-0.608)#5,432 |
| 2. | 23707 | 0.64% | 1.35%(-0.713)#175 | 1.28%(-0.637)#5,593 |
| 3. | 23702 | 0.53% | 1.35%(-0.823)#192 | 1.28%(-0.747)#6,365 |
| 4. | 23704 | 0.26% | 1.35%(-1.09)#276 | 1.28%(-1.01)#9,250 |
| 5. | 23701 | 0.17% | 1.35%(-1.18)#311 | 1.28%(-1.11)#10,855 |
1
Common Questions
What are the Top 5 Zip Codes with the Highest Percentage of Immigrants from Eastern Asia in Portsmouth, VA?
Top 5 Zip Codes with the Highest Percentage of Immigrants from Eastern Asia in Portsmouth, VA are:
What zip code has the Highest Percentage of Immigrants from Eastern Asia in Portsmouth, VA?
23703 has the Highest Percentage of Immigrants from Eastern Asia in Portsmouth, VA with 0.67%.
What is the Percentage of Immigrants from Eastern Asia in Portsmouth, VA?
Percentage of Immigrants from Eastern Asia in Portsmouth is 0.44%.
What is the Percentage of Immigrants from Eastern Asia in Virginia?
Percentage of Immigrants from Eastern Asia in Virginia is 1.35%.
What is the Percentage of Immigrants from Eastern Asia in the United States?
Percentage of Immigrants from Eastern Asia in the United States is 1.28%.