Zip Codes with the Highest Percentage of Population Employed in Accommodation & Food Services in Norfolk, VA

RELATED REPORTS & OPTIONS

Accommodation & Food Services
Population
Families and Households
Female Fertility
Female Fertility (Unmarried)
Race (Community Size)
Race (Percentage)
Ancestry (Community Size)
AfghanAfricanAlaska NativeAmericanApacheArabArgentineanArmenianAustralianAustrianBahamianBarbadianBelgianBelizeanBhutaneseBlackfeetBolivianBrazilianBritishBritish West IndianBulgarianBurmeseCajunCanadianCape VerdeanCelticCentral AmericanCentral American IndianCherokeeChileanChippewaChoctawColombianCosta RicanCreekCroatianCubanCzechCzechoslovakianDanishDominicanDutchEastern EuropeanEcuadorianEnglishEstonianEthiopianEuropeanFilipinoFinnishFrenchFrench CanadianGermanGhanaianGreekGuamanian / ChamorroGuatemalanGuyaneseHaitianHonduranHungarianIndian (Asian)IndonesianIranianIrishIroquoisIsraeliItalianJamaicanJapaneseJordanianKoreanLaotianLebaneseLiberianLithuanianLumbeeMalaysianMexicanMexican American IndianMoroccanNative HawaiianNavajoNicaraguanNigerianNorthern EuropeanNorwegianPakistaniPalestinianPanamanianPennsylvania GermanPeruvianPolishPortuguesePuerto RicanRomanianRussianSalvadoranSamoanScandinavianScotch-IrishScottishSerbianSierra LeoneanSiouxSlavicSlovakSloveneSouth AfricanSouth AmericanSpaniardSpanishSri LankanSubsaharan AfricanSwedishSwissSyrianThaiTrinidadian and TobagonianTurkishUgandanUkrainianVenezuelanVietnameseWelshWest IndianYugoslavian
Ancestry (Percentage)
AfghanAfricanAlaska NativeAmericanApacheArabArgentineanArmenianAustralianAustrianBahamianBarbadianBelgianBelizeanBhutaneseBlackfeetBolivianBrazilianBritishBritish West IndianBulgarianBurmeseCajunCanadianCape VerdeanCelticCentral AmericanCentral American IndianCherokeeChileanChippewaChoctawColombianCosta RicanCreekCroatianCubanCzechCzechoslovakianDanishDominicanDutchEastern EuropeanEcuadorianEnglishEstonianEthiopianEuropeanFilipinoFinnishFrenchFrench CanadianGermanGhanaianGreekGuamanian / ChamorroGuatemalanGuyaneseHaitianHonduranHungarianIndian (Asian)IndonesianIranianIrishIroquoisIsraeliItalianJamaicanJapaneseJordanianKoreanLaotianLebaneseLiberianLithuanianLumbeeMalaysianMexicanMexican American IndianMoroccanNative HawaiianNavajoNicaraguanNigerianNorthern EuropeanNorwegianPakistaniPalestinianPanamanianPennsylvania GermanPeruvianPolishPortuguesePuerto RicanRomanianRussianSalvadoranSamoanScandinavianScotch-IrishScottishSerbianSierra LeoneanSiouxSlavicSlovakSloveneSouth AfricanSouth AmericanSpaniardSpanishSri LankanSubsaharan AfricanSwedishSwissSyrianThaiTrinidadian and TobagonianTurkishUgandanUkrainianVenezuelanVietnameseWelshWest IndianYugoslavian
Immigrant Origin (Total)
Immigrant Origin (Percentage)
Income
Income (Families)
Income (Households)
Poverty
Poverty (Families)
Unemployment
Employment Occupations
Employment Industries
Employer Class
Commute Time
Commute Means
School Enrollment
Education by Degree Field
Occupancy
Finances
Physical Characteristics
Norfolk
Compare Zip Codes
Comparison Subject

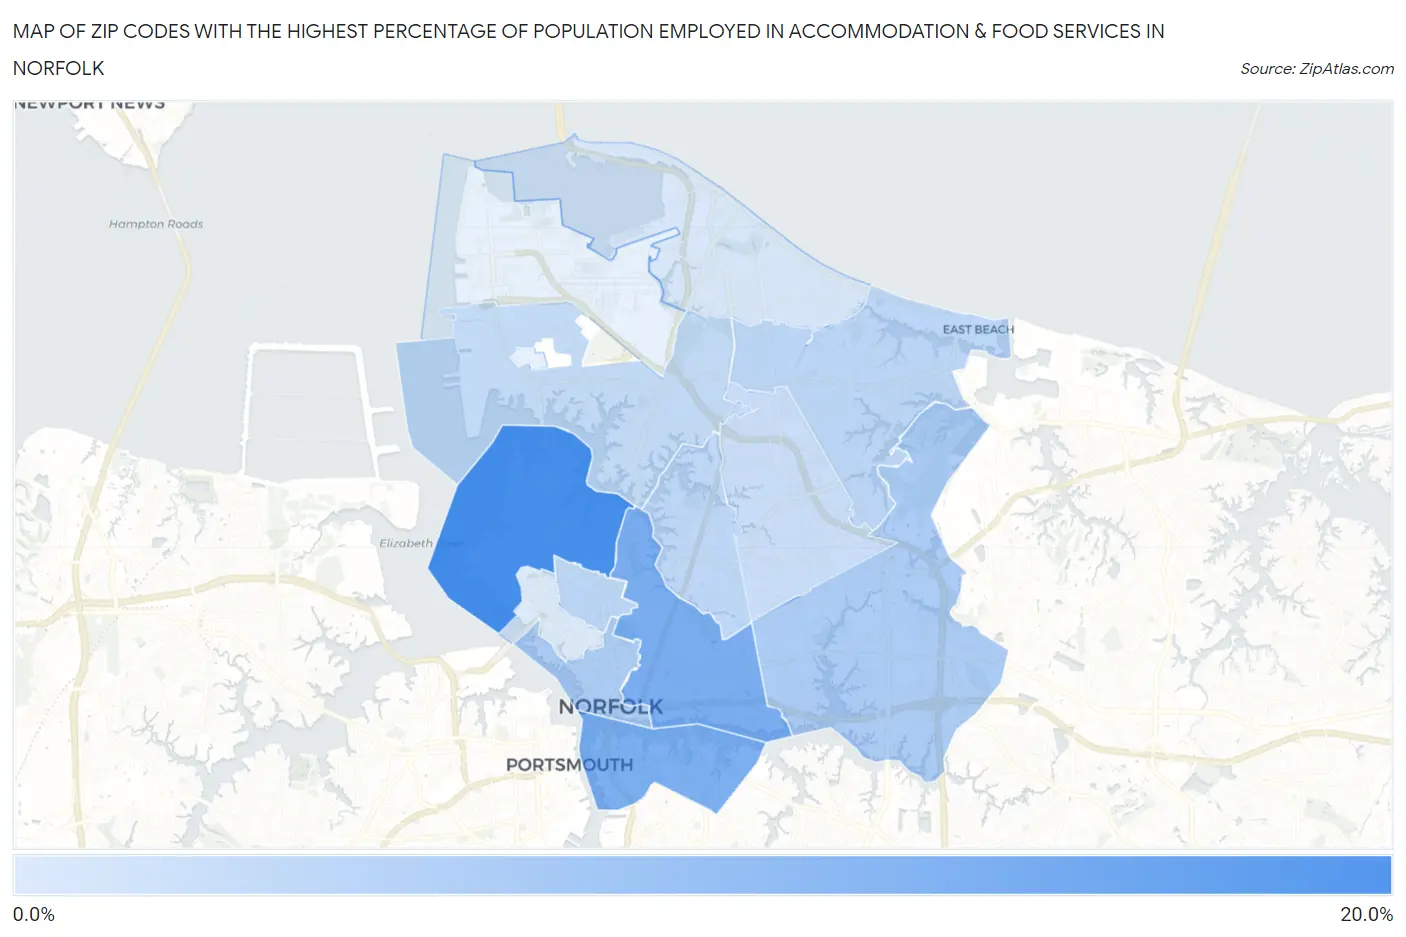
Map of Zip Codes with the Highest Percentage of Population Employed in Accommodation & Food Services in Norfolk

0.0%
20.0%
Zip Codes with the Highest Percentage of Population Employed in Accommodation & Food Services in Norfolk Map

Zip Codes with the Highest Percentage of Population Employed in Accommodation & Food Services in Norfolk, VA

Zip Code % Employed vs State vs National
1.2350816.0%6.4%(+9.52)#456.9%(+9.08)#1,464
2.2350412.5%6.4%(+6.10)#686.9%(+5.66)#2,570
3.2352312.5%6.4%(+6.02)#706.9%(+5.58)#2,614
4.235109.4%6.4%(+2.97)#1336.9%(+2.53)#5,334
5.235029.3%6.4%(+2.86)#1396.9%(+2.42)#5,504
6.235188.3%6.4%(+1.89)#1796.9%(+1.45)#7,149
7.235178.3%6.4%(+1.83)#1856.9%(+1.39)#7,281
8.235098.1%6.4%(+1.69)#1896.9%(+1.25)#7,574
9.235057.8%6.4%(+1.39)#2086.9%(+0.952)#8,190
10.235137.5%6.4%(+1.08)#2276.9%(+0.641)#8,945
11.235036.7%6.4%(+0.218)#3016.9%(-0.222)#11,333
12.235076.3%6.4%(-0.121)#3276.9%(-0.561)#12,421

Common Questions

What are the Top 10 Zip Codes with the Highest Percentage of Population Employed in Accommodation & Food Services in Norfolk, VA?
Top 10 Zip Codes with the Highest Percentage of Population Employed in Accommodation & Food Services in Norfolk, VA are:
#1
16.0%
#2
12.5%
#3
12.5%
#4
9.4%
#5
9.3%
#6
8.3%
#7
8.3%
#8
8.1%
#9
7.8%
#10
7.5%
What zip code has the Highest Percentage of Population Employed in Accommodation & Food Services in Norfolk, VA?
23508 has the Highest Percentage of Population Employed in Accommodation & Food Services in Norfolk, VA with 16.0%.
What is the Percentage of Population Employed in Accommodation & Food Services in Norfolk, VA?
Percentage of Population Employed in Accommodation & Food Services in Norfolk is 9.2%.
What is the Percentage of Population Employed in Accommodation & Food Services in Virginia?
Percentage of Population Employed in Accommodation & Food Services in Virginia is 6.4%.
What is the Percentage of Population Employed in Accommodation & Food Services in the United States?
Percentage of Population Employed in Accommodation & Food Services in the United States is 6.9%.