Zip Codes with the Highest Percentage of Population Employed in Agriculture, Fishing & Hunting in Richmond, TX
RELATED REPORTS & OPTIONS
Agriculture, Fishing & Hunting
Richmond
Compare Zip Codes
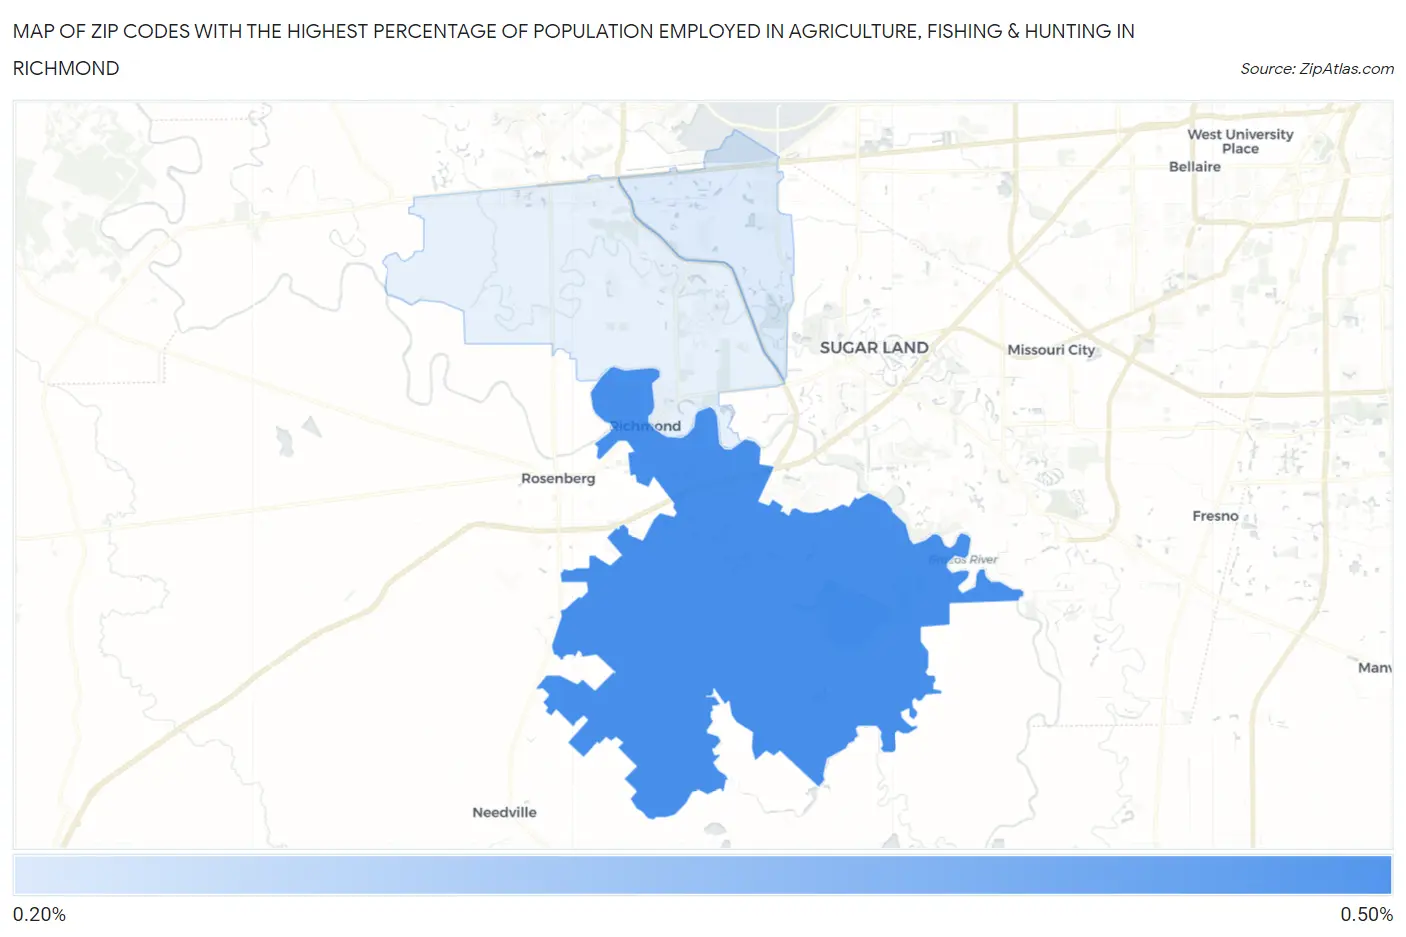
Map of Zip Codes with the Highest Percentage of Population Employed in Agriculture, Fishing & Hunting in Richmond
0.22%
0.44%
Zip Codes with the Highest Percentage of Population Employed in Agriculture, Fishing & Hunting in Richmond, TX
| Zip Code | % Employed | vs State | vs National | |
| 1. | 77469 | 0.44% | 0.75%(-0.311)#1,072 | 1.2%(-0.759)#19,789 |
| 2. | 77407 | 0.22% | 0.75%(-0.532)#1,218 | 1.2%(-0.980)#22,110 |
1
Common Questions
What are the Top Zip Codes with the Highest Percentage of Population Employed in Agriculture, Fishing & Hunting in Richmond, TX?
Top Zip Codes with the Highest Percentage of Population Employed in Agriculture, Fishing & Hunting in Richmond, TX are:
What zip code has the Highest Percentage of Population Employed in Agriculture, Fishing & Hunting in Richmond, TX?
77469 has the Highest Percentage of Population Employed in Agriculture, Fishing & Hunting in Richmond, TX with 0.44%.
What is the Percentage of Population Employed in Agriculture, Fishing & Hunting in Richmond, TX?
Percentage of Population Employed in Agriculture, Fishing & Hunting in Richmond is 0.85%.
What is the Percentage of Population Employed in Agriculture, Fishing & Hunting in Texas?
Percentage of Population Employed in Agriculture, Fishing & Hunting in Texas is 0.75%.
What is the Percentage of Population Employed in Agriculture, Fishing & Hunting in the United States?
Percentage of Population Employed in Agriculture, Fishing & Hunting in the United States is 1.2%.