Zip Codes with the Highest Percentage of Population with a Degree in Visual and Performing Arts in Richmond, TX
RELATED REPORTS & OPTIONS
Visual and Performing Arts
Richmond
Compare Zip Codes
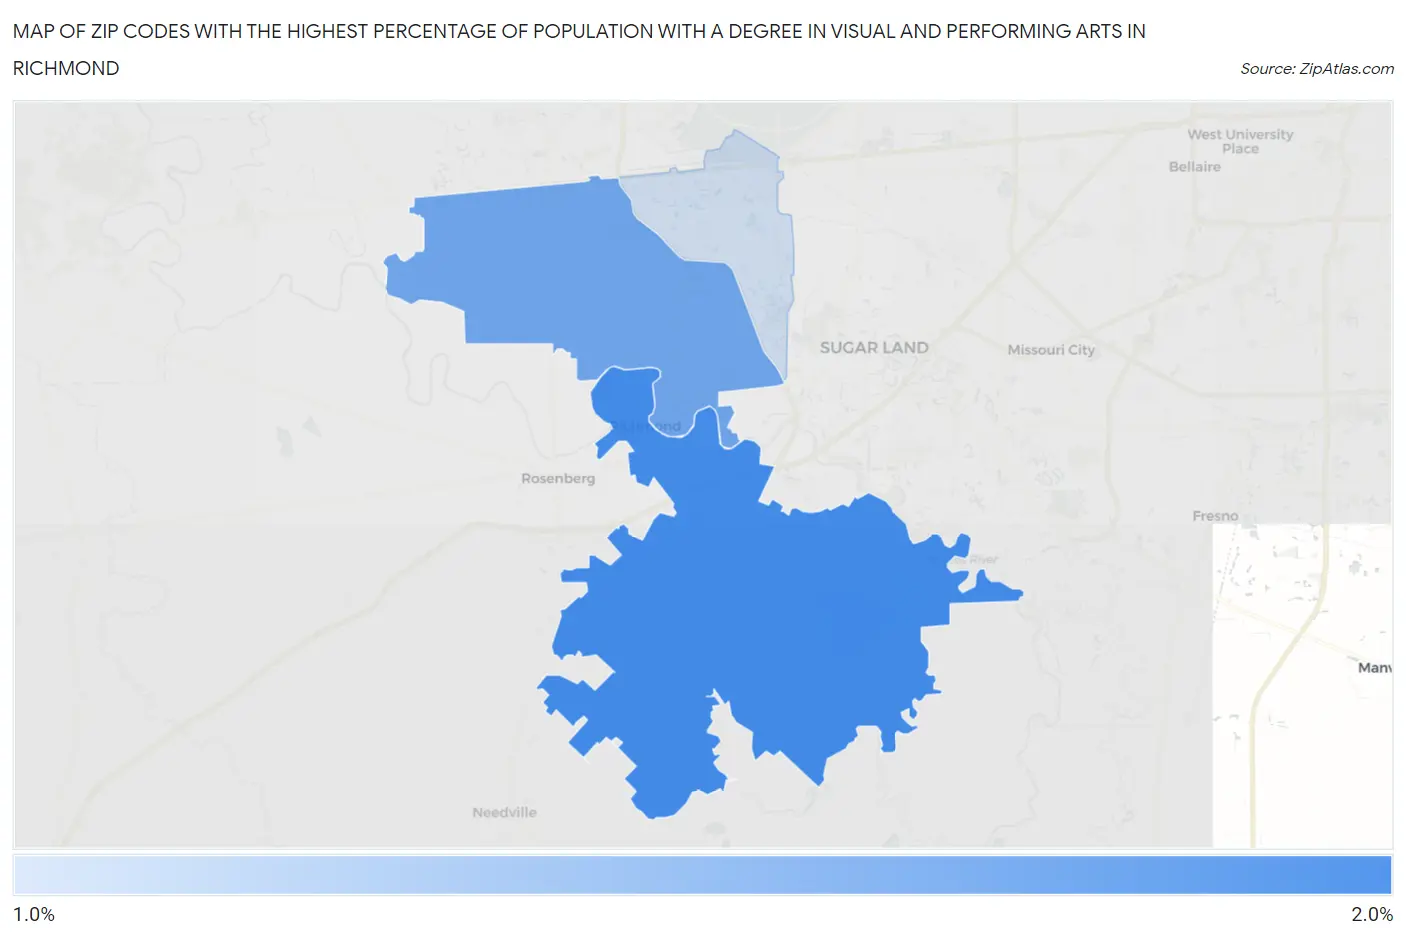
Map of Zip Codes with the Highest Percentage of Population with a Degree in Visual and Performing Arts in Richmond
1.1%
1.6%
Zip Codes with the Highest Percentage of Population with a Degree in Visual and Performing Arts in Richmond, TX
| Zip Code | % Graduates | vs State | vs National | |
| 1. | 77469 | 1.6% | 3.2%(-1.56)#959 | 4.3%(-2.61)#17,680 |
| 2. | 77406 | 1.5% | 3.2%(-1.74)#1,002 | 4.3%(-2.78)#18,261 |
| 3. | 77407 | 1.1% | 3.2%(-2.11)#1,082 | 4.3%(-3.15)#19,379 |
1
Common Questions
What are the Top Zip Codes with the Highest Percentage of Population with a Degree in Visual and Performing Arts in Richmond, TX?
Top Zip Codes with the Highest Percentage of Population with a Degree in Visual and Performing Arts in Richmond, TX are:
What zip code has the Highest Percentage of Population with a Degree in Visual and Performing Arts in Richmond, TX?
77469 has the Highest Percentage of Population with a Degree in Visual and Performing Arts in Richmond, TX with 1.6%.
What is the Percentage of Population with a Degree in Visual and Performing Arts in Richmond, TX?
Percentage of Population with a Degree in Visual and Performing Arts in Richmond is 0.51%.
What is the Percentage of Population with a Degree in Visual and Performing Arts in Texas?
Percentage of Population with a Degree in Visual and Performing Arts in Texas is 3.2%.
What is the Percentage of Population with a Degree in Visual and Performing Arts in the United States?
Percentage of Population with a Degree in Visual and Performing Arts in the United States is 4.3%.