Zip Codes with the Highest Percentage of Population Employed in Professional & Scientific Services in Mission, TX
RELATED REPORTS & OPTIONS
Professional & Scientific Services
Mission
Compare Zip Codes
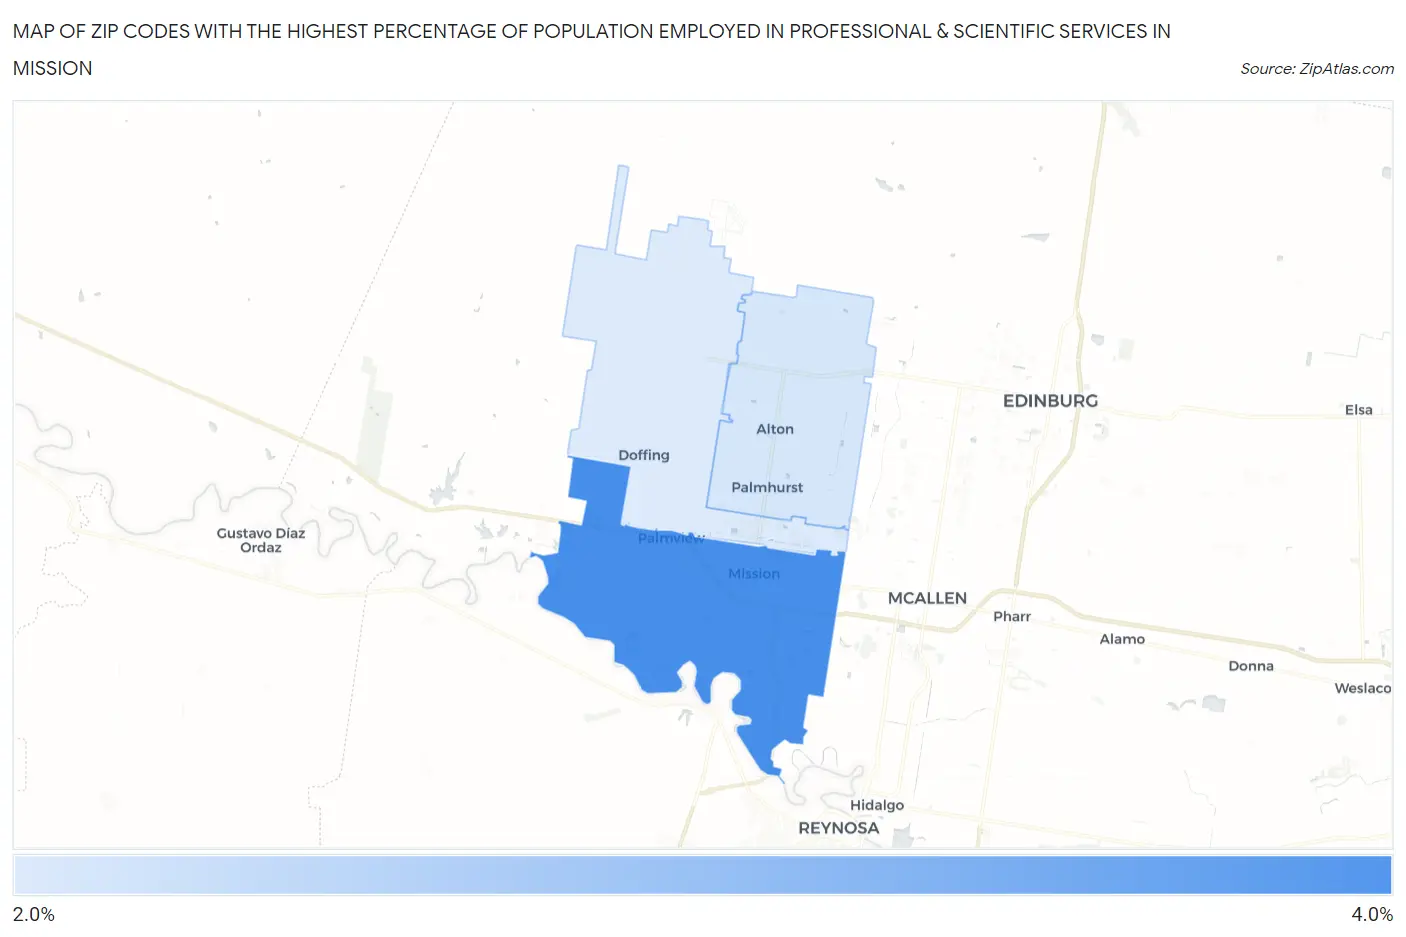
Map of Zip Codes with the Highest Percentage of Population Employed in Professional & Scientific Services in Mission
2.2%
3.4%
Zip Codes with the Highest Percentage of Population Employed in Professional & Scientific Services in Mission, TX
| Zip Code | % Employed | vs State | vs National | |
| 1. | 78572 | 3.4% | 7.6%(-4.22)#1,017 | 7.8%(-4.47)#17,132 |
| 2. | 78573 | 2.3% | 7.6%(-5.30)#1,239 | 7.8%(-5.55)#20,902 |
| 3. | 78574 | 2.2% | 7.6%(-5.35)#1,249 | 7.8%(-5.60)#21,076 |
1
Common Questions
What are the Top Zip Codes with the Highest Percentage of Population Employed in Professional & Scientific Services in Mission, TX?
Top Zip Codes with the Highest Percentage of Population Employed in Professional & Scientific Services in Mission, TX are:
What zip code has the Highest Percentage of Population Employed in Professional & Scientific Services in Mission, TX?
78572 has the Highest Percentage of Population Employed in Professional & Scientific Services in Mission, TX with 3.4%.
What is the Percentage of Population Employed in Professional & Scientific Services in Mission, TX?
Percentage of Population Employed in Professional & Scientific Services in Mission is 3.2%.
What is the Percentage of Population Employed in Professional & Scientific Services in Texas?
Percentage of Population Employed in Professional & Scientific Services in Texas is 7.6%.
What is the Percentage of Population Employed in Professional & Scientific Services in the United States?
Percentage of Population Employed in Professional & Scientific Services in the United States is 7.8%.