Zip Codes with the Highest Percentage of Households with Income Above $100,000 in Mission, TX
RELATED REPORTS & OPTIONS
Household Income | $100k+
Mission
Compare Zip Codes
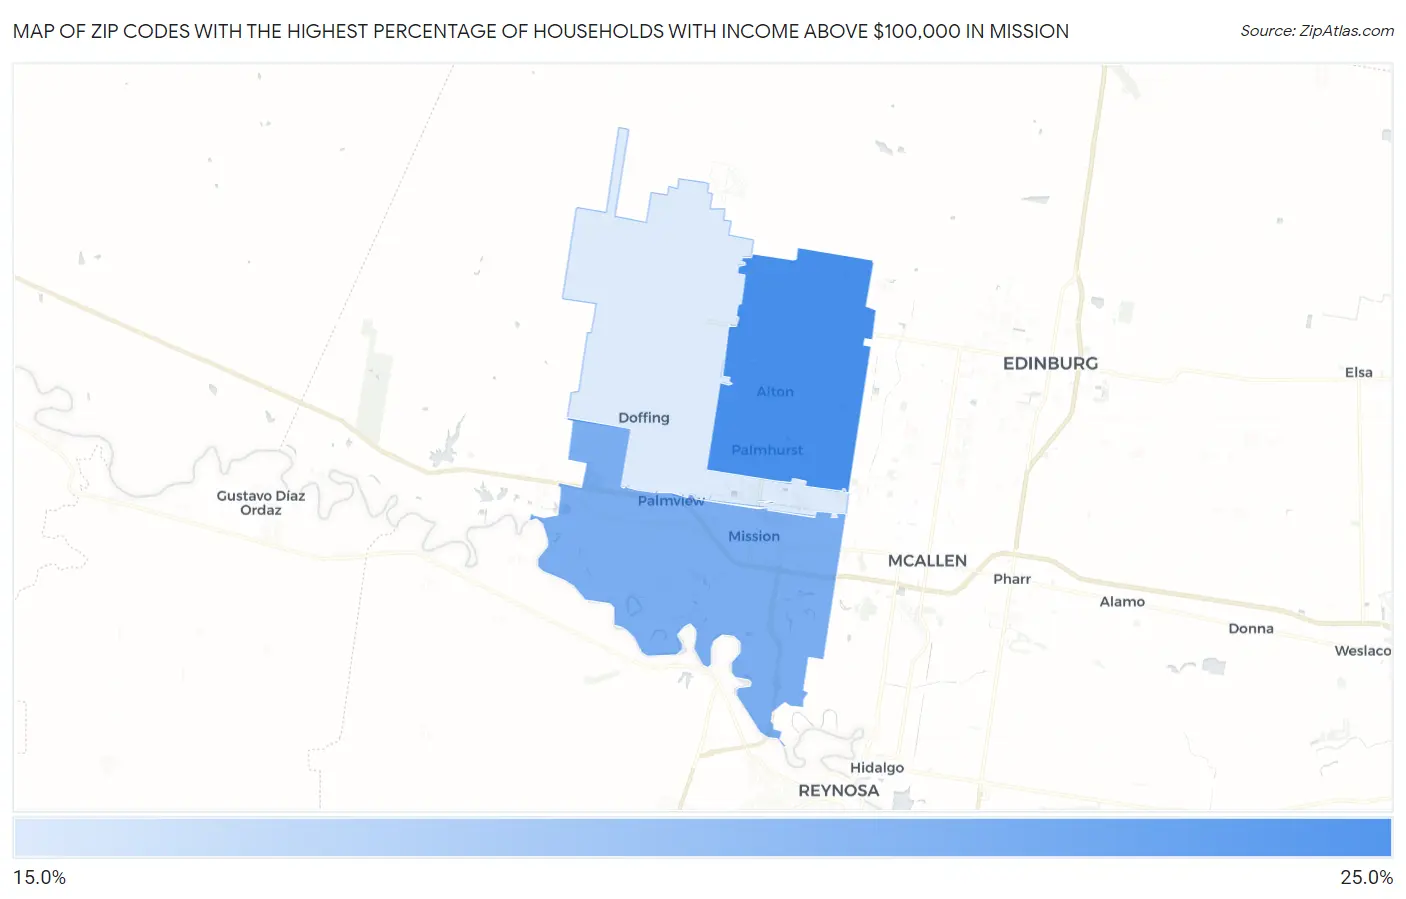
Map of Zip Codes with the Highest Percentage of Households with Income Above $100,000 in Mission
20.6%
22.1%
Zip Codes with the Highest Percentage of Households with Income Above $100,000 in Mission, TX
| Zip Code | Households with Income > $100k | vs State | vs National | |
| 1. | 78573 | 22.1% | 36.2%(-14.1)#1,283 | 37.3%(-15.2)#22,302 |
| 2. | 78572 | 21.6% | 36.2%(-14.6)#1,307 | 37.3%(-15.7)#22,709 |
| 3. | 78574 | 20.6% | 36.2%(-15.6)#1,378 | 37.3%(-16.7)#23,553 |
1
Common Questions
What are the Top Zip Codes with the Highest Percentage of Households with Income Above $100,000 in Mission, TX?
Top Zip Codes with the Highest Percentage of Households with Income Above $100,000 in Mission, TX are:
What zip code has the Highest Percentage of Households with Income Above $100,000 in Mission, TX?
78573 has the Highest Percentage of Households with Income Above $100,000 in Mission, TX with 22.1%.
What is the Percentage of Households with Income Above $100,000 in Mission, TX?
Percentage of Households with Income Above $100,000 in Mission is 27.5%.
What is the Percentage of Households with Income Above $100,000 in Texas?
Percentage of Households with Income Above $100,000 in Texas is 36.2%.
What is the Percentage of Households with Income Above $100,000 in the United States?
Percentage of Households with Income Above $100,000 in the United States is 37.3%.