Zip Codes with the Highest Percentage of Population Employed in Sales & Related in Henderson, TX
RELATED REPORTS & OPTIONS
Sales & Related
Henderson
Compare Zip Codes
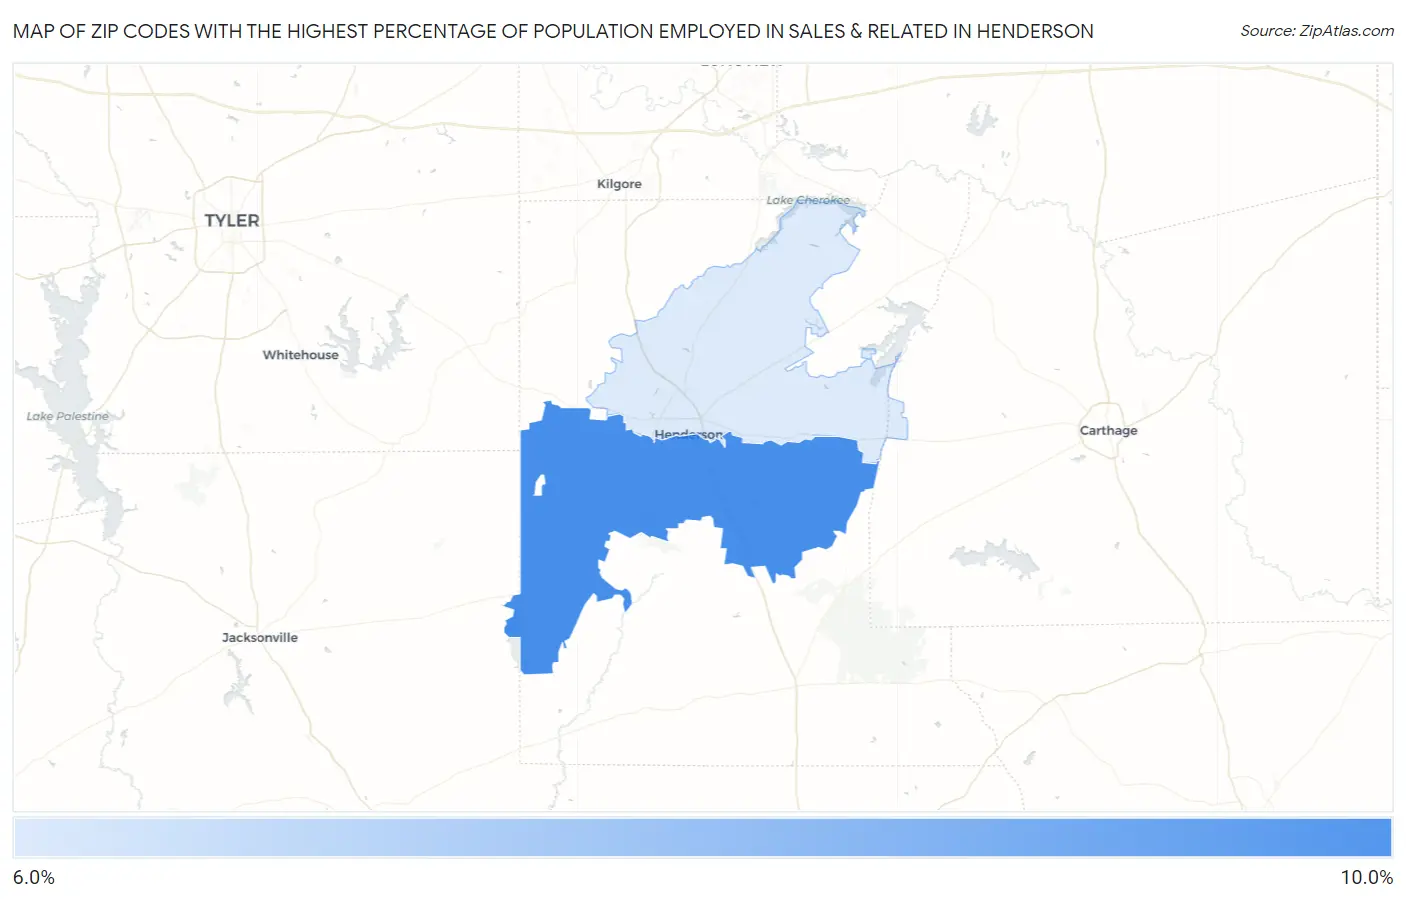
Map of Zip Codes with the Highest Percentage of Population Employed in Sales & Related in Henderson
6.7%
8.0%
Zip Codes with the Highest Percentage of Population Employed in Sales & Related in Henderson, TX
| Zip Code | % Employed | vs State | vs National | |
| 1. | 75654 | 8.0% | 10.2%(-2.21)#1,199 | 9.6%(-1.58)#17,990 |
| 2. | 75652 | 6.7% | 10.2%(-3.55)#1,370 | 9.6%(-2.92)#22,024 |
1
Common Questions
What are the Top Zip Codes with the Highest Percentage of Population Employed in Sales & Related in Henderson, TX?
Top Zip Codes with the Highest Percentage of Population Employed in Sales & Related in Henderson, TX are:
What zip code has the Highest Percentage of Population Employed in Sales & Related in Henderson, TX?
75654 has the Highest Percentage of Population Employed in Sales & Related in Henderson, TX with 8.0%.
What is the Percentage of Population Employed in Sales & Related in Henderson, TX?
Percentage of Population Employed in Sales & Related in Henderson is 7.6%.
What is the Percentage of Population Employed in Sales & Related in Texas?
Percentage of Population Employed in Sales & Related in Texas is 10.2%.
What is the Percentage of Population Employed in Sales & Related in the United States?
Percentage of Population Employed in Sales & Related in the United States is 9.6%.