Zip Codes with the Highest Percentage of Population with a Degree in Visual and Performing Arts in Warwick, RI
RELATED REPORTS & OPTIONS
Visual and Performing Arts
Warwick
Compare Zip Codes
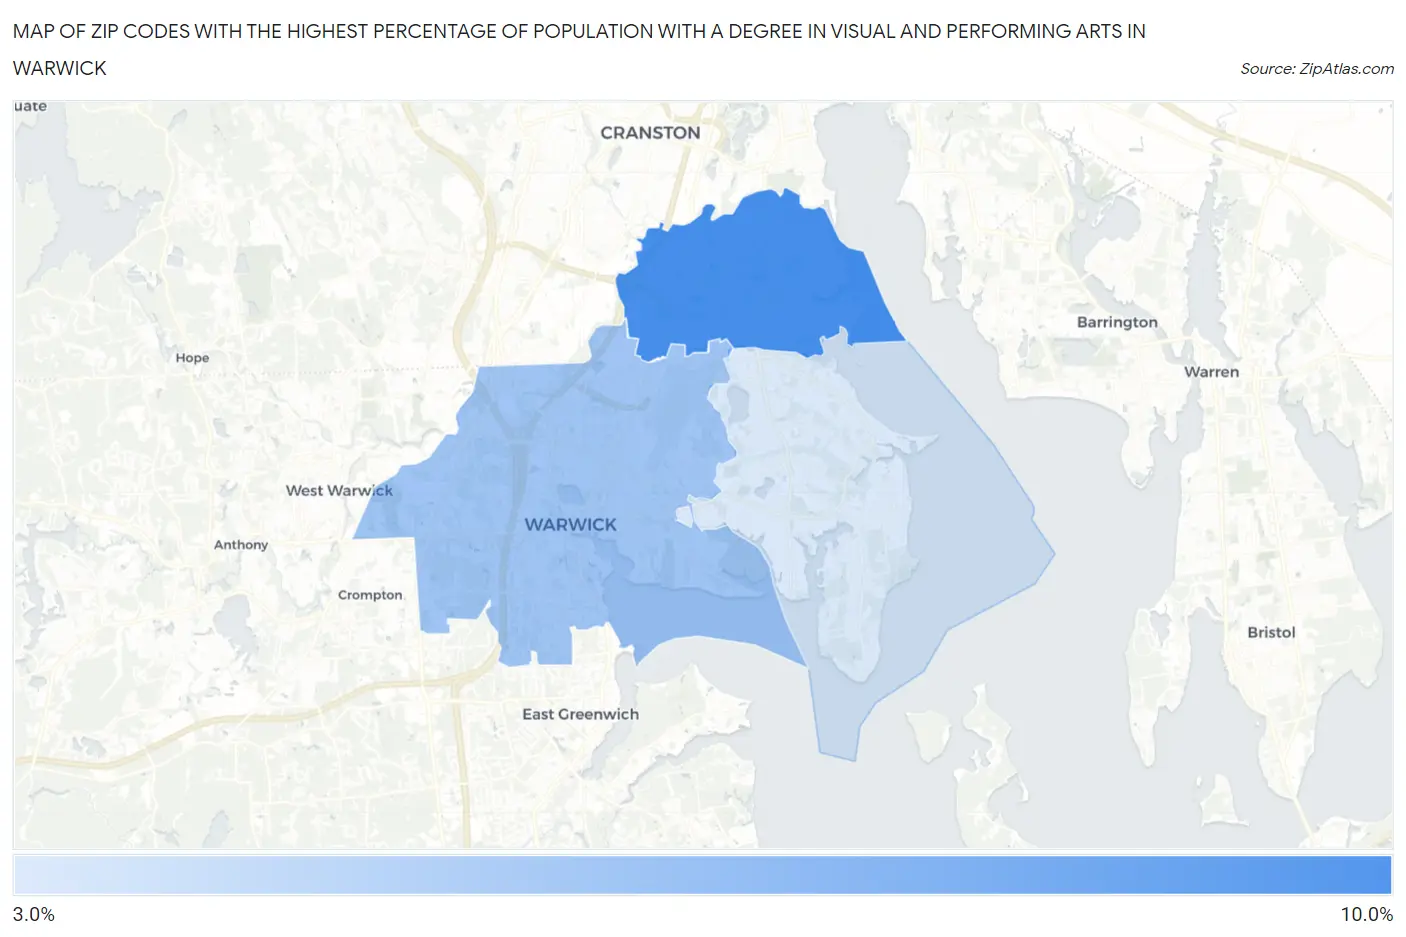
Map of Zip Codes with the Highest Percentage of Population with a Degree in Visual and Performing Arts in Warwick
3.3%
8.9%
Zip Codes with the Highest Percentage of Population with a Degree in Visual and Performing Arts in Warwick, RI
| Zip Code | % Graduates | vs State | vs National | |
| 1. | 02888 | 8.9% | 5.4%(+3.46)#14 | 4.3%(+4.61)#2,327 |
| 2. | 02886 | 5.5% | 5.4%(+0.069)#28 | 4.3%(+1.21)#5,744 |
| 3. | 02889 | 3.3% | 5.4%(-2.11)#55 | 4.3%(-0.963)#11,657 |
1
Common Questions
What are the Top Zip Codes with the Highest Percentage of Population with a Degree in Visual and Performing Arts in Warwick, RI?
Top Zip Codes with the Highest Percentage of Population with a Degree in Visual and Performing Arts in Warwick, RI are:
What zip code has the Highest Percentage of Population with a Degree in Visual and Performing Arts in Warwick, RI?
02888 has the Highest Percentage of Population with a Degree in Visual and Performing Arts in Warwick, RI with 8.9%.
What is the Percentage of Population with a Degree in Visual and Performing Arts in Warwick, RI?
Percentage of Population with a Degree in Visual and Performing Arts in Warwick is 5.3%.
What is the Percentage of Population with a Degree in Visual and Performing Arts in Rhode Island?
Percentage of Population with a Degree in Visual and Performing Arts in Rhode Island is 5.4%.
What is the Percentage of Population with a Degree in Visual and Performing Arts in the United States?
Percentage of Population with a Degree in Visual and Performing Arts in the United States is 4.3%.