Zip Codes with the Highest Percentage of Population Employed in Office & Administration in Warwick, RI
RELATED REPORTS & OPTIONS
Office & Administration
Warwick
Compare Zip Codes
Map of Zip Codes with the Highest Percentage of Population Employed in Office & Administration in Warwick
9.2%
13.1%
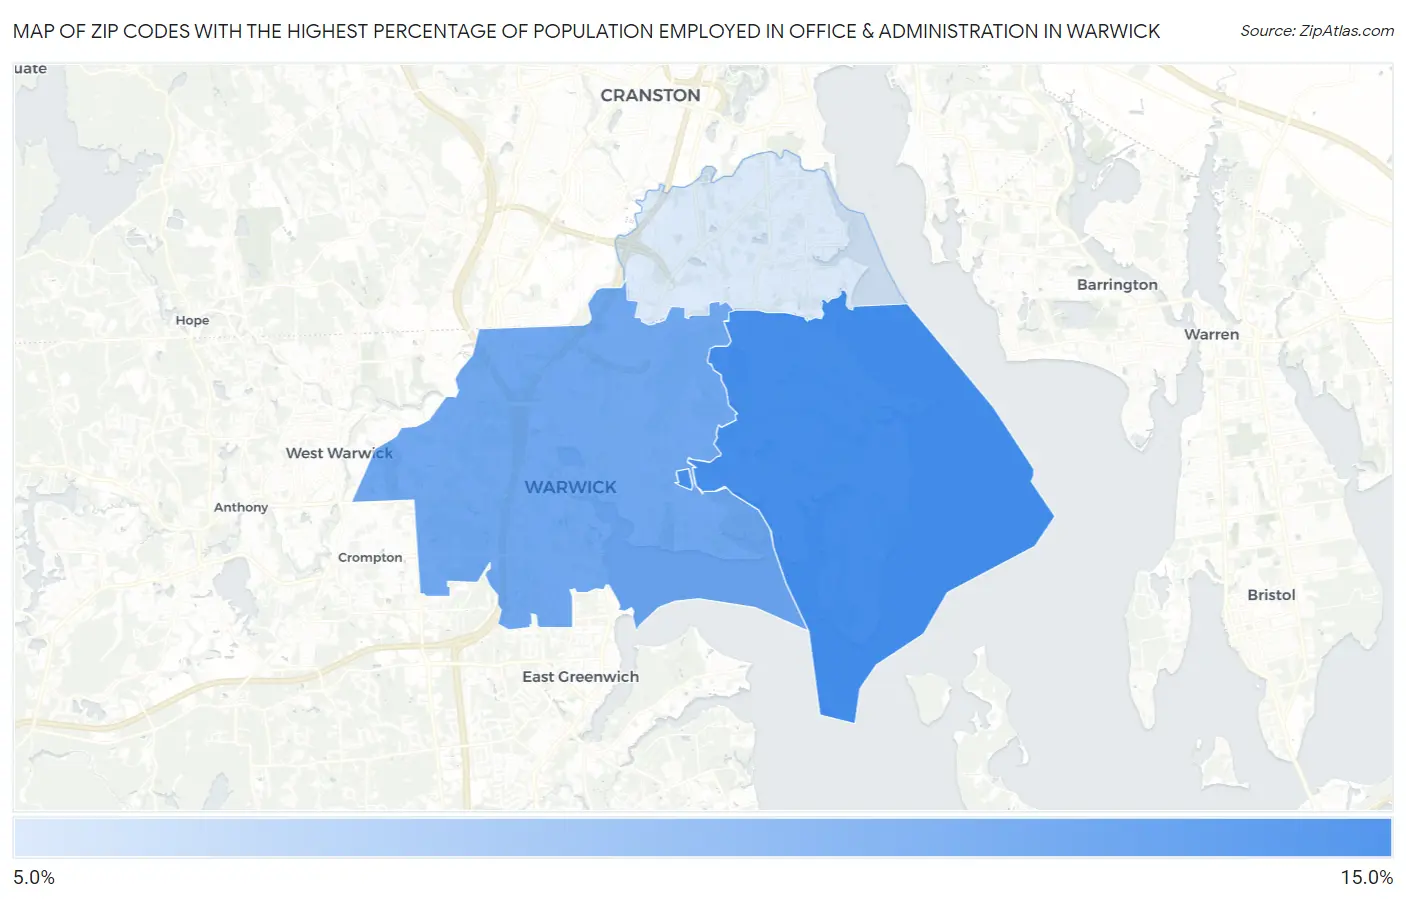
Zip Codes with the Highest Percentage of Population Employed in Office & Administration in Warwick, RI
| Zip Code | % Employed | vs State | vs National | |
| 1. | 02889 | 13.1% | 11.3%(+1.80)#21 | 10.9%(+2.27)#7,775 |
| 2. | 02886 | 12.0% | 11.3%(+0.698)#36 | 10.9%(+1.16)#10,671 |
| 3. | 02888 | 9.2% | 11.3%(-2.14)#55 | 10.9%(-1.68)#19,731 |
1
Common Questions
What are the Top Zip Codes with the Highest Percentage of Population Employed in Office & Administration in Warwick, RI?
Top Zip Codes with the Highest Percentage of Population Employed in Office & Administration in Warwick, RI are:
What zip code has the Highest Percentage of Population Employed in Office & Administration in Warwick, RI?
02889 has the Highest Percentage of Population Employed in Office & Administration in Warwick, RI with 13.1%.
What is the Percentage of Population Employed in Office & Administration in Warwick, RI?
Percentage of Population Employed in Office & Administration in Warwick is 11.4%.
What is the Percentage of Population Employed in Office & Administration in Rhode Island?
Percentage of Population Employed in Office & Administration in Rhode Island is 11.3%.
What is the Percentage of Population Employed in Office & Administration in the United States?
Percentage of Population Employed in Office & Administration in the United States is 10.9%.