Zip Codes with the Highest Percentage of Population Employed in Legal Services & Support in Warwick, RI
RELATED REPORTS & OPTIONS
Legal Services & Support
Warwick
Compare Zip Codes
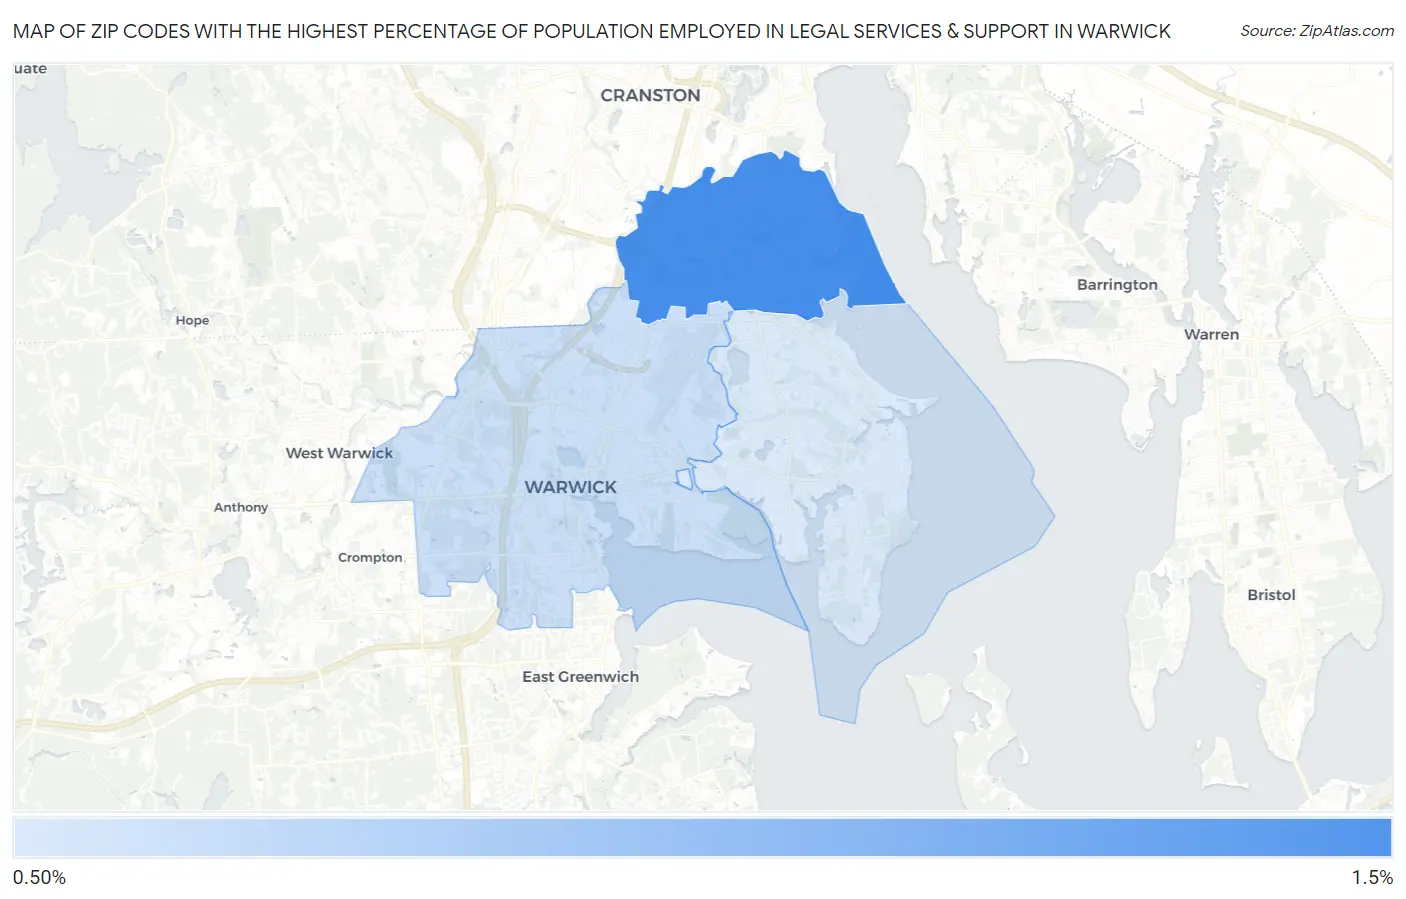
Map of Zip Codes with the Highest Percentage of Population Employed in Legal Services & Support in Warwick
0.97%
1.3%
Zip Codes with the Highest Percentage of Population Employed in Legal Services & Support in Warwick, RI
| Zip Code | % Employed | vs State | vs National | |
| 1. | 02888 | 1.3% | 1.2%(+0.145)#22 | 1.2%(+0.149)#5,773 |
| 2. | 02886 | 1.0% | 1.2%(-0.178)#32 | 1.2%(-0.174)#7,750 |
| 3. | 02889 | 0.97% | 1.2%(-0.214)#34 | 1.2%(-0.210)#8,004 |
1
Common Questions
What are the Top Zip Codes with the Highest Percentage of Population Employed in Legal Services & Support in Warwick, RI?
Top Zip Codes with the Highest Percentage of Population Employed in Legal Services & Support in Warwick, RI are:
What zip code has the Highest Percentage of Population Employed in Legal Services & Support in Warwick, RI?
02888 has the Highest Percentage of Population Employed in Legal Services & Support in Warwick, RI with 1.3%.
What is the Percentage of Population Employed in Legal Services & Support in Warwick, RI?
Percentage of Population Employed in Legal Services & Support in Warwick is 1.2%.
What is the Percentage of Population Employed in Legal Services & Support in Rhode Island?
Percentage of Population Employed in Legal Services & Support in Rhode Island is 1.2%.
What is the Percentage of Population Employed in Legal Services & Support in the United States?
Percentage of Population Employed in Legal Services & Support in the United States is 1.2%.