Zip Codes with the Highest Percentage of Population Employed in Architecture & Engineering in Warwick, RI
RELATED REPORTS & OPTIONS
Architecture & Engineering
Warwick
Compare Zip Codes
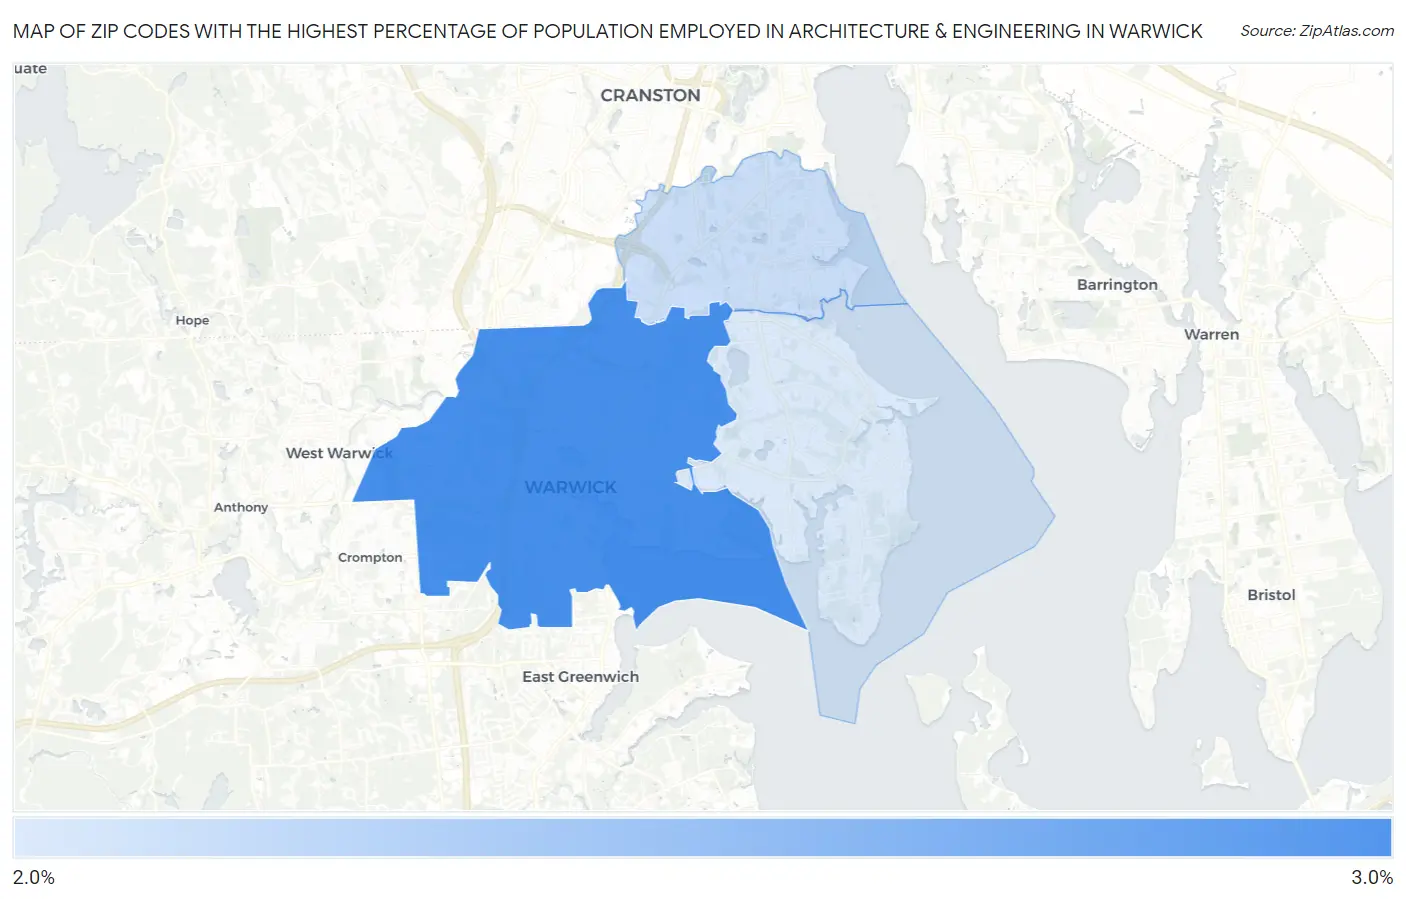
Map of Zip Codes with the Highest Percentage of Population Employed in Architecture & Engineering in Warwick
2.2%
3.0%
Zip Codes with the Highest Percentage of Population Employed in Architecture & Engineering in Warwick, RI
| Zip Code | % Employed | vs State | vs National | |
| 1. | 02886 | 3.0% | 2.2%(+0.805)#20 | 2.1%(+0.844)#5,076 |
| 2. | 02888 | 2.3% | 2.2%(+0.101)#33 | 2.1%(+0.140)#8,004 |
| 3. | 02889 | 2.2% | 2.2%(+0.000)#35 | 2.1%(+0.039)#8,539 |
1
Common Questions
What are the Top Zip Codes with the Highest Percentage of Population Employed in Architecture & Engineering in Warwick, RI?
Top Zip Codes with the Highest Percentage of Population Employed in Architecture & Engineering in Warwick, RI are:
What zip code has the Highest Percentage of Population Employed in Architecture & Engineering in Warwick, RI?
02886 has the Highest Percentage of Population Employed in Architecture & Engineering in Warwick, RI with 3.0%.
What is the Percentage of Population Employed in Architecture & Engineering in Warwick, RI?
Percentage of Population Employed in Architecture & Engineering in Warwick is 2.5%.
What is the Percentage of Population Employed in Architecture & Engineering in Rhode Island?
Percentage of Population Employed in Architecture & Engineering in Rhode Island is 2.2%.
What is the Percentage of Population Employed in Architecture & Engineering in the United States?
Percentage of Population Employed in Architecture & Engineering in the United States is 2.1%.